


Effective manipulation of the fatty profile in pork products to provide human health benefits of α-linolenic acid (18 : 3n-3) and n-3 highly unsaturated fatty acids (HUFA) (n-3 HUFA and all n-3 PUFA minus 18 : 3n-3) requires a quantitative understanding of the n-3 PUFA metabolism in growing pigs. Most mammalian species, including pigs, are able to metabolise 18 : 3n-3 to n-3 HUFA such as EPA (20 : 5n-3), docosapentaenoic acid (22 : 5n-3) and DHA (22 : 6n-3)( Reference Li, Kaplan and Hachey 1 ). Previous studies in pigs have shown that the inclusion of 18 : 3n-3 from either ground flaxseed (FS, up to 15 % in the diet)( Reference Romans, Johnson and Wulf 2 ) or rapeseed oil (10 % in the diet)( Reference Miller, Shackelford and Hayden 3 ) in pre-slaughter diets represents an effective means to incorporate significant amounts of 18 : 3n-3 and n-3 HUFA in edible pork tissues, generating value-added healthy pork products for consumers without compromising pork quality( Reference Romans, Johnson and Wulf 2 , Reference Miller, Shackelford and Hayden 3 ). In the study of Romans et al. ( Reference Romans, Johnson and Wulf 2 ), it was observed that the incremental retention of 18 : 3n-3 and n-3 HUFA in pork tissues decreased over time when feeding a 15 % FS-containing diet, suggesting that the retention efficiency (RE) of 18 : 3n-3 and apparent conversion (AC) of 18 : 3n-3 to n-3 HUFA decrease with the duration of feeding 18 : 3n-3. However, the RE and AC of 18 : 3n-3 on a whole-body basis in growing pigs consuming diets containing FS (as a source of 18 : 3n-3) are still unknown. Furthermore, and in contrast to other species( Reference Leyton, Drury and Crawford 4 , Reference Fu and Sinclair 5 ), the oxidation rate of 18 : 3n-3, determined directly using isotope tracers, has not been quantified in growing pigs; instead, mass balance calculations based on serial slaughter measurements have been used to indirectly estimate the oxidation (i.e. disappearance) of 18 : 3n-3 in growing pigs( Reference Bazinet, McMillan and Seebaransingh 6 ). Therefore, the objective of the present study was to determine the whole-body RE of 18 : 3n-3 and its AC to n-3 HUFA in growing pigs fed a 10 % FS-containing diet, utilising the mass balance approach and serial slaughter observations. In addition, the oxidation of 18 : 3n-3 was measured directly by feeding a single-bolus dose of uniformly labelled 13C-18 : 3n-3 (U-13C-18 : 3n-3).
Materials and methods
Experimental animals, diets and general design
The University of Guelph Animal Care Committee approved the present experimental protocol. A total of fifteen healthy purebred Yorkshire growing gilts from eight litters and weighing approximately 20 kg body weight (BW; 8–9 weeks old) were obtained from the University of Guelph Arkell Swine Research Station herd and transported to the animal metabolism unit. Before the start of the experiment, the pigs were fed ad libitum a maize, wheat and soyabean meal-based pig starter diet, which was assumed to be low in n-3 PUFA content. Upon arrival to the unit, the pigs were housed individually in fully slatted floor pens in an environmentally controlled room and were given free access to water via nipple drinkers( Reference Martínez-Ramírez, Jeaurond and de Lange 7 ). The pigs were fed ad libitum a FS-free adaptation diet (Table 1) until weighing approximately 27 kg BW (Fig. 1). At the start of the experiment, four pigs from four different litters (initial BW 27·7 (se 0·96) kg) were slaughtered to determine the initial chemical and physical body composition. The remaining pigs were randomly assigned to one of two different slaughter groups on day 15 (n 6; days 0–15) and day 30 (n 5; days 15–30). The pigs were fed a maize, wheat and soyabean meal-based diet containing 10 % ground FS (15·5 g/kg of 18 : 3n-3). Throughout the experiment, the pigs were fed three times a day (07.00, 15.00 and 23.00 hours); feed intake levels were fixed at 70 % of the voluntary daily digestible energy intake according to the National Research Council( Reference Nutrient 8 ). The pigs were weighed weekly to monitor growth rate and to adjust feeding levels. Feed refusals were collected daily and weighed weekly to calculate the actual feed intakes. In a subsample of four pigs, the oxidation of 18 : 3n-3 was measured directly based on feeding a single-bolus dose of U-13C-18 : 3n-3 on day 12 after the start of the FS-containing diet feeding period.
Ingredient composition and nutrient content of the adaptation diet (fed between 20 and 27 kg body weight (BW)) and the grower diet (fed for 30 d between 28 and 45 kg BW)
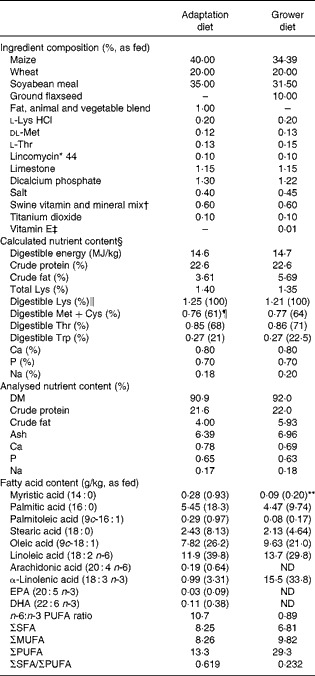
ND, not detected.
* Supplied 44 mg/kg diet as lincomycin hydrochloride.
† Supplemented by kg of diet: vitamin A, 1.2 mg; vitamin D3, 10 μg; vitamin E, 16 mg; vitamin K, 1 mg; choline, 200 mg; pantothenic acid, 6 mg; riboflavin, 2 mg; folic acid, 0·8 mg; niacin, 10 mg; thiamin, 0·6 mg; vitamin B6, 0·6 mg; biotin, 0·08 mg; vitamin B12, 0·01 mg. Supplemented by kg of diet: Na, 1800 mg; Cu (from CuSO4), 15 mg; Zn (from ZnO), 100 mg; Fe (FeO), 100 mg; Mn (MnSO4), 20 mg; I (KI), 0·3 mg; Se (Na2SeO3), 0·3 mg.
‡ Concentration of vitamin E: 500 mg/g of product.
§ Based on the National Research Council( Reference Nutrient 8 ).
∥ Represents digestible standardised ileal digestibility.
¶ 100 × ratio to Lys.
** Values in parentheses are fatty acid profile, given as percentage of analysed fat content.
Schematic representation of the experimental design. Feed intake was fixed at 70 % of the voluntary feed intake based on the National Research Council( Reference Nutrient 8 ). On day 12, 10 mg of uniformly labelled 13C-18 : 3n-3 (U-13C-18 : 3n-3)/kg body weight (BW) were fed to the pigs to measure the direct oxidation (Ox) of 18 : 3n-3. For serial slaughter (SS) and whole-body fatty acid composition analyses, the pigs were killed on days 0, 15 and 30. n represents the number of observations.
The experimental diets were prepared at the University of Guelph feed mill. The experimental diets were formulated to contain equal amounts of n-6 and n-3 PUFA. The dietary contents of essential nutrients, including standardised ileal digestible indispensable amino acids, exceeded the requirements of pigs with high lean gain potentials( Reference Nutrient 8 ). The diets were fed in a pelleted form. Titanium oxide was added to the experimental diets as an indigestible marker for the assessment of nutrient digestibility.
Serial slaughter procedure and nutrient analysis
The pigs were killed using sodium pentobarbital on day 0, 15 or 30 after the start of the FS-containing diet feeding period. On days 15 and 30, representative digesta samples were quickly collected from the last metre of the distal ileum, by gently squeezing the isolated gut segment, and frozen at − 80°C until later analyses( Reference Jeaurond, Rademacher and Pluske 9 ). Slaughter procedures and carcass and viscera management for determining the chemical and physical body composition have been outlined in detail previously( Reference Martínez-Ramírez, Jeaurond and de Lange 7 ). In short, at slaughter, blood was collected quantitatively, weighed and discarded, whereas visceral organs (kidneys, spleen, liver, lungs and heart) were weighed individually. The full gastrointestinal tract was weighed, emptied and re-weighed to determine gut fill. Thereafter, the individual segments of the gastrointestinal tract (stomach and small and large intestines) were weighed. The empty gastrointestinal tract was added to the visceral organs, placed in a plastic bag and frozen at − 20°C. The empty carcass (which included head, feet, hair, nails and skin) was weighed, placed in plastic bags and stored at − 20°C.
Sample preparation and chemical analysis were carried out according to previous procedures in our laboratory( Reference Martínez-Ramírez, Jeaurond and de Lange 7 ). Freeze-dried subsamples (carcass, pooled viscera and diets) were ground and homogenised with liquid N2 in a conventional coffee grinder. Duplicate samples were then used to determine analytical DM content according to the Association of Official Analytical Chemists( 10 ). N content in the diet, carcass, viscera and digesta samples was determined in triplicate utilising an induction furnace and thermal conductivity N2 analyser (Leco FP-528; Leco Corporation). Ash content was determined in duplicate according to the Association of Official Analytical Chemists( 10 ). Crude fat content in the carcass, viscera, diet and digesta samples was determined by extraction using a fat analyser (ANKOM XT20, method 2; Ankom Technology Corporation) without prior acid hydrolysis. Freeze-dried digesta and diet samples were analysed for titanium dioxide content using standard procedures( 10 ).
For fatty acid (FA) analyses, lipids were extracted from the carcass, viscera, diet and digesta samples using chloroform–methanol (2:1, v/v) extraction according to the method of Bligh & Dyer( Reference Bligh and Dyer 11 ) in the presence of the internal standard, tridecanoic acid (13 : 0; Nu Chek Prep). During sample processing, efforts were made to minimise 13 : 0 losses; aliquots of the lipid extract were dried under N2 and subjected to trans-methylation using boron trichloride in methanol and heating the methylation tubes in a boiling water-bath( Reference Morrison and Smith 12 ). The resulting FA methyl esters were analysed on a Varian 3400 gas–liquid chromatograph (Varian) equipped with a 60 m DB-23 capillary column (0·32 mm internal diameter). GLC and FA peak identification procedures have been described previously( Reference Stark and Holub 13 ).
Direct measurement of α-linolenic acid oxidation
Uniformly labelled 13C-α-linolenic acid ethyl ester (>99 atom%) was purchased from Cambridge Isotopes Laboratories, Inc. This preparation contained 95 % of U-13C-18 : 3n-3 and other FA made up the remainder. The oxidation of U-13C-18 : 3n-3 was measured in the pigs when their BW was approximately 35 kg in an open-circuit respiration calorimetry system( Reference Möhn, Fuller and Ball 14 ), with real-time measurements of air flow and CO2 content in the exhaust air (Qubit Systems). Fresh air was drawn through the system at approximately 50 l/min using a large air pump (Model 0523-101Q-G588EDX; Gast Manufacturing, Inc.). Exhaust air flow was quantified using an air mass flow meter (Alicat M series; Alicat Scientific, Inc.). After quantification with the air flow meter, the air flow was split into two streams. The small stream (about 1 % of total air flow and controlled by air pump Model F360 and air flow meter Model P650) was used for real-time measurements of CO2 content (Model S155, Infrared CO2 Analyzer; Qubit Systems) at 5 s intervals (C407 – Data Acquisition Software version 2.0; Qubit Systems) and for trapping CO2 for subsequent isotopic enrichment analyses. A drierite column was inserted into the small air stream for the removal of water just before the measurement of CO2 content. From the small air stream, CO2 was trapped quantitatively over 0·5 h periods for 24 h in a solution of 1 m-NaOH. Background CO2 samples were collected before feeding the tracer dose between − 0·5 and 0 h. Containers containing trapped CO2 and NaOH were immediately re-vacuumed and stored at room temperature until later analysis.
To determine the recovery of CO2 in the respiration system, CO2 was released from a 2·24 m-NaHCO3 solution (1 litre) that was placed in the empty respiration system. The quantity of NaHCO3 was chosen to simulate CO2 output from a 50 kg BW pig over a 2 h period and consuming approximately 1·8 kg of feed daily. To release CO2, HCl was continuously infused into the solution at 265 ml/h for 2 h. The recovery of CO2 was 96·9 (se 1·01) % (n 6), demonstrating complete CO2 recovery.
The pigs were fasted overnight (9 h) before the direct measurement of 18 : 3n-3 oxidation. The pigs were placed in the calorimetry system at approximately 07.00 hours, and measurements were started the next day at approximately 07.00 hours. At 07.30 hours, the pigs were fed a single-bolus dose of U-13C-18 : 3n-3 (10 mg/kg BW) mixed with 200 g of the experimental diet. The pigs consumed the tracer-containing feed within 5 min; thereafter, the remainder of the morning meal was given. At 6, 12 and 18 h after the start of CO2 collection, CO2 analysers were calibrated using a two-point calibration using a custom-made span gas containing 4 % CO2 and N2 (grade 4·8 representing 0 % CO2) (BOC gas).
Enrichment of
 $$CO_{2} $$
in the exhaust air samples was determined in duplicate for each 0·5 h period by continuous flow isotope ratio MS(
Reference Guiguer, Drimmie and Power
15
). The analyses were carried out at the Department of Earth Sciences, University of Waterloo (200 University Avenue West, Waterloo, ON, Canada N2L 3G1). The
$$CO_{2} $$
enrichment and whole-body CO2 excretion values were used to estimate the proportion of administered FA that was oxidised and excreted with breath as
$$CO_{2} $$
over 24 h(
Reference Möhn, Fuller and Ball
14
).
$$CO_{2} $$
in the exhaust air samples was determined in duplicate for each 0·5 h period by continuous flow isotope ratio MS(
Reference Guiguer, Drimmie and Power
15
). The analyses were carried out at the Department of Earth Sciences, University of Waterloo (200 University Avenue West, Waterloo, ON, Canada N2L 3G1). The
$$CO_{2} $$
enrichment and whole-body CO2 excretion values were used to estimate the proportion of administered FA that was oxidised and excreted with breath as
$$CO_{2} $$
over 24 h(
Reference Möhn, Fuller and Ball
14
).
Calculations and statistical analyses
The apparent ileal digestibility (AID) of the ingested crude fat, 18 : 3n-3 and linoleic acid (18 : 2n-6) was calculated as described elsewhere( Reference Nyachoti, de Lange and Schulze 16 ), and it is expressed as a percentage.
The RE of 18 : 3n-3 and 18 : 2n-6 were calculated as follows:
 $$FA\,RE\,(\%) = (FA\,retention/FA\,intake)\times 100, $$
where FA retention represents the difference between the final and initial whole-body 18 : 3n-3 and 18 : 2n-6 masses at defined stages of growth; FA intake for each individual FA was also calculated for defined stages of growth.
The AC of 18 : 3n-3 to n-3 HUFA was calculated as follows:
 $$AC\,of\,18:\,3 n \hyphen 3\hairsp to\,individual\, n \hyphen 3\hairsp HUFA\,(\%) = (\%) = \,((individual\, n \hyphen 3\hairsp HUFA\,retention - total\,individual\, n \hyphen 3\hairsp HUFA\,intake)/total\,18:3 n \hyphen 3\hairsp take))\times 100, $$
where individual n-3 HUFA retention represents the whole-body retention of 18 : 3n-3 intermediary products such as stearidonic acid (18 : 4n-3), eicosatrienoic acid (20 : 3n-3), eicosatetraenoic acid (20 : 4n-3), 20 : 5n-3, docosatetraenoic acid (22 : 4n-3), 22 : 5n-3 and 22 : 6n-3 at defined stages of growth. Similar calculations were used to estimate the AC of 18 : 2n-6 to individual n-6 HUFA (e.g. all n-6 PUFA minus 18 : 2n-6). The intakes of 18 : 3n-3 and 18 : 2n-6 were calculated for the two subsequent 15 d periods.
The calculated mean disappearance of 18 : 3n-3 (expressed as a proportion of 18 : 3n-3 intake), an indirect measure of oxidation, was calculated( Reference Möhn, Fuller and Ball 14 ) as follows:
 $$Disappearance\,of\,18\,:\,3 n \hyphen 3\,(\%) = (AID\,18\,:\,3 n \hyphen 3\hairsp intake - (RE\,18\,:\,3 n \hyphen 3 + AC\,of\ 18\,:\,3 n \hyphen 3\hairsp to\, n \hyphen 3\hairsp HUFA))/total\,18\,:\,3 n \hyphen 3\hairsp intake. $$
Direct oxidation of 18 : 3n-3 was calculated from the cumulative recovery of
$$CO_{2} $$
with CO2 in the exhaust air 24 h after feeding the tracer, and it is expressed as a proportion of the administered 13C dose from U-13C-18 : 3n-3. Cumulative recovery was calculated either directly from the air flow measurements and determined
$$CO_{2} $$
enrichment excess for each 0·5 h period or from the estimated cumulative
$$CO_{2} $$
recovery using alternative mathematical functions. No attempt was made to adjust values for the retention of
$$CO_{2} $$
within bicarbonate pools in the pigs' body and faecal and urinary losses.
To fit the hourly recovery of 13C in the expired air as a percentage of administered 13C, four mathematical functions were applied: γ( Reference Wood 17 ); Ali & Schaeffer( Reference Ali and Schaeffer 18 ); Wilmink( Reference Wilmink 19 ); Dijkstra et al. ( Reference Dijkstra, France and Dhanoa 20 ). Similarly, to fit the cumulative recovery of 13C in the expired air as a percentage of administered 13C, five alternative mathematical growth functions were applied: monomolecular; Gompertz; Richards; Michaelis–Menten; von Bertalanffy( Reference Lopez, France and Gerrits 21 – Reference Thornley and France 23 ). The Solver Module of Excel (Excel; Microsoft Corporation) was used for the optimisation of numerical algorithms( Reference Vedenov and Pesti 24 ). The model with the lowest values of Akaike's information criterion was considered the most appropriate model.
Cumulative FA intake and whole-body FA mass are expressed in g per pig. The various measures of FA utilisation were calculated using pigs as experimental units. For the various response variables, statistical analyses were carried out using ANOVA according to the MIXED procedure of SAS (version 9.2; SAS Institute, Inc.). The pigs were used as a random effect. The effect of litter (n 8) was first explored as a source of variation, but it was found to be not significant for the various response variables (P>0·10) and was therefore removed from the statistical model. Period effects on the RE and AC were assessed using the Tukey–Kramer honestly significant difference test. Linear and quadratic contrast analyses were carried out to assess changes in whole-body chemical components (protein, fat, ash and water) and whole-body FA over time. P< 0·05 was considered significant, whereas 0·05 < P< 0·10 was considered a trend and P>0·10 was considered non-significant.
Results
General observations, growth performance and body composition
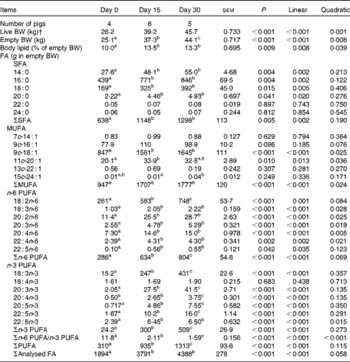
The analysed contents of protein, crude fat, Ca, P, Na, 18 : 3n-3 and 18 : 2n-6 and the 18 : 2n-6/18 : 3n-3 ratio in the experimental diets were similar to the anticipated values (Table 1), indicating that the diets were prepared properly. The pigs appeared to be healthy, readily consumed their feed allowances and did not exhibit abnormalities in behaviour. Similarly, no problems were encountered with the direct measurement of 18 : 3n-3 oxidation using the isotope tracer. Growth performance data (Table 2) can be considered typical for this relatively low level of feed intake( Reference Möhn, Gillis and Moughan 25 ). Growth rate and feed efficiency were similar between phase I and phase II (P>0·10), whereas daily feed intake increased with BW (P< 0·002) as expected.
Growth performance of pigs fed a grower diet containing 10 % ground flaxseed for 30 d*
BW, body weight.
* Pigs were fed restrictedly at 70 % of the voluntary daily digestible energy intake according to the National Research Council( Reference Nutrient 8 ). On day 15, six pigs were killed to determine chemical and physical body composition.
Across all the observations, the sum of chemical body constituents (protein, lipid, ash and water) contributed to 99·5 (se 0·41) % of empty BW (Table 3), confirming the adequacy of the sampling and analytical procedures. Across the slaughter BW, gut fill represented 5·03 (se 0·36) % of live BW. Empty BW and main physical and chemical body component masses increased linearly over time (P< 0·01). Relationships between body protein, body ash and body water masses were similar across the slaughter BW (P>0·10).
Chemical and physical body composition of growing pigs fed a grower diet containing 10 % ground flaxseed for 30 d
BW, body weight; PB, body protein; LB, body lipid; AB, body ash; WB, body water; PVisc, viscera protein mass; PCar, carcass protein mass; LVis, viscera lipid mass; LCar, carcass lipid mass.
a,b,cMean values with unlike superscript letters were significantly different (P< 0·05).
* Whole PB mass, expressed as a percentage of empty BW.
† Whole LB mass, expressed as a percentage of empty BW.
‡ Whole AB mass, expressed as a percentage of empty BW.
§ Whole WB mass, expressed as a percentage of empty BW.
Fatty acid mass, apparent ileal digestibility and apparent conversion
The whole-body content of individual FA including SFA, MUFA, n-3 and n-6 PUFA increased linearly over time (P< 0·01; Table 4). Time had no effect on the AID of FA and crude fat (P>0·10); across the two digesta sampling times, AID was 77 (se 3·60) % for crude fat, 78·2 (se 3·38) % for 18 : 2n-6 and 83·6 (se 2·24) % for 18 : 3n-3. Expressed as a proportion of intake, RE declined with time (days 0–15 v. days 15–30) for both 18 : 3n-3 (68·4 v. 52·6 %; P= 0·098) and 18 : 2n-6 (107 v. 53·2 %; P= 0·031). Similarly, the AC of 18 : 3n-3 to eicosatrienoic acid (20 : 3n-3; 7·51 v. 4·05 %), eicosatetraenoic acid (20 : 4n-3; 0·62 v. 0·31 %) and 22 : 6n-3 (1·16 v. − 0·004 %) was reduced over time (P< 0·05; Fig. 2), whereas that of 18 : 3n-3 to 20 : 5n-3 (1·22 v. 0·83 %; P= 0·141) and 22 : 5n-3 (2·52 v. 1·64 %; P= 0·110) did not change over time. The AC of 18 : 2n-6 to n-6 HUFA such as γ-linolenic acid (18 : 3n-6; 0·34 v. 0·05 %), eicosadienoic acid (20 : 2n-6; 4·66 v. 1·04 %), dihomo-γ-linolenic acid (20 : 3n-6; 0·74 v. 0·16 %), arachidonic acid (20 : 4n-6; 2·32 v. 0·18 %), adrenic acid (22 : 4n-6; 0·63 v. − 0·003 %) and n-6 docosapentaenoic acid (22 : 5n-6; 0·15 v. − 0·01 %) was reduced over time (P< 0·05; Fig. 3). Within the periods, total AC was higher for n-3 HUFA than for n-6 HUFA (13·1 v. 6·9 % and 8·8 v. 1·4 % for days 0–15 and 15–30, respectively; P< 0·01; Figs. 2 and 3).
Whole-body fatty acid (FA) mass in growing pigs fed a grower diet containing 10 % ground flaxseed for 30 d*
BW, body weight.
a,b,cMean values with unlike superscript letters were significantly different (P< 0·05).
* Pigs were fed a common diet for 30 d. Cumulative 18 : 2n-6 intakes for days 0–15, 15–30 and 0–30 were 299 (se 4·42), 302 (se 21·6) and 567 (se 16·4) g/pig, respectively, whereas cumulative 18 : 3n-3 intakes for days 0–15, 15–30 and 30 were 339 (se 5·01), 343 (se 24·5) and 643 (se 18·6) g/pig, respectively.
† Live BW.
Apparent conversion (AC) of α-linolenic acid to 18 : 4n-3, stearidonic acid; 20 : 3n-3, eicosatrienoic acid; 20 : 4n-3, eicosatetraenoic acid; 20 : 5n-3, EPA; 22 : 5n-3, docosapentaenoic acid; and 22 : 6n-3, DHA, during different time periods (days 0–15 (![]() ) and 15–30 (
) and 15–30 (![]() )) in growing gilts fed a grower diet containing 10 % ground flaxseed for 30 d. * Values were significantly different between days 0–15 and days 15–30 (P< 0·05).
)) in growing gilts fed a grower diet containing 10 % ground flaxseed for 30 d. * Values were significantly different between days 0–15 and days 15–30 (P< 0·05).
Apparent conversion (AC) of linoleic acid to 18 : 3n-6, γ-linoleic acid; 20 : 2n-6, eicosadienoic acid; 20 : 3n-6, dihomo-γ-linoleic acid; 20 : 4n-6, arachidonic acid; 22 : 4n-6, adrenic acid; and 22 : 5n-6, docosapentaenoic acid, during different time periods (days 0–15 (![]() ) and 15–30 (
) and 15–30 (![]() )) in growing gilts fed a grower diet containing 10 % ground flaxseed for 30 d. * Values were significantly different between days 0–15 and days 15–30 (P< 0·05).
)) in growing gilts fed a grower diet containing 10 % ground flaxseed for 30 d. * Values were significantly different between days 0–15 and days 15–30 (P< 0·05).
Oxidation and disappearance of α-linolenic acid
The appearance of
$$CO_{2} $$
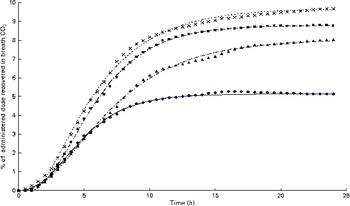
after feeding the single-bolus dose of U-13C-18 : 3n-3 is shown in Figs. 4 and 5 for each individual pig. The excretion of 13C in the expired air followed a similar pattern for all the pigs. The enrichment of 13C in the exhaust air (breath CO2) was detected 1 h after the administration of U-13C-18 : 3n-3 and was found to reach peak levels at 4·5 h (7·25 (se 0·95) % of the total 13C exhaled or 0·554 (se 0·06) % administered dose/h) and decrease to approximately half maximum levels by 9 h (3·08 (se 0·34) % of the total 13C exhaled or 0·247 (se 0·04) % administered dose/h). At 15 h, 95·2 (se 2·61) % of the 24 h cumulative expired 13C was recovered. Between 15 and 17 h, the enrichment of 13C in the exhaust air returned to baseline levels for all the pigs. Based on Akaike's information criterion (Table 5), the Dijkstra function was the best mathematical function to fit the hourly 13C recovery in the exhaust air (Fig. 4), whereas the Richards function was the most appropriate function to represent the cumulative recovery of 13C in the exhaust air as a function of time (Fig. 5). The estimated cumulative oxidation of U-13C-18 : 3n-3 according to the Richards, Gompertz, Michaelis–Menten, von Bertalanffy and monomolecular functions was 7·88 (se 0·97), 7·89 (se 0·98), 7·77 (se 0·95), 7·88 (se 0·98) and 7·67 (0·93) %, respectively, whereas the directly determined cumulative recovery of
$$CO_{2} $$
in the exhaust air 24 h after feeding the tracer was 7·91 (se 0·98) %, ranging from 5·14 to 9·68 % between the pigs.
Hourly 13C recovery in the exhaust air expressed as a proportion of the administered tracer dose of uniformly labelled 13C-α-linolenic acid 24 h immediately following the oral administration of a single bolus of the tracer to growing gilts that were fed a grower diet containing 10 % flaxseed (n 4). Oxidation study was conducted on day 12 of feeding the experimental diets. The Dijkstra(
Reference Dijkstra, France and Dhanoa
20
) function used to fit the present data set was as follows: Y= a× exp (k1 × (1 − exp { − k2 × t})/k2 − c× t), where ‘a’, ‘c’ and ‘t’ represent the theoretical initial
$$CO_{2} $$
production at time ‘0’, rate of disappearance of 13C in the exhaust air (per h) and time since the start of sample collection, respectively, whereas k1 and k2 represent the rate of 13C production and the decay parameter constant, respectively. ◆, Pig 03; ![]() , predicted 03; ■, Pig 10;
, predicted 03; ■, Pig 10; ![]() , predicted 10; ▲, Pig 02;
, predicted 10; ▲, Pig 02; ![]() , predicted 02;
, predicted 02; ![]() , Pig 06;
, Pig 06; ![]() , predicted 06.
, predicted 06.
Cumulative 13C recovery in the exhaust air expressed as a proportion of the administered tracer dose of uniformly labelled 13C-α-linolenic acid over 24 h following administration at hour 0 (n 4). Growing gilts were fed a grower diet containing 10 % flaxseed for 30 d. Oxidation study was conducted on day 12 of feeding the experimental diets. The Richards function used to fit the present data set was as follows: Y= A+(H− A)/(1+t× exp [ − B× { x − M }])(1/t), where ‘A’, ‘H’ and ‘B’ represents the initial 13C concentration, final 13C concentration and 13C production rate, whereas ‘t’ and ‘M’ are constants representing the asymptote of maximum 13C production and t of maximum production, respectively. ◆, Pig 03; ![]() , predicted Pig 03; ■, Pig 10;
, predicted Pig 03; ■, Pig 10; ![]() , predicted Pig 10; X, Pig 06;
, predicted Pig 10; X, Pig 06; ![]() , predicted Pig 06; ▲, Pig 02;
, predicted Pig 06; ▲, Pig 02; ![]() , predicted Pig 02. (A colour version of this figure can be found online at http://www.journals.cambridge.org/bjn).
, predicted Pig 02. (A colour version of this figure can be found online at http://www.journals.cambridge.org/bjn).
Mean square prediction error (MSPE)* and Akaike's information criterion (AIC)† values for alternative mathematical functions to represent either cumulative or hourly excretion of
$$CO_{2} $$
in the expired air following the ingestion of a bolus of uniformly labelled 13C-18 : 3n-3 (U-13C-18 : 3n-3) for individual pigs (Figs. 3 and 4)
* MSPE = residual sum of squares between the actual and estimated cumulative oxidation of 18 : 3n-3/number of observations within treatment.
† AIC = 2 × (number of parameters of function)+total observations within treatment × (Ln (residual sum of squares between the actual and estimated cumulative oxidation of 18 : 3n-3)).
Based on the mass balance approach, the calculated disappearance of 18 : 3n-3 tended to increase over time (2·0 v. 23·7 % of the available intake; P= 0·07). The calculated disappearance of 18 : 3n-3 over the entire 30 d period (8·81 (se 5·24) %) was similar to the value obtained with the direct oxidation method.
Discussion
The purpose of the present study was to determine changes over time in the RE of 18 : 3n-3 and its AC to 20 : 5n-3, 22 : 5n-3 and 22 : 6n-3 and intermediary n-3 HUFA metabolites on a whole-body basis in growing pigs fed a diet containing 10 % FS. Using the serial slaughter technique, measurements were made over two consecutive 15 d periods. Moreover, the oxidation of 18 : 3n-3 was determined using both a direct isotope method and a mass balance approach (e.g. calculated disappearance). In previous studies, the effect of feeding diets containing either 1·44 or 13·5 g/kg 18 : 3n-3 on whole-body RE was determined in weanling pigs (14 or 21 d old) raised in two environments (segregated and non-segregated early weaning) without determining the AC of 18 : 3n-3 to n-3 HUFA( Reference Bazinet, McMillan and Seebaransingh 6 ). Similarly, Kloareg et al. ( Reference Kloareg, Noblet and van Milgen 26 ) determined the RE of 18 : 3n-3 and its AC to n-3 HUFA in pigs weighing between 90 and 150 kg BW and consuming a diet containing 1·5 g/kg 18 : 3n-3. In these two studies, the AID of 18 : 3n-3 was not determined.
The design of the present experiment is in contrast to that of human studies in which no attempt was made to adapt the subjects to the experimental diet before determining the oxidation of 18 : 3n-3( Reference Burdge, Jones and Wootton 27 – Reference Mayes, Burdge and Bingham 29 ). Moreover, in most of the human studies, breath is not sampled continuously( Reference Burdge, Jones and Wootton 27 , Reference Plourde, Chouinard-Watkins and Vandal 30 ). The latter can lead to inaccuracies in the estimates of CO2 production, and consequently FA oxidation, especially when breath is sampled during periods that are less than 5 min in duration and at 2 or 3 h intervals( Reference Mayes, Burdge and Bingham 29 , Reference Jones, Stolinski and Smith 31 ).
Retention efficiency and apparent conversion of n-3 fatty acids
In the present study, the whole-body masses of SFA, MUFA, and n-3 and n-6 PUFA increased over time in the pigs when fed modest amounts of FS. These results are in agreement with those of other studies in which the contents of SFA, MUFA, and n-3 and n-6 PUFA in specific pork tissues( Reference Romans, Johnson and Wulf 2 , Reference Riley, Enser and Nute 32 , Reference Corino, Musella and Mourot 33 ) or in pigs' whole body( Reference Bazinet, McMillan and Seebaransingh 6 ) increased over time when feeding FS-containing diets. In general, the whole-body masses of n-3 or n-6 PUFA are proportional to dietary n-3 or n-6 PUFA intakes.
In the present study, the RE of 18 : 3n-3 in pigs weighing between 27 and 45 kg BW was approximately 58·7 %, whereas Kloareg et al. ( Reference Kloareg, Noblet and van Milgen 26 ) observed that the RE of 18 : 3n-3 in pigs weighing between 90 and 150 kg BW was 42·4 %, much lower than that observed in the present study. In younger pigs aged between 14 and 49 d, Bazinet et al. ( Reference Bazinet, McMillan and Seebaransingh 6 ) observed that the RE of 18 : 3n-3 in pigs fed high 18 : 3n-3 (13·5 g/kg) content varied between 60 and 84 % of total 18 : 3n-3 intake. The latter suggests that the RE of n-3 PUFA decreases with age and BW. However, the dietary levels and cumulative intake of 18 : 3n-3, or whole-body 18 : 3n-3 content, may also affect the RE of n-3 PUFA. Additional observations are required to be made to further investigate this phenomenon in growing pigs.
In pigs weighing between 90 and 150 kg BW and consuming low amounts of 18 : 3n-3, the whole-body AC of 18 : 3n-3 to n-3 HUFA was found to be approximately 15 %( Reference Kloareg, Noblet and van Milgen 26 ), which was similar to that observed in the present study. In other studies, the AC of 18 : 3n-3 to n-3 HUFA in blood was measured using isotope tracers (14C-, 13C- or 2H-18 : 3n-3) and at one point in time; in these studies, the effects of the level and duration of feeding 18 : 3n-3 on the RE and AC of 18 : 3n-3 to n-3 HUFA over time were not explored( Reference Burdge, Jones and Wootton 27 , Reference Salem, Wegher and Mena 34 , Reference Igarashi, Ma and Chang 35 ). In the present study, the AC of 18 : 3n-3 to n-3 HUFA was largest for 20 : 3n-3, followed by 22 : 5n-3 and 20 : 5n-3, respectively. The latter is in contrast to that observed in human studies and, based on observations in blood, indicates that 20 : 5n-3 and then 22 : 5n-3 are the main HUFA derived from 18 : 3n-3( Reference Burdge, Jones and Wootton 27 , Reference Burdge and Wootton 36 ). It can be argued that n-3 PUFA profiles in blood do not represent whole-body n-3 PUFA profiles( Reference Abedin, Lien and Vingrys 37 – Reference Smink, van Baal and Hovenier 39 ); therefore, measurements based on blood n-3 PUFA profiles should be interpreted with caution.
Relatively few experiments( Reference Riley, Enser and Nute 32 , Reference Corino, Musella and Mourot 33 ) have reported increasing contents of 20 : 3n-3 in tissues after feeding FS to pigs. Moreover, to our knowledge, the AC of 18 : 3n-3 to 20 : 3n-3 in mammals has not been reported in the literature. In the present experiment, 20 : 3n-3 was the largest contributor to total n-3 HUFA in the body (8 %), which deserves further attention. Pigs fed FS appear unique in their ability to elongate 18 : 3n-3 to 20 : 3n-3 via chain elongation process, which differs from previous views of FA metabolism( Reference Sprecher, Luthria and Mohammed 40 ). In mammals, 20 : 3n-3 is generally considered to be an end product of n-3 PUFA metabolism, in part because its conversion to 20 : 4n-3 has not been unequivocally established( Reference Stubhaug, Tocher and Bell 41 ). Recently, it has been determined that Δ8-desaturate is rather active in mammals and is able to convert 20 : 3n-3 to 20 : 4n-3( Reference Park, Kothapalli and Lawrence 42 ), which in turn can enter the Sprecher pathway. This is of particular interest because 20 : 3n-3 can help to maintain an adequate supply of n-3 HUFA for physiologically active eicosanoids and different membrane structures. Whether this alternative pathway is highly active in pigs deserves further investigation.
In agreement with studies involving human subjects and small mammals( Reference Burdge, Jones and Wootton 27 , Reference Lin and Salem 43 ), the AC of 18 : 3n-3 to 22 : 6n-3 was low in the present study. It has been suggested that the initial conversion of 18 : 3n-3 to stearidonic acid (18 : 4n-3) by the action of Δ6-desaturase and the conversion of 20 : 4n-3 to 20 : 5n-3 by the action of Δ5-desaturase are the two main rate-limiting reactions in the Sprecher pathway( Reference Sprecher, Luthria and Mohammed 40 ). However, based on feeding 18 : 4n-3 and 20 : 5n-3 to human subjects, it has been shown that the concentrations of both 20 : 5n-3 and 22 : 5n-3 in plasma phospholipids can be increased and that no significant change occurs in the concentration of 22 : 6n-3( Reference James, Ursin and Cleand 44 , Reference Harris, Lemke and Hansen 45 ). The latter suggests that the main constraint for the appearance of 22 : 6n-3 occurs after the synthesis of 22 : 5n-3, which supports the lower content of 22 : 6n-3 than of 22 : 5n-3 in body fat in the present experiment. These results suggest that the potential rate-limiting reactions, involving the conversion of 22 : 5n-3 to 22 : 6n-3, might be found in the last steps of the pathway and in the conversion via the intermediary tetracosapentaenoic acid (24 : 5n-3). This is consistent with the observation that 22 : 6n-3 cannot be synthesised from 22 : 5n-3 in the heart of rats, due to the absence of elongase-2 expression, which is critical for the conversion of 22 : 5n-3 to 24 : 5n-3( Reference Igarashi, Zhan and Luo 46 ). While elongase-5, which elongates FA that are sixteen to twenty-two carbons long, is regulated by PPAR (PPARα), elongase-2 is regulated by sterol regulatory element-binding protein-1( Reference Igarashi, Zhan and Luo 46 ). These two different genetic control mechanisms might explain the tissue-selective conversion of 18 : 3n-3 to 22 : 6n-3 and other n-3 PUFA metabolites.
The observed reduction in the AC of 18 : 3n-3 to n-3 HUFA with the duration of feeding 18 : 3n-3 has not been fully explored. Matsuzaka et al. ( Reference Matsuzaka, Shimano and Yahagi 47 ) demonstrated that the expression of Δ6-desaturase and Δ5-desaturase mRNA in rat hepatocytes, controlled by sterol regulatory element-binding protein-1, decreased over time in the presence of 18 : 2n-6; similar but smaller effects were observed in the presence of 20 : 5n-3, 22 : 5n-3 or 22 : 6n-3, whereas feeding a fat-free diet, stearic acid or oleic acid did not affect the expression of these desaturases. The latter suggests that feeding 18 : 2n-6 or 18 : 3n-3 might, over time, reduce the AC of 18 : 3n-3 to n-3 HUFA and that n-3 HUFA, in turn, can down-regulate the expression of Δ6-desaturase, Δ5-desaturase and elongase-2. This is consistent with the observed reduction over time in the AC of both 18 : 3n-3 and LA to their metabolites in the present study.
According to Sprecher et al. ( Reference Sprecher, Luthria and Mohammed 40 ), n-3 and n-6 FA share a common pathway for their elongation and desaturation, implying interdependence of the metabolism of these two PUFA groups. In the present experiment, equal amounts of n-3 and n-6 PUFA were included in the diets, which resulted in higher rates of AC of n-3 PUFA than of n-6 PUFA. Similar results were obtained by others( Reference Lin and Salem 43 , Reference Holman 48 ). In the present study, 18 : 3n-3 appears to be a stronger suppressor of n-6 HUFA conversion than 18 : 2n-6 is of n-3 HUFA conversion.
Oxidation of α-linolenic acid
In the present study, the direct measurement of oxidation, using isotope tracers, and the mass balance approach (calculated disappearance, indirect means to estimate oxidation) yielded very similar estimates of 18 : 3n-3 oxidation, which suggests that both methods may be suitable to assess the oxidation of 18 : 3n-3 in growing pigs.
The appearance of 13C in the exhaust air, and thus oxidation of 18 : 3n-3, followed similar patterns when compared with those observed in human studies(
Reference McCloy, Ryan and Pencharz
28
,
Reference Mayes, Burdge and Bingham
29
,
Reference Jones, Stolinski and Smith
31
). In the present study, several alternative mathematical functions were used to fit the patterns of hourly and actual cumulative
$$CO_{2} $$
excretion following the oral administration of a bolus dose of U-13C-18 : 3n-3. A detailed discussion of the biological meaning of parameters in these mathematical functions has been published elsewhere(
Reference Dijkstra, France and Dhanoa
20
–
Reference Kebreab, Schulin-Zeuthen and Lopez
22
,
Reference Silvestre, Petim-Batista and Colaco
49
). Based on Akaike's information criterion, the Dijkstra function was the best mathematical function to fit the hourly 13C recovery in the exhaust air (Fig. 4). Because of the complexity of the data set, the γ, Wilmink and Ali–Schaeffer functions were not sufficiently flexible to represent the hourly recovery of
$$CO_{2} $$
. Furthermore, various growth functions accurately fit the cumulative recovery of
$$CO_{2} $$
(Fig. 5 and Table 5). Although the estimated cumulative oxidation of 18 : 3n-3 was identical for the Richards, Gompertz and von Bertalanffy functions, Akaike's information criterion values indicated that the Richards and von Bertalanffy functions were the most suitable mathematical functions to represent the actual cumulative oxidation pattern observed in the present study (Fig. 5). These results indicate that the estimated cumulative oxidation of 18 : 3n-3, using the mathematical models, compared quite closely to the actual cumulative oxidation of 18 : 3n-3. Modelling patterns of hourly and actual cumulative
$$CO_{2} $$
excretion will help us to assess the dynamics of 18 : 3n-3 oxidation in growing pigs and can provide an accurate estimate of the partitioning of 18 : 3n-3 towards oxidation.
The observed oxidation of 18 : 3n-3 appears to be lower in the present study (approximately 8 %) when compared with observations in other mammalian species, including adult humans( Reference McCloy, Ryan and Pencharz 28 , Reference Burdge and Wootton 36 , Reference De Lany, Windhauser and Champagne 50 ). In human studies( Reference Burdge, Jones and Wootton 27 , Reference Burdge and Wootton 36 ), the oxidation of 18 : 3n-3 accounts for 20–38 % of the administrated tracer dose during 24 h. The oxidation of 18 : 3n-3 in guinea pigs was found to be approximately 40 %( Reference Fu and Sinclair 5 ), whereas in rats it was found to range between 60 and 78 % of the administrated dose( Reference Leyton, Drury and Crawford 4 , Reference Lin and Salem 43 ). Differences among studies might be related to inherent factors such as age of subjects, adaptation to the experimental diet, sex, body composition and rates of body fat gain( Reference Molnár and Schitz 51 – Reference Westerterp, Smeets and Lejeune 54 ). These highly variable results highlight the need to better understand animal and dietary factors that influence 18 : 3n-3 utilisation in growing pigs and other species. Moreover, the experimental methodology should also be considered carefully, including between-animal variability and analytical procedures to quantify FA contents in diets and animal tissues. Using deuterated palmitic acid as an indicator of FA oxidation, Westerterp et al. ( Reference Westerterp, Smeets and Lejeune 54 ) determined that the oxidation of dietary fat was inversely related to body fatness (r − 0·66). As growing pigs have a higher capacity for lipid deposition ( < 200 g/d)( Reference Bazinet, McMillan and Seebaransingh 6 ) and body fatness (13·5 % of body fatness; Table 3) than adult humans, the lower oxidation rate of 18 : 3n-3, observed in the present experiment, appears to be consistent with the results of Westerterp et al. ( Reference Westerterp, Smeets and Lejeune 54 ).
In the present study, feeding 15·5 g/kg of 18 : 3n-3 to pigs during a 30 d period induced increasing rates of oxidation of 18 : 3n-3 over time. To our knowledge, quantitative information concerning the increasing rates of oxidation of 18 : 3n-3 with age is not available for either pigs or humans. Data on the incorporation of 18 : 3n-3 in select tissues of pigs fed 15 % FS for 7, 15, 21 and 28 d before slaughter at 136 kg BW appear consistent with the findings of the present study( Reference Romans, Johnson and Wulf 2 ). In the present study, it was observed that the incorporation of 18 : 3n-3 in pork loin was quite efficient during the first 2 weeks of feeding FS; thereafter, the incremental incorporation of 18 : 3n-3 diminished, suggesting that the oxidation of n-3 PUFA increases over time or increases with increasing whole-body n-3 PUFA content. The latter is an important nutritional phenomenon that has not been fully explored in both animal and human studies. It appears that when feeding constant increased dietary levels of n-3 PUFA, and 18 : 3n-3 in particular, the oxidation of n-3 PUFA increases over time. Whether there is a particular time period during pigs' development when the RE and AC of 18 : 3n-3 to n-3 HUFA are more efficient, as well as the effect of whole-body FA composition on the RE and AC of 18 : 3n-3, remains to be explored further.
In conclusion, on a whole-body basis, the RE and AC of dietary 18 : 3n-3 to n-3 HUFA decreases with the duration of feeding a diet containing 15·5 g/kg of 18 : 3n-3 to growing pigs with a low initial whole-body n-3 PUFA content. Direct measures of 18 : 3n-3 oxidation (7·91 % of tracer dose; based on feeding a single bolus of labelled 18 : 3n-3) and indirect estimates of 18 : 3n-3 oxidation (8·81 % disappearance of intake; based on mass balance) yield similar values; these values are lower in pigs when compared with those in other mammalian species. Feeding modest amounts of 18 : 3n-3 leads to a significant increase in the content of 20 : 5n-3, 22 : 5n-3 and 22 : 6n-3 in the pigs' body, thus providing health benefits to n-3 PUFA-enriched pork consumers. Pigs appear to be unique in that they elongate and store 20 : 3n-3, an intermediate between 18 : 3n-3 and 20 : 5n-3, which deserves to be explored further.
Acknowledgements
The authors thank J. Zhu, D. T. Woods, G. Vandervoort, A. Rakhshandeh, M. Hansel and L. Trouten-Radford for providing technical assistance. They also thank Dr B. Holub (emeritus professor of the Department of Human Health and Nutritional Sciences, University of Guelph) for contributing to the discussions and interpretation of the results.
The present study was supported by the Ontario Ministry of Agriculture Food and Rural Affairs, Ontario Pork, and NSERC. The funders had no role in the design, analysis of the data, and interpretation of the findings of the study or in the writing of this article.
The authors' contributions are as follows: H. R. M.-R. and C. F. M. d. L. conducted the experiment and had the primary responsibility of the final content of the manuscript; J. P. C. assisted in the modelling part of the manuscript; A. K. S. and J. L. A. were responsible for teaching the use of the calorimetric equipment; C. F. M. d. L chaired all the meetings; all the authors contributed to the manuscript concept and result interpretation, wrote parts of the draft version, critically revised the manuscript, and read and approved the final version.
H. R. M.-R. is a postdoctoral fellow from the University of Guelph and C. F. M. d. L., J. P. C. and J. L. A. are professors at the Department of Animal and Poultry Science of the University of Guelph. H. R. M.-R. and C. F. M. d. L. received reimbursement for their travel and accommodation costs incurred attending the related meetings.
The authors declare that they have no conflicts of interest to declare.


