

Introduction
Tissues in the gastrointestinal tract (GIT) wall (GIW) have a relatively high metabolic activity compared with other body tissues. This activity becomes apparent as a much higher contribution of the GIT to total heat production by the animal than the contribution of the GIT to total body weight (Huntington & Reynolds, Reference Huntington and Reynolds1987). Compared with protein in skeletal muscle, the fractional protein synthesis rate (FPSR) and rate of protein degradation in the GIT is far higher (Nieto & Lobley, Reference Nieto, Lobley, Lobley, White and MacRae1999). Therefore, the supply of nutrients to the animal via the portal vein is determined to an important extent by the nutrient utilisation by the GIT in both ruminants and single-stomached animals. This implies that GIT metabolism affects the supply of individual nutrients to the peripheral organs of the animal.
The high rate of metabolic activity is accompanied by the utilisation of large quantities of nutrients. Nutrient supply from both the lumen of the GIT and from arterial blood shows large within-day fluctuations and depends on feeding strategy. Besides a nutritive role of the GIT, it also has an important function as a barrier and defence against damaging influences from the external environment of the animal. In addition, the presence of the endemic non-pathogenic microflora exerts an influence on the functioning of tissues in the GIW (Gaskins, Reference Gaskins and Ball2003). Consequently, the metabolic activity of the GIT is strongly related to the nutritional, the microbial as well as the health status of the animal. Finally, measurement of nutrient utilisation by the GIW is limited to nutrient fluxes in arterial and portal blood, reflecting whole GIT metabolism. However, such measurements do not provide quantitative information on the separate, highly specialised GIT compartments.
The aim of the present review is to present an overview of the basic characteristics and variation in nutrient utilisation by the GIW and to relate this to its physiological functions in farm animals. A rationale is given for a modelling approach to identify and quantify the mechanisms involved in the metabolic activity of the GIW. Although there is a strong interaction between metabolic activity of the GIW and the metabolic processes taking place in the lumen, the latter is not a main subject of the present review. Because nutrient fluxes in portal blood reveal not only the outcome of digestive processes but also that of the (regulation of) physiological functions and nutrient metabolism of the GIW, the present paper includes a review of in vivo observations of these fluxes.
A modelling approach of nutrient metabolism by the gastrointestinal tract
Modelling of nutrient utilisation by the GIT requires that the metabolic processes and physiological functions of this organ be represented explicitly. A modelling approach may aid in the compartmentalisation of factors and physiological mechanisms involved in variation of nutrient utilisation by the GIW.
Gastrointestinal tract compartmentalisation
There are several levels of organisation of the GIT (Fig. 1). First, there is a morphological compartmentalisation of the GIT, not only determined by anatomy but also by biochemical and physiological characteristics. This compartmentalisation is related to the type of digestion taking place in the lumen and the supporting functions of the GIT. For the present review, a distinction between stomach (and the reticulo-rumen in the case of ruminants), the small intestine (SI) and the large intestine (LI) is required. Second, the GIT is composed of several tissue or cell types with highly specialised functions (Fig. 2). Various compartments include: (1) epithelium that forms the barrier between the internal and external milieu of the animal and simultaneously executes the functions of transport and absorption of nutrients from the lumen to the blood; (2) enzyme-secreting cells; (3) mucus-secreting cells; (4) intra-epithelial lymphocytes and immune cells; (5) nervous system; (6) smooth muscle; (7) connective tissue between epithelia and smooth muscle layer. Third, a compartmentalisation can be made according to the individual metabolic functions which ensure a relatively constant intracellular environment and the integrity and optimal functioning of the tissues or cells. Functions that may be distinguished include active or facilitated transport of ions and nutrients, proliferation and breakdown of tissues and cells, and other functions for general cell maintenance. In addition, several productive functions can be distinguished, characterised by the synthesis of enzymes, mucus, immune secretions (for example, immunoglobulins), and cell components. Finally, there is a compartmentalisation on a biochemical level that distinguishes individual nutrients and biochemical pathways. This compartmentalisation involves nutrients utilised by the cells (glucose, acetate, propionate, butyrate, essential amino acids (EAA), non-essential amino acids (NEAA), and marginally long-chain fatty acids and TAG; Britton & Krehbiel, Reference Britton and Krehbiel1993), metabolites formed (for example, β-OH-butyrate, lactate), ATP and NADH as units of metabolic energy and reducing power, and respiratory gases (for example, O2, CO2).
Different levels of organisation in relation to representing nutrient metabolism by tissues of the gastrointestinal wall.

Schematic representation of distinct cell types in the intestinal mucosa (derived from Pabst & Rothkötter, Reference Pabst and Rothkötter1998).

Assumptions and simplifications
Models of nutrient metabolism in organs usually assume that the organ is composed of a single standard cell or tissue type, and energy costs for supporting tissues are lumped into a single maintenance value. This simplification seems justified if the metabolic activity of epithelia dominates the total nutrient utilisation by the GIW. If other tissue types become metabolically more important and vary with dietary or health status, a more detailed representation is required. In the present review, the concept of a standard GIW cell type is used to discuss nutrient metabolism by the GIW, with nutrient supply from the lumen and from arterial blood as driving variables. We consider the various physiological functions of the GIT as a response of these standard cell types, with a variety of nutritional, animal and environmental factors influencing them as independent inputs. This means that a distinction is made between nutrient supply and the physiological state of the GIW as model inputs, the representation of the biochemical pathways of nutrient metabolism as the mechanism described by the model, and nutrient transport to blood as the outcome of the model.
Representing gastrointestinal wall metabolism
Fig. 3 depicts the relationship between model inputs (influencing factors and nutrient supply to the GIW) and model ouputs (nutrient supply to the animal and GIW nutrient metabolism) at several levels of organisation: animal, GIT and GIW. This distinction helps to reconsider the factors influencing GIT functioning and GIW metabolism. When compartmentalisation of the GIW is added, the scheme changes into that of Fig. 7 with an anatomical compartmentalisation of GIW included, and into Fig. 4 with compartmentalisation of physiological functions (tissue types) and biochemical pathways. The present study aims at a compartmentalised representation of GIW metabolism according to the organisation of influencing factors, functions and processes, and GIW nutrient utilisation and nutrient supply to the animal, according to both Figs. 4 and 7.
Schematic representation of the modelling approach at different levels of organisation: the animal, the gastrointestinal tract (GIT) and tissue of the gastrointesinal wall (GIW). A distinction is proposed between model input being nutrient inputs and parameters for the physiological state of the GIT and its productive functions; model representation being the intracellular biochemical pathways of nutrient utilisation, and model output being the nutrient supply to portal blood and apparent nutrient utilisation by the GIW.

Similar principles hold for the representation of the metabolic activity of every type of tissue or cell, with glycolysis and the citric acid cycle as basic elements. Depending on the type of tissue or cell involved, different characteristics can be attributed to these pathways (enzyme kinetics, protein functions, and quantity, type and location of enzymes and proteins). In line with previous modelling efforts (for examples, see Baldwin, Reference Baldwin1995; Dijkstra et al. Reference Dijkstra, Forbes and France2005), a schematic representation of the metabolism of the GIW is illustrated in Fig. 4 (B), which represents mechanisms of nutrient transport, biochemical pathways, nutrient conversions and productive functions. Productive functions particularly involve the synthesis of protein, glycoproteins, nucleic acids and (phospho)lipids. Besides the incorporation of nutrients as a monomer for synthesis of cells and cell products, nutrients also become oxidised to deliver the ATP and NADH required to sustain these productive functions and to maintain the basic physiological functions of cells. For sound representation, rates of formation and utilisation of both ATP and NADH need to be in balance.
Schematic representation of the modelling approach to explain nutrient metabolism (A) from intracellular biochemical pathways of nutrient utilisation, and (B) as a function of nutrient supply and physiological functions of tissues of the gastrointestinal wall (GIW). In (A) thick lines indicate nutrient inputs and outputs; thin lines indicate intracellular metabolism and productive functions; boxes indicate intracellular pools of nutrients and metabolites; productive functions are indicated which are involved with tissue turnover, tissue growth and proliferation, secretions and the immune response. EAA, essential amino acids; NEAA, non-essential amino acids; (○), ATP production; (●), ATP utilisation; (□), NADH and H+ production; (■), NADH and H+ utilisation. For details on the distinction between model inputs, model representation and model outputs, see Fig. 3.

Effect of metabolite concentrations on metabolic processes
Variation in the extent of utilisation of specific nutrients finds its origin in known biochemical pathways. An example is the explanation of the stimulatory effect of propionate and glucose supply on the conversion of butyrate to β-OH-butyrate by rumen epithelia in vitro (Rémond et al. Reference Rémond, Ortigues and Jouany1995; Baldwin & Jesse, Reference Baldwin and Jesse1996), which seems in line with in vivo observations on the effect of propionate and glucose on net portal fluxes (Gross et al. Reference Gross, Harmon, Minton and Avery1990b; Krehbiel et al. Reference Krehbiel, Harmon and Schnieder1992; Seal & Parker, Reference Seal and Parker1994). Principles required for representation of these processes include:
concentration gradients (between lumen, arterial blood and mucosa) and (facilitated) transport mechanisms affect nutrient transport;
enzymic processes underlying nutrient metabolism depend on intracellular nutrient concentrations;
changes in intracellular nutrient concentrations not necessarily reflecting nutrient transport rates;
a single intracellular compartment may be an oversimplification with the possibility of separate sources (lumen, arterial blood) and cell compartments causing separate routes of transport and metabolism.
From these principles two conclusions can be drawn. First, changes in nutrient supply from both luminal and arterial sources (in units of mass per unit time) are not necessarily related directly to changes in intracellular and extracellular nutrient concentrations (in units of mass per unit volume). Second, the mechanisms involved have to be represented to be able to relate the supply and intracellular concentration of nutrients to their metabolism.
Mathematical representation
Nutrient metabolism is an enzymically driven process which can be represented by a description of the enzyme kinetics involved. Separate kinetics are to be represented for the synthetic processes, with the incorporation of nutrients as monomers, and for the oxidation of nutrients to generate ATP and NADH (Fig. 4). Kinetics is specific for the type of nutrient, the type of tissue cells and the physiological state of this tissue. The rate of the enzymically driven process of utilisation of a nutrient depends on the concentration of this nutrient in the metabolic compartment under consideration. This concentration, CNutr (mol/l), is calculated from the quantity of nutrient (QNutr; mol) present in the intracellular compartment of the GIW tissue involved and the fraction of intracellular metabolic volume (fmetvol) of tissue mass (normally about 0·8). The following equations apply then for the calculation of CNutr and the rate of nutrient utilisation (UNutr; mol/d):


where vmax,Nutr is the maximum rate of nutrient utilisation (mol/d) and M is the affinity constant of nutrient utilisation (mol/l).
The effect of the mass of metabolically active tissue involved (QTissue; g) on the nutrient utilisation capacity is represented by expressing vmax,Nutr per unit tissue mass (mol/g tissue per d):

With this type of equation the metabolism of all nutrient types can be represented. In the case of nutrient interactions, such as the competitive inhibition between two nutrients Nutr1 and Nutr2, the following type of equation can be used to describe inhibition of Nutr1 utilisation by Nutr2:

where CNutr2 is the intracellular concentration of Nutr2 (mol/l) and J is the inhibition constant (mol/l) for Nutr2 inhibiting the metabolism of Nutr1. A similar equation can be developed for the effect of Nutr1 on Nutr2 metabolism.
Also, effects of hormonal regulation on the enzymic capacity or activity of tissue cells can be represented by (a combination of) the following equations:

or

where CHormone is the concentration of hormone (mol/l). Often, the presence of a hormone is represented with a relative value that compares hormone concentration with that during a reference physiological state, CHormone,ref, by replacing CHormone/CHormone,ref for CHormone.
Also, specific functions of the GIW, such as the rate of nutrient and ion transport, or other energy-requiring processes, are mostly enzymically driven and saturate with an increase of rate. Factors influencing the individual physiological functions of the GIW, affecting the enzymically driven processes as well as the mass of GIW tissues involved, may be represented in a similar manner as the effect of hormones, changing the maximum of enzymic activity. Factors influencing the tissue characteristics are, besides tissue mass (QTissue), the rate of tissue turnover and the rate of a productive response (of the immune system, synthesis of mucus, synthesis of digestive enzymes), calculated as QTissue × kturnover and QTissue × kproduction, where kturnover is the fractional rate of tissue turnover (/d) and kproduction is the rate of the productive response (g or mol product/g tissue per d).
The requirement of nutrient Nutr for tissue turnover and synthesis of cell products may then be represented by:

or

where RTurnover,Nutr and RProduction,Nutr are the specific requirements of the nutrient to maintain tissue turnover and the incorporation of the nutrient into the cell products synthesised.
For a more elaborate discussion of these modelling methods to represent the metabolic activity of various organs or animal metabolism, the reader is referred to the textbooks of Baldwin (Reference Baldwin1995) and Dijkstra et al. (Reference Dijkstra, Forbes and France2005).
Nutrient utilisation by the gastrointestinal wall
Before giving attention to the individual functions and processes responsible for the metabolic activity and nutrient utilisation by GIW tissues, the more general characteristics of GIW metabolism are discussed first for single-stomached animals and ruminants.
Single-stomached animals
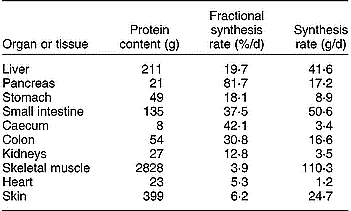
The GIW metabolism is intensive, with high rates of synthesis and degradation of proteins, carbohydrates and glucoproteins, resulting in high utilisation rates of specific types of amino acids (AA) and glucose. Additionally, there is intensive ion transport across cell membranes. These processes generate a high demand of metabolic energy, which is evident from the significant O2 consumption by all portal-drained visceral organs (portal-drained viscera; PDV). In pigs of 3·5–4 months of age Yen et al. (Reference Yen, Nienaber, Hill and Pond1989) established a PDV share of 37 % of total O2 consumption and after a meal O2 consumption rose by about 50 % compared with the level preceding the meal. McNurlan & Garlick (Reference McNurlan and Garlick1980) concluded that the PDV covers 20–35 % of the total energy utilisation as well as protein synthesis of the whole body, but lower estimates of 10–20 % are suggested by Van Goudoever et al. (Reference Van Goudoever, Stoll, Henry, Burrin and Reeds2000), which still remains high in comparison with a relative weight of the PDV of about 6 % of total body weight. The PDV organs are responsible for more than 50 % of the total body turnover of some EAA (Stoll et al. Reference Stoll, Henry, Reeds, Yu, Jahoor and Burrin1998; Yu et al. Reference Yu, Burke, Vogt, Chambers and Young1992). A comparison of FPSR in various organs of a pig of 44 kg whole weight indicates that protein turnover rate is many times higher in the PDV than in skeletal muscle (Table 1). A large fraction of the AA supplied from the lumen and by arterial blood is extracted by the GIW. Bertolo et al. (Reference Bertolo, Chen, Pencharz and Ball1999, Reference Bertolo, Pencharz and Ball2000) demonstrated that the SI intervenes more in AA utilisation than the liver. Because of the intensive metabolism and with its apparent dependency on the supply of AA from the lumen, the GIW requires detailed representation in relation to total AA and energy demand of the whole body (Stoll & Burrin, Reference Stoll and Burrin2006).
Protein content, and fractional and absolute rate of protein synthesis in various organs and tissues of a pig of 44 kg body weight (results derived from Simon, Reference Simon, Bock, Eggum, Low, Simon and Zebrowska1989)
Nutrients are used to sustain basal functions of cells such as ion transport, cell repair and replacement, costs of basic levels of nutrient transport, mucosa turnover and production of immune cells, immunoglobulins and mucus. Although a large fraction of the secretions will be digested again and absorbed by the GIW (recycling), the synthesis and absorption processes still have a cost of energy, and hence of nutrients. About 10 % of total protein synthesis in the mucosa is related to the net synthesis of mucosal protein and the remainder is secreted to the lumen as digestive enzymes, mucus, immunoglobulins and sloughed mucosal cells (Gaskins, Reference Gaskins and Ball2003). Therefore, nutritional factors that stimulate the secretory function of the GIT may affect its nutrient utilisation rate.
Various factors have been identified to affect the metabolic activity of the GIW. For example, proliferative effects of volatile fatty acids (VFA), in particular of butyrate, have been established (Sakata, Reference Sakata1987; Lupton & Kurtz, Reference Lupton and Kurtz1993). A decreased utilisation of leucine by the GIW because of a diminished microflora in the lumen (Nieto & Lobley, Reference Nieto, Lobley, Lobley, White and MacRae1999) is an example where digestion and nutrient utilisation by the GIW are both affected. Stoll et al. (Reference Stoll, Henry, Reeds, Yu, Jahoor and Burrin1998) observed that the amount of AA catabolised by the mucosa of piglets (first-pass metabolism) was strongly related to the mass of mucosa present. This means that factors that influence the mucosal mass also strongly determine the utilisation of AA and other nutrients by the GIW. This example is representative of the multiple aspects of GIT functioning that may be affected by nutritional factors; digestive processes (extent and site of digestion, microbial activity), absorptive processes (extent, site and type of transport), secretory processes (digestive enzymes, mucus, immunoglobulins), mucosa metabolic activity (tissue mass, turnover, proliferation, repair, immune response), and type of nutrient supplied to the mucosa (nutrient supply from lumen and by arterial blood). Keeping in mind this complexity, an attempt is made to delineate the effects of specific factors and production conditions on the metabolic activity of the GIW.
Windmueller & Spaeth (Reference Windmueller and Spaeth1974, Reference Windmueller and Spaeth1975, Reference Windmueller and Spaeth1976, Reference Windmueller and Spaeth1980) demonstrated that AA, in particular NEAA, play an important metabolic role in the GIW. The crucial observation was made that the GIT removes about 25 % of the glutamine supplied by arterial blood. These observations on glutamine had a large impact on clinical nutrition and led to an extensive investigation of the role of glutamine in GIW metabolism (Smith & Wilmore, Reference Smith and Wilmore1990; Hall et al. Reference Hall, Heel and McCauley1996). Measurements also indicated that glutamine was not only used as a source of energy but that it also served as a precursor for some essential pathways (synthesis of ornithine, citrulline, proline and arginine; Wu, Reference Wu1998). Besides its role in the functioning of immune cells, glutamine plays a crucial role in the replenishment of metabolic intermediates and the supply of metabolic energy during hypoxic conditions. It is still under debate whether AA utilisation is functional and inevitable, or rather driven by the presence and local supply of AA to enterocytes. It is also not fully clear to what extent the excessive utilisation of AA may be regulated by protein nutrition (Stoll et al. Reference Stoll, Henry, Reeds, Yu, Jahoor and Burrin1998).
Variation in nutrient utilisation by the GIW occurs due to a variable supply and origin of nutrients and competition among nutrients. For example, Fleming et al. (Reference Fleming, Zambell and Fitch1997) observed an interaction between glucose and glutamine in their contribution to the production of metabolic energy in cells isolated from the rat SI. The percentage of energy produced by glucose metabolism in glycolysis increased from 78 % to 95 % when glutamine was incubated together with glucose. The largest fraction of glucose was utilised for the synthesis of lactate, which corresponds with measurements in vivo. Furthermore, the results also indicate that changes in glucose and glutamine supply have consequences for metabolism of the mucosa cells. With a combination of glucose and glutamine, both nutrients delivered a similar amount of energy (in the proximal part of the SI 62 and 38 %, and in the distal part 49 and 51 %). The intensity of glycolysis was six to seven times higher in cells of the proximal part of the SI compared with those in the distal part. There seems to be a minor contribution of the pentose-phosphate cycle to total glucose utilisation (less than 5 %). It should be noted that glucose utilisation by isolated GIW in vitro is normally higher than measured in vivo (Reeds et al. Reference Reeds, Burrin, Stoll, Van Goudoever, Lobley, White and MacRae1999). Although in vitro results may not be representative from a quantitative point of view, the size of the effects observed by Fleming et al. (Reference Fleming, Zambell and Fitch1997) indicate that glucose utilisation cannot be neglected in evaluations of nutrient metabolism by the SI or whole GIT. It is necessary to recognise that glucose utilisation by the mucosa depends on the physiological conditions and the nutritional state of the animal, instead of making a general assumption of minor glucose utilisation (Reeds et al. Reference Reeds, Burrin, Stoll, Van Goudoever, Lobley, White and MacRae1999).
There are also several physico-chemical factors that affect feed digestion and nutrient absorption such as viscosity, pH and osmolarity of digesta. An increase in intraluminal viscosity inhibits the rate of nutrient absorption because of a thickening of the unstirred water layer at the mucosa surface (Johnson & Gee, Reference Johnson and Gee1981). Also the mixing of feed, pancreatic enzymes and bile is inhibited (Edwards et al. Reference Edwards, Johnson and Read1988), as well as the movement of nutrients to the mucosa surface (Fengler & Marquardt, Reference Fengler and Marquardt1988) causing a delay in digestive and absorptive processes. A higher viscosity causes a reduction in mixing, a slower passage and less oxygenation of digesta, and may therefore stimulate microbial population (Bedford, Reference Bedford1996). Intraluminal viscosity strongly depends on dietary composition, and measurements in ileum contents in chicks of age 22 d varied from 2·6 mPa × s on a maize diet to 33·5 mPa × s on a rye diet (Langhout, Reference Langhout1998). Large differences in viscosity occurred at different sites along the SI. Viscosity in the duodenum and jejunum was several times lower than in the ileum. Another factor to consider is the pH of digesta, which increases progressively with passage through the stomach and duodenum. Usually, the pH of ileum contents is efficiently regulated, but dietary measures such as supplementation with organic acids in a matrix, ensuring their gradual liberation, decreased pH in the ileum in a linear manner (Mroz et al. Reference Mroz, Øverland, Reese, Granli, Kogut, Kjeldsen and Ball2003). This effect is important in relation to the barrier function of the SI and the microbial population hosted in the lumen, and also in relation to the intraluminal production of ammonia and mineral absorption because pH affects solubility as well as the size of mineral complexes formed (Biagi et al. Reference Biagi, Piva, Hill, Schneider, Crenshaw and Ball2003). A large number of studies have been published concerning the effects of organic acid supplementation or the stimulation of intraluminal production of acids as a means to manipulate the microbial population and pH of digesta in different compartments of the GIT (for reviews, see Partanen & Mroz, Reference Partanen and Mroz1999; Mroz et al. Reference Mroz, Koopmans, Bannink, Partanen, Krasucki, Øverland, Radcliffe, Mosenthin and Zebrowska2005). Intraluminal acids are potentially powerful factors to influence animal performance. Organic acids also have a strong impact on the morphology of the GIW (Pluske et al. Reference Pluske, Williams and Aherne1996) and on the secretion of pancreatic enzymes (Harrada et al. Reference Harada, Niiyama and Syuto1986); they serve as a source of energy for metabolism, and there are indications of positive effects on the immune system (Pratt et al. Reference Pratt, Tappenden, McBurney and Field1996).
Ruminants
As in single-stomached animals, the FPSR in the PDV is high (Table 2). Huntington & Reynolds (Reference Huntington and Reynolds1987) indicate that O2 consumption by the PDV is about 20 % of that of the whole cow, and appeared evenly distributed over stomachs and intestines.
Fractional rate of protein synthesis in various organs of sheep on two levels of feed intake (results derived from Lobley et al. Reference Lobley, Connell, Milne, Newman and Ewing1994)

In non-juvenile ruminants, VFA are the main source of energy for rumen epithelium. Often, variation in relative utilisation of acetate, propionate and butyrate by rumen wall tissues is assumed small (Bergman, Reference Bergman1990). However, a change in VFA supply to the epithelia does not necessarily mean that a similar and proportional change occurs in VFA utilisation. Moreover, various nutritional factors affect the relative proportion of acetate, propionate and butyrate in the rumen (Baldwin, Reference Baldwin1995; Bannink et al. Reference Bannink, Kogut, Dijkstra, Kebreab, France, Tamminga and Van Vuuren2006b). Depending on the type of VFA involved, VFA are more or less mutually dependent with respect to the enzyme kinetics of their metabolic conversion (Ash & Baird, Reference Ash and Baird1973; Harmon et al. Reference Harmon, Gross, Krehbiel, Kreikemeijer, Bauer and Britton1991; Rémond et al. Reference Rémond, Ortigues and Jouany1995; Bannink et al. Reference Bannink, Kogut, Dijkstra, France, Tamminga, Van Vuuren, McNamara, France and Beever2000; equation 4). This dependency is characterised by competitive inhibition and causes butyrate to strongly inhibit the activity of CoA-synthetases for acetate and propionate (Rémond et al. Reference Rémond, Ortigues and Jouany1995; Fig. 5), whereas the reverse is not the case. Besides full oxidation, a variable proportion of butyrate is metabolised to β-OH-butyrate (Bergman, Reference Bergman1990; Britton & Krehbiel, Reference Britton and Krehbiel1993; Rémond et al. Reference Rémond, Ortigues and Jouany1995) and part of the propionate may be converted into lactate. Both lactate and propionate are precursors for gluconeogenesis. It remains uncertain, however, to what extent propionate utilisation depends on arterial glucose supply and on the competition among the rumen, other visceral tissues and the udder for arterial glucose. Finally, there are indications that epithelial mass in particular changes with nutrition, instead of the metabolic activity per unit tissue mass. Growth and proliferation of epithelia seems therefore the most important determinant of the energy requirement and of the fraction of the VFA utilised by the GIW (Bannink et al. Reference Bannink, Kogut, Dijkstra, France, Tamminga, Van Vuuren, McNamara, France and Beever2000).
Comparison of enzyme assays in rumen epithelium by Harmon et al. (Reference Harmon, Gross, Krehbiel, Kreikemeijer, Bauer and Britton1991; ,
,  ,
,  ) and Ash & Baird (Reference Ash and Baird1973; □, Δ, ○). The effect of inhibiting volatile fatty acid (VFA) on the activity of VFA activation is demonstrated by a double-reciprocal plot of Co-synthetase activity (V; μmol/g tissue per min) and VFA concentration of the activated VFA type (S; mmol/l) (A). (B) Acetate (, □, Ac); (C) propionate (, Δ, Pr); (D) butyrate (, ○, Bu). Codes and numbers that guide the symbols indicate the type and concentration (mmol/l) of inhibiting VFA (absence of a guiding code indicates absence of inhibiting VFA). The graphs were derived from Bannink et al. (Reference Bannink, Kogut, Dijkstra, France, Tamminga, Van Vuuren, McNamara, France and Beever2000).

The fraction of VFA metabolised by the PDV in various types of ruminants is presented in Table 3. Although differences in experimental methodology may explain part of the variation observed, a large variation in VFA metabolism seems evident. Moreover, Kristensen et al. (Reference Kristensen, Danfær and Agergaard1998a, Reference Kristensen, Danfær and Agergaardb) indicated that VFA appear in portal blood in highly variable amounts and composition (Table 3). Although substantial amounts of VFA (up to a third) flow to the (ab)amosum, enzyme assays indicate that tissues from these organs have comparable capacities to convert VFA to those established for rumen tissue (Bannink et al. Reference Bannink, Kogut, Dijkstra, France, Tamminga, Van Vuuren, McNamara, France and Beever2000).
Measurements of net flux of volatile fatty acids (VFA) in portal blood expressed as a percentage of the quantity formed in the rumen (after Rémond et al. Reference Rémond, Ortigues and Jouany1995), or as a percentage of metabolisable energy intake (after Kristensen et al. Reference Kristensen, Danfær and Agergaard1998a)
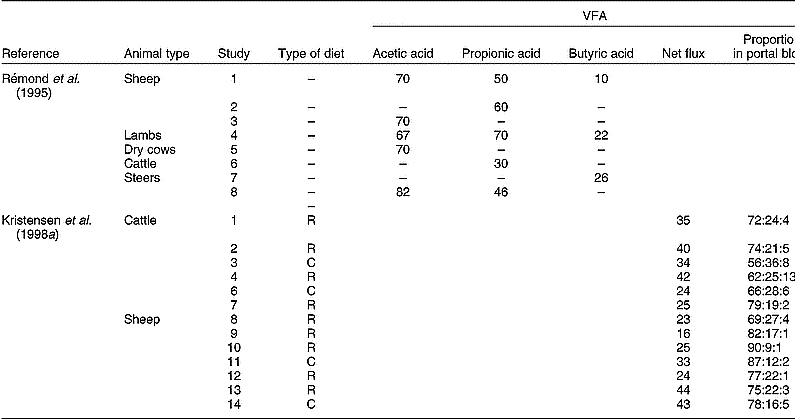
R, roughage-rich diet; C, concentrate-rich diet.
* Acetic acid:propionic acid:butyric acid.
As with single-stomached animals, the GIT of ruminants also utilises large amounts of AA supplied by arterial blood. Lindsay & Reynolds (Reference Lindsay, Reynolds, Dijkstra, Forbes and France2005) mention a 35 g N/d difference between the supply from the lumen and the net amount appearing in the portal blood in beef cattle. This suggests a rather constant AA utilisation by the GIW and a less prominent role of AA such as glutamine as an energy source than in single-stomached animals. However, other studies indicate a much higher AA utilisation by the PDV (discussed later).
Factors affecting gastrointestinal wall physiology
The GIT supports the digestion of feed and absorption of nutrients. It is also the barrier to the external environment, supports important immune functions and generates endocrine responses to the intraluminal conditions (Burrin et al. Reference Burrin, Stoll, Jiang, Chang, Hartmann, Holst, Greeley and Reeds2000). Such essential functions have high metabolic costs. Therefore, quantitative examination of the capacity of nutrient utilisation of the GIW, in relation to the various physiological functions it performs and in relation to the capacity to regulate the nutrient supply to the animal, is required. In this section, the metabolic costs of the physiological functions of the GIW will be discussed, with special emphasis on the SI in single-stomached animals and on the rumen in ruminants.
Gastrointestinal tract mass
Nutritional factors have a strong impact on the development of the GI and the mass of tissue present. Even more than the metabolic acivity per unit tissue mass, the total mass of mucosa tissues determines the energy and nutrient need by the GIW (equation 8). For this reason, the mass of the GIW is an important factor when evaluating the variability of nutrient utilisation by the GIW. Hence, mass of tissue, in particular that of the epithelia and the cells with a secretory function or involved with the immune reponse, needs to be a direct input to the model of GIW metabolism (Figs. 3, 4 and 7) or to be predicted from nutritional and animal (GIW) characteristics.
Single-stomached animals
The weight of the GIW is strongly related to body weight. Specific feed components such as fermentable carbohydrates resistant to digestion in the SI (Van der Meulen et al. Reference Van der Meulen, Bakker, Bakker, De Visser, Jongbloed and Everts1997a; Bakker, Reference Bakker1995; Brunsgaard et al. Reference Brunsgaard, Eggum and Sandström1995) not only affect the type and location of digestion, but also physiology and growth of the GIW and its proliferation. The high adaptive capacity of the GIW is a general characteristic among animal species.
Brunsgaard et al. (Reference Brunsgaard, Eggum and Sandström1995) demonstrated in young rats of age 0–6 d that inclusion of fermentable carbohydrates in the diet increased the share of the GIW in whole-body growth (up to 33 % extra whole-body weight, and 45 % extra GIW weight per unit empty body weight). In growing pigs, similar adaptations occur on the inclusion of fermentable carbohydrates in the diet (Bakker, Reference Bakker1995). Substituting cellulose or soya hulls for maize starch during the growth period from 30 to 105 kg of body weight increased GIW weight up to 6 kg. More recently, Rijnen et al. (Reference Rijnen, Dekker, Bakker, Verstegen, Schrama, Lindberg and Ogle2001) obtained comparable results with increasing doses of coconut meal and soyabean hulls on the proportion of GIW in empty-body weight. With increasing dietary content of coconut meal or soyabean hulls from 4 to 48 % of DM the weight of the total GIW, stomach and colon per kg body weight gradually increased up to a maximum of 24 and 6 %, 28 and 15 %, and 61 and 29 %, respectively. In another study (Rijnen, Reference Rijnen2003), substituting raw potato starch for gelatinised maize starch caused a significant shift of the site of starch digestion from the SI to LI and a 9 and 29 % higher weight of total GIW and colon. With straw substitution, the weight of the total GIW and the stomach increased by 7 and 11 %, and that of the SI and caecum were hardly affected. Fermentable carbohydrates thus have a strong impact on the GIW development (QTissue; tissue turnover rate, equation 7; Figs. 3, 4 and 7) related to digesta mass and organic acid production.
Ruminants
The level of feed intake has a large impact on the GIW mass in ruminants (Smith & Baldwin, Reference Smith and Baldwin1974; Van Soest, Reference Van Soest1994). Lindsay & Reynolds (Reference Lindsay, Reynolds, Dijkstra, Forbes and France2005) indicate that not only during the growth of juvenile ruminants but also in adult ruminants the GIW and liver keep their plasticity to a large extent and up to a doubling of rumen, SI and liver weight is possible during pregnancy and lactation. Baldwin (Reference Baldwin1995) mentions 34 kg of weight of the GIW of a lactating cow, which is 28 % more than during the dry period. Similar changes have been established in other animal species such as rats, which indicates that the impact of stage of lactation and level of feed intake on the GIW mass is comparable across animal species (Baldwin, Reference Baldwin1995). Considering the high metabolic activity of the GIW and the morphological traits of dairy cattle selected for high yields, the impact of the GIW on energy metabolism and nutrient supply to the cow probably becomes increasingly important when productivity rises as indicated by the increased maintenance requirements, measured by indirect calorimetry, of modern-type high-yielding dairy cattle compared with low-yielding dairy cattle (Kebreab et al. Reference Kebreab, France, Agnew, Yan, Dhanoa, Dijkstra, Beever and Reynolds2003).
Besides feed intake the dietary composition affects the GIW mass (QTissue; tissue turnover rate, equation 7; Figs. 3, 4 and 7). With reference to rumen mass, the dietary concentrate proportion is an important stimulatory factor for rumen epithelia mass and size of rumen papillae (Dirksen et al. Reference Dirksen, Liebich, Brosi, Hagemeister and Mayer1984), and the absorption capacity of the rumen wall. This stimulatory effect is probably related to the increased production of VFA. Proliferation of rumen epithelia may also be stimulated in a more indirect manner. Regulation by hormones secreted locally, or by increased concentrations of hormones in the circulation as a response to an increased consumption of starch by the dairy cow in early lactation, may cause proliferation of epithelial tissues and a higher epithelial mass (Sakata et al. Reference Sakata, Hikosaka, Shiomura and Tamate1980; equations 5 and 6). Although during early lactation peripheral tissues and the GIW might be relatively insensitive to the influence of insulin, other hormones (for example, insulin-like growth factor 1; Shen et al. Reference Shen, Seyfert and Löhrke2004) still may have an effect.
Tissue turnover and proliferation
Several nutritional factors affect the turnover and proliferation of the mucosa by changes in the rate of cell division in the proliferative zone of the epithelia (crypts). These factors may vary from nutritional (lumen conditions), to physiological (hormones, arterial nutrient supply, physiological state) and immunity factors (pathogens, mucosal damage, increased wearing or degradation of mucus and mucosa). Particularly nutrients in the lumen are strong stimuli to synthesis rates of crypt cells, but also hormones, inflammatory mediators or other specific factors may have an effect. The process of tissue turnover has a high metabolic cost, strongly determines nutrient requirement by the GIW and may become an estimated maximum of 50 % of the total requirement of the GIW (for example, infection, high levels of feed intake, with antimicrobials) and a somewhat smaller, but still very high, percentage of the whole-body protein turnover. Therefore, tissue turnover is an essential input to the model of nutrient metabolism by the GIW, either a direct model input or predicted from indirect nutritional and animal factors (equation 7; Figs. 3, 4 and 7).
Proliferation is one mechanism to ensure optimal functioning of the mucosa despite highly variable nutritional conditions. Proliferation will have large consequences for the nutrient utilisation by the GIT and the energy costs of tissue turnover. In addition, other energy-requiring processes will change, including the transport rates of ions and nutrients. As a result, energetic consequences of proliferation will be much larger than solely the costs involved with turnover of the tissue. Baldwin (Reference Baldwin1995) argued that 40 % of total heat production by the GIT is attributed to tissue turnover, whereas 60 % is caused by other synthetic and maintenance processes, of which half is attributed again to transport of ions and nutrients.
In ruminants, VFA strongly determine the metabolism of rumen epithelia that need to adapt to exposure to high VFA loads. In vitro studies identified butyrate as a key factor in rumen epithelial proliferation (Galfi et al. Reference Galfi, Neogrady, Sakata, Tsuda, Sasaki and Kawashima1991), which is confirmed in vivo (Reynolds & Huntington, Reference Reynolds and Huntington1988a,Reference Reynolds and Huntingtonb). In comparison with a roughage diet, a concentrate diet offered to beef steers showed a three-fold higher net appearance of butyrate in portal blood in combination with a ten-fold and six-fold increase of the net utilisation of AA and glucose (and halving of the net appearance of lactate) by the stomachs. This indicates a higher rate of metabolism and protein synthesis by stomach tissues. The total net appearance of VFA units (acetate+propionate+2 × butyrate+2 × β-OH-butyrate) was slightly lower on the concentrate diet despite its higher digestibility, indicating a higher rate of VFA utilisation by the stomach tissues. Similarly, Krehbiel et al. (Reference Krehbiel, Harmon and Schnieder1992) established a 28 % lower net portal appearance of AA with intraruminal infusions of butyrate. Finally, Nozière et al. (Reference Nozière, Martin, Rémond, Kristensen, Bernard and Doreau2000) observed a strong proliferative action of intraruminal infusion of butyrate in underfed ewes with much lower (negative) rates of net portal appearance of EAA compared with infusions of mainly acetate and propionate.
Butyrate is not only associated with proliferation as an adaptive response of the epithelium, but also with the occurrence of para- or hyperkeratosis and structural changes during which proliferation is actually inhibited and cell differentiation stimulated (Gäbel et al. Reference Gäbel, Aschenbach and Müller2002). Thus, diets high in energy, offered for long periods, may have contrasting effects on the morphology and functioning of rumen epithelia and the corresponding nutrient utilisation. Insight into mechanisms of responses for the in vivo situation in ruminants still seems inadequate (Gäbel et al. Reference Gäbel, Aschenbach and Müller2002).
Transport of nutrients and ions
Permeability of mucosa is defined as the capacity of specific compounds to penetrate the GIT by diffusion without interference of active or facilitated transport mechanisms (Montalto et al. Reference Montalto, Veneto, Cuoco, Cammarota, Tursi, Papa, Fedeli and Gasbarrini1997). This permeability is a useful concept to study the integrity and functionality of the mucosa (Jeurissen et al. Reference Jeurissen, Lewis, Van der Klis, Mroz, Rebel and Ter Huurne2002). The concept might also be useful to study the transport route of ions and nutrients in relation to the mucosal metabolism and integrity, but this application seems lacking in the literature. The nutrient cost involved depends on the mechanisms of the different routes of transport (transcellular v. paracellular, passive diffusion v. facilitated or active transport) and the maintenance functions required to keep the intracellular milieu within narrow physiological and biochemical limits. These costs can be substantial, as will be discussed later, with an estimated maximum of 50 % of the total energy requirement by the GIW (for example, with high levels of feed intake) and of the whole body as well. For this reason, the explicit representation of the metabolic costs of nutrient and ion transport is an essential element of every model of GIW metabolism (Figs. 3, 4 and 7). Part of these costs may be directly related to nutrient transport; however, the main part is involved with maintaining tissue functionality and therefore needs to be an independent input to the model or needs to be predicted from nutritional or animal (GIW tissue) characteristics.
The mucosa contains Na+-dependent carrier systems for the transport of AA and glucose. Different AA, and AA and glucose, have some of these carrier systems in common, causing competitive inhibition of their transport rate (Vinardell, Reference Vinardell1990), absorption kinetics, intracellular concentrations and utilisation rate by the mucosa. Transport of monomers such as glucose and AA is mainly Na+ dependent and requires ATP. In various models, a requirement of 0·33 mol ATP/mol monomer transported is assumed (Gill et al. Reference Gill, France, Summers, McBride and Milligan1989; Gerrits et al. Reference Gerrits, Dijkstra and France1997), although the precise costs vary with the processes taken into account by these figures. Transport of short-chain peptides is Na+ independent, independent from that of glucose and AA, but still a function of peptide concentration according to enzyme kinetics in the absence of any ion gradient across the mucosal membrane. Nutrients may also be transported by passive diffusion that does not directly require energy and follows a concentration gradient (perhaps indirectly to maintain intracellular homeostasis). Particularly VFA may be transported by active or facilitated transport as well as passive diffusion, which both saturate with increasing VFA concentration because ATP-requiring enzyme kinetics are involved, and (probably) concentration gradients become smaller (Lopez et al. Reference Lopez, Hovell, Dijkstra and France2003). With pH values below 6·0, VFA mainly diffuse passively, whereas with rumen pH above 6·0 most VFA are present in the non-diffusible anionic form and are transported by active or facilitated transport (Dijkstra et al. Reference Dijkstra, Boer, Van Bruchem, Bruining and Tamminga1993; Gäbel et al. Reference Gäbel, Aschenbach and Müller2002).
Energetic costs of transport of several types of nutrients and ions are summarised in Table 4. Ion transport takes a substantial part of the total energy utilisation in tissues and the whole body as demonstrated by estimates of Summers et al. (Reference Summers, McBride, Milligan, Dobson and Dobson1988) for a fasting animal. These estimates show that ion and Na+-dependent nutrient transport together are about a quarter of whole-body energy utilisation, and more than a third of that by the GIT. Hormones may affect the costs of nutrient and ion transport. Summers et al. (Reference Summers, McBride, Milligan, Dobson and Dobson1988) indicated that the Na+,K+-ATPase activity in muscle tissue of sheep increased by 46 % because of increased levels of thyroid hormone. Thus, hormonal effects are not necessarily limited to nutrient transport and the synthesis and degradation of proteins, but may also affect the basal maintenance processes in cells. Maintenance and synthetic processes are hard to distinguish from each other and increased FPSR is accompanied by increased ATP use for Na–K transport (Summers et al. Reference Summers, McBride, Milligan, Dobson and Dobson1988). Although estimates may differ among different sources in the literature, it appears that with an increase of the metabolic activity or protein turnover in cells, the absolute rate of ion and nutrient transport and the energy costs to sustain this will also increase with a similar order of magnitude. This also explains the strong effect of the level of feed intake on the energy costs for ion and nutrient transport in the GIW. Baldwin (Reference Baldwin1995) evaluated the influence of the stage of lactation on the contribution of the GIT to total maintenance heat production by dairy cows, and this contribution increased from 7·2 % during the dry period to 8·4 % during lactation with GIT weight from 4·1 to 5·2 % of total body weight. Milligan & McBride (Reference Milligan and McBride1985) observed in sheep that were fasted, fed at maintenance, or fed above maintenance, that total and Na,K-ATPase-dependent O2 consumption by mucosa increased by 17 and 150 % with feed intake. Therefore, with increasing levels of feed intake the relative contribution of the energy requirements for ion transport in total energy requirements becomes larger. Gill et al. (Reference Gill, France, Summers, McBride and Milligan1989) performed a modelling exercise to evaluate the contribution of ion transport and protein turnover of the various organs in lambs to that of the whole body. They concluded that the GIT was among the organs with the highest contribution of 39 to 50 % and 21 to 26 % of the Na–K transport and protein turnover of the whole body. Further, with an increase in feed intake, the whole-body ATP utilisation, protein turnover and Na–K transport of the GIT increased by 30, 32 and 64 %. From the experimental and modelling results it is concluded that the energy requirements for ion transport increase relatively faster than those for protein turnover as a response to increased feed intake. Therefore, emphasis on explicit representation of the metabolic costs of ion transport is required in evaluations of nutrient requirement by the GIT (equation 3; Figs. 3, 4 and 7).
Estimated energy costs associated with the active or facilitated transport of ions and nutrients (based on Gill et al. Reference Gill, France, Summers, McBride and Milligan1989; Baldwin, Reference Baldwin1995; Gerrits et al. Reference Gerrits, Dijkstra and France1997)
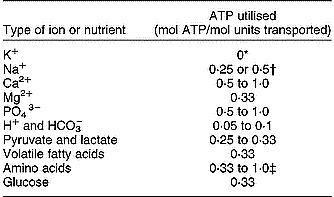
*Anti-transport with Na+.
† Two types of pumps with different efficiency.
‡ Distinction between uptake from blood or from lumen, in- or exclusive reabsorption and transport of endogenous protein, in- or exclusive Na+-independent transport.
Volatile fatty acids
As described previously, during transport of VFA through the reticulo-rumen wall, substantial VFA metabolism takes place. Compared with intestinal tissues the utilisation of glucose (mainly supplied by arterial blood) seems to play a minor role in rumen tissues (Rémond et al. Reference Rémond, Ortigues and Jouany1995). From theoretical considerations, a dependency has been suggested between VFA transport, intracellular VFA concentrations and VFA metabolism by rumen epithelia (Bannink et al. Reference Bannink, Dijkstra, Kebreab, France, Kebreab, Dijkstra, France, Bannink and Gerrits2006a; Gäbel et al. Reference Gäbel, Aschenbach and Müller2002; Fig. 6). The implications would be that the metabolism of proliferated rumen epithelium would affect the kinetics of VFA absorption and VFA metabolism, whereas these aspects are normally treated as independent variables with considerations of VFA utilisation (Britton & Krehbiel, Reference Britton and Krehbiel1993). Principles proposed for rumen epithelia (Gäbel et al. Reference Gäbel, Aschenbach and Müller2002; Fig. 6) largely correspond to those for the LI epithelia (Rechkemmer et al. Reference Rechkemmer, Gabel, Dierneas, Sehested, Moller, Von Engelhardt, Von Engelhardt, Leonhard-Marek, Breves and Gieseke1995).
Schematic representation of the transport of volatile fatty acids (VFA) and ions in rumen epithelium (Bannink et al. Reference Bannink, Dijkstra, Kebreab, France, Kebreab, Dijkstra, France, Bannink and Gerrits2006a; adapted from Gäbel et al. Reference Gäbel, Aschenbach and Müller2002).

Considerable energy costs are involved in VFA transport. McBride & Kelly (Reference McBride and Kelly1990) found that in response to a single daily meal the O2 utilisation by the rumen epithelium for Na+,K+-ATPase as well as for other functions increased during the first few hours after the meal by 20 to 30 %. Although the contribution of Na+,K+-ATPase remained rather constant at 25 %, irrespective of the type of diet or the moment of measurement, the absolute energy costs involved vary with the course of rumen fermentation and with VFA supply rate to the epithelium. Besides the direct energy costs of VFA transport (presumed to be 0·33 mol ATP/mol VFA transported; Table 4), there are additional energy costs for regulation of the intracellular pH and the prevention of intracellular acidosis (Gäbel et al. Reference Gäbel, Aschenbach and Müller2002) that may require more energy than the direct energy costs of VFA transport. In a comparable manner, Gill et al. (Reference Gill, France, Summers, McBride and Milligan1989) calculated that the energy costs of AA transport are relatively small compared with the energy costs of Na+,K+-ATPase. The results of McBride & Kelly (Reference McBride and Kelly1990) suggest that the maintenance of Na+–K+ homeostasis and integrity of rumen epithelia rather than nutrient transport is the most determinant factor of variation in Na+,K+-ATPase activity. Experimental evidence indeed indicates that the rumen epithelium adapts by ion transport and exchange of Na+ and H+ as well as VFA anions and bicarbonate. Carbon anhydrase activity leads to the synthesis of bicarbonate from CO2 (Fig. 6). This route of CO2 disposal was argued to be more important than disposal to blood, and of more importance for buffering rumen contents than saliva production (Gäbel et al. Reference Gäbel, Aschenbach and Müller2002), but no clear evidence is present.
Resident microflora
The presence of a microflora strongly directs the metabolic activity of the GIW, and may become very prominent in certain conditions such as with intraluminal colonisation by pathogens. According to the current modelling approach its effects are not explicitly represented as a direct input to the model, but affects multiple factors such as the immune response, mucus synthesis and tissue turnover rate (Figs. 3, 4 and 7). Consequently, the metabolic costs involved with the GIW response to the resident microflora or a change of this microflora (for example, infection) must be expected to be substantial.
Schematic representation of the modelling approach including the anatomical compartmentalisation of the gastrointestinal tract (GIT) and of the tissues of the gastrointestinal wall (GIW). For details on the distinction between model inputs, model representation and model outputs, see Fig. 3.

Single-stomached animals
The recent ban on the use of antibiotics as growth promoters caused a renewed interest in immunological effects and the growth-regulating functions of the GIT. Micro-organisms in the lumen have a protective as well as a nutritional role for the host (Gaskins, Reference Gaskins and Ball2003). Simultaneously, the host invests heavily in keeping micro-organisms outside the mucosa and reacts with acute immune responses if micro-organisms break through the mucosal defensive mechanisms.
The presence of a microbial population means that it competes with the host for nutrients in the GIT. Additionally, micro-organisms in the lumen have a stimulatory effect on cell turnover in the mucosa and on rates of secretion. The stomach and the proximal duodenum contain relatively few micro-organisms because of the low pH values and high passage rates of digesta. In the SI, the fractional passage rate of digesta often exceeds the fractional growth rate of most types of micro-organisms. Hence most micro-organisms found in the SI colonise the mucus layer on the mucosa or on the mucosa surface (Gaskins, Reference Gaskins and Ball2003). In the stomach and proximal duodenum acid-resistant lactobacilli survive and lactate concentrations are found in the stomach digesta (Mroz et al. 2005). The ileum as the most distal part of the SI contains a large and more heterogeneous microbial population. In the LI of the pig an extensive colonisation occurs, depending on the type of substrate flowing into the LI, which may cause extensive fermentation (Bakker, Reference Bakker1995; Van der Meulen et al. Reference Van der Meulen, Bakker, Bakker, De Visser, Jongbloed and Everts1997a).
In relation to the impact of GIT health on growth performance of single-stomached animals, particularly the SI seems to be important. The presence of a well-developed endemic microbial population may limit the development of non-endemic populations, including pathogens. Endemic micro-organisms have an inhibiting effect on the colonisation of new species by competition for suitable attachment sites and nutrients, and by secretion of anti-microbial factors or by changing actively the local growth conditions. Stimulating such an endemic microbial population partially counterbalances the potential production losses resulting from the ban on antibiotics.
The endemic micro-organisms also have a beneficial effect on the development of the immune system in the GIT. The non-pathogenic endemic micro-organisms act as antigens to stimulate the development of several defence mechanisms. The development of these systems is accompanied with high costs of energy for the host. The manner in which these defence systems are activated, and how inflammation mediators are involved in this, is highly complex and is not a subject of the present review. It is important to note, however, that the defence is not restricted to activation of the mucosal immune system but may activate a series of physiological functions such as blood flow, motility of the GIT and the secretion of water and ions (Chang & Rao, Reference Chang, Rao and Johnson1994), causing an increased rate of digesta passage (Nabuurs, Reference Nabuurs1991). The intensity of damage and the subsequent immune response and secretions by the mucosa determine the duration and the extent of nutrient costs for full recovery of the mucosa.
Furthermore the endemic microbial population delivers nutrients to the host from substrates that are difficult to degrade otherwise. First, mucus and digestive enzymes become available again for absorption by the host after microbial degradation, and without micro-organisms these compounds might accumulate (Gaskins, Reference Gaskins and Ball2003) and be lost for the host. Second, the micro-organisms in the GIT have an important role in fermentation of structural carbohydrates (fibrous compounds) to produce VFA for host metabolism. An intensive fermentation in the lumen stimulates the development of the GIT and its nutrient utilisation. Besides VFA, other valuable compounds also become available for the host such as vitamins and AA.
Micro-organisms may also produce metabolites with a negative effect on the functioning of the GIW (Gaskins, Reference Gaskins and Ball2003), including amines, ammonia, phenols and indols as endproducts of partial AA fermentation. In addition, fat digestion may be inhibited because of the microbial degradation of bile salts. The mucus layer may be undermined by extensive microbial colonisation that causes mucus degradation and extra energy costs because of the necessity of an increased rate of mucus synthesis. Such effects of the microbial population have a direct influence on digestive processes and the nutrient costs involved in functioning of the GIT. Gaskins (Reference Gaskins and Ball2003) concluded that many of the positive and negative effects of the microbial population in the GIT mentioned here have been insufficiently investigated in single-stomached animals. There is relatively little information on the variation that occurs in the relationships between host and intraluminal microbial population, on the influence of nutrition on microbial ecology in the GIT and the nutrient costs associated with this, and on the nutrient costs associated with infection and damage of the mucosa.
Ruminants
There is not much information on adaptation of the rumen wall to the presence of micro-organisms, apart from an effect of VFA as discussed earlier. Parker (Reference Parker1990) described that the effect of nutritional factors and of the intestinal microbial population on mucosa functioning may be ascribed to a reduced rate of cell division in the crypts and of cell migration to the villus tip. Results from Parker (Reference Parker1990), who added avoparcine to a pelleted diet for weaned lambs during 6 weeks, indicated a severe decrease of the rate of cell division in the crypts of the SI. Such effects, however, are not to be expected in mature ruminants.
Mucus secretion
Compared with the metabolic costs involved with nutrient and ion transport and tissue turnover, fewer costs are involved with the synthesis of mucus (the same holds for digestive enzymes). Nevertheless, the costs are still significant (estimated to be up to a maximum of tens of percentage of the total energy costs of GIW metabolism) and therefore mucus synthesis requires a separate representation in a model of GIW metabolism (equation 8; Figs. 3, 4 and 7).
The GIT is permanently covered by a strongly adherent layer of glycoproteins of high molecular weight and secreted by specialised goblet cells in the mucosa (Fig. 2). The mucus is a complex biofilm containing proteins, fats and bacteria in a gel-like matrix (Lamont, Reference Lamont1992). The most important proteins are mucins, a family of closely related glycoproteins. The characteristics of the mucus layer are that of a semi-solid gel which creates an important barrier for micro-organisms in the lumen of the GIT and the toxins produced by them, but also a diffusion barrier for dissolved compounds of low molecular weight (Lamont, Reference Lamont1992). Glycoproteins in mucus have highly comparable characteristics among various mammalian species (Lamont, Reference Lamont1992).
The basic structure of mucins is a peptide chain with oligosaccharides attached to it in a radial orientation; the peptide chain represents about 15 to 20 % of the molecular weight. The glycosilated part is rich in serine, threonine and proline, whereas the non-glycosilated part is rich in cysteine, serine, glycine, alanine, leucine, glutamate and aspartate and is folded in a comparable manner to many immunoglobulins (Mantle & Allen, Reference Mantle, Allen and Davidson1989; Forstner & Forstner, Reference Forstner, Forstner, Johnson, Alpers, Christensen, Jacobson and Walsh1994). The oligosaccharides are strongly hydrophilic, promote water binding and support the formation of the gel-like characteristics, prevent degradation of the peptide chain by proteases from the pancreas and bacteria, and bind pathogens, parasites and toxins. The hydrophobic areas may be involved with the binding of fats and with interactions in protein–protein interactions. Reeds et al. (Reference Reeds, Burrin, Stoll, Van Goudoever, Lobley, White and MacRae1999) indicate that the most important mucins produced by the mucosa are rich in cysteine, threonine, proline and serine, and concluded that substantial changes in mucus secretion have a measurable effect on the cysteine and threonine requirements of an animal.
Mucins contain binding sites that are in competition with receptors in enterocytes for binding proteins on the surface of micro-organisms. Besides these mucin-binding sites, enterocytes also secrete proteins that coat the microbial binding proteins. Mucins are continuously undergoing digestion and wearing at the luminal side, which is compensated by continuous secretions by goblet cells at the mucosal side of the mucus layer. Moreover, the mucus is continuously transported through the GIT including the cellular fats, DNA, proteins, sloughed epithelial cells and micro-organisms captured by it. By these mechanisms, the mucus protects the mucosa from invasion by micro-organisms. The viscosity of mucus depends on the type of stimulus as well as intraluminal pH (increased viscosity with lower pH). A higher rate of mucus secretion may be a response to many physiological and pathological stimuli, such as bacteria, bacterial toxins, inflammation mediators, chemical stimuli or neural stimuli. The density of goblet cells increases from the proximal duodenum to the distal rectum. Locally, there may be a large variety of goblet cells and types of mucins produced.
A general characteristic of mucins is their potential to bind lipids and NEFA by hydrophobic interactions with the peptide chain or by covalent bonds, respectively. Mucins from the stomach of the pig contain a considerable amount of NEFA, phospholipids, sphingomyeline and cholesterol. A layer of phospholipids directly bound to the mucus layer covers the stomach epithelium (Lamont, Reference Lamont1992). Presence of the phospholipid layer increases the resistance of the mucosal membrane of epithelial cells, which appears important for the prevention of mucus degradation and intracellular acidosis. Mucosa of the stomach as well as the intestines responds by the secretion of bicarbonate upon prolonged presence of acid in the lumen (Allen et al. Reference Allen, Flemstrom, Garner and Kivilaakso1993). This secretion is the result of a stimulated secretion of bicarbonate by mucosal metabolism and an increased permeability of the mucus layer for bicarbonate diffusion. This capacity of the mucosa plays an important role with the repair of the mucus layer after damage or detrimental influences. Chronic or acute infections of the GIT are associated with a reduced basal secretion rate of bicarbonate by the mucosa (Flemström & Isenberg, Reference Flemström and Isenberg2001). Damage of the stomach mucosa alone seems insufficient to provoke an infection, but it may be in combination with additional factors such as metabolic acidosis or reduced bicarbonate secretion (Allen et al. Reference Allen, Flemstrom, Garner and Kivilaakso1993). Finally, regulation of the intracellular pH of epithelial cells is closely associated with intensive ion transport. Particularly the Na+–H+ anti-transporter seems involved, but only in the case of a high acid load in the lumen or when bicarbonate secretion is insufficient to guarantee neutral intracellular pH values (Allen et al. Reference Allen, Flemstrom, Garner and Kivilaakso1993).
Immune cells and immune response
The immune system is an integral part of the GIT (Goddeeris et al. Reference Goddeeris, Boersma, Cox, Van der Stede, Koenen, Vancaeneghem, Mast, Van den Broeck, Blok, Vahl, De Lange, Van de Braak, Hemke and Hessing2002) and the majority of the immune cells in the whole body are located in the GIT. Energy costs involved in the immune response of the GIT may therefore be quantitatively far more important than that of the remainder of the body. Physically, the immune system is indistinguishable from mucosa and contributes significantly to the nutrient requirement of the GIW. The contribution of the immune response to the total energy requirements of the GIW seems more variable (from less than 10 to about 50 %) than that of the other individual functions and processes considered (Figs. 3, 4 and 7; immune response may involve cell turnover as well product synthesis; equations 7 and 8). The maximal contribution must be expected during infections and probably may become larger than that of tissue turnover and nutrient and ion transport.
Dugan et al. (Reference Dugan, Knabe and Wu1994) indicated that intra-epithelial lymphocytes (first-line defence against antigens from the diet or against pathogens) represent 15 % of the total number of cells in the GIT epithelium. A comparison with the estimation of the total number of leucocytes of 4 g/kg total body weight (Klasing & Calvert, Reference Klasing, Calvert, Lobley, White and MacRae1999) indicates that the GIT is strongly equipped with immune cells. An activation of the GIT immune system is thus expected to have a large impact on the nutrient utilisation by the GIT. For example, theoretical considerations with regard to a maximum immune response in poultry led Klasing & Calvert (Reference Klasing, Calvert, Lobley, White and MacRae1999) to conclude that about 60 % of the reduced growth performance may be explained by an increased utilisation of lysine by several components of the immune system. Other AA are involved in the synthesis of nucleic acids and peptides such as glutathione that stimulates gluconeogenesis in the liver (Klasing & Calvert, Reference Klasing, Calvert, Lobley, White and MacRae1999). Finally, the availability of preformed monomers of macromolecules such as DNA, RNA and fats may also affect nutrient utilisation by enterocytes and immune cells (Bueno et al. Reference Bueno, Torres, Almendros, Carmona, Nuñez, Rios and Gil1994; Waheed et al. Reference Waheed, Yasuzumi and Gupta1998; Webb & Bergman, Reference Webb, Bergman, Tsuda, Sasaki and Kawashima1991) during immune activation.
Large changes occur in the metabolism of intra-epithelial lymphocytes as a result of weaning and these changes may be related to a change of diet and the consequences for digesta, antigens and microbial population present in the lumen. Dugan et al. (Reference Dugan, Knabe and Wu1994) isolated intra-epithelial lymphocytes from the mucosa of the jejunum and determined the utilisation rate of glucose and glutamine on 21 (moment of weaning), 29 and 56 d of age. Extra glucose utilisation but rather unchanged glutamine utilisation was observed as a response to weaning which suggests a sparing effect on glutamine utilisation that may serve two purposes: (1) saving glutamine for the synthesis of immunologically important molecules (arginine, RNA, DNA), or (2) saving glutamine as a source of energy and as a precursor for the synthesis of citrulline. The latter seems functional because for citrulline (precursor for arginine) as well as for proline, substantial increases in production level occur after weaning (Wu et al. Reference Wu, Borbolla and Kanbe1994). Consequently, proline and arginine may be EAA for young piglets around weaning, while this is not the case at a later stage of growth. Experimental results also suggest that the profile of AA required for the immune system differs substantially from that for growth (Reeds et al. Reference Reeds, Fjeld and Jahoor1994; Klasing & Calvert, Reference Klasing, Calvert, Lobley, White and MacRae1999).
Besides the synthesis of immune cells, also IgA synthesis is an essential element of the GIT immune response (equation 8). The production of IgA, as the most important immunoglobulins secreted by the GIT, is a highly specific and central element of the immune response (Alverdy, Reference Alverdy1990) performed by specialised cells in Peyer's patches in the mucosa (Fig. 2). These IgA are resistant to enzymic breakdown, changes in temperature and pH, and thereby prevent colonisation of micro-organisms in the mucosa. Lymphocytes are released by the GIT to the blood circulation and thereby may not only reach the mucosa but may penetrate other mucosa in the body as well. The GIT-associated lymphatic system therefore plays an important regulatory role in supplying antigen-specific IgA to all kinds of mucosa. The importance of IgA for proper functioning of the GIT is underlined by the observation that IgA deficiencies are associated with a reduced barrier function of the GIT and the occurrence of infections. Contents of lysine in acute-phase proteins and IgA are comparable with that of body protein accretion, whereas contents of phenylalanine, tryptophan and threonine are higher. An increased supply of glutamine may stimulate the immune system and the presence of IgA in mucosal tissue, which in turn inhibits the translocation of bacteria via the GIW. Other AA (arginine, asparagine, aspartate, glycine, histidine, proline, serine) have a much lower stimulatory effect (10–20 % of that by glutamine; Alverdy, Reference Alverdy1990), indicating the specific role of glutamine. Burrin & Reeds (Reference Burrin and Reeds1997) indicate, however, that it is still uncertain whether glutamine serves as a source of energy or whether it fulfils more specific functions such as the stimulation and regulation of functioning of the immune system.
Gastrointestinal tract development in juveniles
Growth of juvenile animals is accompanied by a rapid development of the digestive organs (organ mass, organ length, volumes secreted). Large changes occur in the GIT and GIW to install the specialised functions of the GIT during the fetal and the postnatal period with maternal feeding and weaning (Sangild, Reference Sangild, Lindberg and Ogle2001) with very intensive cryptogenesis and proliferation. Substantial changes occur in gene expression of enzymes, transport proteins and receptors for circulating and luminal trophic factors (Perozzi et al. Reference Perozzi, Barila, Murgia, Kelly, Begbie and King1993) with a large spatial diversity in gene expression between the highest and lowest villus position, and between the proximal and distal sites in the GIW.
Functioning of the GIW is related to the secretion of hydrolytic enzymes in the membrane of the brush border and in the cytosol of enterocytes in the SI (equation 8). Feeding colostrum to newborn piglets causes a rapid increase in the content of these enzymes (Sangild et al. Reference Sangild, Silver, Schmidt, Fowden, Tumbleson and Schook1996) irrespective of the conditions of birth. The protein content of the mucosa (vmax,Nutr × QTissue in equation 3) doubled from about 100 to 200 mg protein/g mucosa at age 2 d, and the content of some brush-border enzymes strongly increased, indicative of the large changes in functioning of the GIW. Colostrum and milk contain a variety of hormones and peptides with a known stimulatory effect on cell growth and differentiation (Houle et al. Reference Houle, Schroeder, Odle and Donovan1997).
In older and weaned piglets, enzymic and morphological changes in the GIW continue and depend on the diet (ad libitum feeding v. restricted feeding, Kelly et al. Reference Kelly, Smyth and McCracken1991; dry starter feed v. milk, Pluske et al. Reference Pluske, Williams and Aherne1996). Generally, villus height is decreased and crypt depth increased with feeding dry starter feed and restricted feeding in comparison with non-weaning, milk feeding and ad libitum feeding (Pluske et al. Reference Pluske, Williams and Aherne1996; Van Beers-Schreurs, Reference Van Beers-Schreurs1996; Verdonk, Reference Verdonk2006). Effects occur at all locations in the SI and demonstrate that the type of feed may have a large impact on the functional characteristics of the GIT and probably also on the functioning and nutrient utilisation by the GIW. Additionally, specific dietary compounds may affect the functioning of the GIW. Van Leeuwen & Versantvoort (Reference Van Leeuwen and Versantvoort1999) reported that an increased dietary tannin content from faba beans caused a halving of the aminopeptidase activity in the proximal jejunum, a shift of this activity to the distal jejunum and a reduced faecal protein digestibility from 83 to 75 %.
The mechanisms underlying the diet-induced changes in the development of the GIW in juveniles are highly complex (Buddington, Reference Buddington1998; Jensen, Reference Jensen1998) because of interactions between digestion, nutrient supply, GIW development and the resident microflora (Maxwell & Stewart, Reference Maxwell, Stewart and Varley1995). Several studies have been performed to study the effect of supplementing single nutrients in piglet diets. Ewtushik & Ball (Reference Ewtushik and Ball1998) showed stimulating effects of arginine and glutamine on duodenal weight, duodenal mucosa weight, mucosa width, villus height and crypt depth. Nucleotides may serve as preformed monomers for DNA and RNA synthesis by a nutrient-sparing metabolic route in tissues with an intensive nucleotide synthesis rate, and hence benefit animals during the period of weaning. Results of Bueno et al. (Reference Bueno, Torres, Almendros, Carmona, Nuñez, Rios and Gil1994) demonstrated that nucleotide supplementation in rats that recovered from diarrhoea increased the villus height:crypt depth ratio, whereas the number of goblet cells and intra-epithelial lymphocytes were increased and reduced respectively in the duodenum, jejunum and ileum. These results suggest that nucleotides stimulated the recovery of the GIT from diarrhoea although recovery appeared still incomplete after 14 d. Furthermore, polyamines may be a direct source of energy for the GIT during growth or fasting. In contract to Bueno et al. (Reference Bueno, Torres, Almendros, Carmona, Nuñez, Rios and Gil1994), Bardocz et al. (Reference Bardocz, White, Grant, Walker, Brown, Pusztai, Piva, Bach-Knudsen and Lindberg2001) showed that increased uptake of polyamines was accompanied by an increase in GIT weight and length (QTissue), and in protein, RNA and DNA content of SI mucosa (representative of synthetic capacity and tissue turnover rate; equations 7 and 8).
The physiological state of the animal will strongly determine GIT development. Conditions of catabolic stress may lead to (villus) atrophy, which is detrimental for the barrier function and increases the translocation of bacteria. McCauley et al. (Reference McCauley, Heel, Christiansen and Hall1996) established a positive effect on total GIT weight and mucosa width of an increasing amount of rat feed offered in addition to parental feeding. Also, infection affects the functioning of the GIT as demonstrated by Nabuurs (Reference Nabuurs1997) who compared GIT morphology in weaned littermates from groups with mortality, without mortality and free of pathogens. Such results indicate the interaction between mucosal morphology and development, and the microbial population in the lumen. A close relationship was suggested between the occurrence of diarrhoea and mucosa proliferation in weaned piglets.
Collective term of ‘endogenous loss’
The term ‘endogenous’ is used as a collective term for the compounds which leave the SI with digesta, but which are not directly of feed origin. This fraction contains microbial material and material originating from the GIW that remained undigested in the SI. The lack of quantitative knowledge on the effect of GIW metabolism, of recycling between the GIW and lumen is seen as a major limitation to estimate the contribution of GIW metabolism to endogenous protein and to whole-animal AA metabolism (Reeds et al. Reference Reeds, Burrin, Stoll, Van Goudoever, Lobley, White and MacRae1999). Various experimental techniques are applied (for an extensive review, see Fuller & Reeds, Reference Fuller and Reeds1998). Measurements do indicate, however, that an important and highly variable part of ileal outflow of N is of endogenous origin (35 to 60 %). Physical and chemical characteristics of digesta are co-determinant for the rate and extent of hydrolysis of proteins and carbohydrates by digestive enzymes, and probably the same holds for endogenous compounds.
Hormonal regulation and physiological status
Gastrointestinal tract growth
Growth of the GIT is primarily driven by nutrient supply and GIT mass, and an adaptation of the GIT to enzymic v. fermentative digestion. Hormonal factors seem to have no regulatory function other than facilitating nutrient utilisation and GIT growth (Reeds et al. Reference Reeds, Burrin, Stoll, Van Goudoever, Lobley, White and MacRae1999). For example, ad libitum v. meal feeding exposes the GIT to different peak loads of digesta and nutrients. The highest load with meal feeding may result in a stronger endocrine regulation of nutrients fluxes, a heavier GIT, an increased nutrient utilisation by the GIT, and a lighter carcass (Dawson, Reference Dawson, Lobley, White and MacRae1999).
Gastrointestinal tract as an endocrine organ
The GIT is the largest endocrine organ of the body. There seems to be no clear distinction between the neuroendocrine and immune system of the GIW because of the many interactions (Shanahan, Reference Shanahan, Johnson, Alpers, Christensen, Jacobson and Walsh1994) instead of clear independent functions of cytokines, growth factors, local hormones and peptides. Hormone-producing cells are located in the mucosa of the stomach, SI and LI. The physiological purpose of these gut hormones (incretins) is to adjust the capacity of digestion and to facilitate the endocrine regulation in peripheral tissues in relation to size and composition of the meal. Incretins modulate GIT functioning (kinetics of digestion), the sensation of saturation (via the central nervous system), and the efficiency of hormonally (insulin) regulated glucose, AA and fat metabolism by peripheral tissues of the body. The net result of incretins on nutrient utilisation by the GIT remains hard to quantify because of the multiple functions and targets and is probably highly dependent on diet composition and feeding strategy. There are indications that incretins have the potential to shift the utilisation of nutrients from arterial blood to the lumen (Deveney & Way, Reference Deveney, Way, Greenspan and Forsham1986). Such a shift might have consequences for the type of nutrient utilised by the GIT. Incretins such as epidermal growth factor (Allen et al. Reference Allen, Flemstrom, Garner and Kivilaakso1993) affect mitosis in the mucosa. The regulatory role consists of the stimulation of cell proliferation and the initiation of repair mechanisms after damage to the mucosa of the stomach or duodenum, and inhibits the secretion of acid in the stomach.
Gastrointestinal tract as target organ
In normally fed and healthy animals, physiological concentrations of insulin, insulin-like growth factor 1 and growth hormone have no effect on growth and protein synthesis in the serosal and mucosal layer of the SI wall. Effects of these hormones only become apparent with extremely low concentrations in situations of prolonged fasting or with surgical stress when the GIT is in a catabolic state. A potential influence of prolactin, somatotropin and thyroid hormone on AA transport systems is mentioned, however (Rérat et al. Reference Rérat, Vaissade and Vaugelade1991). In the case of prolactin this would mean that at the onset of lactation an adaptation of AA transport systems in the mucosa would occur, affecting the rate and extent of transport and metabolism of nutrients. This aspect may be of particular interest for nutritional requirements of lactating sows (and nursed piglets) and dairy cows in early lactation.
During infection or GIT trauma, cytokines and prostaglandins induce a state of anorexia with low feed intake and a reduced utilisation of nutrients by the GIT. During a stress response, the release of catecholamines leads to a reduced arterial blood supply to the GIT in favour of the brain. Long-term stress strongly reduces the metabolism of the GIT and continuation of this stress for a too long a period may cause damage to the GIT. Recovery from this damage leads to an increased nutrient utilisation by the GIT (Gruys et al. Reference Gruys, Toussaint, Landman, Tivapasi, Chamanza, Van Veen and Wensing1998) comparable with the compensatory growth observed in animals recovering from underfeeding.
Physiological concentrations of insulin are required for maintaining a normal protein synthesis in the mucosa of the SI. Shortage of insulin (type I diabetes) reduces the FPSR in mucosal cells by 30 %. For all effects of insulin on the GIT the assumption holds that a certain maintenance dose of insulin is necessary for a normal functioning of metabolism but that further stimulation by insulin is impossible (Charlton et al. Reference Charlton, Ahlman and Nair2000). There is no effect of growth hormone on enzymes in the SI that regulate the degradation of AA. The indirect effect (as with insulin) is that growth hormone reduces the AA concentrations in arterial blood and hence their arterial supply to the GIT (Bush et al. Reference Bush, Wu, Suryawan, Nguyen and Davis2002). Glucocorticoids (cortisol) released with stress stimulate the intracellular breakdown of arginine and glutamine in enterocytes. Flynn & Wu (Reference Flynn and Wu1997) observed an increased appearance of metabolites of arginine and glutamine of 50 % or more when pharmacological doses of cortisol were applied. Under more physiological conditions (long-term stress) similar effects are expected.
Net nutrient fluxes in portal blood
A combined measurement of feed digestion and net portal fluxes of nutrients delivers insight into the nutrient supply to (via lumen and arterial blood) and the nutrient utilisation by the PDV. Higher nutrient concentrations in portal blood than in arterial blood indicate net appearance of that nutrient (MacDonald, Reference MacDonald1999). The dietary source of glucose and AA determines the kinetics and extent of digestion and the percentages of these nutrients appearing in portal blood. There are indications of interactions between glucose and AA and among individual AA in their utilisation by the GIW (Van der Meulen & Jansman, Reference Van der Meulen and Jansman1997). Furthermore, nutrient appearance in portal blood depends on the site and extent of digestion in the GIT and the kinetics of absorption (Jansman et al. Reference Jansman, Van Leeuwen, Grala, Haaksma, LaPlace, Fevrier and Barbeau1997). As well as the GIW, visceral fat tissue also influences the apparent nutrient utilisation by the PDV. The weight of visceral fat in dairy cows, for example, varies substantially depending on the stage of lactation (Baldwin, Reference Baldwin1995).
Net portal fluxes of nutrients indicate the net nutrient utilisation or appearance, whereas measurement of unidirectional fluxes by isotopic techniques gives more information on the mechanisms involved. Stoll et al. (Reference Stoll, Burrin, Henry, Yu, Jahoor and Reeds1999) observed in piglets that the first-pass utilisation by the PDV of nutrients supplied by arterial blood and from the lumen was 7 and 6 % for glucose and 20 and 94 % for glutamine, and contributed to 15, 29, 19 and 36 % of the production of CO2 by the PDV, respectively, and to 75 % of the total apparent energy requirement of the PDV. Glucose supplied from the lumen contributed to 18 and 31 % of the portal appearance of alanine and lactate. Furthermore, roughly a third of the supply of EAA from the lumen was utilised by the PDV on first pass through the GIW (35, 32, 35 and 61 % for lysine, leucine, phenylalanine and threonine). For most EAA the PDV utilisation of the arterial supply covered 75 % or more of the total utilisation. Only 12 to 21 % of the total utilisation was retrieved as mucosal protein, suggesting that EAA catabolism played a much more important role than incorporation in proteins.
The fate of AA supplied by arterial blood and from the lumen strongly varies (Burrin & Reeds, Reference Burrin and Reeds1997). Although the arterial supply of AA seems most important for nutrition of the GIW, a radical atrophy occurs when nutrition from the luminal side is absent. This may relate to the lack of nutrient supply from the lumen, but is probably also the consequence of inactivity of the GIT due to absence of digesta. The presence of nutrients in the lumen is a strong stimulus for GIT growth (Reeds et al. Reference Reeds, Burrin, Stoll, Van Goudoever, Lobley, White and MacRae1999). Brush-border enzymes are thought to be synthesised preferentially from AA supplied from the lumen, whereas enterocytes in crypts preferentially use AA supplied by arterial blood. For mucus synthesis, existence of a preference is unclear.
Upon differentiation and ageing of enterocytes during their migration from crypt to villus tip, they obtain the capacity to utilise nutrients supplied from the lumen. This implies that the source of AA for protein synthesis depends on the type of cells involved and their functioning. This remains hard to verify, however, as long as combined measurements of specific functions of the GIW and of unidirectional fluxes of AA are lacking.
Similar to pigs, also in ruminants substantial utilisation occurs of nutrients supplied by arterial blood, in particular of VFA. The fraction of VFA produced in the GIT that appears in portal blood is therefore a clear overestimation of the extent of metabolism during transport from rumen to blood.
Huntington et al. (Reference Huntington, Reynolds and Tyrrell1983) and Kristensen et al. (Reference Kristensen, Danfaer and Agergaard1996a,Reference Kristensen, Danfær, Tetens and Agergaardb) reported 31–35 % utilisation of acetate at low rates of supply by arterial blood. The rate of acetate utilisation increased with arterial supply but eventually saturated at about 20 % of the supply rate. Acetate may be an important energy source for the GIW and also for visceral fat. There are indications of acetate and butyrate utilisation for de novo lipogenesis in epithelial cells (Zambell et al. Reference Zambell, Fitch and Fleming2003). Besides acetate, PDV utilises butyrate and β-OH-butyrate (Kristensen et al. Reference Kristensen, Pierzynowski and Danfaer1999) and large quantities of β-OH-butyrate become available from butyrate metabolism during transport from the rumen to portal blood (Rémond et al. Reference Rémond, Ortigues and Jouany1995).
Net portal fluxes in pigs
Glucose
The effect of the kinetics of starch digestion on the percentage of this starch appearing in portal blood as glucose seems consistent. A compilation of six experiments using growing pigs, presented in Table 5, indicates that a lower percentage of digested starch is recovered as a net portal flux of glucose when starch digestion is slower. Besides the type of starch source, also the PDV mass may affect the percentage of starch retrieved as glucose in portal blood. Assuming that GIT weight is correlated with pig weight, the results indicate that the fraction of digested starch appearing as net portal flux of glucose is larger in lighter pigs (experiments 1 and 2) compared with heavier pigs (experiments 3 and 4). In experiments 1 and 2 a larger proportion of maize starch consumed was recovered as net portal flux of glucose than in experiments 3 and 4. Differences among experiments are small and hence not conclusive.
Influence of type and amount of glucose (GLU) source and body weight on the net portal flux of GLU in growing pigs

NA, not available; MAS, maize starch; RPS, raw pea starch; GWS, gelatinised wheat starch; RTS, raw tapioca starch; SUC, sucrose; RPotS, raw potato starch; PS < , pea starch less than maize starch; PS>, pea starch more than maize starch); W, wheat; B, barley; M, maize.
* Experiment 1, Van der Meulen et al. (Reference Van der Meulen, Bakker, Smits and De Visser1997b); experiment 2, Van der Meulen & Smits (Reference Van der Meulen, Smits, Laplace, Février and Barbeau1997); experiment 3, Rérat et al. (Reference Rérat, Vaissade and Vaugelade1984a,Reference Rérat, Vaissade and Vaugeladeb); experiment 4, Van der Meulen et al. (Reference Van der Meulen, Bakker, Bakker, De Visser, Jongbloed and Everts1997a); experiment 5, AJM Jansman (personal communication); experiment 6, Rérat (Reference Rérat1988).
† Calculated from Van der Meulen et al. (Reference Van der Meulen, Bakker, Smits and De Visser1997b) assuming a digestible energy value of 15 MJ/kg and a feed intake of 870 kJ/(body weight0·75).
Part of the differences in the portal appearance of glucose can be related back to lactate formation. In experiment 1 (Table 5) about 20 % of the apparent glucose utilisation by the PDV was attributed to lactate formation and in experiment 2 it was established that a higher PDV utilisation of glucose was accompanied by less lactate formation. It seems, therefore, that lactate is not a main explanation of variation in glucose metabolism by the PDV.
Protein
Small peptides as well as free AA may be transported into cells (Webb & Bergman, Reference Webb, Bergman, Tsuda, Sasaki and Kawashima1991), but probably the main part of these peptides is hydrolysed by the GIW and enters metabolism or appears in portal blood as free AA. The dietary source of digestible protein influences the kinetics of protein digestion and AA absorption, and thereby the type and the quantity of AA appearing in portal blood. Seven experiments are summarised in Table 6 and demonstrate that generally the percentage of ileal digested protein recovered as net portal flux of AA decreased with a slower protein digestibility. In experiment 9 the low protein content of the diet probably was responsible for a recovery percentage below 50 %. Effects of body weight on PDV AA utilisation were not consistent (Table 6). The results suggest that with a slower protein digestibility the utilisation of AA by PDV intensifies, and that the presence of glucose has a sparing effect on AA metabolism.
Influence of protein source, amount of protein source and body weight on net portal flux of protein in growing pigs

SC, soya concentrate; SM; soya meal; RSE, rapeseed expeller; RSH, rapeseed hulls; LM, lucerne meal; WGM, wheat gluten meal; WM, wheat middlings; PP, potato protein; FAA, free amino acids; PEP, partly hydrolysed milk protein; FM, fish meal; CAS, casein; AA, amino acids; NEAA, non-essential AA; EAA, essential AA.
* Experiment 1, AJM Jansman (personal communication); experiment 2, J Van der Meulen (personal communication); experiment 3, AJM Jansman (personal communication); experiment 4, Van der Meulen et al. (Reference Van der Meulen, Bakker, Smits and De Visser1997b); experiment 5, Rérat et al. (Reference Rérat, Simoes-Nunes, Mendy, Vaissade and Vaugelade1992); experiment 6, Rérat (Reference Rérat, Jung and Kandé1988a); experiment 7, Lenis et al. (Reference Lenis, Bikker, Van der Meulen, Van Diepen, Bakker and Jongbloed1996).
† Calculated assuming 85 % ileal digestibility of protein.
Apart from the source of protein, the amount of ileal digestible protein is also a major determinant of the recovery of AA in portal blood. In experiment 6 the amount of a single protein source was varied and it indicated that recovery reduces with an increased amount of AA digested. However, other dietary conditions or protein sources might lead to different results.
AA metabolism by the GIW is not limited to NEAA because it has been shown that extensive catabolism of EAA occurs (Windmueller & Spaeth, Reference Windmueller and Spaeth1980). Intragastric infusions of EAA in piglets of age 28 d led to a recovery of 56 % of these AA in portal blood (Stoll et al. Reference Stoll, Henry, Reeds, Yu, Jahoor and Burrin1998). Table 7 shows the appearance of total, EAA and NEAA recovery for the experiments presented in Table 6. It appears that there is an extensive utilisation of glutamine and glutamate reflected by negative apparent appearances of glutamine and glutamate in portal blood when expressed as a percentage of the ileal digested amounts. Of the EAA, an average of 75 % of lysine, leucine and phenylalanine is recovered in portal blood. This implies that a net 25 % of the amounts absorbed from the lumen is metabolised, which is lower than the 35 % estimated by Stoll et al. (Reference Stoll, Henry, Reeds, Yu, Jahoor and Burrin1998) for piglets. The utilisation of EAA seems to decrease with age, and PDV and GIT weight.
Portal appearance of individual amino acids (AA) in the pig trials presented in Table 6

SC, soya concentrate; SM, soya meal; RSE, rapeseed expeller; RSM, rapeseed meal; LM, lucerne meal; WGM, wheat gluten meal; WM, wheat middlings; PP, potato protein; FAA, free AA; FM, fish meal; CAS, casein.
* Experiment 1, AJM Jansman (personal communication); experiment 2, J Van der Meulen (personal communication); experiment 3, AJM Jansman (personal communication); experiment 4, Van der Meulen et al. (Reference Van der Meulen, Bakker, Smits and De Visser1997b); experiment 5, Rérat et al. (Reference Rérat, Simoes-Nunes, Mendy, Vaissade and Vaugelade1992); experiment 6, Rérat (Reference Rérat1988a); experiment 7, Lenis et al. (Reference Lenis, Bikker, Van der Meulen, Van Diepen, Bakker and Jongbloed1996).
† Calculated assuming 85 % ileal protein digestibility.
Fermentable carbohydrates
Fermentable carbohydrates in pig diets stimulate an intensive microbial fermentation in the LI, and to some extent in the SI. Lactate is produced in the proximal part of the intestine (stomach and SI) whereas VFA are the principal products in the LI (Bakker, Reference Bakker1995). The fermentation capacity of the LI is substantial (Bakker, Reference Bakker1995), whereas that of the SI seems limited.
In experiment 5 (Table 5) 25 % of digestible maize starch and slowly fermentable cellulose was replaced by well-fermentable beetpulp and wheat middlings. Roughly, the portal appearance of VFA and lactate doubled, and substantial shifts occurred in the type of VFA released (acetate, from 65 to 53 %; propionate, from 30 to 39 %; butyrate, from 5 to 8 %). The increased rate of butyrate synthesis might have consequences for the metabolic activity and proliferation of epithelial tissues and the nutrient requirements of the GIW. Replacement of maize starch by potato starch in experiment 4 (Table 5) increased butyrate but not propionate. Studies by Rérat (Reference Rérat1996) showed a tendency to increased propionate formation with feeding increased amounts of fermentable carbohydrate to pigs. Despite similar amounts of glucose digested, a lower percentage was recovered in portal blood with a stimulation of microbial fermentation and increasing VFA yields. Rérat (Reference Rérat1996) concluded that the contribution of VFA to the energy metabolism of the pig remains limited to some 2 to 6 % and does not compensate for the reduced contribution of glucose (5 to 10 % reduction in metabolisable energy with 6 to 16 % fermentable carbohydrates in dietary DM). These results suggest that a substantial increase in PDV utilisation of VFA occurs when carbohydrate fermentation in the GIT is stimulated.
Interactions between glucose, amino acids and volatile fatty acids
It is often emphasised that there are strong interactions between AA, glucose and VFA concerning their supply to the PDV, the extent of their utilisation by the PDV and their net appearance in portal blood. Experimental results of Rérat (Reference Rérat1988, Reference Rérat1996) and Rérat et al. (Reference Rérat, Simoes-Nunes, Mendy, Vaissade and Vaugelade1992) support the existence of such interactions. In the absence of carbohydrates, AA appear much faster in portal blood, independent of the form these AA are supplied to the GIT. The presence of carbohydrates retards the appearance of infused AA up to 5 h. There is competitive inhibition among glucose and AA and among individual AA for their transport by carriers (Vinardell, Reference Vinardell1990). These processes are enzymically driven and the competitive inhibition is concentration dependent as described for amino transport by the udder by Maas et al. (Reference Maas, France, Dijkstra, Bannink and McBride1998). Since the capacity to transport glucose and AA varies with the site in the GIT, a distinction between duodenum, jejunum and ileum seems necessary (Rérat et al. Reference Rérat, Simoes Nunes, Mendy and Roger1988b). In this respect, the variation in the kinetics of digestion of starch and protein sources is of importance as well. Measurements in portal blood indicate that in general glucose appears faster than AA (maximal glucose and AA flux within 1 and 2–6 h after a meal; experiments 4 and 5).
Net portal fluxes in ruminants
Glucose
The fraction of starch, resistant to rumen fermentation and digested in the SI, that is recovered as a net portal flux of glucose in growing beef steers ranges from 0·3 to 0·7 (Reynolds et al. Reference Reynolds, Sutton, Beever, Garnsworthy and Wiseman1997; Kreikemeier et al. Reference Kreikemeier, Harmon, Brandt, Avery and Johnson1991; Kreikemeier & Harmon, Reference Kreikemeier and Harmon1995). The results of these studies indicate that a larger amount of digested starch increases the appearance of glucose in portal blood as well. Other studies confirm this, however, and even demonstrated a net glucose uptake by the PDV (Lozano et al. Reference Lozano, Theurer, Alio, Huber, Delgado-Elorduy, Cuneo, DeYoung, Sadik and Swingle2000). In lactating cows, the net portal flux of glucose is limited or negative (Huntington & Reynolds, Reference Huntington and Reynolds1986; Reynolds et al. Reference Reynolds, Huntington, Tyrrell and Reynolds1988). Experimental evidence of ruminants is inconclusive whether the post-rumen digestion of starch may lead to a substantial increase in net portal appearance of glucose. Although methodological problems may have contributed to the inconsistent results reported in the literature, it seems that under a wide range of diets and physiological conditions there may be a net uptake of glucose by the PDV despite large quantities of starch offered to the SI (Reynolds et al. Reference Reynolds, Sutton, Beever, Garnsworthy and Wiseman1997). Glucose utilised by the PDV may be absorbed from the lumen or supplied by arterial blood. With infusions of starch in the abomasum Harmon et al. (Reference Harmon, Richards, Swanson, Howell, Matthews, True, Huntington, Gahr, Russell, Chwalibog and Jakobsen2001) established a 132 % increase in the utilisation of glucose supplied by arterial blood, which was equivalent to 20 % of the total amount of glucose units infused. There is still doubt whether the PDV or GIW in ruminants has a similar preference for utilisation of glucose from arterial blood under various circumstances as observed in pigs. Furthermore, the portal retrieval of glucose always seems higher with abomasal infusions of glucose than with starch (Huntington & Reynolds, Reference Huntington and Reynolds1986), which can be explained by the extensive and fast absorption of glucose in the proximal duodenum and the need to digest starch first before glucose can be absorbed in the jejunum and ileum (Reynolds et al. Reference Reynolds, Sutton, Beever, Garnsworthy and Wiseman1997). In this respect, variation in the kinetics and the site of starch digestion and glucose absorption affects the regulation mechanisms of glucose utilisation by the PDV (GIW and visceral fat) and, as a result, causes variation in the fraction of digested starch recovered as glucose in portal blood.
Protein
Intestinal digestion of feed proteins resistant to rumen fermentation may affect the profile of AA absorbed to portal blood. However, the main part of protein digested in the SI is of microbial origin and this has a less variable AA composition than feed protein (Reynolds et al. Reference Reynolds, Sutton, Beever, Garnsworthy and Wiseman1997). The supply of digestible AA to the intestine of ruminants depends more on the amount of microbial protein synthesised in the rumen than on feed protein resistant to rumen fermentation, and basic elements to predict microbial protein synthesis in the rumen are well defined (Dijkstra et al. Reference Dijkstra, Mills and France2002). Recovery of EAA, NEAA and total AA absorbed from the intestine in lactating cows as a net portal flux was 61, 38 and 49 % (Berthiaume et al. Reference Berthiaume, Dubreuil, Stevenson, McBride and Lapierre2001; Table 8). Net mesenteric fluxes were 62, 102 and 77 % higher than net portal fluxes, indicating that tissues of the stomachs and the intestines utilised similar amounts of AA. Predominantly glutamine, glutamate and aspartate are utilised by enterocytes (Britton & Krehbiel, Reference Britton and Krehbiel1993). Other in vivo observations indicate the effects of nutritional factors on AA utilisation by tissues of the stomachs (diet specificity; Reynolds & Huntington, Reference Reynolds and Huntington1988a) and by the PDV (effects of VFA; Krehbiel et al. Reference Krehbiel, Harmon and Schnieder1992; Nozière et al. Reference Nozière, Martin, Rémond, Kristensen, Bernard and Doreau2000; Gross et al. Reference Gross, Harmon and Avery1990a). In an overview of several in vivo trials, Huntington (Reference Huntington1990) suggested that less than 50 % of AA absorbed is utilised by the PDV in lactating cows, about 50 to 60 % in heifers, and 60 to 75 % in steers.
Disappearance from the gastrointestinal tract and the appearance (g/d) of essential amino acids (EAA), non-essential amino acids (NEAA), total amount of amino acids (TAA) in the mesenteric vein (MDV) and portal vein (PDV) and in milk of dairy cows (after Berthiaume et al. Reference Berthiaume, Dubreuil, Stevenson, McBride and Lapierre2001)
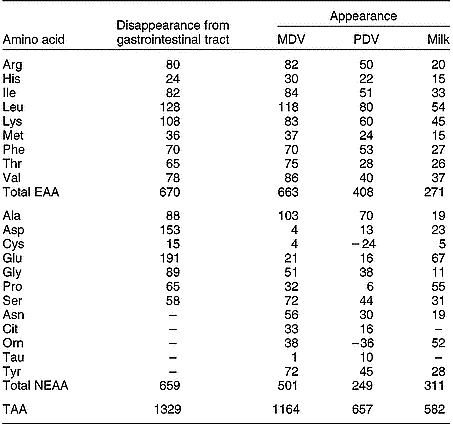
Volatile fatty acids
The net flux of VFA appearing in portal blood strongly depends on VFA production rates in the rumen. Studies in which VFA supply was varied by intraruminal infusions demonstrated that a considerable fraction of this supply is not retrieved as a net portal flux of VFA. Infused acetate in dry cows (Huntington et al. Reference Huntington, Reynolds and Tyrrell1983), propionate in steers (Seal & Parker, Reference Seal and Parker1994) and butyrate in steers (Krehbiel et al. Reference Krehbiel, Harmon and Schnieder1992) was recovered as a net portal flux for 69, 78 and 40 % (in the latter case 26 % as butyrate and 14 % as β-OH-butyrate). These observations on VFA utilisation by the PDV deviate from the general estimates of 70, 50 and 10 % for acetate, propionate and butyrate as presented in reviews (Bergman, Reference Bergman1990; Bugaut, Reference Bugaut1987). These differences illustrate that the fraction of VFA recovered as net portal flux varies strongly with nutritional conditions and status of the GIW (Bergman, Reference Bergman1990; Britton & Krehbiel, Reference Britton and Krehbiel1993), which has already been discussed (Table 3). Again, it is unlikely that a constant fraction of VFA produced in the GIT is utilised by the PDV over a wide range of nutritional and physiological conditions (Bannink et al. Reference Bannink, Kogut, Dijkstra, France, Tamminga, Van Vuuren, McNamara, France and Beever2000). For accurate estimates of gluconeogenesis in a lactating cow, accurate estimates of the propionate flux are important, however, and estimates of Bergman (Reference Bergman1990) seem inapplicable for that purpose.
Interactions between glucose, amino acids and volatile fatty acids
Intermediary metabolism in ruminants is driven more strongly by VFA than that in single-stomached animals. The competition between nutrients for utilisation by the PDV and GIW implies that with changes in the intraluminal and arterial concentrations of glucose, AA and VFA the intracellular concentrations and the preference for the utilisation of specific nutrients by the GIW might change. When identifying the interactions between nutrients, GIT compartments exposed to large and small amounts of VFA have to be distinguished. Metabolic activity of tissues in the wall of the forestomachs and the LI depend heavily on VFA for their energy requirement, tissues in the wall of the SI on glucose and AA, and visceral fat on acetate. With combined measurements of the net portal and net mesenteric fluxes it becomes apparent that the SI utilises large amounts of glucose (Reynolds & Huntington, Reference Reynolds and Huntington1988a,Reference Reynolds and Huntingtonb) as well as AA (Reynolds & Huntington, Reference Reynolds and Huntington1988a,Reference Reynolds and Huntingtonb; Berthiaume et al. Reference Berthiaume, Dubreuil, Stevenson, McBride and Lapierre2001). Whether kinetics of digestion, nutrient absorption and arterial nutrient supply to the GIW have similar implications on the nutrient preference by the PDV, as discussed for single-stomached animals, needs further investigation.
Conclusions
Physiological and metabolic functions of the GIT affect nutrient requirement of the GIW and therefore it is necessary to quantify and model GIT functioning to predict nutrient supply from diets to peripheral and productive organs. As an organ with multiple compartments and physiological functions, the GIT strongly adapts to varying nutritional and physiological conditions with high metabolic costs. The impact of GIW metabolism on whole-body metabolism is profound with respect to protein turnover, ion transport, and costs of the immune response of the animal. The relative contribution of each of these functions or processes, as well as that of mucus and enzyme secretions, depends on the nutritional and physiological state of the GIT and may change strongly with changed conditions. For an improved quantification of the metabolic activity of the GIW, the kinetics need to be studied of the digestive processes, of the intraluminal microbial activity, of the absorption of nutrients, of the arterial supply of nutrients, and of the specific metabolic functions of the GIW. Compartments of the GIT with their own specialised functions need to be distinguished. Under suboptimal circumstances such as infections, or with strongly varying nutritional conditions, nutrient utilisation by the GIW may be extensive compared with whole-body nutrient utilisation. A modelling approach seems indispensable to delineate the complexity of interactions between GIW functioning and nutrient metabolism by the GIW.
Acknowledgements
The present review was partly financed by the Dutch Commodity Board of Feedstuffs.



