





Plant-based diets include a variety of dietary patterns that are usually characterised by a higher intake of fruits, vegetables, whole grains, legumes, seeds and nuts, with limited or no consumption of animal foods, making them rich sources of dietary fibre, antioxidants and phytochemicals(Reference Szabo, Koczka and Marosvolgyi1). In recent years, such diets have gained popularity for their potential health benefits, especially in relation to obesity and metabolic health. Studies suggest that adherence to plant-based diets can improve cardiometabolic health, as assessed by anthropometric measurements, including weight, BMI and waist circumference, as well as by clinical biomarkers such as fasting blood glucose, lipid profile, leptin, insulin and C-reactive protein(Reference Chew, Heng and Tien2–Reference Baden, Satija and Hu4). These associations contributed to a lower risk of CVD, blood pressure, type 2 diabetes mellitus and all-cause mortality(Reference Gan, Cheong and Tu3,Reference Kim, Caulfield and Garcia-Larsen5) .
However, plant-based diets are not equally healthy. The quality of plant food is a critical factor to appraise when assessing its health benefits, as some plant-based diets are high in refined grains, sugary drinks and processed plant foods such as French fries, potato chips, cookies, cake and donuts, which may compromise their overall health benefits(Reference Hemler and Hu6). To better examine the health benefits associated with various plant-based diets, Satija and colleagues developed graded plant-based diet indices, including the overall plant-based diet index (PDI), a healthy PDI (hPDI) and an unhealthy PDI (uPDI)(Reference Satija, Bhupathiraju and Rimm7).
Improving the quality of plant-based diet has been associated with promising changes in biomarkers related to adiposity and metabolic health(Reference Baden, Satija and Hu4). Numerous studies have supported the beneficial effect of adherence to the hPDI in improving body composition, preventing adiposity and reducing the risk of various chronic diseases(Reference Thompson, Tresserra-Rimbau and Karavasiloglou8–Reference Chen, Zeng and Qin10). Moreover, sustained adherence to the hPDI is associated with greater long-term health benefits(Reference Satija, Malik and Rimm11–Reference Chen, Schoufour and Rivadeneira13). Conversely, an increased uPDI score was associated with increased weight and impaired metabolic profiles(Reference Satija, Bhupathiraju and Spiegelman14).
It is important to note that most of this evidence is based on studies conducted in industrialised high-income countries, which limit the generalisability of these findings to other populations. Costa Rica represents a relevant setting for further comparative investigation, as food availability and cultural dietary patterns differ substantially from those in industrialised high-income countries. Beans are a staple food in the traditional Costa Rican diet, and according to the First National Nutrition Survey of Costa Rica, bean consumption reached 96·7 % in 1996(15,Reference Rodríguez and Fernández16) . This indicates that traditional dietary patterns included substantial plant-based components, which is consistent with our conceptualisation of plant-based diet quality in this population. In addition, the alarming level and the continuous increase in the obesity prevalence among Costa Rican underscore the urgency of developing effective interventions to address this challenge. Examining the associations of plant-based diets in this population can provide a valuable insight into effective nutritional interventions to mitigate obesity. Therefore, this study aims to examine the associations between various plant-based diet indices (PDI, hPDI and uPDI) scores and obesity anthropometric measurements among Costa Rican adults from 1994 to 2004.
Methods
The subjects of this study were controls from the Costa Rica Heart Study, a population-based case–control study that assessed diet and risk of myocardial infarction. A detailed description of this study was previously published(Reference Campos and Siles17). Briefly, eligible cases were adults aged 20–70 years living in the Central Valley of Costa Rica between 1994 and 2004, who were survivors of a first acute myocardial infarction. One control matched for age (±5 years), sex and area of residence was randomly selected for each myocardial infarction case survivor using information available from the National Census and Statistics Bureau of Costa Rica. Controls were excluded if they ever had an acute myocardial infarction or if they were physically or mentally unable to answer the questionnaire. The study sample is representative of the Central Valley of Costa Rica within the predefined matching factors, between 1994 and 2004. The study area covers a large range of socio-demographic characteristics. In addition, equal access to medical care for all residents helps minimise the potential for selection bias.
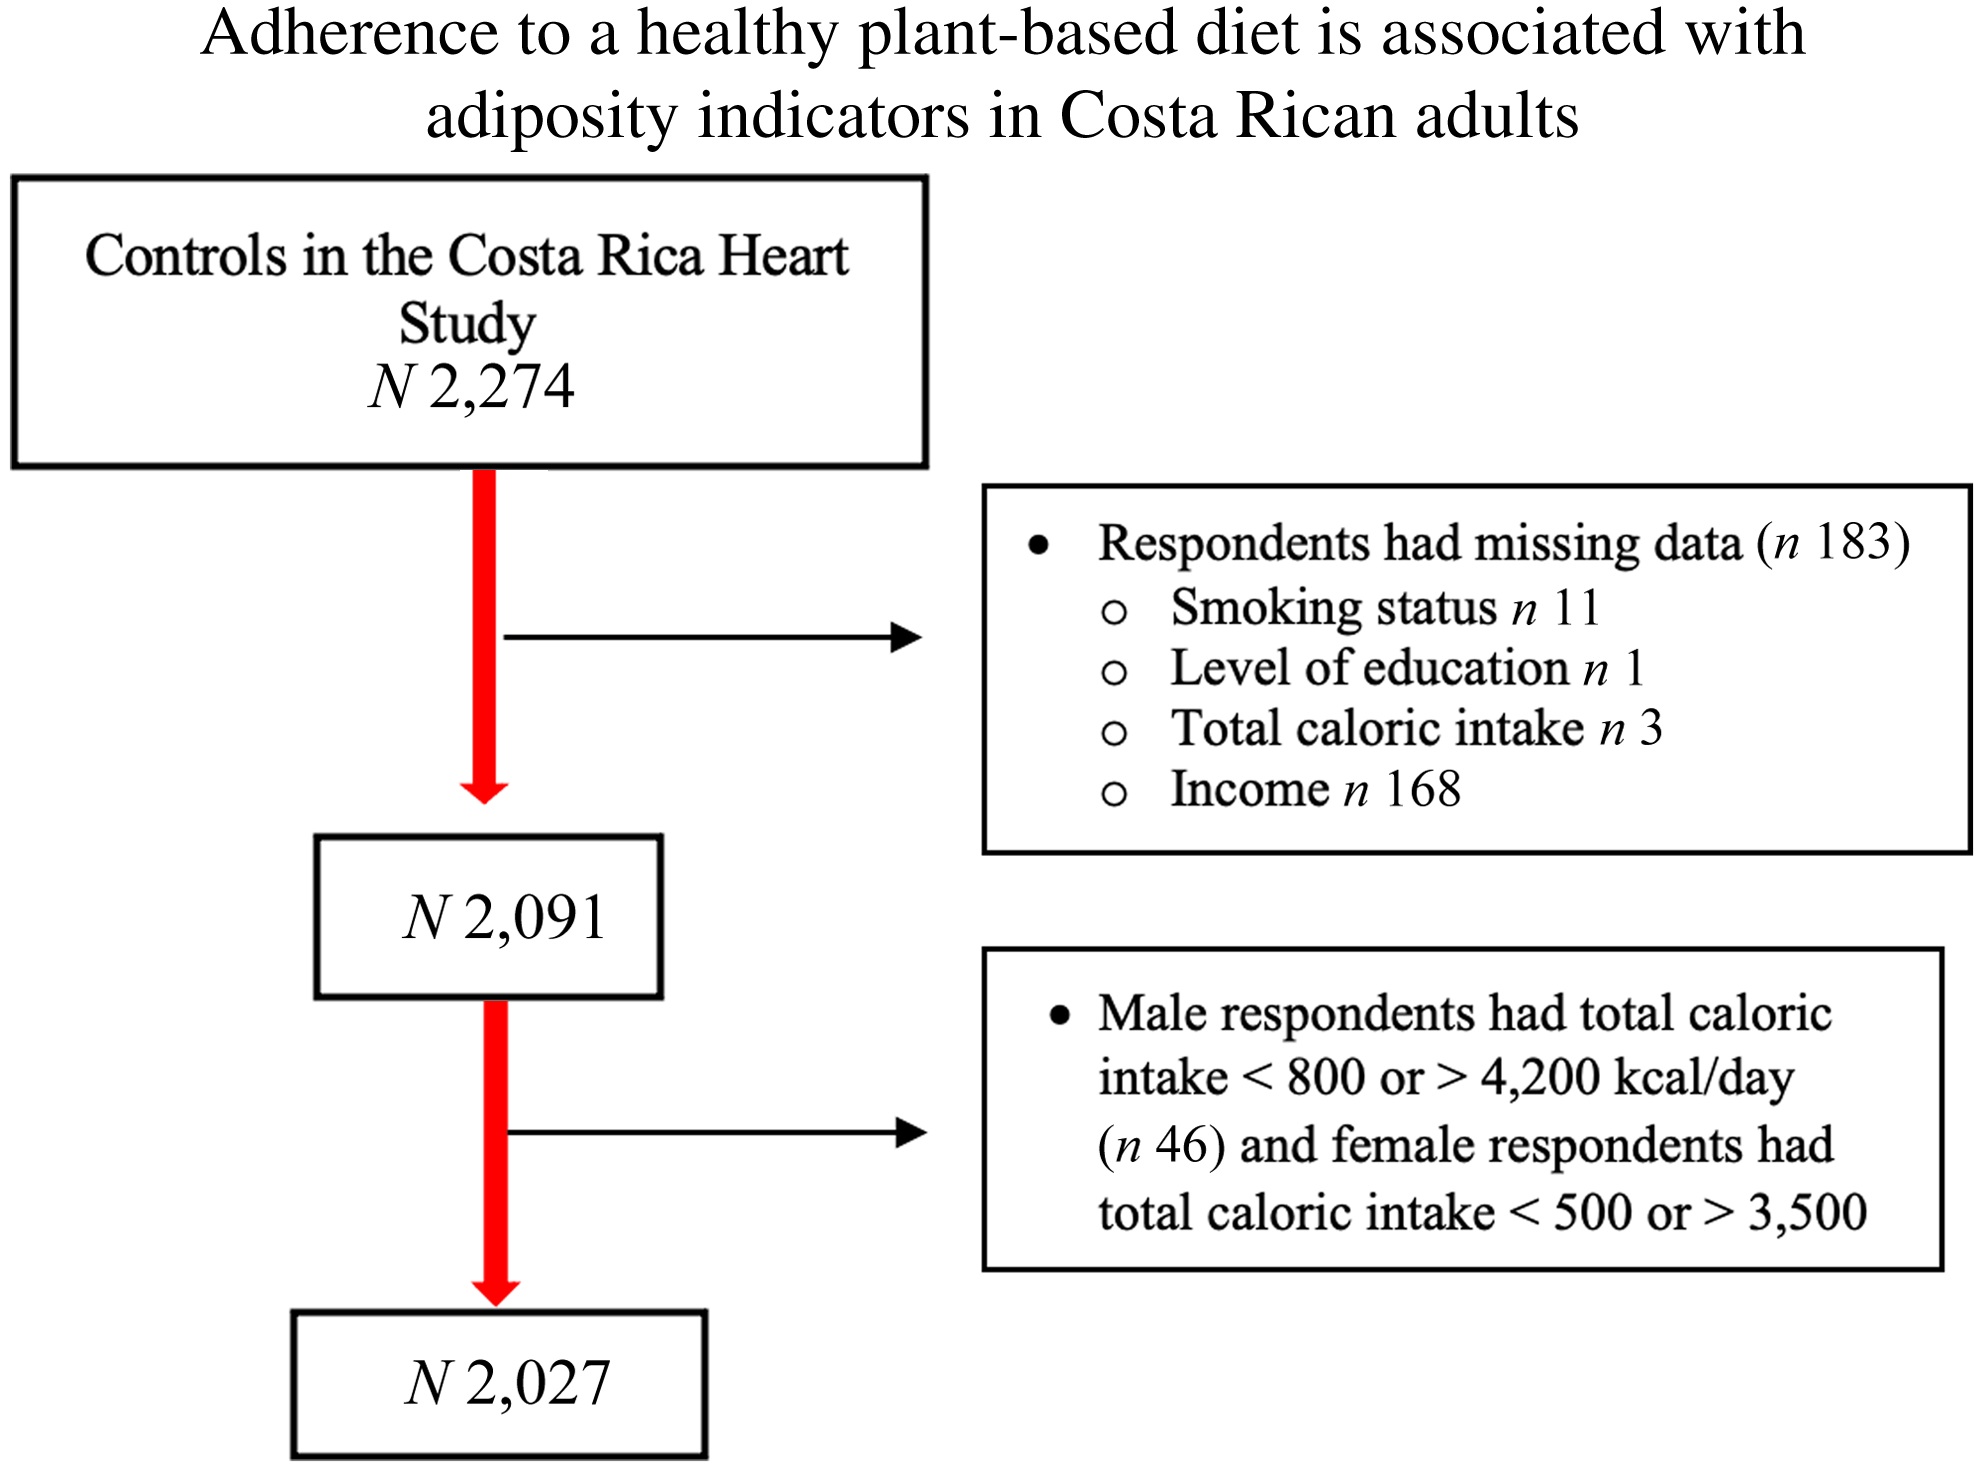
The original sample of controls consisted of 2274 subjects, of which 183 subjects were excluded for having missing data, and sixty-four subjects were excluded for extreme calorie intakes (male: if total caloric intake < 800 or > 4200 kcal/d; female if total caloric intake < 500 or > 3500 kcal/d) (Figure 1)(Reference Pimenta, Toledo and Rodriguez-Diez18). The analytical sample of this study includes 2027 subjects. Socio-demographic characteristics, socio-economic status, lifestyle characteristics, medical history, diet intake and anthropometric measurements were collected by trained personnel in the in-home interview. All subjects gave informed consent on documents approved by the Human Subjects Committee of the Harvard School of Public Health and the University of Costa Rica.
Flow chart of the analytical sample.

Dietary assessment and the plant-based diet indices
A validated 135-item semi-quantitative FFQ was used to assess dietary intake during the past year in the Costa Rican population. Responses include never or less than/month, 1–3/month, 1/week, 2–4/week, 5–6/week, 1/d, 2–3/d, 4–5/d or 6 or more/d. The USA Department of Agriculture food composition data file and analysis of Costa Rican foods were used to analyse nutrient intake.
We created three plant-based diet indices, including an overall PDI, a healthful PDI (hPDI) and an unhealthful PDI (uPDI) based on dietary data from the FFQ(Reference Satija, Bhupathiraju and Rimm7). Eighteen food groups were created and categorised based on their nutrient and culinary similarities to healthy plant foods, less healthy plant foods and animal foods. We excluded alcohol when creating these groups as it is not clearly associated in one direction with health outcomes(Reference Satija, Bhupathiraju and Rimm7). Afterwards, we ranked food groups into quintiles, and each food group was given positive or reversed scores. Positive scores range from 5 to 1 with participants above the highest quintile receiving 5 and following on through to participants below the lowest quintile who received a score of 1. Reversed scores used the inverse pattern. For the overall PDI, positive scores were given for plant food groups, and reversed scores were given for animal food groups. For the hPDI, healthy plant food groups were given positive scores, and reversed scores were given to less healthy plant food groups and animal food groups. For the uPDI, less healthy plant food groups were given positive scores, and reversed scores were given to healthy plant food groups and animal food groups. Indices were estimated by summing all eighteen food groups. Online Supplementary Table 1 shows the food items included in each food group.
Anthropometric measurements
Trained personnel collected anthropometric measurements for each subject in duplicate, with the subject wearing light clothing and without shoes. A steel anthropometer was used to measure height, and a bathroom scale (Detecto) or a Seca Alpha Model 770 digital scale (Seca) was used to measure weight. BMI was calculated by dividing weight in kilograms by height in meters squared. Waist and wrist circumference were measured in centimeters. The waist:hip ratio was calculated as waist measurement divided by hip measurement. WHO protocols were followed for all anthropometric measures.
Covariates
Covariates were selected based on priori knowledge and include age and sex, marital status, income, smoking, physical activity, total energy intake and self-reported history of diabetes and hypertension. A self-reported questionnaire with closed-ended questions was used to collect data about marital status (married or not), education (completed 14 years or more of education or not), household income ($ USA/month), current smoking status (yes/no) and medical history for diabetes and hypertension (yes/no). Physical activity was measured as metabolic equivalents (MET) by multiplying the frequency, duration and intensity of physical activity. Total energy intake was assessed using the FFQ.
Statistical analysis
We first examined the distribution of study socio-demographic and lifestyle characteristics in the total population and stratified by sex. We reported the mean (standard deviation) for continuous variables and percentages for categorical variables. Next, the Wilcoxon signed-rank test for non-normally distributed continuous variables or the sample t test for normally distributed continuous variables were used to assess the difference in the food groups intake between males and females. Additionally, we examined the distributions of socio-demographic and lifestyle characteristics by quintiles of the overall plant-based diet.
We estimated beta coefficients (β) and 95 % CI of anthropometric measurements (wrist circumference, waist circumference, waist:hip ratio and BMI) associated with quintiles of plant-based dietary intake using linear regression. In the multivariable linear regression models, we adjusted for potential confounders including age, sex, marital status, income, smoking, physical activity, total energy and self-reported history of diabetes and hypertension. Moreover, we examined the P for trend across the quintiles by modeling the quintiles as an ordinal predictor. We also assessed the 10-unit change in the continuous original plant-based dietary score. In addition to the overall analysis, we stratified by age, sex and area of residence. Data analysis was performed using the Statistical Analysis Systems software (SAS).
Results
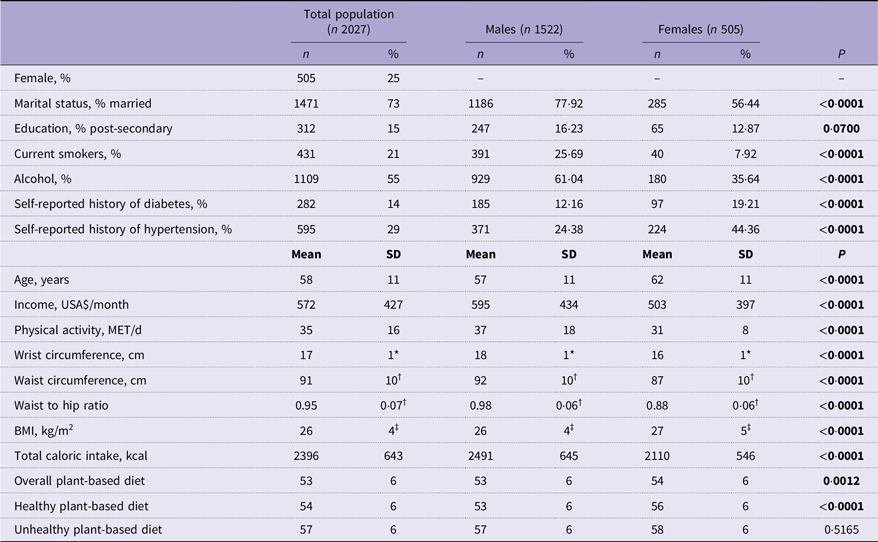
The analytical sample includes 2027 controls from the Costa Rica Heart Study. The socio-demographic and lifestyle characteristics of the analytical sample are shown in Table 1. The overall mean age was 58 (sd 11) years, with 75 % of the participants being males. Compared with females, males were younger, with the majority being married, possessing higher education and income, more likely to smoke and drink alcohol, engaged in higher physical activity and less likely to report having a diagnosis of hypertension or diabetes. However, female participants had lower waist circumference, wrist circumference and waist-to-hip ratio compared to males. The plant-based diet score ranges were 33–72 for the overall PDI, 31–74 for hPDI, and 38–77 for uPDI, with mean scores of 53 (sd 6), 54 (sd 6), and 57 (sd 6), respectively. In general, the average scores were comparable between males and females, with a higher score for hPDI among females compared with males. The total energy intake was 2491 (sd 645) kcal/d for males and 2110 (sd 546) kcal/d for females.
Socio-demographic and lifestyle characteristics of the analytical sample from the Costa Rica Heart Study

MET: metabolic equivalents.
Mean (standard deviation) and frequency (percentages) are presented for continuous and categorical variables, respectively.
Independent sample test was conducted for all continuous variables, except for income and physical activity where Wilcoxon signed-rank test was used.
Chi-square test was used for all categorical variables.
*Missing 482 (n 1545 [Males n 1159, Females n 386]); †Missing 5 (n 2022 [Males n 1520, Females n 502]); ‡ Missing 22 (n 2005 [Males n 1505, Females n 500]).
Bold values indicate statistically significant findings (p < 0.05).
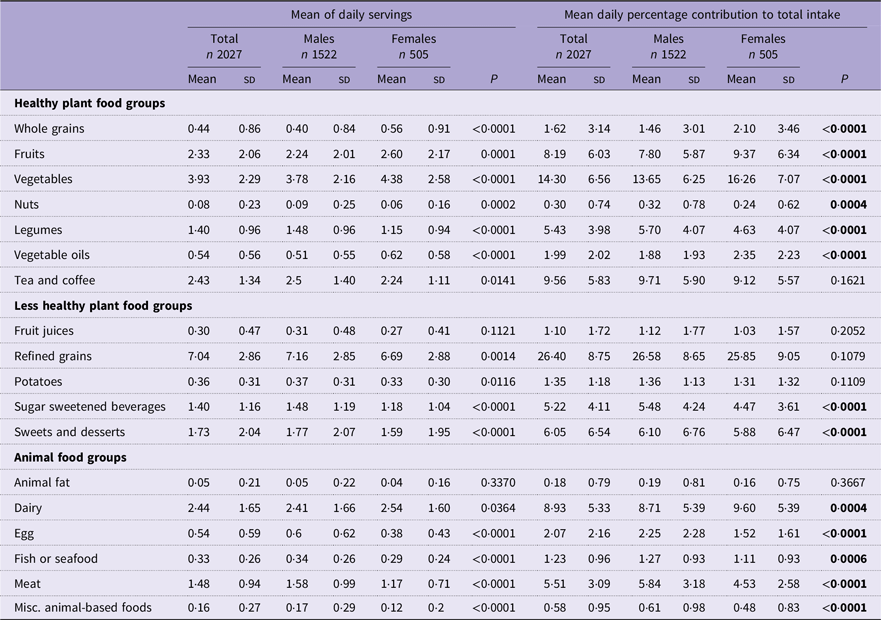
Table 2 displays the mean of the food groups intake and the percentage contribution to the total intake among the analytical sample. Overall, females had a higher intake of healthy plant-based food including whole grains, fruits, vegetables and vegetable oils, with correspondingly greater percentage contributions to total intake. In contrast, males consumed more legumes and nuts and had higher intake of less healthy plant-based foods and the animal foods including refined grains, sugar sweetened beverages, egg, fish or seafood and meat.
Food groups intake among the analytical sample from the Costa Rica Heart Study
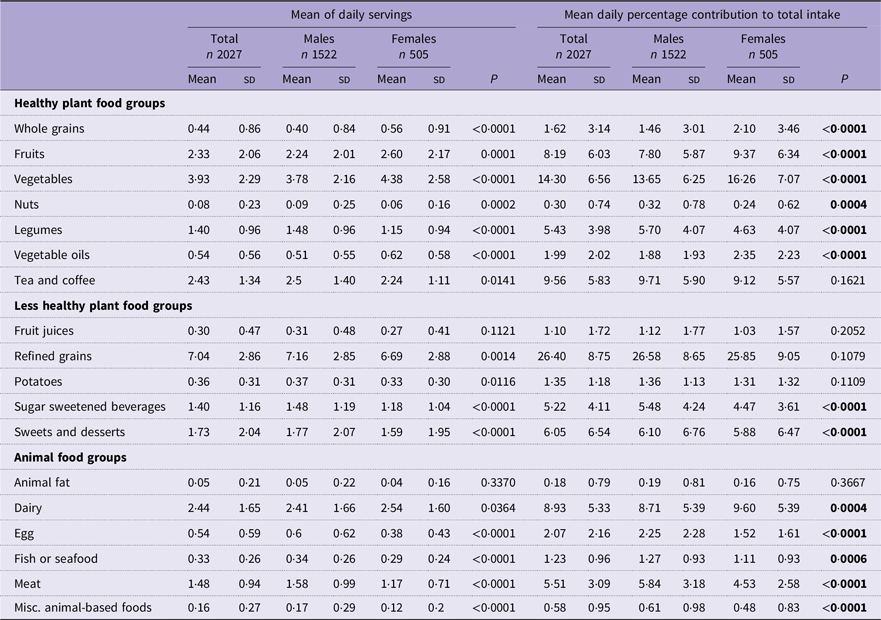
Means (standard deviations) values are reported.
Wilcoxon signed-rank test was conducted for all variables, except for refined grains where independent sample test was used.
Bold values indicate statistically significant findings (p < 0.05).
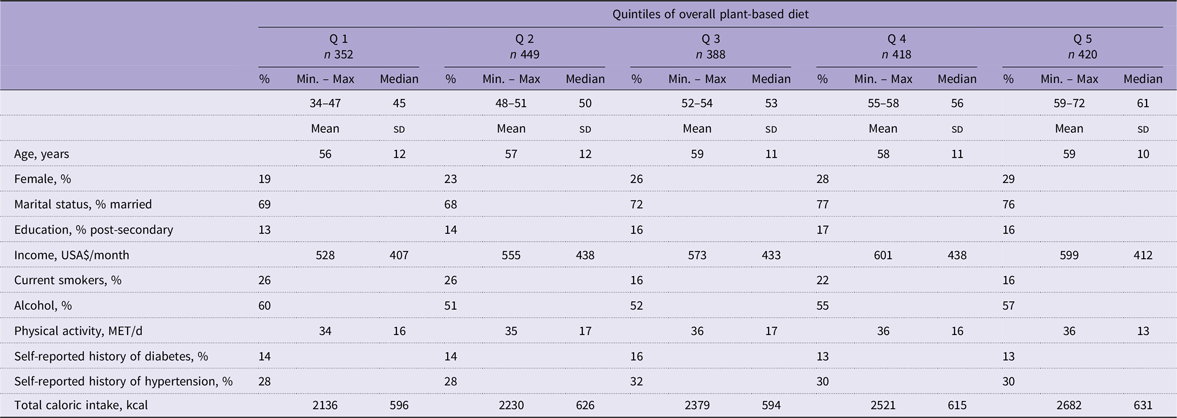
Examining the distribution of quintiles of overall plant-based diet across socio-demographic and lifestyle characteristics revealed that subjects in higher quintiles (quintiles 4 and 5) were more likely to be married, female, with higher income, physical activity and total caloric intake (Table 3). Moreover, they were less likely to smoke but more likely to report having hypertension compared with subjects in lower quintiles.
Socio-demographic and lifestyle characteristics by quintiles of overall plant-based diet (n 2027)

MET, metabolic equivalents; kcal, kilocalories.
Mean (standard deviation) and frequency (percentages) are presented for continuous and categorical variables, respectively.
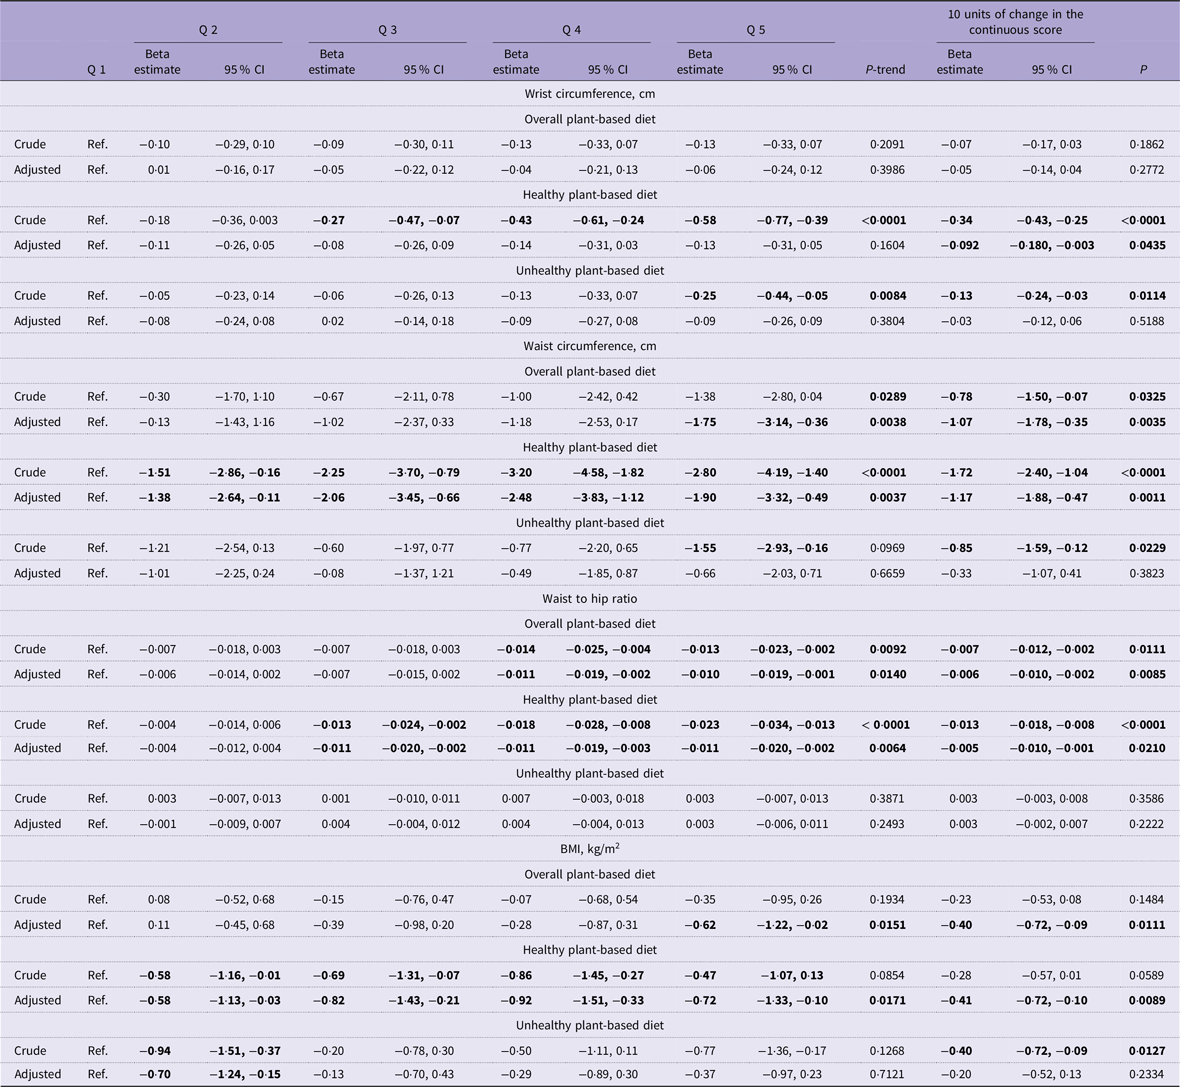
Results from the multivariable linear regression models are shown in Table 4. For wrist circumference, a higher quintile of hPDI was significantly associated with lower wrist circumference in the crude model; however, this association was attenuated after adjustment (Q5 v. Q1: −0·58 cm (95 % CI: −0·77, −0·39) v. −0·13 cm (95 % CI: −0·31, 0·05)). The linear trend across quintiles weakened after adjustment (P-trend = 0·1604), although a modest inverse association remained per 10-unit increase in the continuous score (–0·09 cm; 95 % CI: −0·18, −0·003; P value = 0·0435). No significant associations were observed between PDI and uPDI with wrist circumference in the adjusted models.
Beta estimate and 95 % confidence intervals by quintiles of plant-based indices in the analytical sample from the Costa Rica Heart Study (n 2027) *

* Adjusted for age, sex, marital status, income, smoking, physical activity, total energy and self-reported history of diabetes and hypertension. Bold values indicate statistically significant findings (p < 0.05).
For waist circumference, a greater adherence to the overall PDI was associated with lower waist circumference across all quantiles (P-trend = 0·0038), with a significant association observed between Q5 v. Q1 (–1·75 cm; 95% CI: −3·14, −0·36). A 10-unit change in the overall PDI scores was associated with 1·07 cm lower waist circumference (P value = 0·0035). For hPDI, significantly lower waist circumference observed across all quantiles (P-trend = 0·0037). For instance, participants in the highest quintile of the hPDI had a −1·90 cm (95% CI: −3·32, −0·49) lower waist circumference compared with participants in the lowest quintile. Moreover, a 10-unit change in the hPDI scores was associated with −1·17 cm (95% CI: −1·88, −0·47; P value = 0·0011). For the uPDI, a significant reduction in waist circumference was observed only among participants in Q5 compared with Q1; however, the association attenuated after adjustment (–0·66 cm; 95 % CI: −2·03, 0·71).
Higher scores for both the overall PDI and hPDI were associated with lower waist:hip ratio across several quintiles (P-trend was 0·0140 and 0·0064, respectively). For example, subjects in the 5th quintile of the overall PDI and hPDI had 0·010 cm (95 % CI: −0·019, −0·001) and 0·011 cm (95 % CI: −0·020, −0·002) lower waist:hip ratio compared to subjects in the 1st quintile, respectively. In addition, the continuous overall PDI score showing reduction of 0·006 cm (95% CI: −0·010, −0·002; P value = 0·0085) per 10-unit increase in the score. Similar results observed with the hPDI (–0·005 cm; 95% CI: −0·010, −0·001; P value = 0·0210). No significant differences were detected with the uPDI score.
For the BMI, the overall PDI score showed inverse association with the BMI with a significant linear trend (P value = 0·0151) and 10-unit increase in the overall PDI score (–0·400 (95 % CI: −0·720, −0·090); P value = 0·011). Participants in the highest quintile of the overall PDI diet score had −0·62 kg/m2 (95 % CI: −1·22, −0·02) lower BMI compared with participants in the lowest quintile. Similar results were observed across all hPDI score quintiles, with a significant trend (P-trend = 0·0171) and continuous hPDI score showing a reduction of −0·41 kg/m2 (95 % CI: −0·72, −0·10; P value = 0·0089). The strongest association of the hPDI score on BMI was observed in the fourth quintile, where participants in Q4 had −0·92 kg/m2 (95 % CI: −1·51, −0·33) lower BMI compared withparticipants in Q1. The unhealthy PDI score was inversely associated with the BMI only in the second quintile (–70 cm; 95 % CI: −1·24, −0·15) with no significant linear trend (P-trend = 0·7121).
Stratification analyses results by age, sex and area of residence were reported in online Supplementary Tables 2–7. In the sex-stratified analyses, stronger inverse associations were generally observed among males than females, particularly higher hPDI scores were associated with lower waist circumference and waist:hip ratio (online Supplementary Tables 2 and 3). The age-stratified analyses indicated that inverse associations were more pronounced among older adults, especially for the hPDI in relation to waist circumference and BMI (online Supplementary Tables 4 and 5). For the area of residence, inverse associations were observed between higher hPDI scores and waist circumference and waist:hip ratio among subjects living in rural areas, whereas higher overall PDI associated with lower waist circumference among participants living in urban and peri-urban areas (online Supplementary Tables 6 and 7).
Discussion
In this population-based study of Costa Rican adults, we found that higher adherence to a healthy plant-based dietary index was associated with lower adiposity across most measured indicators, with the most pronounced association observed with waist circumference and BMI. Moreover, we observed modest inverse associations between the overall plant-based diet and waist circumference, waist:hip-ratio and BMI among participants in the highest quintile. In contrast, the unhealthy plant-based diet did not show remarkable results. These results underline the importance of the quality of plant-based diets and extend the existing evidence, emphasising that not all plant-based diets are associated with favourable adiposity and body composition outcomes.
Our results align with some previous studies conducted in other populations(Reference Chew, Heng and Tien2,Reference Satija, Bhupathiraju and Rimm7,Reference Chen, Schoufour and Rivadeneira13) . Higher plant-based diet scores were associated with lower waist circumference, BMI, fat mass index and body fat percentage in Dutch adults(Reference Chen, Schoufour and Rivadeneira13). Likewise, consumption of both healthy plant-based diets and overall plant-based diets was associated with a lower incidence of obesity(Reference Wang, Shivappa and Hébert19). A recent umbrella review confirms the significant associations of plant-based diets on adiposity indicators, suggesting that such diets can play a role in obesity management(Reference Chew, Heng and Tien2). Moreover, these results are supported by adiposity-related biomarkers as a 10-unit increment in hPDI score was associated with lower levels of leptin, insulin and C-reactive protein and higher concentrations of adiponectin and soluble leptin receptor(Reference Baden, Satija and Hu4). Furthermore, evidence from a large prospective cohort study using data from the Nurses’ Health Study and the Health Professionals Follow-up Study further supports this association, reporting that healthy plant foods are associated with less weight gain during four years of follow-up(Reference Satija, Malik and Rimm11). However, some studies reported null associations between changes in the scores of the plant-based indices and the long-term effect on adiposity and metabolic health(Reference Waterplas, Versele and D’Hondt20,Reference Kim, Lee and Rebholz21) . This could be due to differences in the quality of plant-based diets across various populations. In addition, heterogeneity within the three food categories (healthy plant food, unhealthy plant food and animal food) may contribute to these inconsistencies. These inconsistencies warrant further investigations into the sustained effects of healthy plant-based diets.
The observed associations with hPDI may reflect greater adherence to healthful plant-based dietary patterns, which emphasise higher intake of fruits, vegetables and legumes, which typically have lower energy density and are rich in nutrients such as dietary fibre, antioxidants, phytochemicals and unsaturated fatty acids(Reference Najjar and Feresin22,Reference Medawar, Huhn and Villringer23) . In this population, legumes, particularly beans, represent a key dietary component and an important source of essential fatty acids. Consuming these foods regularly is associated with increased satiety, lower total energy intake, better glycaemic control, lower inflammatory activity and differences in gut microbiome composition suggesting that healthy plant-based diets may have a protective effect against excess fat(Reference Najjar and Feresin22,Reference Medawar, Huhn and Villringer23) .
The modest associations with the overall PDI and the null findings with uPDI suggest that merely increasing plant foods and limiting animal consumption without considering the quality and healthfulness of plant foods may be associated with limited health benefits. In contrast to healthy plant-based diets, unhealthy plant-based diets are high in refined grains, sugary drinks and processed plant foods, which are typically energy dense with lower content of bioactive food components. The overconsumption of some highly processed plant foods or sugary drinks may provide limited nutritional value and may promote weight gain in the long term and adverse health outcomes. The lack of associations between uPDI and adiposity measures in this study may reflect the relatively low consumption of sugar-sweetened beverages and unhealthy plant foods in our study population. This observation adds to the growing evidence that plant-based diet quality, rather than plant-based dietary patterns, is a key determinant of favourable health outcomes. Consequently, these findings reinforce existing dietary guidance that emphasises the quality and healthfulness of plant-based foods, rather than plant-based eating alone.
Costa Rica and other Central American regions provide unique opportunities for future studies examining the effects of plant-based diets on adiposity and metabolic health due its agrobiodiversity and traditional food systems. Traditional diets in regions like the Nicoya Peninsula, a blue zone in Costa Rica known for its longevity, are rich with fruits and vegetables, black beans, corn tortillas and ‘gallo pinto’, a traditional rice and beans dish, with relatively modest intake of animal-based foods(Reference Chacón, Jiménez and Campos24). In addition, other plant foods consumed in Central America such as nixtamalised corn/nixtamalised corn flour (masa harina), non-nixtamalised corn (elote/choclo), pepitas (pumpkin seeds), amaranth, chia, tropical fruits and vegetables and avocados are rich in fibre, healthy fats, antioxidants and phytochemicals that may support metabolic health. Incorporating these culturally relevant foods into future intervention studies could help evaluate their effects on adiposity and metabolic outcomes while identifying sustainable and culturally appropriate dietary strategies for this region.
This study uses a representative sample of Costa Rican adults from diverse populations living in the Central Valley of Costa Rica, which allows generalisability of the study results to the Costa Rican population within the predefined matching factors of age, sex and geographic region between 1994 and 2004. Our findings support promoting healthy plant-based eating patterns, which can serve as an effective nutritional intervention aiming to address the growing prevalence of obesity and metabolic diseases in this population(Reference Wiśniewska, Okrȩglicka and Paskudzka25). We also used multiple indicators to assess adiposity and adjusted the models for several socio-demographic and lifestyle factors. However, several limitations should be acknowledged. First, this analysis includes only the control subjects from the larger case–control Costa Rica Heart Study. As such, the data are cross-sectional in nature, limiting our ability to produce causal inferences, although the observed significant linear trends support the associations. Second, while we used a validated FFQ to create the plant-based diet indices, it is self-reported data and subject to recall bias and misclassification. In addition, FFQ are prone to measurement error, which can result in under- or overestimation of true dietary intake, especially for unusually low or high reported values. However, the consistency of our results across multiple adiposity indicators shows the robustness of our findings. Third, despite adjusting for multiple confounders, residual confounding may bias our results. Fourth, some mixed food groups from the FFQ, such as ‘rice and beans’ or ‘tamales,’ were classified according to their predominant component, which introduces some imprecision into the estimates.
In conclusion, our study highlights the importance of the quality of plant-based diets in relation to adiposity and emphasises that healthful plant foods, such as fruits, vegetables, legumes, whole grains, nuts and seeds, rather than merely reducing animal food consumption, are associated with adiposity indicators. Future investigations should incorporate a larger sample size with prospective or interventional designs to better understand the causal pathways between plant-based diets and changes in adiposity over time.
Supplementary material
The supplementary material for this article can be found at https://doi.org/10.1017/S0007114526107788.
Acknowledgements
We would like to thank all the participants of the Costa Rica Heart Study for their time and commitment. We are grateful to the study staff and field teams for their diligent work in data collection and management. We thank the funding agencies and institutions that supported this research, including the Human Subjects Committees of the Harvard T.H. Chan School of Public Health and the University of Costa Rica, for their guidance and oversight.
This work was support by the National Institutes of Health (HL49086, HL60692), USA.
The authors’ responsibilities were as follows – H. C., A. A. A., M. A. and A. B. designed research; H. C. conducted research; A. A. A. analysed data and M. A. wrote the paper. A. B. and H. C. had primary responsibility for final content. All authors read and approved the final manuscript.
The authors report no conflicts of interest.
Data described in the manuscript, code book and analytic code will be made available upon request pending approval.


 Open access

