




Introduction
For Pueblo peoples, farming is not merely an economic pursuit that produces food. Maize agriculture permeates all aspects of Pueblo identity, connecting widely dispersed peoples that speak mutually unintelligible languages with remarkably consistent values and traditions. The rapid spread of sedentary agricultural communities across the Colorado Plateau of western North America during the late sixth and early seventh centuries AD completed an economic and social transformation fundamental to this shared Pueblo history. Our understanding of the critical final steps of this transformation, however, remains poor due to a lack of focused research on the sixth and preceding centuries AD.
Although domesticated maize (Zea mays L.) arrived in the northern US Southwest from Mesoamerica thousands of years earlier, the tempo and uniformity of the adoption of agriculture was uneven for the next 2500 years (Roth Reference Roth2016; Vierra & Carvalho Reference Vierra and Carvalho2019). Yet, following AD 580 there was rapid and widespread adoption of a package of domesticates, technologies and socio-political institutions capable of integrating large groups of unrelated households (Young & Herr Reference Young and Herr2012). These attributes ultimately served as the foundation for a swift sequence of developments that have parallels in the earliest Formative periods in Mesoamerica and Neolithic transitions in Eurasia, including the rapid formation and demise of large villages, increasing social inequality and, in the northern US Southwest in particular, the rise of the Chaco regional system (Wilshusen et al. Reference Wilshusen, Schachner and Allison2012; Plog Reference Plog and Whiteley2018).
How do we explain this rapid late sixth-century transition from a landscape of cultural and socioeconomic heterogeneity to one in which there was widespread adoption of the Neolithic package and sedentary agriculture? Drawing on high-quality archaeological tree-ring, radiocarbon and palaeoclimatic data, we propose that an extreme cold interval brought on by volcanic eruptions in AD 536 and 541 disrupted a period of accumulating social and technological advancements, influencing the timing, scale and scope of this rapid Neolithic Transition.
To explore this process, we place this history and the agricultural practices of early farmers into context and demonstrate the significance of both temperature and precipitation for successful maize agriculture on the arid yet temperate, high-elevation Colorado Plateau. We also show that there was a hiatus in construction, economic activity and material culture traditions that coincided with the mid-sixth-century extreme cold interval, and that this break was of sufficient length and magnitude to create an opening for the regional transformation that followed. A convergence of ‘bottom-up’ and ‘top-down’ factors allowed a shared set of social, economic, material and landscape practices to be adopted rapidly across the northern Southwest—not unlike other Neolithic Transitions in secondary locales of domestication worldwide (Robb Reference Robb2013).
The Neolithic Transition and early agriculture
Over the last century, archaeologists working in the northern US Southwest have hypothesised a continuous, gradual transition from mobile hunting and gathering to sedentary farming, followed by a slow increase in population size, and finally, the rise of progressively larger villages (e.g. Roberts, Jr. Reference Roberts1935). This slow, steady evolutionary model for Formative economies, however, has been critiqued. Using tree-ring and radiocarbon datasets, Berry (Reference Berry1982) identified population boom-and-bust cycles similar to those later noted in European Neolithic societies (Shennan et al. Reference Shennan2013), and argued for intermittent demographic changes influenced by episodic, plateau-wide droughts (see also Bocinsky et al. Reference Bocinsky, Rush, Kintigh and Kohler2016; Schwindt et al. Reference Schwindt2016).
Regardless of the tempo of change, researchers agree that the start of the Basketmaker II period (400 BC–AD 400) represents a transitional stage in the development of Formative economies, as people in some areas began to rely on maize as a dietary staple (Geib Reference Geib2011; Coltrain & Janetski Reference Coltrain and Janetski2019). Other groups, however, remained primarily foragers. Hence, regional socio-economic variability persisted throughout this period (Vierra & Carvalho Reference Vierra and Carvalho2019). Perhaps more importantly, both farmers and foragers continued to live in dispersed hamlets and retained a high degree of residential mobility. Increasing sedentism, aggregation and a shift from communal to household production occurred during the subsequent Basketmaker III period (AD 550–750). By this time, accelerated population growth had constrained the availability of arable land. Instead of dispersed farmers spreading into new territories, communities grew and socio-political organisation became more complex amongst increasingly dense concentrations of unrelated households (Wilshusen et al. Reference Wilshusen, Schachner and Allison2012; Young & Herr Reference Young and Herr2012). What remains to be understood are the events immediately preceding the completion of this Neolithic Transition; this question forms the focus of our research.
The Early Brown Ware Horizon
We identify three distinct periods associated with this shift to sedentary agriculture: a well-defined preceramic farming interval, called Basketmaker II; a less well-understood, somewhat later but overlapping interval, termed the Early Brown Ware Horizon (EBWH); and finally, Basketmaker III, with its wholesale adoption of the Neolithic package. Throughout the EBWH, farmers adopted components of the Neolithic package in a piecemeal fashion, yet retained a mosaic of subsistence strategies and cultural practices associated with high mobility (see Table S1 in the online supplementary material (OSM)).
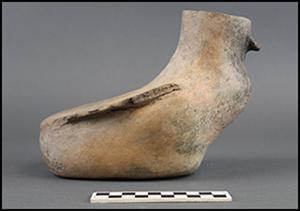
Our research and a synthesis of earlier work suggests that the pace at which early farmers adopted specific components of the Neolithic package was contingent upon diverse local histories and traditions (Table S1). Securely dated AD 200–400 EBWH sites in the Puerco Valley and Navajo Mountain areas, for example, have produced early ceramic assemblages, but contemporaneous groups dwelling on Cedar Mesa to the north-east did not adopt ceramic technology (Figure 1). Moreover, unlike their ceramic-producing neighbours to the south, farmers occupying Cedar Mesa and nearby Grand Gulch raised domesticated turkeys—a practice that became common across the entire region only after AD 550 (Lipe et al. Reference Lipe2016). Even within early ceramic-producing areas, the adoption of ceramics and other new technologies was far from uniform (Geib Reference Geib2011: 280–84). Nevertheless, a general trajectory distinguishing EBWH sites from earlier and later settlements is apparent.
The northern US Southwest (figure by R.J. Sinensky).

Similar to many open-air Basketmaker II settlements, EBWH sites are characterised by unstructured layouts, shallow pit-houses, subterranean storage facilities and a lack of discrete refuse middens (Figure 2a). Unlike Basketmaker II settlements, EBWH sites often contain communal architecture, ceramics fired under poorly controlled conditions and other components of the Neolithic package (Figure 2b). Conversely, Basketmaker III sites usually have organised site layouts, discrete refuse middens, abundant, above-ground storage structures fronted by deep residential pit-houses, larger and more formal communal architecture, and contain ceramics produced using consistent paste recipes and controlled firing conditions (Figure 2c–d).
Neolithic Transition site layouts: a) Basketmaker II (400 BC–AD 400); b) Early Brown Ware Horizon (AD 250–550); c) Basketmaker III (AD 550–750); d) Basketmaker III communal architecture (figure by R.J. Sinensky).

Climate and agriculture
The temperate, yet arid, high-elevation Colorado Plateau presents risks for agriculture due to the moisture and temperature requirements of maize. Mean precipitation is greater and temperatures are cooler in the higher elevations of the northern US Southwest than in the lower elevation basin and range province to the south, and perennial water sources suitable for irrigation are rare. Most ancient farmers on the Colorado Plateau relied on direct rainfall, the moisture retaining capacity of soils and the diversion of runoff to supplement direct precipitation (Dominguez & Kolm Reference Dominguez and Kolm2005). Only upland areas above 2300m asl, which are seldom occupied by farmers, regularly receive insufficient accumulated heat during the summer growing season to produce a successful maize crop. Consequently, most recent studies of the relationship between regional demography and climate in the arid plateau Southwest have portrayed fluctuating precipitation as the key variable affecting farmers (e.g. Bocinsky & Kohler Reference Bocinsky and Kohler2014). Since precipitation increases along an elevation gradient in the northern Southwest, and moisture is the primary limiting factor for agriculture region-wide, high-elevation areas served as refugia during frequent droughts (Bocinsky & Kohler Reference Bocinsky and Kohler2014; Vierra & Carvalho Reference Vierra and Carvalho2019).
Crops, however, can fail even if they receive sufficient moisture and accumulated heat, if, for example, a field does not maintain an adequate number of consecutive frost-free days, or a single hard freeze terminates plant growth (Adams Reference Adams, Ingram and Hunt2015). Petersen (Reference Petersen, Petersen and Orcutt1987) argued that the demographic trajectories of well-watered, higher elevation areas were closely tied to fluctuating growing season lengths (also see Thomson et al. Reference Thomson, Balkovič, Kirsztin and MacDonald2019). Here, we posit that rare, extreme and prolonged cooling events would have adversely affected farmers across the Colorado Plateau due to shortened growing seasons, decreased accumulated heat and more frequent hard frosts. These periods would have required a unique response by farming communities, since high-elevation locations that served as refugia during more-frequent droughts were even more susceptible to crop failure caused by infrequent, extreme cooling events, such as those triggered by volcanic eruptions.
Volcanic climate forcing, palaeoclimate and demography
A growing number of high-quality tree-ring chronologies and well-dated ice-cores demonstrate that the most severe temperature anomalies during the Late Holocene were initiated by volcanic eruptions (Sigl et al. Reference Sigl2015; Anchukaitis et al. Reference Anchukaitis2017). Two of the most consistently identified climate forcing events occurred in AD 536 and 541. These nearly coterminous, massive eruptions caused the coldest decade across the Northern Hemisphere in the past 2500 years (Sigl et al. Reference Sigl2015). Research by Dull et al. (Reference Dull2019) suggests that the Ilopango volcano in El Salvador was responsible for the latter event, while cryptotephra compositional data suggest that the former may have included eruptions in Alaska, British Columbia and California within a single year (Sigl et al. Reference Sigl2015). While the impacts of these events are well attested in Eurasian historical sources (Stothers Reference Stothers1984; Arjava Reference Arjava2005), and have recently been cited as responsible for social upheaval across that region (Büntgen et al. Reference Büntgen2016; see, however, Helama et al. Reference Helama, Jones and Briffa2017), few studies have explored the effects on contemporaneous, smaller-scale North American societies, even though these events are prominent in the palaeoclimate records of the region.
Volcanic events and extreme cold in the regional palaeoclimate record
Climate forcing from the eruptions of AD 536 and 541 is conspicuous in tree-ring chronologies across western North America (Salzer & Hughes Reference Salzer and Hughes2007; Salzer et al. Reference Salzer, Bunn, Graham and Hughes2014). Of importance to the current study, these effects are visible as frost-terminated growth rings in the temperature-sensitive San Francisco Peaks bristlecone pine chronology from northern Arizona (Table S2). We rely on the San Francisco Peaks chronology for temperature reconstruction (Salzer Reference Salzer2000) and the El Malpais chronology from western New Mexico for precipitation reconstruction (Grissino-Mayer Reference Grissino-Mayer1995), as these represent the highest-quality temperature- and precipitation-sensitive chronologies covering the period of interest (Van West & Grissino-Mayer Reference Van West, Grissino-Mayer, Huber and Van West2005; Stahle & Dean Reference Stahle, Dean, Hughes, Swetnam and Diaz2011: 321). They are also located close to the southern plateau—an area that hosted a dense, contemporaneous EBWH population (Figure 1). Van West & Grissino-Mayer (Reference Van West, Grissino-Mayer, Huber and Van West2005) converted the standardised mean annual temperature and precipitation departures from these respective chronologies to z-scores, which represent standard deviations from the 2100-year mean. A value of 0 is equivalent to the mean, while a value of +1 or −1 represents one standard deviation above or below the mean. We also present growing degree-day reconstructions, an agronomy term shorthand for the total amount of accumulated heat units necessary for a plant to reach maturity. Our growing degree-day reconstruction uses methods developed by Bocinsky et al. (Reference Bocinsky, Rush, Kintigh and Kohler2016), which draw on numerous regional tree-ring chronologies (for accessible web-based modelling tools, see https://www.openskope.org).
The AD 536 and 541 eruptions are associated with one of the most significant cold periods on record in the San Francisco Peaks chronology. Salzer (Reference Salzer2000) designates AD 534–553 as the sixth coldest interval, while Van West & Grissino-Mayer (Reference Van West, Grissino-Mayer, Huber and Van West2005) describe a seven-year cold and dry interval spanning AD 538–545 as the single coldest. Regardless, for 15 consecutive years (AD 538–553), temperature indices were over one standard deviation below the 2100-year mean—a pattern that does not occur at any other point in the San Francisco Peaks chronology (Figure 3). Moreover, nine of the 20 years with the lowest accumulated heat units on record since AD 1 occurred between AD 536–553. Temperatures finally rebounded in AD 555, but this was immediately followed by a 14-year drought between AD 556 and 569. Some 30 years later—only a single generation removed from these extreme events—the Colorado Plateau experienced four decades of the most productive and stable conditions for agriculture on record (AD 584–625). Both the extreme cold that followed the eruptions and the subsequent stable, warm and wet interval must have had important consequences for farming groups. The question is whether the effects of these events are visible in the archaeological tree-ring and radiocarbon records.
Temperature and precipitation reconstructions fitted with LOESS smoothed regression lines and 95% confidence intervals (span = 0.05). Numbered years indicate frost-terminated growth rings and black circles represent the timing and intensity of volcanic forcing (see Table S2) (figure by R.J. Sinensky).

Archaeological chronologies
Baillie (Reference Baillie1994: 214) appears to be the first to argue that the fallout of sixth-century climate forcing was visible in the archaeological dendrochronology record of the US Southwest. Here, we explore whether this remains the case, with an expanded dataset that includes 4886 outer-ring dates from the Colorado Plateau that fall between AD 200 and 800 (Figure 4). Of these, 1274 are cutting dates (indicative of the year a tree died) and 429 are near-cutting dates, to within one or two years of the true final cutting date (Speer Reference Speer2010: 163). We expect the count and density of cutting and near-cutting dates to correlate with shifting demography and agricultural productivity (Bocinsky et al. Reference Bocinsky, Rush, Kintigh and Kohler2016).
Tree-ring dates from the Colorado Plateau, AD 200–800. Histogram bins represent five-year intervals (figure by R.J. Sinensky).

The earliest spike in construction activity evident from the archaeological tree-ring dates (AD 460–488) occurred in a limited number of high-elevation areas and locations with access to perennial water on the Colorado Plateau, at the end of a prolonged drought (AD 419–488). During a favourable interval that followed (AD 489–525), migrants from drought refugia introduced core components of the Neolithic package to vast expanses of the Colorado Plateau (Windes Reference Windes2018; Vierra & Carvalho Reference Vierra and Carvalho2019: 212; Figure S1). Although precipitation varied during this early spike in construction, temperatures remained consistent from AD 468–521 (Salzer Reference Salzer2000: 76), enabling demographic expansion into new regions. The overall density of dates begins a precipitous decline during a short, warm, dry period (AD 526–532), and reaches its lowest point during the initial, intensely cold and dry portion of the anomaly (AD 538–545), for which no cutting dates have been recovered (Table S3). Date density remains low during the cold and wet portion of the anomaly (AD 546–553), throughout a period of drought (AD 556–569) and during a wet, cool period (AD 570–583), before the number of cutting dates increases over tenfold during the stable wet, warm interval (AD 584–629).
The combined archaeological tree-ring data offer considerable evidence for the influence of the anomaly, as it coincides with the most pronounced decline in construction and the lowest density of cutting dates. Radiocarbon data also must be examined to provide coverage in lower elevation areas that less frequently produce wood suitable for tree-ring dating, and during earlier periods when it was less common for Ancestral Pueblo peoples to build with substantial timbers conducive to tree-ring dating.
We compiled a database of 682 radiocarbon dates from the northern US Southwest with calibrated, unmodelled medians (calibrated using IntCal20 (Reimer et al. Reference Reimer2020)) falling between AD 200 and 800—a range well before and after the climate event of interest. To visualise varying radiocarbon measurement density, yet minimise bias introduced by the calibration curve, we present a kernel density estimation (KDE) model that incorporates 648 measurements from 230 archaeological sites, with measurement errors of ±100 radiocarbon years or fewer, and a second model that only includes a subset of 334 dates derived from higher-quality materials (Figure 5 & Figures S2–3). We believe that such models are appropriate, as they offer independent lines of evidence for comparison with the trends noted in the higher resolution tree-ring data.
KDE_model-derived radiocarbon probability densities (Bronk Ramsey Reference Bronk Ramsey2017) displayed with the temperature and precipitation indices presented in Figure 3 (for additional model details, see Figures S2 & S3) (figure by R.J. Sinensky).

Our models display comparable patterns to the tree-ring dates. These comprise increasing radiocarbon measurement density during the late fifth and early sixth centuries, followed by a sharp decrease associated with the climate anomaly, and a sustained increase during the late sixth and early seventh centuries. Similar to the tree-ring dates, the minimum radiocarbon density corresponds with the peak effects of volcanic climate forcing, whereas the initial decline begins prior to the peak effects. Although the end of a plateau in the radiocarbon curve (c. AD 445–525) potentially influences the apparent timing of the declining radiocarbon density, close agreement between the modelled radiocarbon data and tree-ring cutting dates strongly suggests that this plateau is not solely responsible (Figure 6). Given these results, we now explore the timing and tempo of the phase transition that ultimately led to the widespread adoption of the Neolithic package and the transformation of Ancestral Pueblo societies.
Densities of tree-ring cutting and radiocarbon dates using modelled 14C medians as point estimates (figure by R.J. Sinensky).

Disentangling the chronology of the sixth century
As groups adopted the Neolithic package in a piecemeal fashion, it is important to consider the potential temporal overlap between the EBWH and the Basketmaker II and III periods. Archaeologists have previously argued that the EBWH overlaps with the earlier Basketmaker II (Geib Reference Geib2011) and later Basketmaker III periods (e.g. Wilson & Blinman Reference Wilson and Blinman1994; Reed et al. Reference Reed, Wilson, Hays-Gilpin and Reed2000). An overlapping phase Bayesian model (Bronk Ramsey Reference Bronk Ramsey2009: 348) reveals differences between phase transitions, with up to 65 years of overlap between the end of Basketmaker II and the onset of the EBWH, yet a gap spanning 33–87 years between the end of the EBWH and start of Basketmaker III (Figure 7 & Figure S4). Moreover, the model strongly suggests that the end of the EBWH coincided with the climate anomaly (AD 522–545 [68.3%]; AD 506–555 [95.4%]), while the socio-economic and demographic changes associated with the Basketmaker III period are not evident until the climate improved. This interpretation is corroborated by the tree-ring data discussed previously.
An overlapping phase Bayesian model that includes 402 radiocarbon measurements derived from annual plants, textiles and bone (for further discussion, see Figure S4): a) start and end boundaries for select phases; b) probability distributions for the span of phase transitions (dates calibrated and modelled using OxCal v4.4.2 and the IntCal20 atmospheric curve (Bronk Ramsey Reference Bronk Ramsey2020; Reimer et al. Reference Reimer2020)) (figure by R.J. Sinensky).

We find the gap between the EBWH and Basketmaker III to be particularly significant, as it matches patterns that we have noted on the southern plateau, in which long-lived ceramic traditions and architectural styles used throughout the EBWH were abruptly disused and do not appear subsequently alongside material culture or architecture typical of the Basketmaker III period. This break is also evident in the dendrochronological record of numerous regions of the Colorado Plateau with well-documented Basketmaker II and Basketmaker III occupations (Reed Reference Reed2000; Wilshusen et al. Reference Wilshusen, Schachner and Allison2012; Young & Herr Reference Young and Herr2012; see also Figure S5). This suggests that the disruption caused by extreme cooling could not be alleviated with farmers’ existing risk-mitigation strategies.
Mobility and risk
In small-scale farming societies, strong social ties between groups living in different environmental zones help to minimise risk (Rautman Reference Rautman1993; Borck et al. Reference Borck, Mills, Peeples and Clark2015). During periods of acute environmental disturbance or social strife, these ties also facilitate population movements that can last for several months, or even decades (Waddell Reference Waddell1975). Ephemeral residential architecture, unstructured site layouts and a lack of dedicated storage facilities during the EBWH suggest that residential moves were frequent and anticipated, and therefore probably occurred within well-developed social networks. Insufficient growing-season moisture is the most common variable affecting interannual crop yields on the Colorado Plateau. Consequently, social networks connected groups living in low-elevation areas with high-elevation drought refugia. Such locations were particularly important to farmers during the EBWH, due to long and persistent droughts between AD 290 and 488 (Figure 3). Archaeological evidence from sites of this era suggests that farmers moved between high- and low-elevation locations as necessary; such movements formed a flexible, yet stable settlement system (Burton Reference Burton2007; Rogge et al. Reference Rogge and Herr2016; cf. Vierra & Carvalho Reference Vierra and Carvalho2019: 212). In contrast, the extreme cooling brought on by the sixth century eruptions—and particularly the initial cold and dry interval of the anomaly (AD 538–545)—could not be addressed by drought-resilient strategies, since high-elevation refugia were even more susceptible to crop failure caused by extreme cooling. Indeed, growing degree-day reconstructions show that high-elevation areas across the Colorado Plateau and regions immediately to the south fell below critical thresholds for successful maize agriculture, affecting regions well beyond the social networks of EBWH farmers (Figure 8 & Figure S6).
AD 200–800 May–September growing degree-day reconstructions fitted with LOESS smoothed regression lines (span = 0.05): a) annual reconstructions for regions of the Colorado Plateau. Note that the western plateau encompasses arid and lower elevation areas unsuitable for rain-fed agriculture, and including these areas inflates the plateau-wide reconstruction (displayed in black); b) annual reconstructions for select high-elevation drought refugia (figure by R.J. Sinensky).

Given the close correspondence between the climate anomaly and the hiatus evident in the radiocarbon and dendrochronological data (Figure 9), we conclude that the suddenness, severity and length of mid sixth-century extreme cooling triggered large-scale population movements beyond the limits of established social networks, along with significant population decline among groups that remained on the Colorado Plateau. Diverse populations across this region were uniformly affected. Prior to the anomaly, farmers on the southern plateau had rapidly adopted ceramic technology and built larger settlements with greater population densities compared with regions to the north (Table S4); during and after the anomaly, abrupt changes in pottery traditions, architecture and settlement patterns occurred. More sparsely populated areas that did not exhibit similar sharp changes in material culture were still affected, as occupational gaps and unexpected disruptions to previously stable settlement patterns occurred (Hovezak & Sesler Reference Hovezak and Sesler2006; Geib Reference Geib2011).
Temporal correspondence between sixth-century extreme cooling and chronometric data. The dashed red line represents the end of the extreme cold and dry interval (AD 545): a) growing degree-day reconstruction; b) cutting and near-cutting tree-ring date density; c) modelled radiocarbon density (figure by R.J. Sinensky).

Disturbance, reorganisation and social change
Archaeologists have long recognised that demographic and social change transformed Ancestral Pueblo societies during the late sixth and early seventh centuries AD, but we contend that these changes are best understood when juxtaposed with the consequences of extreme cold at the beginning of this interval. The climate anomaly upended diverse, longstanding settlement systems on the Colorado Plateau by pushing population movements beyond the boundaries of established social networks. This generated a cultural milieu ripe for the renegotiation of distinct and long-held local traditions. Swift resettlement by increasingly sedentary and rapidly growing populations allowed for the spread of shared socio-economic traditions, fuelled by exceptionally favourable conditions for farming. We suggest that the rapid population displacement, spurred by extreme cooling, and the swift resettlement and colonisation of the Colorado Plateau during the subsequent warm and wet interval constituted critical ingredients in a long process of cultural construction that facilitated the development of more complex and widely shared forms of socio-economic organisation (Robins & Hays-Gilpin Reference Robins, Hays-Gilpin and Reed2000). We view these changes not as mechanistic reactions to climate change, but as sophisticated societal responses critical to the long-term emergence of Ancestral Pueblo traditions.
In smaller-scale societies worldwide, significant disruptions to socio-economic systems can lead to the rapid reorganisation of social structures within a surprisingly short timeframe (Aldenderfer Reference Aldenderfer1993; Kohler & Bocinsky Reference Kohler, Bocinsky, Cunningham and Driessen2017). Such events, whether triggered by social or environmental factors, provide opportunities for the influence of new ideologies and powerful individuals to spread rapidly through a group. As the climate anomaly forced migrants into regions beyond existing social networks—and such migrants often occupy the lowest status in small-scale societies (Watson Reference Watson1970; McGuire & Saitta Reference McGuire and Saitta1996)—the large-scale population movements prompted by the AD 536 and 541 eruptions enabled the development of complex social structures that cross-cut group boundaries and amplified social inequality; these are all characteristics that mark the Neolithic Transition in the northern US Southwest. Indeed, some archaeologists now locate the foundations of social inequality at Chaco Canyon in changes that began during this interval (Plog Reference Plog and Whiteley2018).
Although physical manifestations of these changes were not as overt as those that accompanied the founding of later, eighth-century villages on the Colorado Plateau, one important example of local leaders capitalising on the declining importance of drought refugia appears to have occurred in Chaco Canyon. Here, remodelling of the earliest well-dated great kiva on the Colorado Plateau took place during the climatic anomaly (AD 550–557 cutting dates; see Windes Reference Windes2018). Soon thereafter, these large, subterranean ceremonial structures became the dominant form of communal architecture across the northern Southwest (Gilpin & Benallie Reference Gilpin, Benallie and Reed2000; Diederichs Reference Diederichs2020), and Chaco experienced its initial rise as a demographic centre (Windes Reference Windes2018). While maize agriculture in Chaco Canyon was probably impossible during the initial dry and cold portion of the anomaly (AD 538–545), farmers likely fared better than those in higher elevation areas during the wet and cold interval that followed (AD 546–553). Future research should consider the potential relationship between population movements sparked by extreme cooling and other contemporaneous social changes that unfolded across the US Southwest more broadly, including the Early to Late Pithouse period transition in the Mogollon region and the emergence of the first large Hohokam villages associated with the initial construction of labour-intensive terrace-top canal systems in the Sonoran Desert (Wallace & Lindeman Reference Wallace, Lindeman, Young and Herr2012: 38–41; Roth et al. Reference Roth, Gillman and Anyon2018).
Conclusion
The Neolithic Transition in the northern US Southwest has long been associated with the Basketmaker II and III periods of the Pecos chronology, yet exactly when, how, or why this transition arose has been the subject of considerable debate. Based on a suite of environmental and chronological evidence, we propose that extreme cold brought on by catastrophic volcanic eruptions in AD 536 and 541 triggered a generation-long crisis across an area of more than 160 000km2. This region-wide disruption tore apart the social fabric of the various kin-based groups, who, over the course of a millennium, had adapted to a wide range of different locales and who were marked as much by their differences as by what they shared. The region-wide depopulation and the favourable agricultural conditions that followed enabled a total reorganisation of Ancestral Pueblo societies that incorporated a full Neolithic package of domesticates, technologies and increasingly complex forms of supra-household organisation. This shared lifeway enabled farmers to spread quickly across much of the area, and offered the foundational elements of early villages, the rise of regional systems and the origins of social inequality over the next two centuries.
Acknowledgements
We thank the two anonymous reviewers and the many individuals at Petrified Forest National Park, the Hopi Cultural Preservation Office, the Museum of Northern Arizona, the Arizona State Museum, the Western Archaeological and Conservation Center, the Field Museum, the Navajo Nation Heritage and Historic Preservation Department and the Crow Canyon Archaeological Center for their help with this research. All data and code used to generate the figures are provided in the Colorado Plateau EBWH Dataverse.
To view replication data and code associated with analyses in R, please visit https://doi.org/10.25346/S6/N3RVLC.
To view radiocarbon data, OxCal model output and code, please visit https://doi.org/10.25346/S6/LFS4H9.
Funding statement
Grants and fellowships from the Wenner-Gren Foundation (Dissertation Fieldwork Grant GR9577), the Society for American Archaeology, the Arizona Archaeological and Historical Society, the PaleoWest Foundation, the Cotsen Institute of Archaeology and the UCLA Department of Anthropology provided funding.
Supplementary material
To view supplementary material for this article, please visit https://doi.org/10.15184/aqy.2021.19


 Open access

