


Metabolomics is a comprehensive approach to identifying and quantifying detectable small cellular metabolites, including substrates, intermediates and products, in a biological system, and research groups have begun to explore the effects of exercise on the human metabolome(Reference Sakaguchi, Nieman and Signini1,Reference Schranner, Kastenmüller and Schönfelder2) . Large shifts in over 200 metabolites have been observed with exercise, particularly with longer duration and higher intensity exercise(Reference Sakaguchi, Nieman and Signini1,Reference Nieman and Mitmesser3) . During exercise, cellular metabolism ramps up to supply up to ten times more ATP than at rest to meet increased workload demands(Reference Schranner, Kastenmüller and Schönfelder2). Depending on substrate availability, this involves the mobilisation and utilisation of glycogen, TAG and amino acid stores(Reference Schranner, Kastenmüller and Schönfelder2). Studies have consistently reported significant changes in lipids, amino acids, bile acids and tricarboxylic acid cycle intermediates with exercise(Reference Sakaguchi, Nieman and Signini1,Reference Schranner, Kastenmüller and Schönfelder2) .
An interest in sports nutrition research is in dietary supplements that complement and support exercise performance and recovery. Among supplements of interest are fruit-derived flavonoids for their potential ergogenic effects(Reference Bowtell and Kelly4). Flavonoids are a diverse class of plant secondary metabolites, and the number of research publications involving these phytochemicals has increased rapidly in the last two decades(Reference Marino, Del Bo’ and Martini5). This is due to the observation that diets abundant in fruits and vegetables have consistently been associated with a reduced risk of cardiometabolic disease and overall mortality(Reference Medina-Remón, Zamora-Ros and Rotchés-Ribalta6–Reference Medina-Remón, Casas and Tressserra-Rimbau9). The molecular basis for these effects was initially attributed to the high free-radical scavenging activity of flavonoids in vitro (Reference Ruskovska, Maksimova and Milenkovic10). However, flavonoids are highly metabolised through a coordinated effort by both host and microbiota(Reference Cosme, Rodríguez and Espino11). In general, with the exception of flavan-3-ols, native flavonoids are glycated, which results in low absorption in the small intestine and increases flavonoids exposed to the colonic microflora(Reference Quideau, Deffieux and Douat-Casassus12). Except possibly in the proximal intestinal tract, the current consensus is that dietary flavonoids are not acting as direct antioxidants in vivo (Reference Ruskovska, Maksimova and Milenkovic10). Instead, a single compound can be transformed into an array of different metabolites, which are considered to be the main bioactive agents driving the physiological effects observed, and they may even display greater bioactivity than their precursor parent compounds(Reference Bowtell and Kelly4,Reference Murota, Nakamura and Uehara13–Reference Di Gesso, Kerr and Zhang15) .
Fruit-derived flavonoids appear to have a beneficial effect on exercise performance and recovery, and metabolomics studies have shown potential in determining metabolite responses to flavonoid intake(Reference Nieman and Mitmesser3,Reference Bowtell and Kelly4) . It has been suggested that about 300 mg of flavonoids 1–2 h prior to exercise might improve exercise capacity, but this is based on a limited number of studies. While some exercise studies have incorporated metabolomics analyses, more work is still needed to better understand the interaction between flavonoid consumption and the exercise metabolome(Reference Nieman and Mitmesser3). A few different modes of exercise have been employed (cycling, running and swimming) with different supplementation schemes (acute and chronic), ranging from ‘whole food’ interventions to purified flavonoids(Reference Nieman and Mitmesser3). In the present study, we investigated changes in plasma metabolites following 15-d consumption of either a high- or low-flavonoid pre-workout beverage (HFB and LFB, respectively) from a randomised, controlled crossover trial described previously(Reference Kung, Vakula and Kim16). Plasma samples were collected before exercise, following exercise and during the subsequent recovery period to determine metabolite shifts in response to exercise and flavonoid intake. The purpose of this study was to conduct an untargeted GC-MS-based metabolomics analysis to investigate the effect of flavonoid ingestion on the exercise metabolome. We hypothesised that flavonoid metabolites would be detected in the plasma following HFB consumption, and that plasma metabolites associated with exercise (e.g. glucose, lactate, energy metabolism intermediates and lipids) would demonstrate the greatest extent of change from baseline to immediately post-exercise.
Materials and methods
Research design
This study was conducted as a part of a previously published randomised clinical trial(Reference Kung, Vakula and Kim16). The study was approved by the USU institutional review board (IRB Protocol no. 9255) and registered at clincicaltrials.gov as NCT03427879. Participants were informed of all study requirements and provided written informed consent prior to enrolment. A complete list of inclusion and exclusion criteria is provided in online Supplementary Table 1.
In brief, twelve cyclists completed this double-blind, placebo-controlled crossover study with two 15-d treatment arms separated by a 2-week washout period. During the intervention, subjects consumed a pre-workout beverage containing blueberry, cocoa and green tea flavonoids (about 490 mg total flavonoids) in a base of 2 % milk, or a low-flavonoid control (< 5 mg flavonoids), which contained alkalised cocoa and blueberry placebo power (but no green tea), also in a base of 2 % milk. The HFB and LFB beverages were coded, and participants were blinded to the order of treatments. On day 14, participants recorded their evening meal in a provided food journal and continued recording all foods and beverages consumed through the end of the final sample collection the following day. Participants were instructed to replicate all food and beverage intake for the second intervention. Additionally, participants were instructed to abstain from alcohol and strenuous activity on day 14.
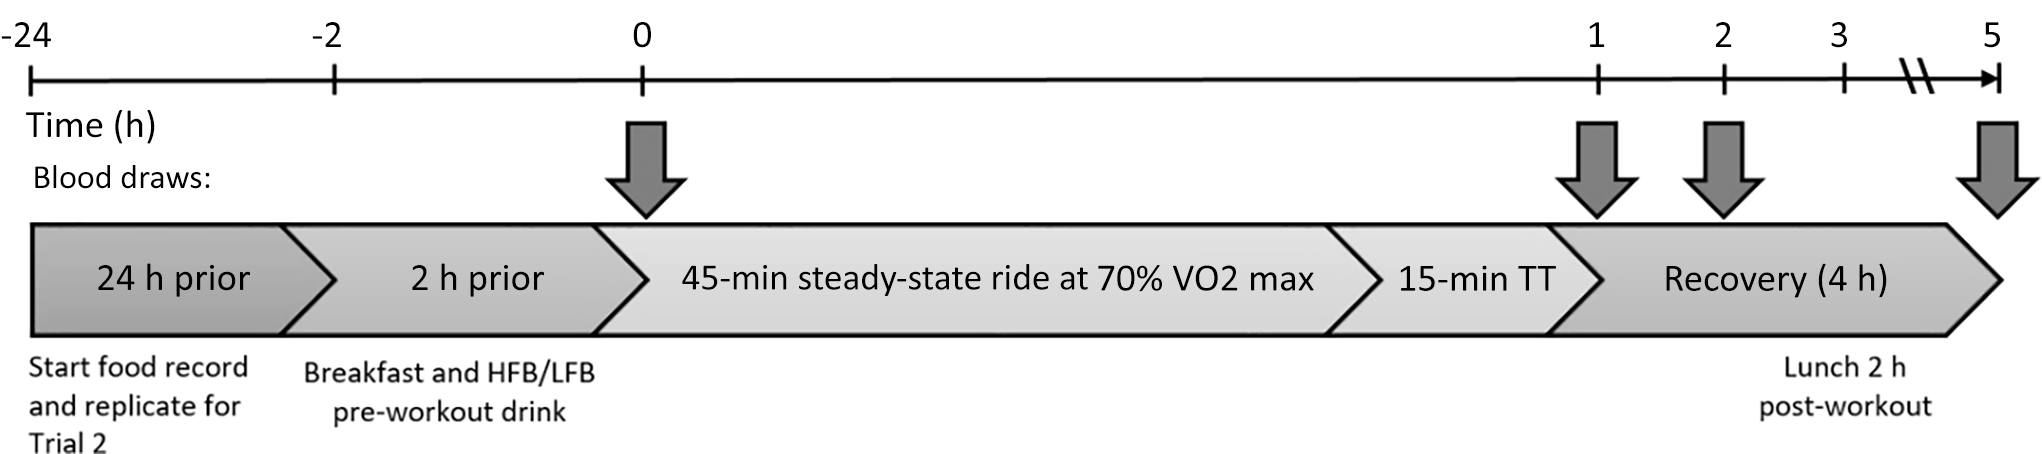
On day 15, subjects consumed their typical pre-workout breakfast and the test beverage 2 h prior to starting the exercise protocol. These meals were recorded in their food log so they could be consumed again in the second arm. After arriving at the clinic, their body mass was measured, a fasting blood sample was taken, and then research participants completed a 1-h cycling trial using a Velotron cycle ergometer (SRAM LLC), consisting of 45 min at 70 % VO2max followed by a 15-min time trial. The exercise intensity (70 % VO2max) was determined and adjusted based on expired gas analysis, with oxygen consumption recorded using a computerised online metabolic measurement system (Parvomedics TrueOne 2400). Blood samples were collected at four time points: pre-exercise, post-exercise, 1-h post-exercise and 4-h post-exercise (Figure 1). Seated venous blood samples were collected via antecubital venepuncture in potassium EDTA (K2EDTA)-treated Vacutainer tubes and centrifuged (1500 × g, 10 min, 4°C). Plasma was aliquoted to 1·5-ml polypropylene microcentrifuge tubes and stored frozen at −80°C until further analysis. Study personnel who administered the cycling test and processed the plasma and urine samples were blinded to treatment assignment. After the exercise, subjects’ body mass was measured again to determine water loss to perspiration. For 2 h post-exercise, subjects were advised to consume 1·5 times the amount of water lost in perspiration. Two hours after the exercise completion, subjects were free to eat whatever they chose but were asked to record their food intake and repeat with the same foods in the second arm of the study.
Experimental arm of the study and endpoint collection. HFB, high-flavonoid beverage; LFB, low-flavonoid beverage; TT, time trial.

Investigational product
The pre-workout supplement utilised in the present study was designed to supply nutrition to meet the metabolic demands of high-intensity endurance exercise(Reference Thomas, Erdman and Burke17,Reference Jeukendrup18) . A general recommendation for endurance athletes is to consume 1–2 g carbohydrate and 0·15–0·25 g protein per kilogram of body weight prior to activity(Reference Kerksick, Harvey and Stout19). The macronutrient composition of fluid bovine milk is particularly well suited for this purpose, and dairy products-derived protein is ideal for sports nutrition due to its ease of digestion and absorption, branched-chain amino acids content and protein quality(Reference Roy20). As a result, the investigational product – prepared from blueberry, cocoa and green tea powders and fluid 2 % milk – was formulated to supply 66 g of carbohydrate and 9 g of protein per serving.
Participants received fifteen individual servings of each pre-workout mix. They were advised to prepare it by mixing one 64 g package (containing sucrose, maltodextrin, whey protein isolate, cocoa powder, blueberry powder and green tea) with 240 ml of 2 % shelf-stable white milk. The resulting beverage contained 78·1 % milk, 8·6 % sucrose, 8·6 % maltodextrin, 2·4 % blueberry powder, 1·6 % cocoa powder, 0·6 % whey protein isolate and 0·1 % green tea powder. Subjects were asked to consume the beverage once daily, 2 h before the participant’s usual exercise time. Two versions were compared: a HFB that included high-flavonoid cocoa powder (83 mg/g flavanols from Barry Callebaut), freeze-dried blueberry powder (14·0 mg/g anthocyanins from the US Highbush Blueberry Council) and green tea extract (about 800 mg/g catechins from PureBulk) and a LFB that contained only about 4·6 mg total flavonoids by using alkalised cocoa (10 mg/g flavanols), a blueberry placebo powder, and omitting the green tea. Milk was selected as the base for both beverages due to its favourable taste, texture and additional protein and fat content. The flavonoid levels of all three ingredients were estimated based on documentation provided from the respective suppliers.
GC-MS-based plasma metabolomics
Methods for sample extraction and derivatisation for GC-MS metabolomics profiling were adapted from Fiehn(Reference Fiehn21). Sample extractions were prepared in duplicate. A method and derivatisation blank were prepared alongside the samples, but without the addition of plasma. For sample cleanup and extraction, 30 µl of plasma was mixed with 10 µl of 200 ppm ribitol (internal standard) and 1 ml of an acetonitrile, isopropanol and water mixture (3:3:2, v/v/v) at –20℃. The mixture was shaken for 5 min, centrifuged at 14 000 × g for 2 min. Next, 450 µl of supernatant was removed to a fresh container and evaporated to dryness in a centrifugal vacuum evaporator (Thermo Fisher). The dried aliquot was resuspended in 450 µl nitrogen-degassed acetonitrile/water (1:1, v/v), thoroughly mixed and centrifuged at 14 000 × g for 2 min. The supernatant was removed, evaporated to dryness and stored at –20℃.
A reagent blank was prepared alongside the samples (without the addition of plasma) beginning from this point forward. Samples were derivatised with 20 µl methoxyamine hydrochloride in pyridine (20 mg/ml). Following the addition of methoxyamine, samples were shaken for 1·5 h at room temperature. Next, 80 µl of a mixture of N-methyl-N-(trimethylsilyl)trifluoroacetamide and fatty acid methyl esters were added to each sample. Samples were then shaken for another 30 min and then submitted to GC-MS analysis.
The GC-MS instrument was a Shimadzu single-quadrupole gas chromatograph mass spectrometer (GCMS-QP2010 se) with a Zebron ZB-5MSi plus (30 m × 0·25 mm diameter × 0·25 μm film thickness) capillary GC column (Phenomenex). He was used as the carrier gas, and the column flow rate was 1·18 ml/min, with splitless injection and 5·5 min solvent cut time. The temperatures of the inlet, ion source and transfer line were 250°C, 230°C and 290°C, respectively. The initial oven temperature was 60°C with a 1 m hold, and the oven temperature was then ramped at 10°C/min to 325°C and held for 10 m. The detector was operated in scan mode from 50 to 600 m/z, and five scans were performed per second.
Compound peaks were selected by visual comparison of the chromatograms from the samples and method and reagent blanks, and features unique to the plasma samples were selected for identification. Peaks were deconvoluted with the automatic mass spectral deconvolution and identification system (AMDIS), identified with mass spectral and fatty acid methyl esters retention index library comparison and confirmed with the National Institute of Standards and Technology (NIST) mass spectral database. A quality control standard mixture of selected sugars, amino acids, lipids and other small metabolites was also used for identification of these compounds. Peak areas were determined, and multiple peaks representing the same compound – isomers and those formed from incomplete TMS derivatisation – were grouped into single features. Compounds determined to be artefacts (e.g. polysiloxanes from moisture introduced during derivatisation, phthalates from plastics, derivatisation reagent byproducts and EDTA from the collection tubes) and fatty acid methyl esters were omitted from the final compound table.
Statistical analysis
The final peak intensities table was uploaded to MetaboAnalyst 5.0, and analyses were completed using the online platform(Reference Chong, Wishart and Xia22). Missing values were assumed to be below the limit of detection and were imputed with 1/5 of the compound minimum value. Compound peak areas were normalised by the ribitol internal standard, log-transformed and auto-scaled (mean-centred, divided by the standard deviation of each feature). A two-way repeated-measures ANOVA was conducted to determine differences in normalised, scaled metabolite abundance, with the false discovery rate-adjusted q-value to consider the multiple comparisons across metabolites. Statistical significance was set at q < 0·05. Log2-transformed within-subject fold changes immediately post-exercise, 1-h post-exercise and 4-h post-exercise (relative to pre-exercise) were determined from the ribitol-normalised peak intensities. Post hoc testing with Tukey’s Honestly Significant Difference (HSD) was conducted for metabolites with a significant main effect; post hoc tests were performed with JMP version 15.2.1 for Windows (SAS Institute) with significance at α = 0·05.
Results
Participant characteristics
Twelve subjects (female n 4, male n 8; mean (sd): age 37 (sd 11) years, body mass 78 (sd 13) kg, height 1·74 (sd 0·09) m and VO2max 43 (sd 6) ml/kg/min) completed both arms of the study.
Physiological and perceptual responses to exercise
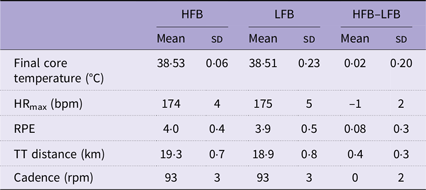
Both trials elicited a similar response in physiological and perceptual measures (Table 1).
Physiological and perceptual measures during a 1-h cycling trial

HFB, high-flavonoid beverage; LFB, low-flavonoid beverage; HR, heart rate; bpm, beats per minute; RPE, rating of perceived exertion; TT, time trial; rpm, revolutions per minute.
The exercise test elicited a similar change in heart rate, rating of perceived exertion and core temperature regardless of the treatment. Expired air samples collected during the steady-state exercise confirmed that cyclists were cycling at about 70 % VO2max. There was a trend for the treatment to increase power output (P = 0·051), but the effect size was small (d = 0·016), as previously reported(Reference Kung, Vakula and Kim16). Other performance measures (time trial cycling distance and cadence) were not significantly different between treatments.
Untargeted plasma metabolomics
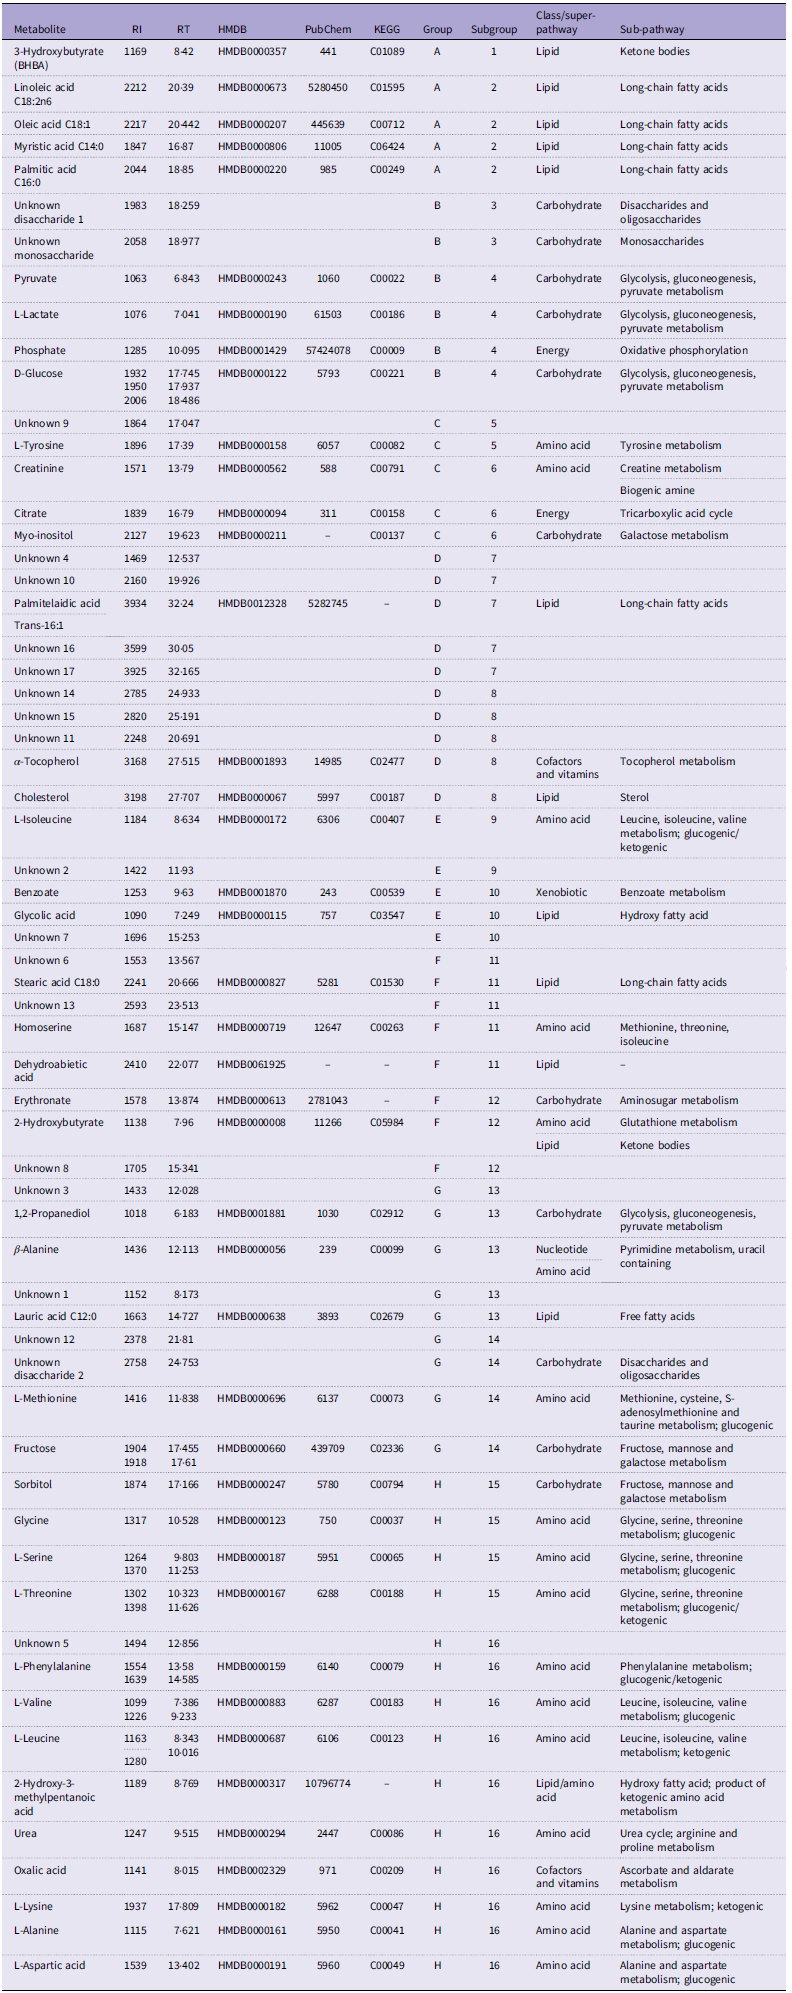
Several hundred features were detected in each sample, but many were determined to be artefacts (contaminants or extraction/derivatisation reagents), indistinguishable from the background signal, or unidentifiable due to lack of a suitable library match. Manual inspection of chromatograms yielded ninety-two metabolites in the plasma samples that differed from the derivatisation and reagent controls. Data cleaning involved condensing metabolites with multiple peaks, removing artefacts and peak alignment of the compound table across all ninety-six samples. A total of sixty-two metabolites were tabulated, with forty-two identified metabolites and twenty unknown compounds. Annotated metabolites – fatty acid methyl esters retention indices, retention times, identifiers and related metabolic pathways – are shown in Table 2. We identified eight carbohydrates, sixteen amino acids, twelve lipids, two cofactors and vitamins, two energy metabolites and one xenobiotic.
Identified plasma metabolites: retention index (RI), retention time (RT), Human Metabolome Database (HMDB) number, PubChem identifier, Kyoto Encyclopedia of Genes and Genomes (KEGG) identifier, and super- and sub-pathway association

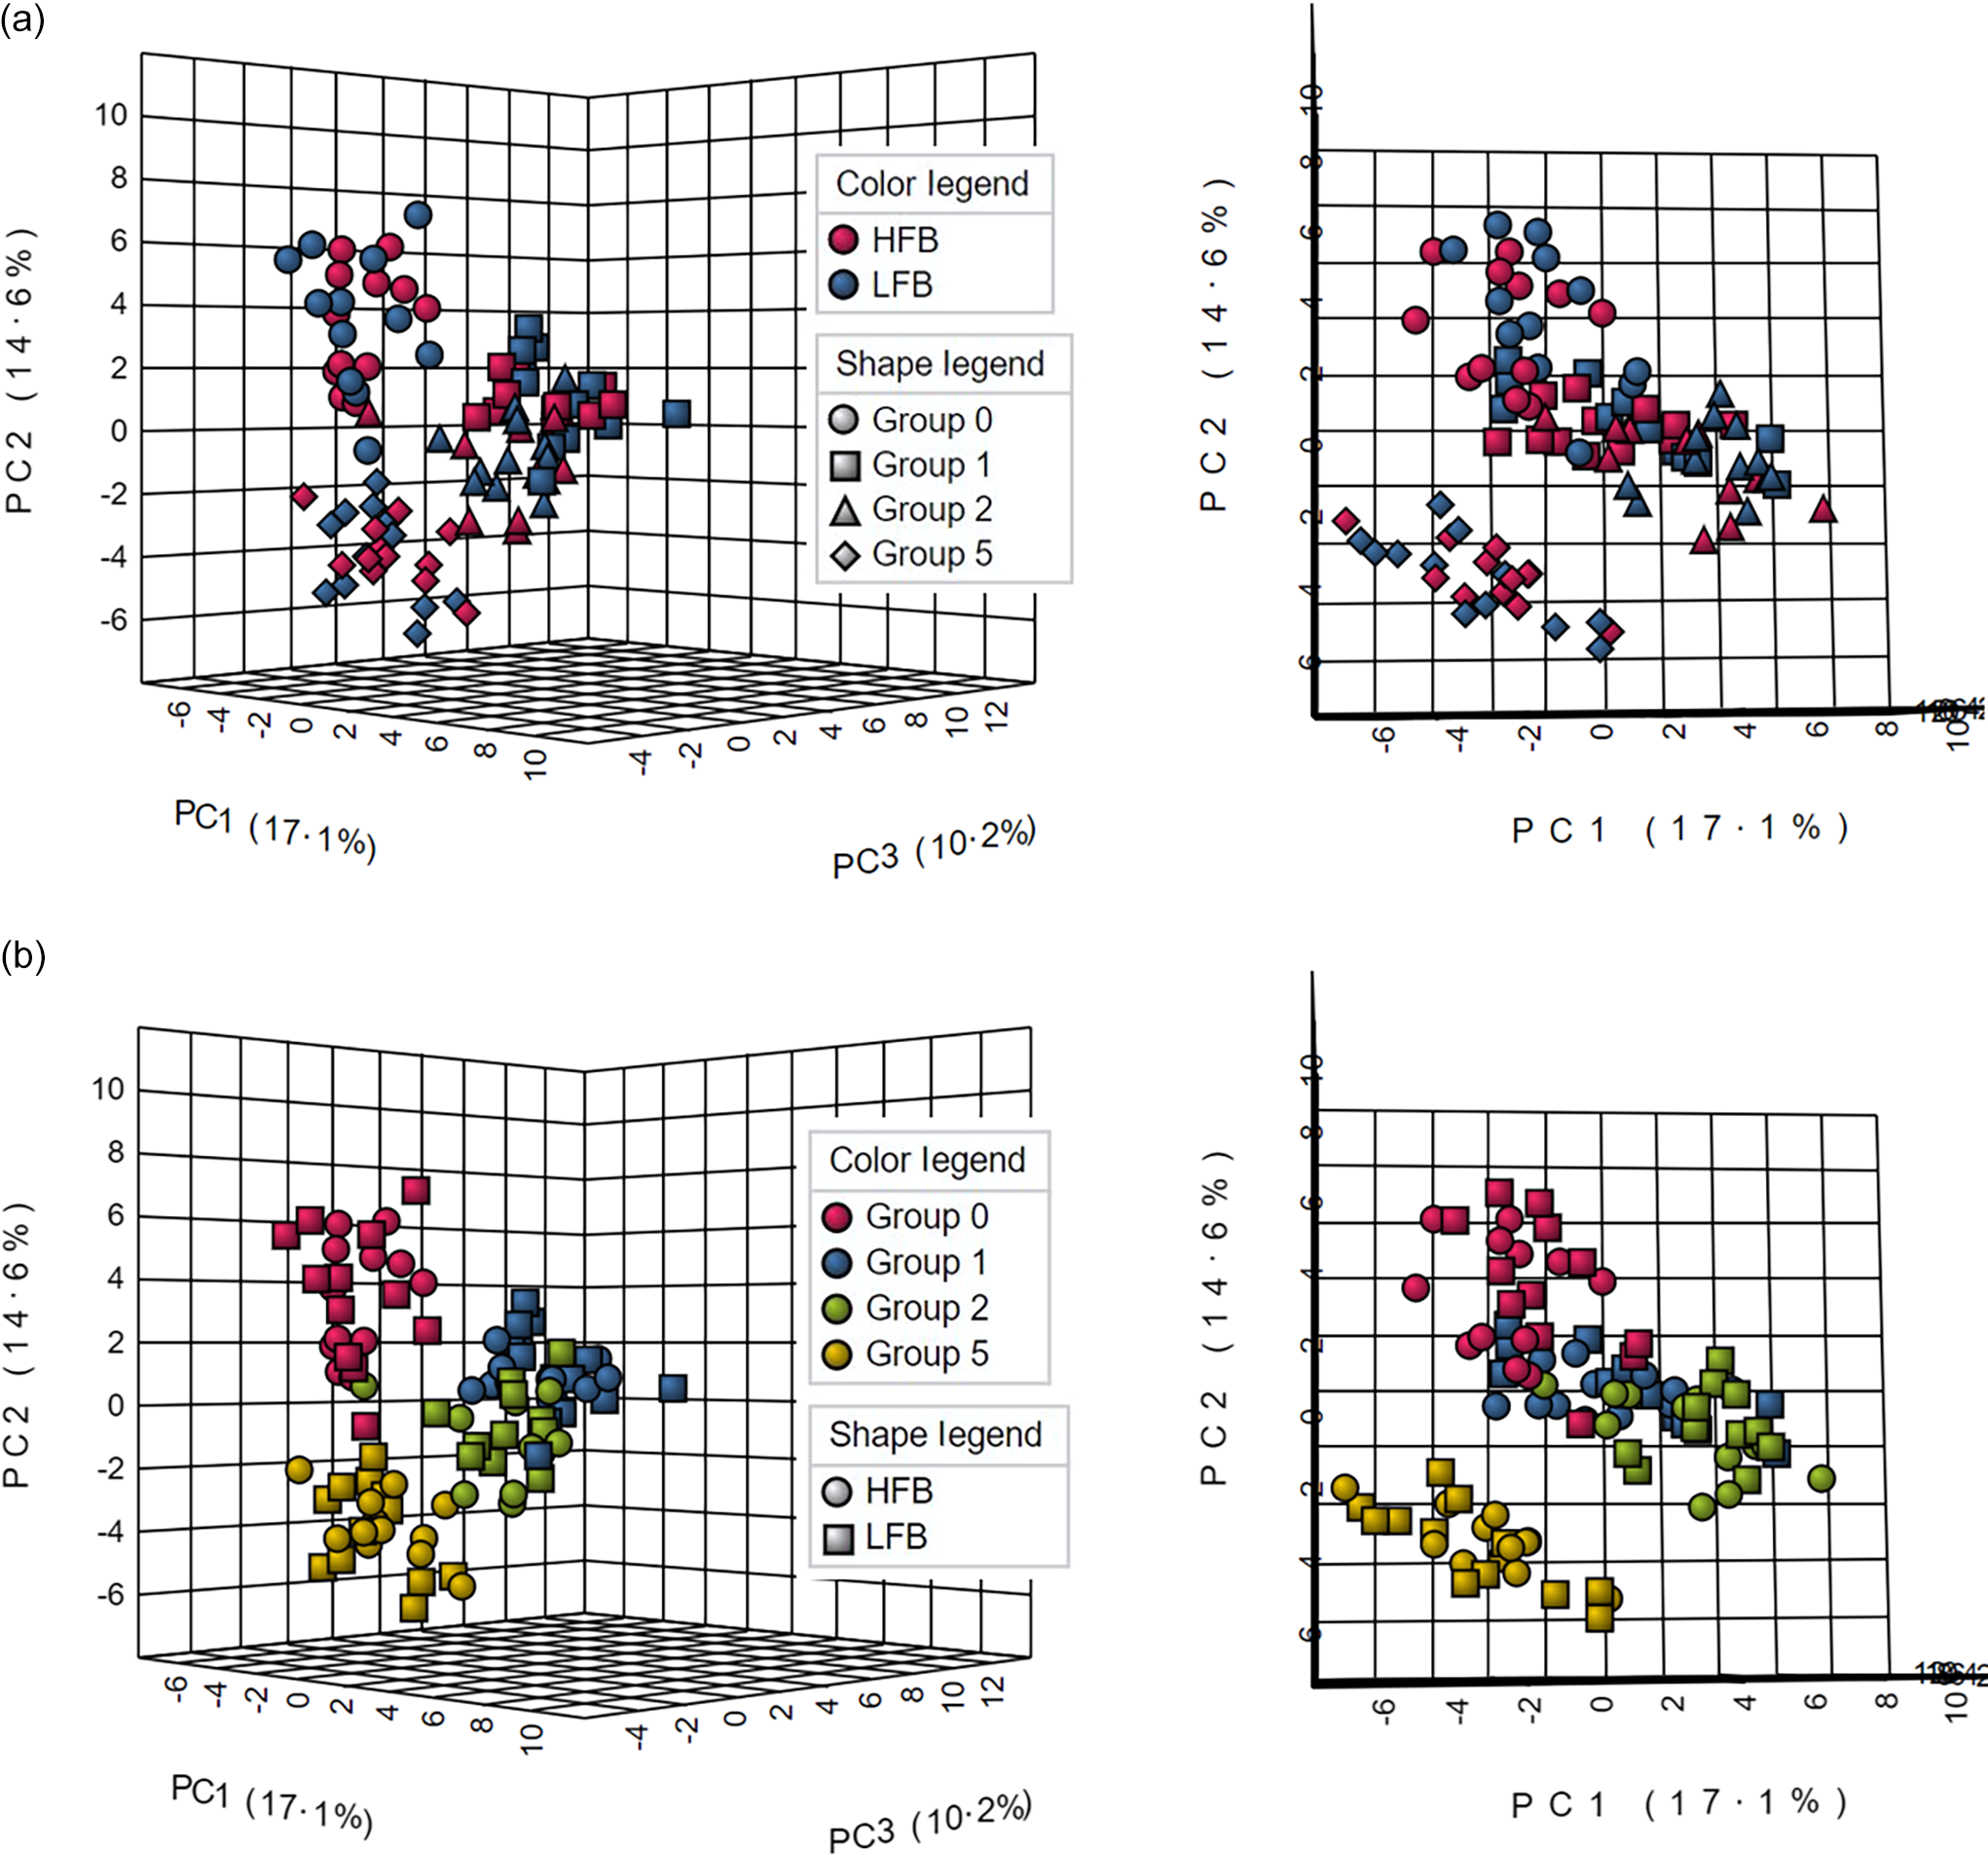
Principal component analysis showed that the samples grouped together according to time, with less distinction between treatments (Figure 2). The PC1, PC2 and PC3 axes explained 17·1 %, 14·6 % and 10·2 % of the total dataset variance, respectively. There appeared to be a larger separation for the metabolome at time 5 than at all other times and a slight separation with the pre-exercise metabolome (time 0). Metabolites immediately post-exercise (time 1) and 1-h post-exercise (time 2) appeared to have some separation but were grouped more closely together than other times.
Three-dimensional PCA of untargeted metabolomics analysis coloured by treatment (a) and time (b). PCA, principal component analysis; HFB, high-flavonoid beverage; LFB, low-flavonoid beverage.

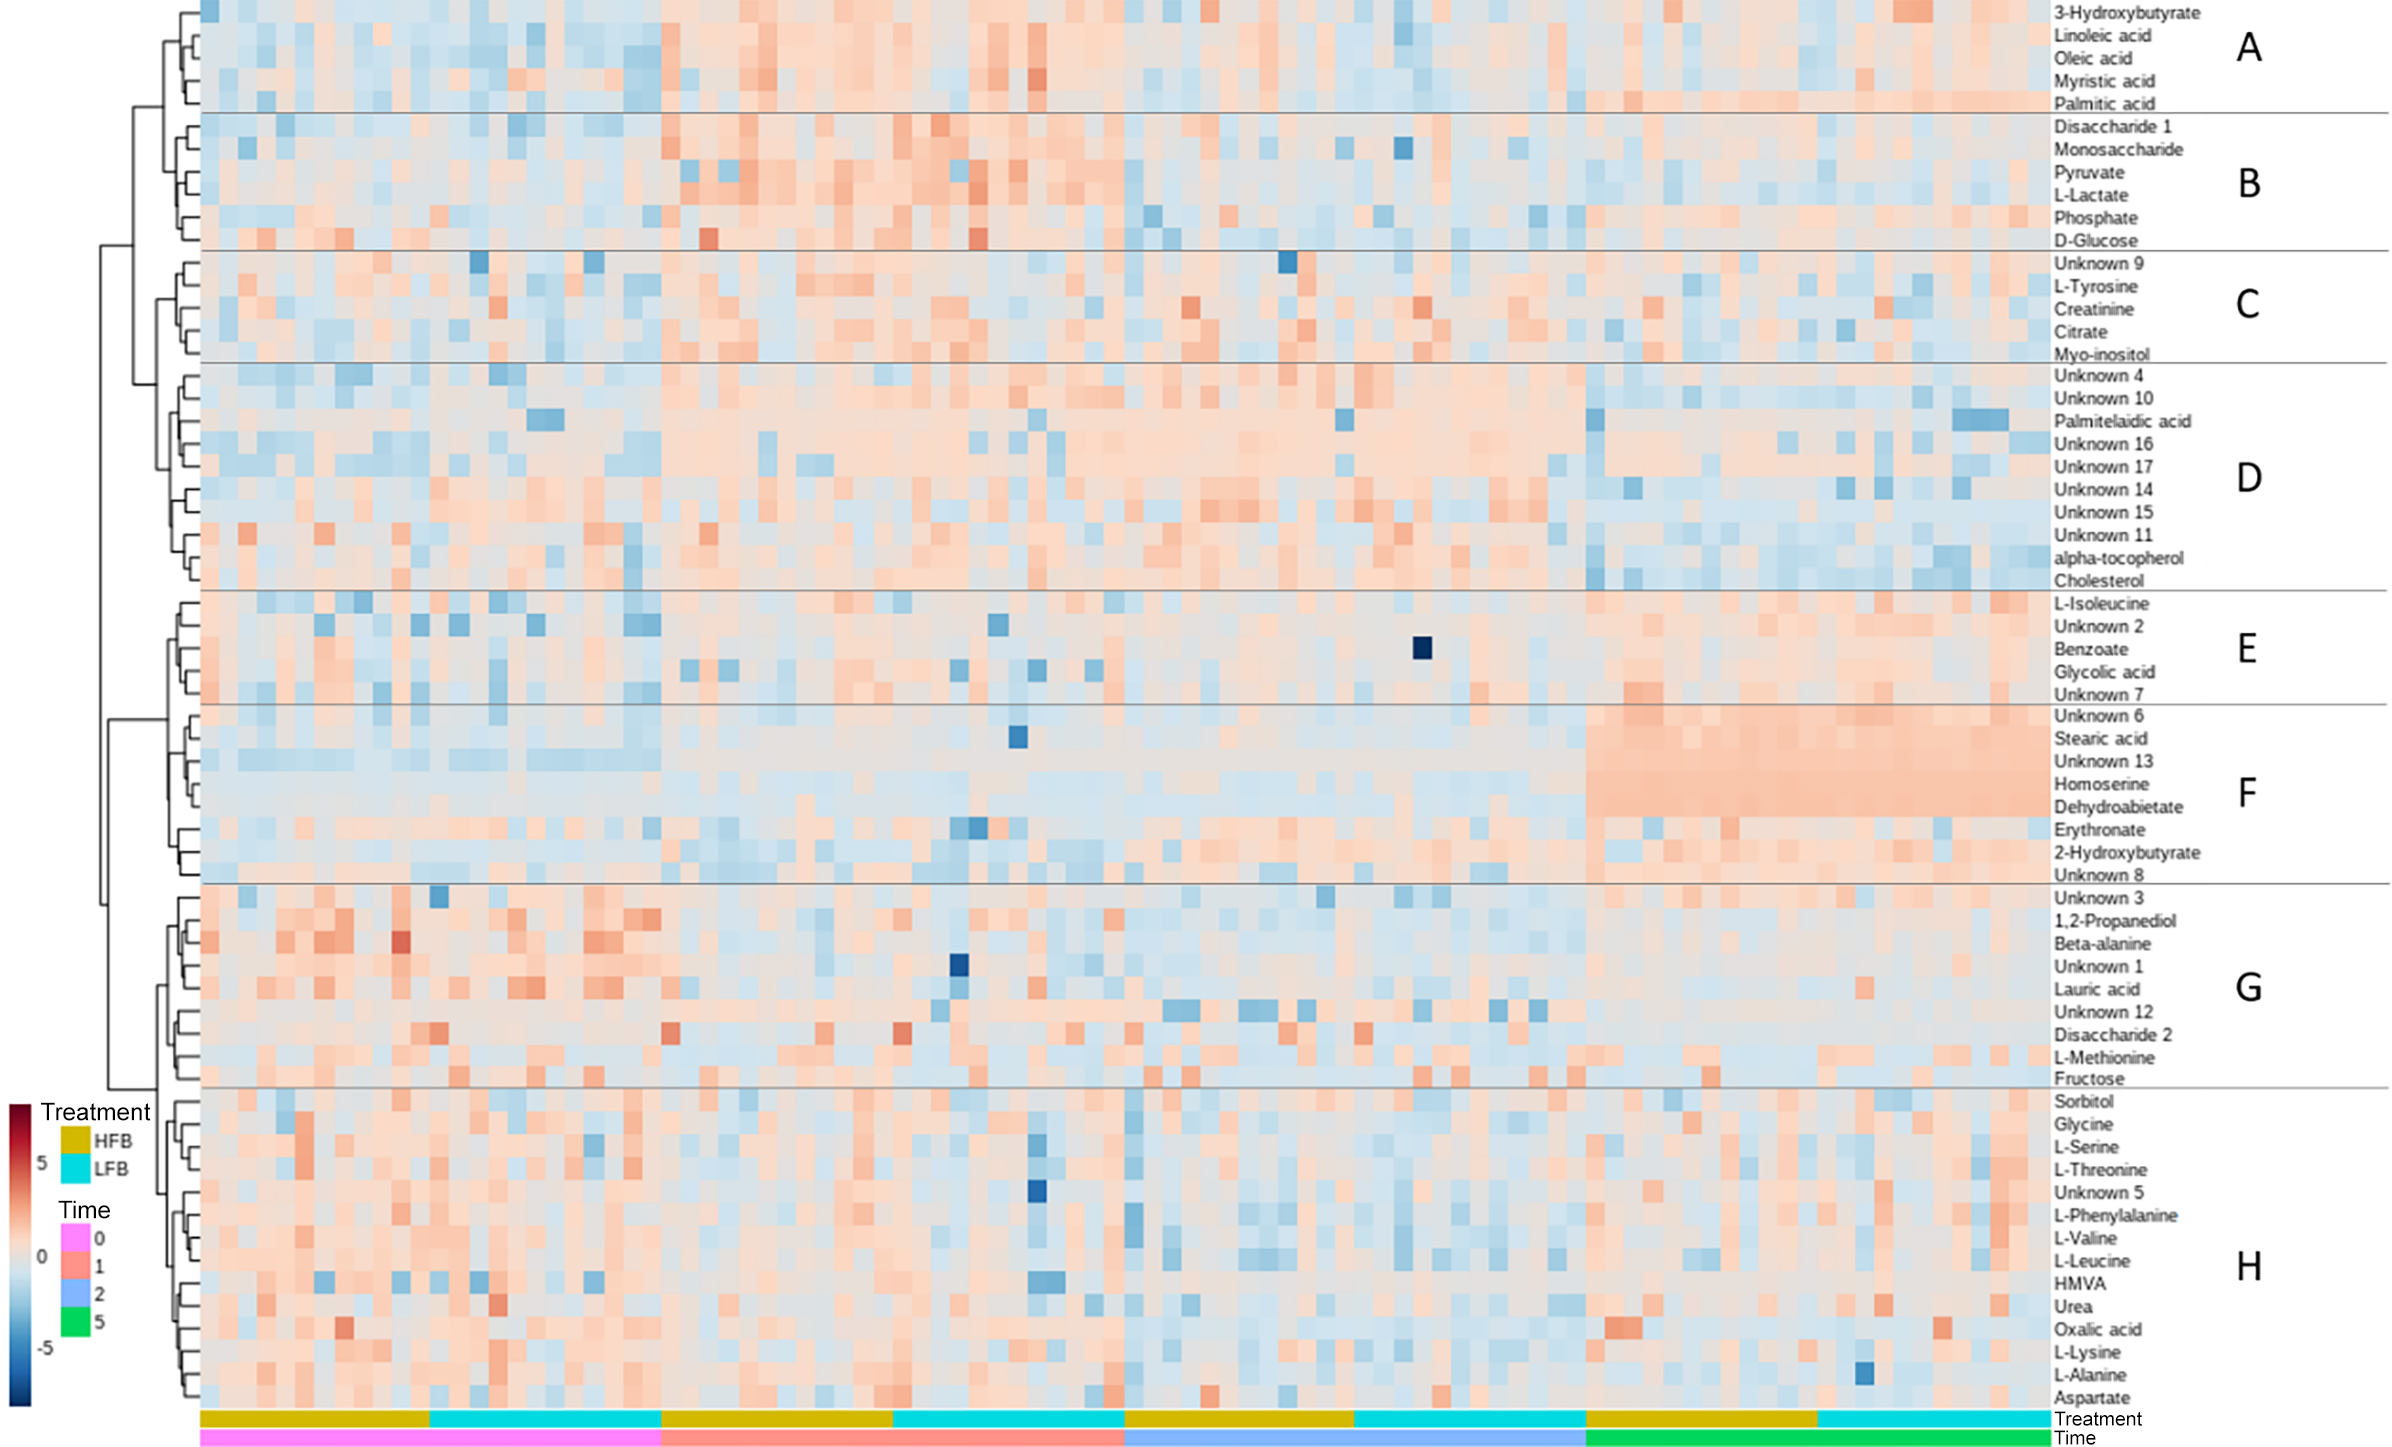
A heatmap generated with Euclidean distance measure and Ward clustering algorithm is shown in Figure 3. Sample groups A–H and subgroups 1–16 were designated based on the clusters generated. Groups and subgroup designations are also included in Table 2 along with the general classification of metabolite super- and sub-pathways. Group A metabolites include the ketone body 3-hydroxybutyrate along with four long-chain fatty acids (14:0, 16:0, 18:1, 18:2n6); overall, these lipids were lower pre-exercise compared with immediately post-exercise, with mixed responses at later times. Carbohydrates and energy metabolism-associated compounds (group B) were elevated immediately post-exercise and lower 1-h and 4-h post-exercise. A few different metabolite classes are represented in group C with relatively higher abundance immediately post-exercise and 1-h post-exercise for myo-inositol and citrate. Seven unknown compounds were grouped in D with the lipids palmitelaidic acid, α-tocopherol and cholesterol with most metabolites being more abundant at times 1 and 2 compared with 0 and 5. Interestingly, metabolites in groups E and F appear to be consistently elevated at time 5, 4-h post-exercise. A few different metabolite classes are represented in Group G, and these metabolites appear to be most abundant pre-exercise. Finally, Group H consists of eleven amino acids and related compounds, in addition to an unknown carbohydrate and vitamin/cofactor metabolite.
Heatmap visualisation of plasma metabolites grouped by time and then treatment. Samples are arranged in columns. Darker red indicates higher abundance, and darker blue indicates lower abundance. HFB, high-flavonoid beverage; LFB.

The two-way repeated-measures ANOVA (log-transformed and auto-scaled values) showed that 56 of 62 total features were significant with respect to time (false discovery rate-adjusted q-value < 0·05) (online Supplementary Data). Metabolites without significant time effects were aspartate, benzoate, glycolic acid, 2-hydroxy-3-methylpentanoic acid, methionine and unknown 9. No significant treatment effects or treatment-by-time interactions were observed for any of the metabolites.
Of particular interest were select metabolites from three super pathways expected to change most with exercise: compounds involved in glycolysis and energy metabolism, lipids and ketone bodies and amino acids. The response over time for a few selected compounds from each group is shown in Figure 4. Since only the time effect was significant, the values plotted are HFB and LFB combined.
Plasma metabolites pre- and post-exercise. Grey bars are group means, and coloured lines represent individual subjects. Since treatment effects were not significant, values are plotted for HFB and LFB combined at each time. Different letters indicate significantly different groups (Tukey’s HSD). HFB, high-flavonoid beverage; LFB, low-flavonoid beverage.

The log2-transformed mean fold changes from pre-exercise for these metabolites are reported in Tables 3–5. Increases and decreases in abundance relative to pre-exercise are reflected in values > 0 and < 0, respectively. Since only the main effect of time was significant, differences determined from post hoc tests are indicated for overall fold changes and not for either treatment individually.
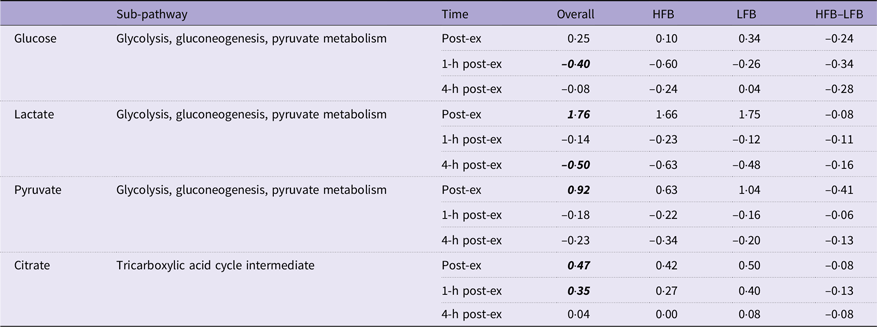
Fold changes from baseline (immediately, 1-h and 4-h post-exercise) in glycolysis and energy metabolites

HFB, high-flavonoid beverage; LFB, low-flavonoid beverage.
Data are log2-transformed values. Post hoc testing: overall values lsmeans significant differences from pre-exercise determined by Tukey’s HSD are in bold and italicised font.
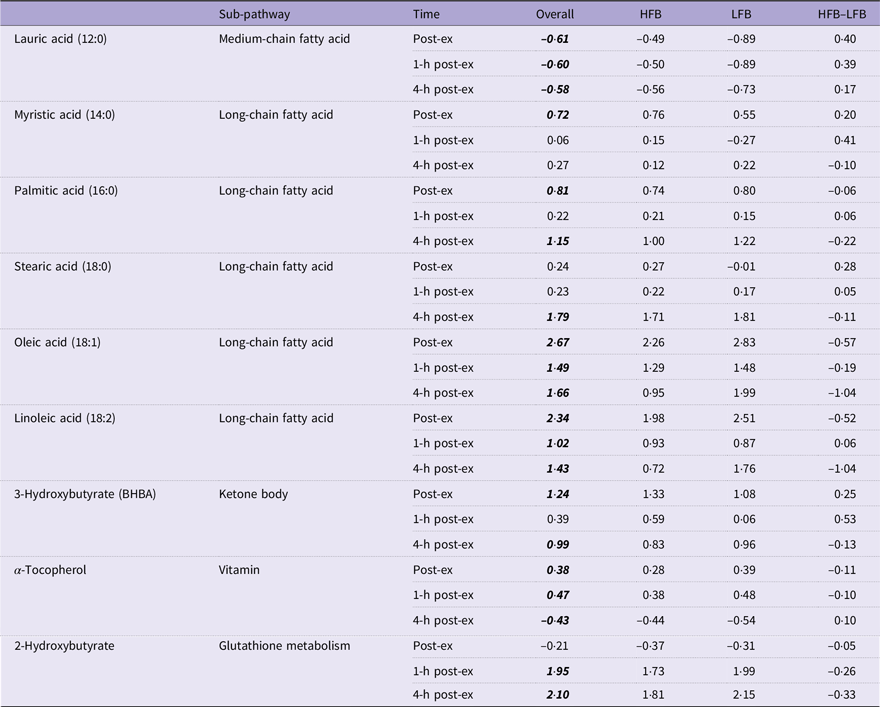
Fold changes from baseline (immediately, 1-h and 4-h post-exercise) in lipid-related metabolites

HFB, high-flavonoid beverage; LFB, low-flavonoid beverage.
Data are log2-transformed values. Post hoc testing: overall values lsmeans significant differences from pre-exercise determined by Tukey’s HSD are in bold and italicised font.
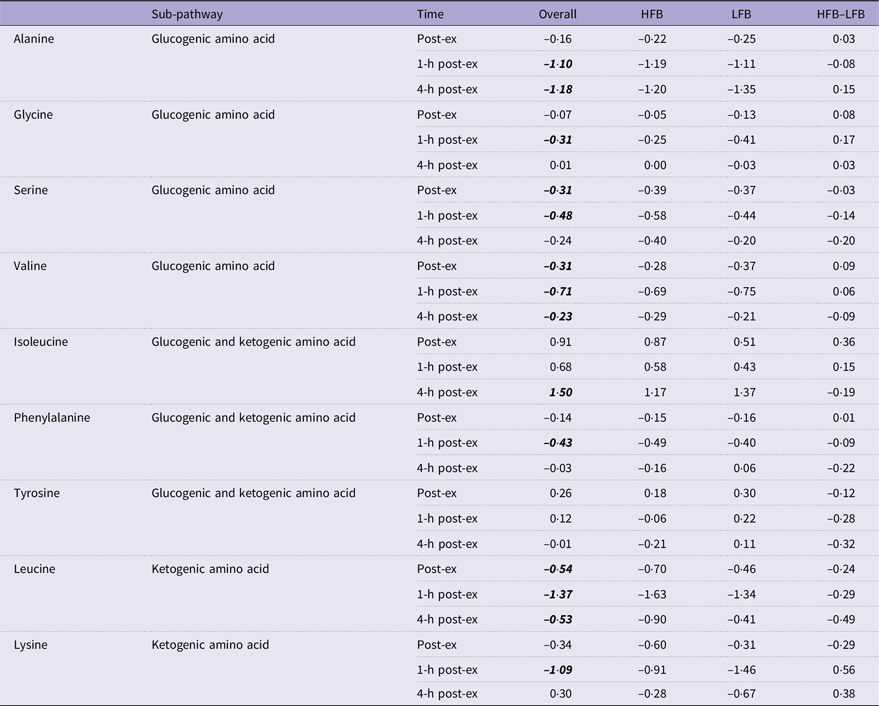
Fold changes from baseline (immediately, 1-h and 4-h post-exercise) in selected amino acids

HFB, high-flavonoid beverage; LFB, low-flavonoid beverage.
Data are log2-transformed values. Post hoc testing: overall values lsmeans significant differences from pre-exercise determined by Tukey’s HSD are in bold and italicised font.
Discussion
The primary aims for this study were to investigate the plasma metabolome pre- and post-exercise and to determine if flavonoid-derived metabolites can be detected from pre-workout flavonoid intake. Based on the post-exercise sampling phases as described by Schranner et al., samples collected immediately (time 1), 1-h (time 2) and 4-h (time 5) post-exercise are considered early, intermediate and late recovery phase samples, respectively(Reference Schranner, Kastenmüller and Schönfelder2).
The principal component analysis and heatmap visualisation showed metabolome differentiation and metabolite patterns observed with respect to time and not treatment. Metabolite profiles clustered distinctly according to time with the greatest separation in the late recovery phase, and several metabolites like homoserine appeared only at this time.
The clustering algorithm grouped the metabolites into eight clusters based on response. These metabolite patterns are consistent with the findings from a systematic review of exercise metabolomics studies: early-phase post-exercise increases in carbohydrates and energy metabolism metabolites (lactate, pyruvate and tricarboxylic acid cycle intermediates), a large elevation in lipids and a mixed response in amino acids(Reference Schranner, Kastenmüller and Schönfelder2).
Large fold changes were observed in lactate, pyruvate and citric acid immediately following exercise. Lactate, as a product of anaerobic glycolytic metabolism, has historically been used as an indicator of endurance capacity at a given exercise intensity(Reference Faude, Kindermann and Meyer23). High levels of pyruvate, in addition to lactate, accumulate as a result of glycolysis and anaerobic metabolism(Reference Schranner, Kastenmüller and Schönfelder2). The time course profile of lactate and pyruvate (elevated immediately post-exercise, followed by a decline to baseline after an hour of recovery) reflects the responsiveness of these metabolic pathways to the energy demands of exercise. Several different pathways contribute to glucose flux: glycogenolysis and gluconeogenesis in the liver increase glucose availability, while glucose uptake increases in muscle tissues through insulin-independent mechanisms(Reference Goodyear and Kahn24,Reference Rui and Terjung25) . Following cessation of exercise, glucose uptake continues to be elevated during recovery, which reduces circulating glucose and may explain the reduction in plasma glucose observed after 1 h of recovery(Reference Adams26).
Endurance exercise elicits a strong response in circulating free fatty acids and ketone bodies as alternative fuel sources to glucose(Reference Schranner, Kastenmüller and Schönfelder2). During prolonged moderate-intensity exercise, lipids are mobilised for energy production and contribute a considerable amount to energy production through β-oxidation and ketone body formation(Reference Hawley John, Hargreaves and Joyner Michael27). Nieman et al. found that metabolites involved in lipolysis and lipid oxidation are strong predictors of the metabolic response to intensive endurance exercise(Reference Nieman, Gillitt and Sha28). Similarly, all thirty-seven fatty acids reported in the systematic review by Schranner et al. increased following exercise(Reference Schranner, Kastenmüller and Schönfelder2). In the present study, the greatest fold changes of all metabolites were observed in lipid-related compounds. In particular, long-chain free fatty acids (palmitic, stearic, oleic and linoleic) and the ketone body 3-hydroxybutyrate displayed large fold increases and sustained responses to exercise. Ketone bodies are synthesised from ketogenic amino acids and acetyl CoA as alternative fuel for the brain and muscle tissues during long-duration exercise when carbohydrates become limited(Reference Evans, Cogan and Egan29).
The patterns and directions of change for amino acids following exercise are not as consistent across studies in comparison to lipids, but in general, lower amino acid concentrations are reported following exercise(Reference Schranner, Kastenmüller and Schönfelder2). The majority of the detected amino acids decreased relative to baseline with the exception of isoleucine, which was elevated about 3·7-fold at time 5. In the heatmap visualisation, most proteinogenic amino acids clustered together in group H, while isoleucine was in group E. This is somewhat surprising since isoleucine is a branched-chain amino acid along with leucine and valine, but the reason for the difference in response to exercise is unclear. Aside from isoleucine, the fold changes of the amino acids were relatively small.
After exercise, two different antioxidant-related metabolites were elevated. Antioxidants are necessary to maintain cellular redox balance and prevent oxidative damage to biomolecules(Reference Kerksick and Willoughby30). There was a strong response of 2-hydroxybutyrate at the intermediate and late recovery phases where the metabolite increased 4-fold and 4·6-fold, respectively. Elevated lipid β-oxidation, NADH/NAD+ imbalance and oxidative stress following intensive endurance exercise cause 2-hydroxybutyrate to increase(Reference Gall, Beebe and Lawton31). Glutathione is a major endogenous antioxidant that is primarily responsible for reducing lipid peroxidation, and 2-hydroxybutyrate is a byproduct of supplementary glutathione synthesis via homocysteine(Reference Kerksick and Willoughby30,Reference Pechlivanis, Papaioannou and Tsalis32) . The presence of 2-hydroxybutyrate at these later times suggests continued and elevated glutathione demand despite the cessation of exercise several hours prior. Another contributor to the antioxidant response is α-tocopherol (vitamin E). An exogenous lipid-soluble antioxidant, α-tocopherol is notably elevated from baseline in the early and intermediate recovery phases (potentially due to exercise-associated lipolysis), but lower in the late phase, which may be due to increased cellular uptake(Reference Pincemail, Deby and Camus33). Both the responses in 2-hydroxybutyrate and α-tocopherol suggest an increased demand for cellular antioxidants in the intermediate and late recovery stages.
Exercise increases reactive oxygen species production several fold, but the adaptive response includes the activation of endogenous antioxidant defence systems, resulting in up-regulation(Reference Kawamura and Muraoka34). Within skeletal muscle, exercise-induced metabolic stress results in additional positive adaptations by activating native anti-inflammatory mechanisms, protein turnover, mitochondrial biogenesis and the heat-shock protein response(Reference Mason, Trewin and Parker35). The exercise and hormesis theory posits that both a lack of exercise and overtraining can have negative effects, while a moderate volume with adequate recovery is beneficial(Reference Gomez-Cabrera, Domenech and Romagnoli36). With regular training, the adaptive response to exercise increases resting antioxidant enzyme levels and reduces oxidative stress following exercise(Reference Kawamura and Muraoka34). Though it may seem advisable to decrease exercise-induced oxidative stress by increasing antioxidant intake, large-dose antioxidant supplementation during regular exercise training may be counterproductive. Large-dose vitamin C and E supplementation has been reported to interfere with these cellular adaptations by scavenging reactive oxygen species, thus blunting the reactive oxygen species-activated adaptive response to exercise(Reference Mason, Trewin and Parker35). In contrast, flavonoid supplementation has not been shown to inhibit positive exercise adaptations to the same extent, and as opposed to vitamins C and E, circulating flavonoids and their metabolites do not behave as direct antioxidants(Reference Galleano, Verstraeten and Oteiza37). For example, 30-d supplementation with lychee fruit extract containing catechins and proanthocyanidins improved running time to exhaustion and the subjects’ mean anaerobic threshold, whereas a combination of vitamins C and E resulted in a reduction in VO2max(Reference Kang, Hahn and Kim38).
In the present study, we did not observe any performance benefits or differences in antioxidant-related metabolites due to flavonoid supplementation. Flavonoids exhibit anti-inflammatory and antioxidative effects, likely through down-regulation of NF-κB signalling and the activation of the Nrf2/ARE pathway, respectively(Reference Kashi, Shabir and Da Boit39). Yet, specifics regarding optimal flavonoid intake (minimum effective dose, supplement timing with exercise and length of supplementation required) to have measurable changes on various outcome measures are still unknown(Reference Nieman and Mitmesser3).
The metabolomics analysis did not reveal any host- or microbiota-derived flavonoid metabolites in the plasma. Previously, metabolites of cocoa flavan-3-ols, tea catechins and berry anthocyanins have been identified in blood and urine(Reference Nieman, Gillitt and Knab40–Reference Rodríguez-Morató, Matthan and Liu45). These studies relied on the use of LC-MS, HPLC and UPLC to separate and detect flavonoid and phenolic metabolites, with a few using a combination of both GC-MS and LC-MS. GC is a reliable method for simultaneous measurement of sugars, amino acids and medium- to long-chain fatty acids, and while we observed strong effects of exercise on the metabolome, we were unable to capture nutritional effects.
Another challenge encountered in this study was with compound identification. While metabolomics is excellent for profiling global changes, a common challenge is that hundreds of features may be detected in a sample, with limited resources for compound identification(Reference Gibney, Walsh and Brennan46). For example, in another study, 238 metabolites were detected with a combination of LC-MS and GC-MS, of which seventy-five remained unidentified(Reference Hodgson, Randell and Boon47).
While our subjects did consume the LFB and HFB approximately 2 h prior to the first blood draw, they were also welcome to consume their traditional pre-workout foods. We asked them to refrain from consuming food for 2 h after the exercise trial, as one of the primary study endpoints was gut permeability, and subjects had consumed sugar probes consisting of sucrose, mannitol, lactulose and sucralose post-exercise. After 2 h, subjects were free to consume their normal recovery foods but were asked to consume the same foods in each arm of the trial. Thus, we did not strictly control diet across our subjects, which may have affected the number of metabolites affected in our study.
Our data indicates that fifty-six metabolites changed in the plasma of subjects as a function of time, and the kinetics of their response fit into eight groups and sixteen subgroups. This pattern emerged from the data despite the fact that diets were not controlled in the subjects starting 2 h after the exercise trial. It is possible that some post-exercise recovery diet-derived metabolites were differentially present in the plasma, but this would have only occurred at the 5-h time point, as the 1-h post-exercise time point was collected prior to any food intake. It is unclear if we would have detected more differences if the diets were controlled. In Figure 4, there were four metabolite groups that had an increase in the 4-h post-exercise time point. Of these, two group patterns contained metabolites that could be derived from food (i.e. glucose and isoleucine), and two group patterns were likely derived from energy mobilisation from stored fat (i.e. 2-hydroxybutyrate and 3-hydroxybutyrate).
Overall, metabolomics is a powerful method for profiling the metabolic response to an intervention, and the exercise-induced metabolic perturbation following a 1-h, moderate- to high-intensity cycling trial had a different response during the early, intermediate and late phases of recovery. Metabolites involved in similar pathways, such as long-chain fatty acids, responded in a similar manner. Multiple classes of compounds (sugars, free fatty acids and amino acids) changed in different directions in response to endurance exercise, suggesting that multiple fuel substrate pathways are activated to varying degrees at different times in exercise and recovery, and changes in energy metabolites, sugars and lipids were consistent with previous literature. Though some metabolites like lactate and pyruvate responded rapidly to exercise and returned to baseline during the intermediate recovery phase, several others, many unidentified, were relatively low but increased significantly in the late recovery period. As a result, it may be interesting to explore further out during recovery. In addition, the elevated antioxidant response of 2-hydroxybutyrate and α-tocopherol is interesting, and it may be worthwhile in future work to include measures of endogenous antioxidant mechanisms such as glutathione peroxidase, superoxide dismutase and oxidised/reduced glutathione. Finally, depending on the resources available and research goals, future studies may find that the benefits of utilising multiple analytical platforms and methods could outweigh the costs.
Supplementary material
For supplementary material/s referred to in this article, please visit https://doi.org/10.1017/S0007114526106801
Acknowledgements
The authors would like to acknowledge Kaitlyn Kauzor and Kyle McCarty for assistance with phlebotomy and Braden Harris for assistance in the clinic. The authors would like to thank Janet Bergeson for help with recruiting and organising the clinical study. The authors would also like to acknowledge Derek England and Michael Vakula for assistance with exercise testing.
This research was supported by several sources, including the Utah Agricultural Experiment Station, and was approved as paper no. 9858. In addition, financial support was provided by the Building Linkages through Learning and Discovery (BUILD) Dairy programme of the Western Dairy Center at Utah State University with financial support from Dairy West (Meridian, ID). The PhD research of SK was supported by a Presidential Doctoral Research Fellowship from the Office of Research at USU, and BUILD Dairy provided a 1:1 match. Funds for the clinical trial and consumables were provided by a stipend to RW from BUILD Dairy and the Utah Agricultural Experiment Station. This manuscript was approved as paper no. 9962 by the Utah Agricultural Experiment Station. The high-flavonoid cocoa powder and alkalised cocoa were provided by Barry Callebaut. The freeze-dried blueberry powder and blueberry placebo powder were supplied by the US Highbush Blueberry Council. The funders had no role in the design, analysis or writing of this article.
Conceptualisation: S. K., E. B., M. L. and R. W. Formal analysis: S. K. and R. W. Investigation: S. K., Y. K. and R. W. Methodology: S. K., Y. K., E. B. and R. W. Project administration: S. K. and R. W. Resources: E. B. and M. L. Supervision: R. W. and E. B. Visualisation: S. K. and R. W. Writing – original draft: S. K. Writing – review and editing: S. K., Y. K., E. B., M. L. and R. W.
The authors declare no competing interests.


 Open access