





1. Introduction
Dense turbulent suspensions are ubiquitous in industrial and natural scenarios, from process engineering to sediment transport. However, due to the number of physical mechanisms and the daunting range of scales, reaching a predictive understanding of these systems remains a formidable and unmet challenge. Historically, research on solid–liquid mixtures has predominantly gravitated around two extrema: on one side, dense and viscous-dominated suspensions (Guazzelli, Morris & Pic Reference Guazzelli, Morris and Pic2011); on the other, turbulent and dilute ones (Balachandar & Eaton Reference Balachandar and Eaton2010). Significant progress has been made in the understanding of inertial effects in suspensions, focusing on instabilities and the onset of turbulence, e.g. in pipe flows (Matas, Morris & Guazzelli Reference Matas, Morris and Guazzelli2003; Hogendoorn & Poelma Reference Hogendoorn and Poelma2018; Agrawal, Choueiri & Hof Reference Agrawal, Choueiri and Hof2019) and Taylor Couette flows (Majji, Banerjee & Morris Reference Majji, Banerjee and Morris2018; Dash, Anantharaman & Poelma Reference Dash, Anantharaman and Poelma2020; Morris Reference Morris2020b). Only recently have researchers started bridging the gap and tackled fully turbulent dense suspensions: in experiments, through refractive-index matching and medical imaging (Zade et al. Reference Zade, Costa, Fornari, Lundell and Brandt2018; Baker & Coletti Reference Baker and Coletti2019; Alméras et al. Reference Alméras, Risso, Masbernat and Fox2021; Hogendoorn et al. Reference Hogendoorn, Breugem, Frank, Bruschewski, Grundmann and Poelma2023); and in simulations, through particle-resolved approaches (Picano, Breugem & Brandt Reference Picano, Breugem and Brandt2015; Wang et al. Reference Wang, Peng, Guo and Yu2016; Olivieri et al. Reference Olivieri, Brandt, Rosti and Mazzino2020; Vowinckel et al. Reference Vowinckel, Zhao, Zhu and Meiburg2023). The nature of the measurements and the cost of the calculations, however, have imposed severe limitations on the particle material, size and number, as well as on the scales of the system. As such, the topic is still in its infancy.
An additional element, frequently encountered in solid–liquid mixtures, can further enrich the problem: the particles may be confined at fluid interface, where the dynamics is different from that in the bulk (Singh & Joseph Reference Singh and Joseph2005; Madivala, Fransaer & Vermant Reference Madivala, Fransaer and Vermant2009; Magnaudet & Mercier Reference Magnaudet and Mercier2020). The individual and collective behaviour of particles at interfaces has recently received significant attention, but the focus has been mostly on regimes where inertia is negligible or the particles are microscopic colloids (Hoekstra et al. Reference Hoekstra, Vermant, Mewis and Fuller2003; Masschaele, Fransaer & Vermant Reference Masschaele, Fransaer and Vermant2011; Fuller & Vermant Reference Fuller and Vermant2012; Garbin Reference Garbin2019). In all three classes of suspensions – dense, turbulent and interfacial – the particles tend to organize in clusters, but the underlying mechanisms are profoundly different. In dense suspensions, concentration fluctuations are driven by the hydrodynamic coupling between particles under shear (Wagner & Brady Reference Wagner and Brady2009; Brown & Jaeger Reference Brown and Jaeger2014; Denn & Morris Reference Denn and Morris2014). In turbulent suspensions, the particles distribute inhomogeneously when inertia prevents them from following the fluid trajectories (Bec et al. Reference Bec, Biferale, Cencini, Lanotte, Musacchio and Toschi2007; Balachandar & Eaton Reference Balachandar and Eaton2010; Monchaux, Bourgoin & Cartellier Reference Monchaux, Bourgoin and Cartellier2012; Brandt & Coletti Reference Brandt and Coletti2022). At liquid interfaces, buoyancy and surface tension generate attractive forces leading to compact assemblies (Vella & Mahadevan Reference Vella and Mahadevan2005; Botto et al. Reference Botto, Lewandowski, Cavallaro and Stebe2012; Protière Reference Protière2023). How do particles behave when these three situations intersect?
The present study focuses on the unexplored territory where turbulence, particle–particle interactions and interfacial effects are simultaneously at play. Examples of great practical relevance include microplastic pollution (van Sebille et al. Reference van Sebille2020) and froth flotation in industrial processing (Quintanilla, Neethling & Brito-Parada Reference Quintanilla, Neethling and Brito-Parada2021). Here we consider a seemingly simple system consisting of non-Brownian monodispersed spherical particles confined at the interface of quasi-two-dimensional (Q2D) turbulent layers. We perform extensive laboratory experiments in which turbulence intensity, interfacial tension, particle size, density and concentration are systematically varied. We investigate the propensity of the particles to form clusters and their response to the turbulent flow, both of which are shown to depend on just two non-dimensional parameters. These express the balance between the three primary forces: drag exerted by the fluid, capillarity at the interface, and lubrication between particles. We are thus able to establish a phase diagram that describes the widely different regimes exhibited by the system.
2. Methods
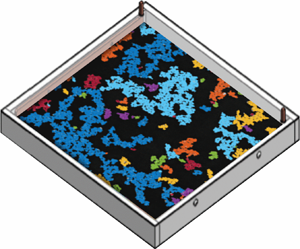
We employ shallow layers of conductive fluid (CuSO $_{4}$, 10 % aqueous solution by mass, $\rho _{{f}}=1.08~{\rm g}~{\rm ml}^{-1}$, $\nu =1.0 \times 10^{-6}~{\rm m}^{2}~{\rm s}^{-1}$) in a $320~{\rm mm} \times 320~{\rm mm}$ tray placed above an $8 \times 8$ array of permanent magnets, alternating their polarity in a chequerboard arrangement. Two copper electrodes immersed at opposite sides run DC current through the fluid and drive the flow by Lorentz force, the centre-to-centre distance between neighbouring magnets ( $L_{{f}}=35$ mm) being the forcing length scale. The apparatus, similar to those used in several investigations of Q2D turbulence (Kelley & Ouellette Reference Kelley and Ouellette2011; Boffetta & Ecke Reference Boffetta and Ecke2012), was fully characterized in a separate study (Shin, Coletti & Conlin Reference Shin, Coletti and Conlin2023).
We use two arrangements of the fluid layers and two sizes of millimetric polyethylene spheres (Cospheric WPMS-1.00, CPB-0.96), as summarized in table 1. In the single-layer configuration (SL), the particles float along the surface of (though are mostly submerged in) a 7 mm-thick conductive layer (air–liquid interface). In the double-layer configurations (DL1 and DL2), a 2 mm-thick layer of mineral oil ( $\rho _{{f}}=0.84~{\rm g}~{\rm ml}^{-1}$, $\nu =1.9 \times 10^{-5}~{\rm m}^{2}~{\rm s}^{-1}$, Sigma Aldrich) is added on top of the 8 mm-thick conductive layer, with particles positioned at this conductive layer–oil interface (liquid–liquid interface). The double-layer configurations DL1 and DL2 employ two different particle types (table 1). To prevent surfactant contamination and maintain stable interfacial properties during measurements, each fluid layer arrangement is allowed to equilibrate overnight. Continuous agitation is ensured by the forced turbulent flow throughout the experiment, preserving consistency in fluid interface conditions. We vary the aerial fraction $\phi \equiv N_{{p}}({\rm \pi} d_{{p}}^{2}/4)/A_{{FOV}}$ between 1 % and 71 %, where $N_{{p}}$ is the average number of particles in the field of view (FOV) of area $A_{{FOV}}$.
Summary of the experimental parameters for this study. Other key quantities crucial for analysing trends include: the fraction of clustered particles ( $\chi _{{cl}}$), indicating the extent of clustering; the mean cluster diameter ( $\langle D_{{cl}} \rangle$), defined as the weight-averaged diameter of circles that encompass each cluster; and the mean particle kinetic energy normalized by the fluid kinetic energy ( $\langle E_{{k,p}} \rangle / \langle E_{{k,f}} \rangle$).

For each case, we analyse 100 s long videos acquired with a Phantom VEO 640 complementary metal oxide semiconductor camera operated between 100 and 240 Hz depending on the flow condition, ensuring inter-frame particle displacements around 5 pixels ( ${\sim }1~{\rm mm}$). To mitigate potential boundary effects, we image exclusively on the central region of the flow tray, ensuring that our FOV remains at least one $L_{{f}}$ away from the sidewalls. We follow the particle centroids along Lagrangian trajectories with subpixel accuracy, using an in-house code for particle tracking velocimetry. Clusters, broadly defined as groups of adjacent particles, are detected with the DBSCAN algorithm (Ester et al. Reference Ester, Kriegel, Sander and Xu1996). We set the search radius of $1.25d_{{p}}$ around each centroid to seek for a minimum of four neighbours, and verify that the results are weakly dependent on the precise value of such parameters.
We characterize each level of hydrodynamic forcing by separate experiments, in which the fluids are laden only with tracer-like polyethylene microspheres ( $d_{{p}}=75\unicode{x2013}90~\mathrm {\mu }{\rm m}$, Cospheric UVPMS-BG-1.00) whose motion is characterized by particle image velocimetry. Similarly to the millimetric spheres, the tracer particles also lie predominantly at the fluid interface. The root-mean-square flow velocity $u_{{rms}}$ yields the Reynolds number $Re\equiv u_{{rms}}L_{{f}}/\nu$, where $\nu$ is the kinematic viscosity of the conductive fluid. We span a decade in $Re$ by adjusting the DC current between 0.01 and 1.00 A. All forcing levels are in the turbulent regime (Shin et al. Reference Shin, Coletti and Conlin2023) with Kolmogorov scales $\eta$ comparable to $d_{{p}}$.
3. Results and discussion
The present system shows a marked tendency to form clusters, as clear from figure 1, which displays two realizations at the same  $Re=970$ and $\phi =0.28$, but different interfacial conditions. For comparison, we define $\chi _{{cl}}$ as the number of clustered particles normalized by the total number of particles. Remarkably, in the SL configuration (figure 1a), the fraction of clustered particles $\chi _{{cl}}$ is more than five times larger than in the DL2 configuration (figure 1b). The sizes of the clusters, approximated as the diameter $D_{{cl}}$ of the circles encompassing them, also greatly differ between the two cases. To compare the dominant mechanisms at play, in the following we derive expressions for the main forces governing the particle motion: capillarity, drag and lubrication. In the considered range of parameters, electrostatic forces, e.g. due to asymmetrically distributed charges on the particles (Aveyard et al. Reference Aveyard2002), are several orders of magnitude weaker.
Example snapshots with detected clusters obtained at the same  $Re = 970$ and $\phi =0.28$ from different configurations: (a) SL, $\chi _{{cl}} = 0.99$; and (b) DL2, $\chi _{{cl}} = 0.23$. Scale bars correspond to $L_{{f}}=35~{\rm mm}$. The particles in each cluster are represented with the same colour. Circles encompassing each cluster are displayed.

The expression of the capillary attraction is determined by the nature of the distortion of the liquid interface around the particles. Assuming small slopes, the shape of the interface can be decomposed into Fourier modes. These expand into decaying multipoles, with each multipole excited by its corresponding Fourier mode at the contact line (Stamou, Duschl & Johannsmann Reference Stamou, Duschl and Johannsmann2000). When body forces and the torque on the particle are negligible, the leading-order interfacial disturbance  $h$ at a distance $r$ from its centre is the quadrupolar distortion (Liu, Sharifi-Mood & Stebe Reference Liu, Sharifi-Mood and Stebe2018)
 \begin{equation} h(r) = h_{{qp}} {d_{{p}}^{2}}/({4r^{2}}), \end{equation}
where  $h_{{qp}}$ is the mode's amplitude.
Conversely, when body forces on the particle are significant, the interfacial profile is described by the modified Bessel function of the second kind and order zero, whose asymptotic behaviour is logarithmic for small  $r$. To first order, the vertical balance between buoyancy and interfacial tension then yields (Vella & Mahadevan Reference Vella and Mahadevan2005)
 \begin{equation} h(r) = \tfrac{1}{2} \varSigma d_{{p}} {Bo} \ln(l_{{c}}/r). \end{equation}
Here,  $l_{c}=(\Delta \rho _{{f}} g/\gamma )^{-1/2}$ is the capillary length between fluids with density difference $\Delta \rho _{{f}}$ under the action of gravity $g$ and interfacial tension $\gamma$; the Bond number ${Bo} \equiv ({(\rho _{{f}}-\rho _{{p}})g d_{{p}}^{2}})/{4\gamma }$, with $\rho _{{f}}$ the density of the fluid on which the particle of density $\rho _{{p}}$ is floating; and
 \begin{equation} \varSigma \equiv \tfrac{1}{3}(2\rho_{{f}}/\rho_{{p}}-1) -\tfrac{1}{2}\cos{\theta}+\tfrac{1}{6}\cos^{3}{\theta} \end{equation}
is a dimensionless buoyancy-subtracted weight of the particle with the contact angle  $\theta$.
In all the considered configurations,  ${Bo} \ll 1$ (table 1), which indicates that the distortion induced by body forces is negligibly small. For example, for a particle in the SL configuration, where it is predominantly immersed ( $\theta < {\rm \pi}/2$), such distortion at the contact-line radius would be ${<}1~\mathrm {\mu }{\rm m}$, much smaller than the quadrupolar distortion of ${\sim }14~\mathrm {\mu }{\rm m}$. Thus, while the slower-decaying contribution from body forces becomes significant at large separations, the quadrupolar contribution remains dominant for the groups of adjacent particles considered here. Therefore, we write (Stamou et al. Reference Stamou, Duschl and Johannsmann2000; Liu et al. Reference Liu, Sharifi-Mood and Stebe2018)
 \begin{equation} F_{{capillary}}={-}{3{\rm \pi}\gamma h_{{qp}}^{2}d_{{p}}^{4}}/{r^{5}}, \end{equation}
with  $r$ the centre-to-centre interparticle distance.
Rather than characterizing  $h_{{qp}}$ (which requires precise measurements of the contact angles), we perform separate experiments in which particle pairs are placed in the fluid layer configurations and approach each other due to capillary attraction. In this creeping flow regime, $F_{{capillary}} = -F_{{drag}} = -(3/2) {\rm \pi}\mu \dot {r} d_{{p}}$, where $\dot {r}/2$ is the velocity of each particle in the pair and $\mu$ is the dynamic viscosity of the conductive fluid in which the particles are mostly submerged. This leads to the power-law relation (Loudet et al. Reference Loudet, Alsayed, Zhang and Yodh2005; Liu et al. Reference Liu, Sharifi-Mood and Stebe2018)
 \begin{equation} r_{0}^{6}-r^{6}(t) = \varTheta t, \end{equation}
where  $r_{0}$ is the initial interparticle distance at time $t=0$ and $\varTheta = {12\gamma h_{{qp}}^{2} d_{{p}}^{3}}/{\mu }$. We experimentally verify this relation by tracking particle pairs; see figure 2. The excellent agreement with (3.5) suggests that the interface deformation causes only marginal deviations from the Stokesian solution (Loudet et al. Reference Loudet, Qiu, Hemauer and Feng2020). Least-squares fits to (3.5) yield values of $\varTheta$, and thus $h_{{qp}}$, which are utilized for evaluating the capillary attraction in (3.4).
(a) A time series of a pair of particles in DL1 configuration. The scale bar indicates 5 mm. (b) Plot of  $\langle r_{0}^{6} - r^{6} \rangle$ versus $t$ in the three configurations. The dashed line indicates $\sim t$ scaling relation.

When the fluid flow is turbulent, the drag pulling a pair of particles away from each other is
 \begin{equation} F_{{drag}} = 3 {\rm \pi}\mu d_{{p}} \Delta u_{{f}}, \end{equation}
where  $\Delta u_{{f}}$ is the velocity difference between two fluid locations corresponding to a pair of closely situated particles, evaluated along the separation vector between the pair. As we are interested in the interaction of adjacent particles, we approximate $\Delta u_{{f}} \sim d_{p} \dot {\epsilon }_{{max}}$, where $\dot {\epsilon }_{{max}}$ is the maximum principal strain rate. The Stokesian assumption is justified by the particle Reynolds number $Re_{{p}}=d_{{p}}\Delta u_{{f}}/\nu$ being relatively small. Indeed, as the density of the particles approximately matches that of the fluid, $Re_{{p}}$ is equivalent (within a geometric factor) to the Stokes number ${St} \equiv \tau _{{p}}u_{{rms}}/L_{{f}}$ (Ouellette, O'Malley & Gollub Reference Ouellette, O'Malley and Gollub2008), which is listed in table 1. The particle response time is taken as $\tau _{{p}}={\rho _{{p}}d_{{p}}^{2}}/(18\mu )$, neglecting finite- $Re_{{p}}$ corrections. In turn, the values of $St$ indicate that the particles have insignificant inertia with respect to the energetic scales of the flow.
The strain rate is estimated by schematizing the flow field as an array of Taylor–Green vortices, whose velocity components in directions  $x$ and $y$ are, respectively,
 \begin{equation} \left. \begin{aligned} u & = U \cos \frac{{\rm \pi} x}{L_{{f}}} \sin\frac{{\rm \pi} y}{L_{{f}}},\\ v & ={-} U \sin \frac{{\rm \pi} x}{L_{{f}}} \cos\frac{{\rm \pi} y}{L_{{f}}}, \end{aligned} \right\} \end{equation}
for which  $\dot {\epsilon }_{{max}}\approx ({\rm \pi} /\sqrt {2})(u_{{rms}}/L_{{f}})$. While simplified, such a representation of the flow yields excellent quantitative agreement with the statistical properties of 2D turbulence (Shin et al. Reference Shin, Coletti and Conlin2023). It follows that
 \begin{equation} F_{{drag}} = \left(\frac{3 {\rm \pi}^{2}}{\sqrt{2}}\right) \frac{\mu d_{{p}}^{2} u_{{rms}}}{L_{{f}}}. \end{equation}
 We then define the capillary number given by the ratio of  $F_{{drag}}$ and $F_{{capillary}}$ evaluated for $r=d_{{p}}$:
 \begin{equation} {Ca} = \frac{6\sqrt{2} {\rm \pi}d_{{p}}^{6} u_{{rms}}}{\varTheta L_{{f}}}. \end{equation}
 In figures 1(a) and 1(b),  $Ca = 0.16$ and 2.49, respectively, which accounts for the much stronger clustering in the former: drag from the straining flow dominates, and clusters are disrupted for ${Ca} \gg 1$, and vice versa for ${Ca} \ll 1$. This is confirmed in figure 3(a), showing $\chi _{{cl}}$ versus $Ca$: collectively, the data adhere to a unified trend, confirming the role of $Ca$ as the controlling parameter. This applies at aerial fractions $\phi \leq 0.20$, for which $F_{{drag}}$ and $F_{{capillary}}$ are the main forces.
(a) The fraction of clustered particles ( $\chi _{{cl}}$) versus ${Ca}$ at $\phi <0.20$. (b) The normalized mean cluster diameter ( $\langle D_{{cl}} \rangle / L_{{f}}$, black) and the normalized particle kinetic energy ( $\langle E_{{k,p}} \rangle / \langle E_{{k,f}} \rangle$, red) as functions of $\phi$ at ${Ca} > 1$.

For large  $\phi$, on the other hand, we observe stronger clustering and a reduction in the root-mean-square particle velocity, which we attribute to additional viscous dissipation by the lubrication force (Wagner & Brady Reference Wagner and Brady2009; Morris Reference Morris2020a). For a pair of nearby particles moving at relative speed $\Delta u_{{p}}$, this is
 \begin{equation} F_{{lubrication}} = \frac{3 {\rm \pi}\mu d_{{p}}^{2} \Delta u_{{p}}}{8(r-d_{{p}})}. \end{equation}
 Relating  $\Delta u_{{p}} \approx r \dot {\epsilon }_{{max}} \approx r ({\rm \pi} /\sqrt {2}) (u_{{rms}}/L_{{f}})$, we approximate
 \begin{equation} F_{{lubrication}} = \frac{3 {\rm \pi}^{2} \mu d_{{p}}^{2} u_{{rms}} r }{8 \sqrt{2} (r - d_{{p}}) L_{{f}}}. \end{equation}
 Balancing  $F_{{lubrication}}$ and $F_{{drag}}$ yields the separation $r/d_{{p}} = 9/8$: lubrication prevails when neighbouring particles are, on average, closer than such distance, dissipating their kinetic energy. To obtain the corresponding aerial fraction, we employ random sequential adsorption (Evans Reference Evans1993) to distribute in 2D space non-overlapping circles with a range of diameters comparable to those of our particles, i.e. assuming a normal distribution of diameters with the same standard deviations as in table 1. This synthetic method indicates that the average nearest-neighbour separation reaches $(9/8)d_{{p}}$, for $\phi \sim 0.4$. This approximate threshold is confirmed in figure 3(b), showing the mean cluster diameter $\langle D_{{cl}} \rangle$ normalized by the forcing length scale $L_{{f}}$, and the particle kinetic energy $\langle E_{{k,p}} \rangle$ normalized by the fluid kinetic energy $\langle E_{{k,f}} \rangle$ (measured in the unladen case under the same forcing). For cases in which drag overcomes capillarity ( $Ca > 1$), the trends for different interfacial conditions are quantitatively similar: for $\phi > 0.4$, $\langle D_{{cl}} \rangle$ grows rapidly and $\langle E_{{k,p}} \rangle / \langle E_{{k,f}} \rangle$ dips. The cluster size appears to plateau at ${\sim }8.5L_{{f}}$, corresponding to the diagonal of the square FOV of size $6L_{{f}}$, i.e. the maximum size detectable by the imaging system. That is, above approximately $\phi =0.6$, the system percolates forming a macrocluster of vanishing small kinetic energy that spans the entire domain.
In summary, our analysis suggests three distinct regimes depending on the balance of three factors: capillarity, viscous drag and lubrication. When  $Ca < 1$, capillary attraction holds particles together and leads to the formation of tightly bound clusters. When $Ca > 1$, the strain field of the fluid acts on the particles through viscous drag and breaks up the clusters, as long as $\phi <0.4$; while lubrication preserves slowly moving clusters at higher concentrations. This is schematically illustrated in the phase diagram in figure 4(a) and by the snapshots in figure 4(b) corresponding to the three regimes: capillary-driven clustering, drag-driven break-up and lubrication-driven clustering. We remark that the identified values of the control parameters $Ca$ and $\phi$ are not expected to be critical thresholds, as the considered process does not entail abrupt transitions. In fact, within each one of these regimes, quantitative changes are still observed as the control parameters are varied. For example, in the capillary-driven clustering regime, the aggregates grow bigger with increasing $\phi$, as more particles stick to larger groups and these merge together; this is evident by comparing the two snapshots at $Ca = 0.23$ in figure 4(b). However, those differences appear quantitative rather than qualitative, and the main mechanisms responsible for the behaviour in each regime are not altered.
(a) Three predicted clustering/break-up regimes in  ${Ca}$– $\phi$ space. (b) Snapshots from different configurations, illustrating varying degrees of clustering with $\chi _{{cl}}$ values of 0.991 and 0.624 (i), (ii), and 0.990 and 0.249 (iii), (iv). Insets provide magnified views to highlight differences. Particles within each cluster are represented with the same colour.

The proposed phase diagram is supported by the contour maps over the  $Ca$–
$Ca$– $\phi$ space displayed in figure 5, which depicts the behaviour of the key observables discussed above for the parameter space we explored. In particular, in the map of $\chi _{{cl}}$ (figure 5a), dense vertical contour lines at $Ca < 1$ give way to horizontal ones at $Ca > 1$, bounding the drag-driven break-up regime. The trend of the normalized mean cluster size $\langle D_{{cl}} \rangle /L_{{f}}$ (figure 5b) is similar, with a sharp increase for $\phi \geq 0.4$. Over this range of concentrations, larger clusters are often centred at the core of vortical structures, where the local strain rate is insufficient to tear them apart (see the supplementary movies available at https://doi.org/10.1017/jfm.2024.246). Furthermore, comparing this map with that of the particle kinetic energy $\langle E_{{k,p}} \rangle / \langle E_{{k,f}} \rangle$, we notice that the motion of clustered particles is greatly inhibited when $\langle D_{{cl}} \rangle$ becomes much larger than $L_{{f}}$, which is the typical size of the forced turbulent eddies (Boffetta & Ecke Reference Boffetta and Ecke2012; Shin et al. Reference Shin, Coletti and Conlin2023): as a cluster spans multiple counter-rotating eddies, the latter are not effective in moving it around. Lastly, the energy maps reveal that even giant clusters spanning the entire domain (e.g. at $\phi \geq 0.6$) have different dynamics depending on $Ca$: they are effectively rigid and static when capillarity dominates ( $Ca < 1$), while they are softer and dynamic when drag takes over ( $Ca > 1$); see the supplementary movies.
Phase diagram in  ${Ca}$– $\phi$ space to characterize the particle behaviour, mapping (a) $\chi _{{cl}}$, (b) $\langle D_{{cl}} \rangle /L_{{f}}$ and (c) $\langle E_{{k,p}} \rangle / \langle E_{{k,f}} \rangle$.

We remark that the fluid kinetic energy is not directly measured, as the millimetre-sized particles impede sufficient optical access. The values we use, evaluated at the same forcing and  $\phi =0$, are, however, expected to be a close approximation of the fluid energy in the suspensions. The submerged particles only occupy a minor portion of the conductive fluid layer and therefore do not significantly alter the Lorentz force. The frictional dissipation on the particle surfaces is also a fraction of that experienced by the fluid on the floor of the tray, which dominates the dissipation rate (Shin et al. Reference Shin, Coletti and Conlin2023), except when giant rigid clusters of vanishing kinetic energy are formed.
4. Conclusion
We have investigated the spatial distribution and motion of particles at the interface of Q2D turbulent liquid layers. Those are governed by the balance of capillarity, drag and lubrication, and two non-dimensional parameters rule the system: the capillarity number  $Ca$ and the aerial fraction $\phi$ (equivalently, the normalized interparticle distance $r/d_{{p}}$). When $Ca < 1$, capillary attraction effectively binds particles into tight clusters. When $Ca > 1$, drag from the straining fluid flow prevents the formation of large clusters as long as $\phi <0.4$; while short-range lubrication yields slow-moving clusters when $\phi >0.4$. The present analysis assumes that the governing forces are independent, while coupling is expected, e.g. as capillary-driven clustering causes changes in the effective drag force. The agreement between prediction and observation, however, indicates that such a simplification is appropriate to first order.
This study opens several avenues for future investigations in related regimes. Clearly, the proposed phase diagram and its boundaries depend on the chosen configurations and the validity of the assumptions we made. For example, marine plastics include millimetre-sized particles but also micrometre-sized particles (van Sebille et al. Reference van Sebille2020), and the latter may hardly aggregate into cohesive clusters of size comparable to the energetic eddies. On the other hand, for larger  $Bo$ (e.g. particles only partially submerged in free-surface flows), the monopole contribution dominates and the capillary attraction decays much more slowly, with $F_{{capillary}} \sim r^{-1}$ (Vella & Mahadevan Reference Vella and Mahadevan2005), with significant implications for the prevalence of clustering. Under conditions of more intense turbulence close to the surface, large surface deformations may occur, influencing the transport of floating particles. Moreover, Q2D turbulence has peculiar characteristics which separate it from its classic three-dimensional (3D) counterpart, notably an inverse cascade of energy towards the larger scales (Tabeling Reference Tabeling2002; Boffetta & Ecke Reference Boffetta and Ecke2012). Still, it possesses essential hallmarks including chaotic/nonlinear behaviour, rotationality, stretching, folding and mixing of fluid elements, and wide ranges of spatio-temporal scales, making it a valuable system to investigate fundamental turbulence dynamics (Suri et al. Reference Suri, Tithof, Grigoriev and Schatz2017; Ballouz & Ouellette Reference Ballouz and Ouellette2020), particularly in the context of particle suspensions (Boffetta, De Lillo & Gamba Reference Boffetta, De Lillo and Gamba2004; Goto & Vassilicos Reference Goto and Vassilicos2008; Ouellette et al. Reference Ouellette, O'Malley and Gollub2008).
An important aspect of 3D interfacial flows is the non-solenoidal nature of the velocity field along the surface, which is known to play a significant role for colloids in viscous flows (Samaniuk & Vermant Reference Samaniuk and Vermant2014; Pourali et al. Reference Pourali2021). Further research is warranted to explore this effect in dense suspensions of particles floating on the surface of a turbulent body of water. Overall, we expect that the important mechanisms and trends revealed by the considered configurations will extend beyond the present model problem, including regimes where additional forces, such as electrostatics (van Baalen, Vialetto & Isa Reference van Baalen, Vialetto and Isa2023) and soft granular repulsion (Gupta et al. Reference Gupta, Chaudhuri, Bec and Ray2022), become significant. Finally, the present findings can also be relevant to systems in which the multi-scale, turbulent-like behaviour is rooted in the interaction and collective dynamics of active elements, such as bacteria (Dunkel et al. Reference Dunkel2013; Peng, Liu & Cheng Reference Peng, Liu and Cheng2021) and self-propelled particles (Bourgoin et al. Reference Bourgoin2020).
Supplementary movies
Supplementary movies are available at https://doi.org/10.1017/jfm.2024.246.
Acknowledgements
We thank L. Botto, J. Vermant and L. Isa for fruitful discussions.
Funding
This work was supported by the Swiss National Science Foundation, grant number 200021-207318.
Declaration of interests
The authors report no conflict of interest.


 Open access

