


Highlights
-
• The two-year cost of migraine to the Ontario public payer was $1.1 billion, with higher resource utilization including physician and specialist visits.
-
• 1.0% and 3.3% of episodic and chronic migraine subpopulations used migraine-specific acute medications, while 38.8% and 64.9% used opioids.
-
• Healthcare policy should align real-world care and guideline-recommended practices.
Introduction
Migraine is a common, complex and debilitating neurological disease caused in part by activation of the trigeminovascular system in the brain and is associated with a variety of symptoms including photophobia, phonophobia, nausea and sometimes vomiting.Reference Lipton1–Reference Pietrobon3 It can be classified into various subtypes, including episodic migraine (EM) and chronic migraine (CM). The International Headache Society defines CM as the occurrence of ≥15 headache days and ≥8 migraine days per month, while EM is defined as the occurrence of <15 headache days per month.4,Reference Diener, Tassorelli, Dodick, Silberstein, Lipton, Ashina, Becker, Ferrari, Goadsby, Pozo-Rosich, Wang, Houle, Hoek, Martinelli and Terwindt5
Migraine has been identified as the 2nd leading cause of disability globally, after low back pain, and the leading cause of disability among people under 50 years of age.6,Reference Steiner, Stovner, Vos, Jensen and Katsarava7 The estimated point prevalence of migraine was reported to be 10.2% in Canada in 2013.Reference Dooley, Gordon and Kuhle8 Similarly, the prevalence of migraine in Ontario was reported as 10.7% in 2013–2014.Reference Slatculescu and Chen9 These may be underestimates of the true current prevalence of migraine, as more recent data are unavailable and prior studies have indicated that patients with migraine may be less likely to seek treatment and receive a diagnosis.Reference Cooke and Becker10,Reference Graves, Gerber and Berrigan11
Migraine negatively impacts the daily life of patients, including their productivity and quality of life (QoL) and is associated with a substantial economic burden.Reference Altura, Patten, Williams, Fiest and Jetté12,Reference Bigal and Lipton13 Prior studies have reported that patients with migraine have high healthcare resource utilization (HCRU),Reference Wolfson, Fereshtehnejad, Pasquet, Postuma and Keezer14–Reference Amoozegar, Khan, Oviedo-Ovando, Sauriol and Rochdi18 prescription medication costs, healthcare provider visits, emergency department (ED) visits and diagnostic testing. These factors are primary contributors to direct healthcare costs due to migraine in Canada.Reference Wolfson, Fereshtehnejad, Pasquet, Postuma and Keezer14–Reference Amoozegar, Khan, Oviedo-Ovando, Sauriol and Rochdi18
The goals of migraine treatment are typically to relieve pain and associated symptoms, restore function, improve QoL and reduce migraine frequency and burden.Reference Tzankova, Becker and Chan19 There are acute and preventive treatments available for migraine (Supplementary File 1).Reference Silberstein, Holland, Freitag, Dodick, Argoff and Ashman20 Acute treatments work to abort or reduce the pain and associated symptoms, as well as disability of an individual attack, while preventive treatments are used on a recurrent basis (e.g., daily, monthly or quarterly) to reduce the severity and frequency of attacks in patients with migraine. Effective management of migraine using preventive medications helps to decrease the overall HCRU and cost associated with migraine.Reference Silberstein21
Despite the availability of migraine treatments, existing literature suggests that patients with migraine are undertreated in Canada.Reference Cooke and Becker10,Reference Sanderson, Devine and Lipton15,Reference Stokes, Becker and Lipton16,Reference Amadio, Lee and Yao22–Reference Adams, Buse and Leroux25 For instance, as low as 0.04%–1.0% of patients with migraine utilize triptans across various provinces in Canada.Reference Amadio, Lee and Yao22 The International Chronic Migraine Epidemiology and Outcomes (CaMEO-I) study reported that 8.9% of patients with migraine in Canada utilize preventive prescription medications.Reference Adams, Buse and Leroux25 While the CaMEO-I study reported that 64.3% of patients with migraine in Canada had consulted with a healthcare professional for headaches, only 12.4% of patients with ≥15 headache days per month reported receiving a diagnosis for CM.Reference Adams, Buse and Leroux25
While several studies have investigated the substantial burden of disease of migraine in Canada, most of these studies were limited due to low sample size.Reference Sanderson, Devine and Lipton15,Reference Stokes, Becker and Lipton16,Reference Amoozegar, Khan, Oviedo-Ovando, Sauriol and Rochdi18 In an effort to understand the HCRU and costs of migraine in a large patient population in Canada, near-census administrative medical claims records in Ontario from the Institute for Clinical Evaluative Sciences (ICES) were used to describe the demographics, medication use, HCRU and costs to the public payer of patients diagnosed with migraine. Almost all healthcare delivery in Ontario is funded by the public payer (aside from specific cases such as privately covered support services or medication costs for populations who are not eligible for public prescription coverage). The primary objective of this study was to assess the real-world HCRU and costs of the overall migraine population in Ontario, including subpopulations of patients inferred with EM and CM, compared with respective matched non-migraine controls. Secondary objectives were to describe medication utilization and assess HCRU and costs by (1) the number of preventive medication classes cycled through and (2) optimal/sub-optimal migraine management, in both the overall migraine population and the inferred EM and CM subpopulations.
Methods
Data sources
This study utilized administrative databases from ICES that contain publicly funded health services records for the population of Ontario and medication claims for individuals eligible for the Ontario Drug Benefit (ODB) program. The ODB database captures publicly reimbursed prescriptions in Ontario, excluding cash and/or privately reimbursed prescriptions. The ODB eligibility criteria include individuals who are ≥65 years of age, living in a long-term care (LTC) home or a home for special care, enrolled in the home care program, registered in the Trillium Drug Program (patients under 65 years of age who have high prescription drug costs relative to their household income) or received social assistance through Ontario Works (individuals in financial need) or the Ontario Disability Support Program during the look-back period. These de-identified record-level databases include information such as physician claims submitted to the Ontario Health Insurance Plan (OHIP), medication claims submitted to the ODB program, data on hospital discharges and records of ED visits (see Supplementary File 2). All data sources were linked at the patient level to facilitate longitudinal analysis.
Study design
This study utilized data from January 1, 2012, to December 31, 2019. A retrospective cohort approach was applied to identify and index patients with migraine from January 1, 2013, to December 31, 2017 (i.e., the selection period) (Figure 1). A 12-month look-back period prior to the index date was used to characterize baseline characteristics and differentiate between patients with inferred EM or CM. Patients were followed for two years after index (i.e., the analysis period) to assess the outcomes of interest.
Study design. *The study time frame was selected to avoid any impact that the COVID-19 pandemic may have had on the outcomes of interest. CM = chronic migraine; EM = episodic migraine; HCRU = healthcare resource utilization.

Study population
A diagnosis for migraine during the selection period was used to identify patients, and the date associated with the first migraine diagnosis in the selection period was considered the index date. Each patient was only indexed once. A migraine diagnosis was identified by any of the following: (a) an International Statistical Classification of Diseases and Related Health Problems, 10th Revision, Canada (ICD-10-CA) diagnosis code for migraine (G430 – G433, G438 or G439); (b) the OHIP diagnosis code 346 for migraine; (c) an ICD-10-CA diagnosis code for headache in patients with migraine-specific acute medication claims in their history; and (d) an OHIP diagnosis code for headache in patients with migraine-specific acute medication claims in their history (see Supplementary File 3). Patients were required to be active in the administrative data (i.e., had any healthcare touchpoint) within the 12-month look-back period and 2-year analysis period.
Patients <26 years of age at the index date were excluded to avoid confounding due to transient changes in ODB eligibility and coverage for patients that were <25 years of age between 2018 and 2019 as a result of the OHIP+ program.26,27 Patients who were non-Ontario residents, had an invalid OHIP card number or had invalid or incomplete records (e.g., missing age, missing sex or death before the index date) at index were also excluded.
Diagnosis codes to distinguish between EM and CM or data on monthly migraine days were not available; therefore, a previously published method was used to infer EM or CM, which was refined with input from clinicians.Reference Pavlovic, Yu and Silberstein28,Reference Richer, Wong and Martins29 CM status was inferred based on the logistic regression model described by Pavlovic et al. or the occurrence of at least one claim for onabotulinumtoxinA in the 12-month look-back period.Reference Pavlovic, Yu and Silberstein28,Reference Richer, Wong and Martins29 The predictors of CM were predefined as ≥15 claims for acute medications, ≥24 healthcare visits, female sex and claims for 1 or ≥2 unique migraine preventive classes in the 12-month look-back period. Patients who were not inferred with CM were inferred with EM (Figure 2). Patients who did not have prescription claims in the ODB database in the 12-month look-back period were not eligible to be inferred with either EM or CM. The ODB database only captures publicly reimbursed prescriptions in Ontario; therefore, patients with exclusively cash and/or privately reimbursed prescriptions could not be categorized by migraine type.
Inferred EM/CM methodology. Note: The logistic regression model was based on the 12-month look-back period. CGRPis were not publicly available during the study period. *Pavlovic et al.Reference Pavlovic, Yu and Silberstein28 ACE/ARB = angiotensin-converting enzyme inhibitors/angiotensin receptor blockers; BB = beta blocker; CCB = calcium channel blocker; CM = chronic migraine; CGRP = calcitonin gene-related peptide; EM = episodic migraine; NSAID = nonsteroidal anti-inflammatory drugs.

Each patient was matched with up to two non-migraine controls using propensity score matching. Exact matching was first done based on index date (±30 days), age (±2 years), sex (exact match) and ODB prescription plan eligibility. Propensity score matching was conducted based on rurality, income quintiles, local health integration network (LHIN), hypertension, dyspepsia, irritable bowel syndrome (IBS), depression, anxiety, asthma, obesity, skin disorders, sleep disorders, endocrine disorders, back pain, hyperlipidemia, sinusitis, arthritis, Charlson comorbidity score, LTC and home care, based on consultations with clinical experts. Patients who could not be matched with controls were excluded from the study population. All patients who met the selection criteria and were matched with controls were included in the overall migraine population. Patients who were inferred with EM or CM and matched with controls were included in the inferred EM and inferred CM subpopulations, respectively.
Additional selection criteria were applied to select relevant populations for the medication utilization, preventive medication cycling and optimal/sub-optimal management analyses (Figure 3).
Study population. CM = chronic migraine; EM = episodic migraine.

Medication utilization population
Patients included in the medication utilization analysis must have had at least one ODB prescription claim for any medication (including non-migraine medications) in both the first and second year of the analysis period to ensure activity in the ODB database.
Preventive medication cycling population
Cycling was defined as the number of unique preventive medication classes that were newly initiated. Patients were categorized into 0, 1, 2 and ≥ 3 cycling groups based on the number of unique preventive medication classes that were newly initiated in the analysis period (Figure 4, Supplementary File 4). Newly initiated was defined as having no claims for the preventive medication in the 12 months prior to the claim. Patients included in the analysis of HCRU and costs by cycling must have had at least one ODB prescription claim for any medication (including non-migraine medications) in both the first and second year of the analysis period to ensure continual activity in the ODB database.
Cycling methodology. Note: Newly initiated was defined as having no claims for the preventive medication in the 12 months prior to the claim. ODB = Ontario Drug Benefit.

Optimal/sub-optimal management population
A 50% reduction in migraine days during the treatment period compared to baseline is generally regarded as a response to treatment in the literature.Reference Diener, Tassorelli, Dodick, Silberstein, Lipton, Ashina, Becker, Ferrari, Goadsby, Pozo-Rosich, Wang, Houle, Hoek, Martinelli and Terwindt5,Reference Tassorelli, Diener and Dodick30 In the absence of data on migraine days, migraine-specific acute medication use was used as an indicator of optimal or sub-optimal management based on consultations with clinical experts. Patients were considered optimally managed if they had >50% reduction and sub-optimally managed if they had ≤50% reduction in the days’ supply of migraine-specific acute medications. The reduction in days’ supply was assessed by comparing the 12-month period after the newly initiated preventive medication claim to the 12-month period before the first newly initiated preventive medication claim (Figure 5).
Optimal/sub-optimal methodology.

Patients included in the analysis of HCRU and costs by optimal and sub-optimal management must have met the following additional selection criteria: (a) a claim for a newly initiated preventive medication in the first 12 months of the analysis period (newly initiated was defined as having no claims for the preventive medication in the 12 months prior to the claim); (b) at least one prescription claim for any medication (including non-migraine medications) in the 12 months before and the 12 months after the date of the first newly initiated preventive medication claim to ensure activity in the ODB database; and (c) at least one claim of a migraine-specific acute medication (i.e., triptans, diclofenac potassium powder for oral solution or ergotamine derivatives) in either the 12 months before or the 12 months after the date of the first newly initiated preventive medication claim.
Outcomes
Baseline demographics and clinical characteristics
Demographic information at baseline including age, sex and postal code was collected from the Registered Persons Database (RPDB). Age was calculated at the time of index. Neighborhood-level income quintile, LHIN of residence and residence size were estimated based on residential address using the Postal Code Conversion File Plus.31 Charlson comorbidity index was assessed in the 12-month look-back period and reported as 0, 1, 2+ and missing. Comorbidities such as hypertension, dyspepsia, IBS, depression, anxiety, asthma, etc. were assessed within the 12-month look-back period. The Discharge Abstract Database (DAD), the National Ambulatory Care Reporting System (NACRS) and ICES-derived cohorts were used to determine the presence of comorbidities (see Supplementary File 5 for a list of the diagnosis codes used to classify comorbidities). The ICES-derived cohorts are datasets that have been created by utilizing validated case-finding algorithms to identify individuals with specific diseases.Reference Schull, Azimaee and Marra32–Reference To, Dell and Dick37 These outcomes were reported for the overall migraine population, the inferred EM and CM subpopulations and their respective matched non-migraine controls.
Medication utilization
The number and proportion of patients who utilized migraine preventive medications (MPMs), migraine-specific acute medications and pain reliever medications over the two-year analysis period were reported. MPMs included oral medications, such as antiepileptics, antidepressants, antihypertensives, etc., and onabotulinumtoxinA. Migraine-specific acute medications included triptans, ergotamine derivatives and diclofenac potassium powder for oral solution, and pain reliever medications included nonsteroidal anti-inflammatory drugs (NSAIDs), opioids and acetaminophen (Supplementary File 1). It should be noted that calcitonin gene-related peptide inhibitors (CGRPis), including erenumab (which was approved by Health Canada in August 2018), were not publicly reimbursed in Ontario during the study period. OnabotulinumtoxinA and some triptans were publicly reimbursed during the study period through the Exceptional Access Program (EAP). The ODB database was the source of all prescription claims dispensed under Ontario’s provincial public drug program. These outcomes were reported for the medication utilization population.
HCRU and costs
Mean HCRU and costs per patient over the two-year analysis period were analyzed for general practitioner (GP) visits, specialist visits, neurologist visits, outpatient hospital clinic visits, hospitalizations, length of stay in the hospital, ED visits, same-day surgeries, LTC and inpatient rehabilitation services. Data on hospital admissions were collected from the DAD, while data on ED visits were retrieved from the NACRS. Patient claims for physician services were extracted from the OHIP database. These outcomes were reported for the overall migraine population and the inferred EM and CM subpopulations and their respective matched non-migraine controls. They were also reported for the preventive medication cycling and optimal/sub-optimal management analyses.
Data analysis
Categorical variables were reported as frequency counts and percentages. Continuous variables were reported as a mean with a standard deviation (SD) and a median with an interquartile range (i.e., Q1, Q3). In accordance with ICES privacy policies, results based on less than six patients were suppressed. All analyses were conducted using Statistical Analysis System (SAS) version 9.3 or higher (SAS Institute, Cary, NC). Patients with zero HCRU and/or costs were included in all analyses. For all HCRU measures, an unadjusted Poisson (if variance is less than mean) or an unadjusted negative binomial model (if the variance is greater than or equal to mean) was used to determine mean differences between cases and controls for the overall migraine population and the inferred EM and CM subpopulations. For healthcare costs, an unadjusted gamma model was used to determine variance and compare healthcare costs between cases and controls for the overall migraine population and the inferred EM and CM subpopulations. For both model types, generalized estimating equation methodology was used to account for the matched nature of the study. An associated p-value was reported for each comparison. The incremental cost of migraine was calculated by multiplying the overall migraine population’s patient count with the mean cost difference between cases and controls.
Results
A total of 452,431 patients were identified, matched and included in the overall migraine population. 140,141 (31.0%) patients could be inferred, matched and included in either the inferred EM or inferred CM subpopulations. Of these, 116,386 (83.0%) patients were inferred with EM, matched and included in the inferred EM subpopulation, and 23,755 (17.0%) patients were inferred with CM, matched and included in the inferred CM subpopulation (Figure 6, Table 1). The remainder of the patients could not be categorized by migraine type, as the ODB database only captures publicly reimbursed prescriptions in Ontario.
Patient selection. CM = chronic migraine; EM = episodic migraine; ODB = Ontario Drug Benefit. Source: Ontario Administrative ICES Data (January 1, 2012–December 31, 2019).

Baseline demographics and clinical characteristics

CM = chronic migraine; EM = episodic migraine; SD = standard deviation. Source: Ontario Administrative ICES Data (January 1, 2012–December 31, 2019).
Baseline demographic and clinical characteristics
Baseline demographic and clinical characteristics were comparable between cases and controls (Table 1). The mean (SD) age of patients in the overall migraine population, inferred EM subpopulation and inferred CM subpopulation was 46.9 (14.1) years, 56.5 (16.4) years and 56.4 (16.2) years, respectively. The majority of patients were female, accounting for 73.0%, 66.9% and 97.7% of the overall migraine population, inferred EM subpopulation and inferred CM subpopulation, respectively.
One-fifth of patients in the overall migraine population (20.3%) belonged to the lowest income quintile (quintile 1), whereas approximately one-fourth of patients in the inferred EM subpopulation (25.8%) and one-third of patients in the inferred CM subpopulation (33.3%) belonged to the lowest income quintile (quintile 1). Most patients resided in large urban areas, while only 9% resided in rural areas. The most common comorbidities in the overall migraine population, inferred EM subpopulation and inferred CM subpopulation were hypertension (24.9%, 44.8% and 54.0%), anxiety (21.8%, 24.6% and 46.4%), asthma (18.9%, 20.9% and 34.5%) and back pain (10.7%, 12.3% and 24.9%). The complete list of comorbidities is provided in Table 1.
Medication utilization
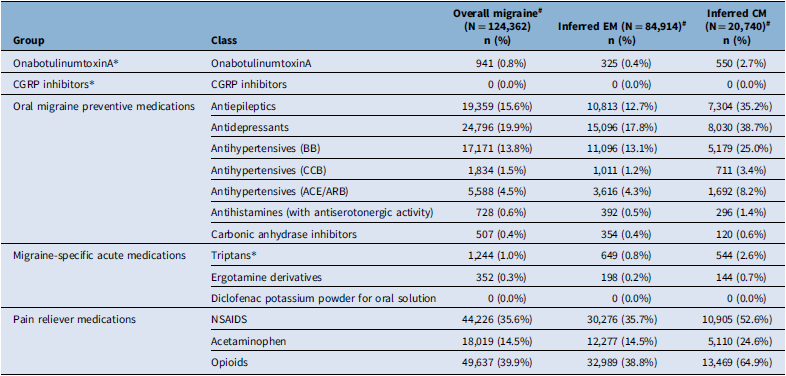
Based on the additional selection criteria, 124,362 overall patients with migraine, 84,914 patients from the inferred EM subpopulation and 20,740 patients from the inferred CM subpopulation were included in the medication utilization analysis (Figure 7). Preventive and acute medication utilization was higher in patients with inferred CM compared to patients with inferred EM. Thirty-nine percent (39.4%) of the inferred EM subpopulation and 69.3% of the inferred CM subpopulation had at least one claim of any preventive medication in the two-year analysis period (Table 2). Specifically, 39.2% of the inferred EM subpopulation and 68.5% of the inferred CM subpopulation had at least one claim of any oral MPM, and 2.7% of the inferred CM subpopulation had at least one claim of onabotulinumtoxinA. Migraine-specific acute medications were utilized in only 1.0% of patients in the inferred EM subpopulation and 3.3% of patients in the inferred CM subpopulation. In contrast, 58.3% and 81.4% of patients in the inferred EM and CM subpopulations had at least one claim of a pain reliever medication, respectively. While 0.8% of the inferred EM subpopulation and 2.6% of the inferred CM subpopulation had at least one claim for a triptan, 38.8% of the inferred EM subpopulation and 64.9% of the inferred CM subpopulation had at least one claim for an opioid.
Patient selection for secondary objectives. CM = chronic migraine; EM = episodic migraine. Source: Ontario Administrative ICES Data (January 1, 2012–December 31, 2019).

HCRU and costs
Over the two-year analysis period, the overall migraine population, inferred EM subpopulation and inferred CM subpopulation had significantly higher mean all-cause HCRU compared to their matched non-migraine controls (Figure 8, Table 3). This included categories such as GP visits (overall migraine: 9.4 vs. 5.8, p < 0.0001; inferred EM: 9.9 vs. 7.7, p < 0.0001; and inferred CM: 21.6 vs. 10.8, p < 0.0001), specialist visits (overall migraine: 6.6 vs. 4.3, p < 0.0001; inferred EM: 8.1 vs. 6.4, p < 0.0001; and inferred CM: 16.1 vs. 8.4, p < 0.0001), outpatient hospital clinic visits (overall migraine: 2.3 vs. 1.5, p < 0.0001; inferred EM: 3.0 vs. 2.4, p < 0.0001; and inferred CM: 5.8 vs. 3.1, p < 0.0001) and ED visits (overall migraine: 1.9 vs. 0.8, p < 0.0001; inferred EM: 2.4 vs. 1.3, p < 0.0001; and inferred CM: 4.8 vs. 1.8, p < 0.0001). The inferred CM subpopulation had higher mean all-cause HCRU compared to the inferred EM subpopulation in almost all categories, including GP visits (inferred CM: 21.9, inferred EM: 9.9), specialist visits (inferred CM: 16.1, inferred EM: 8.1), outpatient hospital clinic visits (inferred CM: 5.8, inferred EM: 3.0) and ED visits (inferred CM: 4.8, inferred EM: 2.4).
Mean all-cause HCRU in the inferred EM, inferred CM and overall migraine population. CM = chronic migraine; ED = emergency department; EM = episodic migraine; GP = general practitioner. Source: Ontario Administrative ICES Data (January 1, 2012–December 31, 2019).

Medication utilization in the overall migraine, inferred EM and CM subpopulations (two-year analysis period)

ACE/ARB = angiotensin-converting enzyme inhibitors/angiotensin receptor blockers; BB = beta blocker; CCB = calcium channel blockers; CGRP = calcitonin gene-related peptide; CM = chronic migraine; EM = episodic migraine; NSAIDs = nonsteroidal anti-inflammatory drugs. *Note: CGRPis were not publicly reimbursed during the study period. OnabotulinumtoxinA and triptans were only available through the Exceptional Access Program. #Note: Medication utilization was assessed in selected patients who had at least one ODB prescription claim for any medication (including non-migraine medications) in both the first and second year of the analysis period. Source: Ontario Administrative ICES Data (January 1, 2012–December 31, 2019).
Mean all-cause HCRU and costs (two-year analysis period)

CM = chronic migraine; EM = episodic migraine; GP = general practitioner; ED = emergency department; NSAIDS = nonsteroidal anti-inflammatory drugs.
Note: Only patients who had at least one ODB prescription claim in the 12-month look-back period were inferred with CM or EM status. Neurologist visits are a subset of specialist visits. Outpatient GP, specialist and neurologist costs refer to physician billing in the outpatient setting where the OHIP location is home, office or phone. Other GP, specialist and neurologist costs refer to physician billing in other settings where the OHIP location is emergency department, inpatient or undefined. Source: Ontario Administrative ICES Data (January 1, 2012–December 31, 2019).
The mean two-year healthcare costs per patient for the overall migraine population, inferred EM subpopulation and inferred CM subpopulation were $7,486 (CAD), $11,908 (CAD) and $24,716 (CAD), respectively. These patients incurred a significantly higher incremental cost of $2,538 (CAD), $2,156 (CAD) and $11,652 (CAD) compared to their matched non-migraine controls (p < 0.0001) (Figure 9). The overall incremental cost of patients with migraine to the public payer in Ontario was $1.1 billion (CAD) over two years.
Mean all-cause costs in the overall migraine population, inferred EM and inferred CM subpopulations. CM = chronic migraine; ED = emergency department; EM = episodic migraine; GP = general practitioner. Source: Ontario Administrative ICES Data (January 1, 2012–December 31, 2019).

HCRU and costs by preventive medication cycling
Based on the additional selection criteria, 124,362 overall patients with migraine, 84,914 patients from the inferred EM subpopulation and 20,740 patients from the inferred CM subpopulation were included in the cycling analysis (Figure 6). In the two-year analysis period, 24.7% of the overall migraine population, 22.6% of the inferred EM subpopulation and 38.1% of the inferred CM subpopulation cycled through one or more newly initiated preventive medication classes. Mean all-cause HCRU and costs were higher in patients who cycled through more newly initiated preventive classes in the overall migraine population (Figure 10, Supplementary File 6). Patients who newly initiated 0, 1, 2 and ≥ 3 unique preventive classes had 11.1, 15.0, 17.9 and 19.4 mean GP visits and 9.2, 11.8, 14.1 and 15.6 mean specialist visits over two years, respectively. The mean all-cause total costs for patients in the overall migraine population who newly initiated 0, 1, 2 and ≥ 3 unique preventive classes were $14,237 (CAD), $19,467 (CAD), $21,486 (CAD) and $23,095 (CAD) per patient over two years, respectively (Figure 11). In the inferred EM subpopulation, the mean all-cause costs of patients who newly initiated 0, 1, 2 and ≥ 3 unique preventive classes were $13,229 (CAD), $17,102 (CAD), $18,875 (CAD) and $17,537 (CAD) per patient over two years, respectively. In the inferred CM subpopulation, the mean all-cause costs of patients who newly initiated 0, 1, 2 and ≥ 3 unique preventive classes were $25,171 (CAD), $27,363 (CAD), $27,070 (CAD) and $33,188 (CAD) per patient over two years, respectively.
Mean all-cause HCRU in the overall migraine population by preventive medication cycling. Note: Cycling on preventive medications is inferred based on the number of different classes of preventive medications that are newly initiated by patients in the two-year analysis period. GP = general practitioner; ED = emergency department. Source: Ontario Administrative ICES Data (January 1, 2012–December 31, 2019).

Mean all-cause costs in the overall migraine population and inferred EM and CM subpopulations by preventive medication cycling. Note: Cycling on preventive medications is inferred based on the number of different classes of preventive medications that are newly initiated by patients in the two-year analysis period. CM = chronic migraine; EM = episodic migraine. Source: Ontario Administrative ICES Data (January 1, 2012–December 31, 2019).

HCRU and costs by optimal/sub-optimal management
Based on the additional selection criteria, 643 patients from the overall migraine population, 317 patients from the inferred EM subpopulation and 296 patients from the inferred CM subpopulation were included in the optimal/sub-optimal management analysis (Figure 6). 32.0% of the overall migraine population, 35.0% of the inferred EM subpopulation and 32.0% of the inferred CM subpopulation achieved optimal management one year after newly initiating a preventive medication. Mean all-cause HCRU was similar between patients with optimal management and patients with sub-optimal management (Supplementary File 7). However, mean migraine-specific HCRU was higher in patients with sub-optimal management compared to patients with optimal management in the overall migraine population. This included increased GP visits (sub-optimal management: 0.9, optimal management: 0.6), specialist visits (sub-optimal management: 0.8, optimal management: 0.4), outpatient hospital clinic visits (sub-optimal management: 0.3, optimal management: 0.1) and ED visits (sub-optimal management 0.2, optimal management: 0.1) among sub-optimally managed patients. The mean all-cause costs for patients with sub-optimal management were higher than patients with optimal management in the overall migraine population (sub-optimal management: $10,507 [CAD], optimal management: $10,365 [CAD]) and the inferred EM subpopulation (sub-optimal management: $8,944 [CAD], optimal management: $7,367 [CAD]). In the inferred CM subpopulation, the mean all-cause costs were lower for patients with sub-optimal management than patients with optimal management (sub-optimal management: $12,673 [CAD], optimal management: $14,046 [CAD]).
Discussion
The objective of this retrospective, longitudinal cohort study was to capture the direct costs of migraine to the public healthcare system in Ontario. By comparing costs against matched non-migraine controls, we minimized the impact of confounding comorbidities, such as hypertension, depression and anxiety, which are common among migraine patients. Several studies have attempted to assess the economic burden of migraine in Canada.Reference Wolfson, Fereshtehnejad, Pasquet, Postuma and Keezer14–Reference Amoozegar, Khan, Oviedo-Ovando, Sauriol and Rochdi18 However, to our knowledge, this is the largest study to analyze the resource utilization and costs of migraine, including EM and CM, in Canada, and the first in Ontario using administrative claims databases. While a previous study has reported the economic burden of cycling in the USA,Reference Ford, Schroeder, Nyhuis, Foster and Aurora38 this appears to be the first study in Canada to assess the economic burden of cycling through preventive medication classes in migraine. Given that Ontario functions as a single public payer system for medical service delivery, the administrative medical claims data captured in this study are comprehensive.
Timely access to proper treatment is critical for reducing the impact of migraine attacks on patients. In this study, over 60% of the inferred EM subpopulation and over 30% of the inferred CM subpopulation did not utilize any preventive migraine medication during the two-year analysis period. Prior studies have shown that appropriate use of preventive migraine medications results in lower HCRU and acute medication utilization.Reference Silberstein, Winner and Chmiel39–Reference Tepper, Fang and Vo41 Guidelines recommend the use of acetaminophen, NSAIDs and triptans for effective acute migraine treatment.Reference Tzankova, Becker and Chan42–Reference Schwedt and Garza44 However, triptans were notably underutilized (inferred EM: 0.8%, inferred CM: 2.6%) compared to acetaminophen (inferred EM: 14.5%, inferred CM: 24.6%) and NSAIDs (inferred EM: 35.7%, inferred CM: 52.6%). This underutilization may be partly attributed to the restricted access to triptans as they are only publicly reimbursed in Ontario through the EAP, which requires patients to fail on previous acute medications (such as NSAIDs or acetaminophen) as part of the public reimbursement criteria for access to a triptan.45 The EAP facilitates access to drugs not listed in the ODB formulary for a narrow patient population that meets the approved clinical criteria. It requires that healthcare providers complete requests for approval as well as renew these requests, posing a notable administrative burden.46 Options such as a Limited Use (LU) code or changes to existing reimbursement criteria could expedite patient access to triptans. LU codes are a reimbursement pathway within the ODB program that enables access to eligible patients meeting reimbursement criteria without requiring prior approval, which reduces administrative burden.
On the other hand, this study found that high proportions of patients were utilizing opioids (38.8% of the inferred EM subpopulation and 64.9% of the inferred CM subpopulation). This notable lack of access to triptans may have contributed to the high utilization of opioids observed in Ontario in this study. A comparable finding was reported in a similar study conducted in Alberta, where 40.8% of patients with migraine received ≥1 prescription for opioids.Reference Graves, Cowling and McMullen47 This may also be due to triptans being publicly reimbursed in Alberta through a similarly restrictive program, where special authorization is required after demonstrating that the patient has failed previous standard therapy.48 The Canadian Headache Society recommends against the routine use of opioids due to the reduced efficacy compared to triptans, the risk of sedation and dependence and the risk of developing medication overuse headaches.Reference Tzankova, Becker and Chan42 However, it is important to note that patients with migraine in this study may have been prescribed opioids for other comorbid conditions. Prior research shows that poorly optimized acute treatment may be associated with a higher likelihood of disability and an increased risk of migraine disease progression.Reference Lipton, Fanning, Serrano, Reed, Cady and Buse49,Reference Serrano, Kori and Papapetropoulos50 Uncontrolled or poorly controlled attacks may result in medication overuse, which is often associated with increased disease severity and pain.Reference Schwedt, Alam and Reed51 Medication overuse may also be associated with a greater likelihood of progression from EM to CM.Reference Bigal, Serrano, Buse, Scher, Stewart and Lipton52,Reference Lipton, Serrano, Nicholson, Buse, Runken and Reed53
Amoozegar et al. published a study in 2022 characterizing the burden of illness of migraine in Canada.Reference Amoozegar, Khan, Oviedo-Ovando, Sauriol and Rochdi54 They estimated the mean annual direct cost of migraine to be $7,004 (CAD) per patient with low-frequency EM, $8,939 (CAD) per patient with high-frequency EM and $12,413 (CAD) per patient with CM. When compared to the two-year incremental direct costs of migraine (vs. matched controls) observed in this study (EM: $2,156 [CAD]; CM: $11,651 [CAD]), the estimates observed by Amoozegar et al. appear higher (particularly when compared to the inferred EM subpopulation). However, this may be attributed to several methodological differences in the study by Amoozegar et al., such as the survey and chart audit design, selecting for a relatively severe population (i.e., at least four monthly migraine days and failure on ≥2 preventive treatments), including privately covered prescriptions and services (as opposed to only publicly reimbursed services/medications) and costs being defined as attributable to migraine (as opposed to incremental costs compared to controls in our study). The patients in the study by Amoozegar et al. were also selected from a tertiary headache clinic and as such may be more likely to have higher medication utilization and therefore higher costs. Nonetheless, the cost estimates in this study are likely an underestimate of the total direct costs of migraine considering the lack of inclusion of privately covered prescriptions and services.
McMullen et al. recently published a retrospective observational study in 2023 utilizing administrative data to describe the burden of EM, CM and medication overuse headache in Alberta.Reference McMullen, Graves, Ekwaru, Pham, Mayer, Ladouceur, Hubert, Bougie and Amoozegar55 They estimated mean annual all-cause costs to be $12,693 (CAD) per patient with CM and $4,251 (CAD) per patient with EM. When annualized, the all-cause two-year costs per patient with inferred CM ($24,716 [CAD]) in our study appear similar. Although the two-year costs per patient with inferred EM ($11,908 [CAD]) in our study appear slightly higher, this could be explained by the higher mean age of the inferred EM subpopulation in our study (56.5 years) compared to the EM population in the study by McMullen et al. (38.6 years). In our study, only patients who were eligible for the ODB program were inferred with EM or CM, which may have selected for older patient populations. The study by McMullen et al. used the same methodology to infer EM and CM; however, in addition to publicly reimbursed prescriptions, the Alberta administrative databases also capture privately reimbursed prescriptions, which may have avoided the selection effect observed in our study.
Most categories of HCRU (such as GP visits, specialist visits and outpatient hospital visits) are incrementally higher for patients who cycle through more newly initiated preventive medication classes in the overall migraine population and inferred EM and CM subpopulations. The same is true for total costs per patient in the overall migraine population where patients cycling through more newly initiated classes have higher costs. A study conducted in the USA reported similar findings.Reference Ford, Schroeder, Nyhuis, Foster and Aurora38 On the other hand, the total costs for the inferred EM and CM subpopulations vary based on the number of unique newly initiated preventive medication classes they cycle through. For instance, in the inferred EM subpopulation, the mean all-cause costs of those who newly initiated 0, 1, 2 and ≥ 3 unique preventive classes were $13,229 (CAD), $17,102 (CAD), $18,875 (CAD) and $17,537 (CAD) per patient over two years, respectively. In the inferred CM subpopulation, the mean all-cause costs of patients who newly initiated 0, 1, 2 and ≥ 3 unique preventive classes were $25,171 (CAD), $27,363 (CAD), $27,070 (CAD) and $33,188 (CAD) per patient over two years, respectively.
This study also reported HCRU and costs for patients with optimal/sub-optimal management. All-cause HCRU and costs were similar across patients with optimal management and sub-optimal management, which may indicate that migraine-specific outcomes are more likely to capture the impact of disease management. The mean all-cause costs for patients with sub-optimal management were higher than for patients with optimal management in the overall migraine population and the inferred EM subpopulation. In the inferred CM subpopulation, the all-cause costs for optimally managed patients were observed to be higher than patients with sub-optimal management (optimal management: $14,046, sub-optimal management: $12,673). However, this finding should be interpreted with caution given the relatively smaller sample size of the two groups (optimal management: n = 94, sub-optimal management: n = 202).
A limitation of this study is that the administrative claims data capture publicly reimbursed medical and prescription drug claims in Ontario. Therefore, out-of-pocket and privately reimbursed care and prescription drugs (including those provided by patient support programs) were not captured in this study. While this means that direct costs to the public payer were accurately represented, these costs likely underestimate the total economic burden of migraine, which includes privately covered prescriptions and indirect costs such as productivity loss that were not accounted for in this study. Additionally, migraine-specific HCRU and costs may have been underestimated, as not all migraine-related healthcare touchpoints may have been associated with a migraine diagnosis within the administrative data potentially due to underdiagnosis and/or the high rates of comorbidities that were observed.
An additional limitation is that diagnosis codes to distinguish between EM and CM or data on direct measures such as monthly migraine days were not available. As such, the differentiation between EM and CM was inferred based on an algorithm that was previously validated against a cohort of patients diagnosed with CM by trained clinicians who administered a diagnostic interview.Reference Pavlovic, Yu and Silberstein28,Reference Richer, Wong and Martins29 As the predictors of this algorithm include medication use, it was only applied to patients who had at least one ODB prescription claim for any medication (including non-migraine medications) in the 12-month look-back period prior to the index date. This meant that all patients with inferred EM and CM were eligible for the ODB prescription drug plan at some point during the look-back period. When considering the eligibility criteria for the ODB program, this implies that the patients with inferred EM and CM were either ≥65 years of age, living in an LTC home or a home for special care, enrolled in the home care program, registered in the Trillium Drug Program (patients under 65 years of age who have high prescription drug costs relative to their household income) or received social assistance through Ontario Works (individuals in financial need) or the Ontario Disability Support Program during the look-back period.56 The overall migraine population included all patients with a migraine diagnosis who were matched to controls, irrespective of their ODB prescription drug plan eligibility. The impact of this can be observed in the mean age of these populations. The mean age of the overall migraine population (46.9 years) is lower than the inferred EM and CM subpopulations (56.5 and 56.4 years, respectively). Since all patients in the overall migraine population (i.e., all included and matched patients) were not required to have at least one ODB prescription claim, some medication costs may not be captured as they may have been covered by private drug plans or paid for out of pocket. This may explain the lower mean cost per patient over two years in the overall migraine population ($7,486 [CAD]) compared to the inferred EM and CM subpopulations ($11,908 [CAD] and $24,716 [CAD], respectively).
Medication utilization was only reported for patients who had at least one ODB prescription claim for any medication (including non-migraine medications) in both the first and second year of the analysis period. Utilization was reported in 73% of the inferred EM subpopulation, 87% of the inferred CM subpopulation and 27% of the overall migraine population. Considering this, the findings may not be generalizable for private drug plan or cash patients.
Conclusion
This retrospective, longitudinal cohort study examined the overall migraine population, as well as inferred EM and CM subpopulations, in Ontario, Canada. The results highlight significantly higher HCRU and associated costs in patients with migraine compared to matched non-migraine controls, including patients with inferred EM and CM. The total incremental cost of migraine to the Ontario public payer was $1.1 billion (CAD) over two years. The results also point to the underutilization of migraine-specific acute medications such as triptans and the overutilization of pain-relieving medications like opioids, suggesting a gap between real-world care and recommendations from recent treatment guidelines. The findings also highlight the restrictive access to triptans in Ontario given that patients must demonstrate failure on adequate trials of other medications for migraine (e.g., acetaminophen, NSAIDs) prior to public reimbursement delaying potentially appropriate treatment options early on and prolonging the impact of migraine on patient QoL. These findings emphasize the ongoing need for further education and awareness and easier access to more effective treatment options, in addition to highlighting the importance of migraine as a public health concern. Consideration should be given by policymakers for the allocation of additional resources toward initiatives that will help bridge the gap between real-world care and guideline-recommended practices. This includes improving access to preventive treatments and migraine-specific acute medications such as triptans to help mitigate opioid overutilization and promoting awareness of the risks of opioids.
Further investigation of the economic burden of migraine to the private payer as well as the indirect costs associated with migraine (such as productivity loss) is warranted to better understand the total economic burden of migraine in Canada. With newer migraine treatments such as CGRPis becoming available in Canada, it will be important to reassess medication utilization and HCRU in a future study to evaluate the impact of these treatments.
Supplementary material
To view supplementary material for this article, please visit https://doi.org/10.1017/cjn.2024.367.
Acknowledgments
The authors thank Matthew Badin and Lana Duan (former employees of IQVIA) for their analytical support. Finally, thanks to Dr Sushmitha Shetty and Phani Tejasvi Dantu for their medical writing and editorial support. ICES data and analytical services contributed to the data collection and outputs used for this study.
Author contributions
-
• Conceptualization, methodology, interpretation, writing – review and editing and visualization: CL, AMLB, AA, BSM, JF, AR, PB, CI, SG, AT, GD and BM.
-
• Validation: PB, CI, SG and AT.
-
• Supervision and project administration: AA, BSM, JF, CI and AT.
Funding statement
This study was sponsored by AbbVie Canada Inc. Study analysis and medical writing assistance were provided by IQVIA Canada.
Competing interests
Dr Christine Lay and Dr Ana Marissa Lagman-Bartolome are affiliated with Women’s College Hospital (Toronto, Canada), and the hospital received funding to support this study. Amnah Awan, Jackie Fleischer, Ana Rusu and Goran Davidovic are employees of AbbVie Canada. Bijal Shah-Manek is an employee of Noesis Healthcare Technologies and is a consultant for AbbVie. Purva Barot, Cristian Iconaru, Shane Golden, Ali Tehrani and Brad Millson are employees of IQVIA Solutions Canada Inc. and received study funding from AbbVie. Study analysis and medical writing assistance were provided by IQVIA Canada.
Disclosures
This study made use of de-identified data from the ICES Data Repository, which is managed by the ICES with support from its funders and partners: Canada’s Strategy for Patient-Oriented Research (SPOR), the Ontario SPOR Support Unit, the Canadian Institutes of Health Research (CIHR) and the Government of Ontario. The opinions, results and conclusions reported are those of the authors. No endorsement by ICES or any of its funders or partners is intended or should be inferred.
Parts of this material are based on data and/or information compiled and provided by CIHI and the Ontario Ministry of Health. The analyses, conclusions, opinions and statements expressed herein are solely those of the authors and do not reflect those of the funding or data sources; no endorsement is intended or should be inferred.
Adapted from Statistics Canada, Census Profile, 2021. This does not constitute an endorsement by Statistics Canada of this product.
Parts of this material are based on data and information provided by Ontario Health (OH). The opinions, results, views and conclusions reported in this paper are those of the authors and do not necessarily reflect those of OH. No endorsement by OH is intended or should be inferred.
We thank IQVIA Solutions Canada Inc. for the use of their Drug Information File. Parts of this material are based on data and information compiled and provided by the Ontario Ministry of Health. The analyses, conclusions, opinions and statements expressed herein are solely those of the authors and do not reflect those of the funding or data sources; no endorsement is intended or should be inferred.
This document used data adapted from the Statistics Canada Postal CodeOM Conversion File, which is based on data licensed from Canada Post Corporation, and/or data adapted from the Ontario Ministry of Health Postal Code Conversion File, which contains data copied under license from ©Canada Post Corporation and Statistics Canada.




 Open access

