





Introduction
Organic agriculture is an expanding sector of the U.S. food system, supported by sustained consumer demand for sustainably grown food produced without synthetic pesticides. In 2024, U.S. sales of certified organic products reached a record $71.6 billion, including $21.5 billion from produce alone (Organic Trade Association, 2024). Organic fruit and vegetable produce remains the largest segment of the U.S. organic market, accounting for one-third of total U.S. organic food sales in 2024 (USDA ERS, 2025). This market dominance increases opportunities for producers to grow high-quality vegetables and heightens the need for practical, sustainable, and nonchemical pest management strategies in organic specialty crop production.
Within the produce category, Brassica (cole) crops, such as broccoli (B. oleracea var. italica), cauliflower (B. oleracea var. botrytis ), kale (B. oleracea var. acephala), and napa (Chinese) cabbage (B. rapa var. pekinensis), are prominent in organic production due to consistent consumer demand. Among these crops, napa cabbage is a fast-maturing, leafy brassica widely grown for the fresh market because of its tender leaves, mild flavor, and high consumer acceptance (Francisco et al., Reference Francisco, Tortosa, Martínez-Ballesta, Velasco, García-Viguera and Moreno2017). Its short production cycle often coincides with peak seasonal activity of several economically important insect pest groups.
Consequently, napa cabbage is highly vulnerable to early- and mid-season insect injury that can compromise yield and marketability. In the U.S. Midwest, key pests include flea beetles (Phyllotreta spp.), diamondback moth ( Plutella xylostella ), imported cabbageworm ( Pieris rapae), cabbage looper (Trichoplusia ni), harlequin bug (Murgantia histrionica), and aphids, primarily green peach aphid (Myzus persicae) and cabbage aphid (Brevicoryne brassicae). Feeding by these pests can cause severe foliar damage, head contamination, and can lead to market rejection at very low infestation levels (Sarfraz, Keddie and Dosdall, Reference Sarfraz, Keddie and Dosdall2005; Wallingford et al., Reference Wallingford, Kuhar, Schultz and Freeman2011; Li et al., Reference Li, Costamagna, Beran and You2024). Minor foliar injury can substantially reduce consumer acceptance and downgrade heads to nonmarketable grades. Management strategies that limit foliar injury have been shown to increase marketable yield in brassica greens (Brockman et al., Reference Brockman, Kuesel, Archer, O’Hearn, Wilson, Scott, Williams, Bessin and Gonthier2020).
Organic brassica growers employ a range of pest management strategies to reduce insect injury and maintain crop yield and quality. These include cultural approaches (e.g., crop rotation, sanitation, and trap cropping), conservation biological control (e.g., promoting parasitoid wasps and predators), and materials-based options (kaolin particle films). These strategies can reduce feeding injury in brassicas under certain conditions (Boivin, Hance and Brodeur, Reference Boivin, Hance and Brodeur2012; Bier et al., Reference Bier, Wallingford, Haber, Herlihy-Adams and Weber2021; Rajan and Cutler, Reference Rajan and Cutler2025). In addition, Organic Materials Review Institute (OMRI)-listed products, including Bacillus thuringiensis (Bt), insecticidal soaps, horticultural oils, and pyrethrin formulations, are widely used in organic systems. However, multi-site trials demonstrate that many organic insecticides exhibit inconsistent efficacy, have short residual activity, and can adversely affect beneficial insect populations (Brockman et al., Reference Brockman, Kuesel, Archer, O’Hearn, Wilson, Scott, Williams, Bessin and Gonthier2020; Dively et al., Reference Dively, Patton, Barranco and Kulhanek2020; Clark et al., Reference Clark, Bessin, Gonthier and Larson2024). As a result, repeated spray applications are often required, increasing labor and production costs to achieve acceptable control. Consistent with these findings, Fiske et al. (Reference Fiske, Cheng, Kuesel, Zhang, Bessin, Williams and Gonthier2024) reported that reliance on OMRI-listed insecticides alone provides limited improvements in pest suppression and yield despite substantial labor inputs.
Market standards for brassica crops are highly sensitive to even minor foliar defects, increasing the importance of management strategies that limit insect injury and preserve quality. Fine-mesh exclusion netting and spunbonded fabric have been shown to reduce flea beetle and lepidopteran feeding (Adams, Ashley and Brennan, Reference Adams, Ashley and Brennan1990; Simon et al., Reference Simon, Komlan, Adjaïto, Mensah, Coffi, Ngouajio and Martin2014; Brockman et al., Reference Brockman, Kuesel, Archer, O’Hearn, Wilson, Scott, Williams, Bessin and Gonthier2020). Reduced feeding injury under these systems has been associated with increased marketable yield. In addition to pest suppression, low tunnel systems constructed with spunbonded fabric are widely used to modify the crop microclimate by increasing canopy temperatures, thereby reducing frost risk and supporting season extension (Wells and Loy, Reference Wells and Loy1993; Anderson, Rogers and Hoover, Reference Anderson, Rogers and Hoover2019). Despite these benefits, spunbonded fabric is relatively fragile, prone to tearing, and often requires frequent removal for field operations and pesticide applications. These materials may also alter within-canopy conditions by reducing airflow and increasing heat accumulation that can negatively affect crop performance (Wells and Loy, Reference Wells and Loy1993; Simon et al., Reference Simon, Komlan, Adjaïto, Mensah, Coffi, Ngouajio and Martin2014). In contrast, breathable, mesh-based insect exclusion netting is more permeable than spunbonded fabric and allows insecticide applications through the mesh while supporting long-term field use (Nelson et al., Reference Nelson, González-Acuña, Nair, Cheng, Mphande, Badilla-Arias, Zhang and Gleason2023; Mphande et al., Reference Mphande, Badilla-Arias, Cheng, González-Acuña, Nair, Zhang and Gleason2024).
Recent research has described mesotunnels as a middle ground between low tunnels and high tunnels, combining structural support with breathable, mesh-based insect exclusion (Nelson et al., Reference Nelson, González-Acuña, Nair, Cheng, Mphande, Badilla-Arias, Zhang and Gleason2023). Mesotunnels consist of hooped conduits installed over raised beds covered with insect exclusion netting. This creates a protected production environment that facilitates air movement, allows pollinator introduction, and mitigates excessive heat buildup. In cucurbit systems, mesotunnels have been shown to reduce cucumber beetle injury and bacterial wilt incidence, while improving economic returns (Nelson et al., Reference Nelson, González-Acuña, Nair, Cheng, Mphande, Badilla-Arias, Zhang and Gleason2023; Fiske et al., Reference Fiske, Cheng, Kuesel, Zhang, Bessin, Williams and Gonthier2024; Mphande et al., Reference Mphande, Badilla-Arias, Cheng, González-Acuña, Nair, Zhang and Gleason2024). More broadly, fine-mesh exclusion netting and related row-cover systems have successfully limited key pests across multiple specialty crops, including brassicas (Adams et al., Reference Adams, Ashley and Brennan1990; Brockman et al., Reference Brockman, Kuesel, Archer, O’Hearn, Wilson, Scott, Williams, Bessin and Gonthier2020), cucurbits (Adams et al., Reference Adams, Ashley and Brennan1990; Nelson et al., Reference Nelson, González-Acuña, Nair, Cheng, Mphande, Badilla-Arias, Zhang and Gleason2023; Fiske et al., Reference Fiske, Cheng, Kuesel, Zhang, Bessin, Williams and Gonthier2024; Mphande et al., Reference Mphande, Badilla-Arias, Cheng, González-Acuña, Nair, Zhang and Gleason2024; Pethybridge et al., Reference Pethybridge, Damann, Murphy, Diggins and Gleason2024a, Reference Pethybridge, Damann, Murphy, Diggins and Gleasonb), and multiple fruit species (Leach, Van Timmeren and Isaacs, Reference Leach, Van Timmeren and Isaacs2016; Chouinard et al., Reference Chouinard, Veilleux, Pelletier, Larose, Philion, Joubert and Cormier2019; Ebbenga, Burkness and Hutchison, Reference Ebbenga, Burkness and Hutchison2019; Kuesel et al., Reference Kuesel, Scott Hicks, Archer, Sciligo, Bessin and Gonthier2019).
Insect exclusion mesotunnel systems have been evaluated across several specialty crops for their ability to reduce insect pressure and improve marketable yield. However, evidence of their performance as full-season mesotunnels in organic napa cabbage under Midwestern conditions remains limited. Napa cabbage has a short life cycle that frequently overlaps peak activity of flea beetles, lepidopteran larvae, and aphids, creating a production scenario in which early- and mid-season pest suppression is critical. At the same time, crop sensitivity to low temperatures during establishment makes it useful for assessing whether mesotunnels can provide concurrent benefits for pest management and season extension without compromising crop performance.
The objective of this study was to compare insect exclusion netting deployed as a mesotunnel system, spunbonded polypropylene fabric used as a low tunnel system, and an OMRI-listed insecticide program against an untreated control. Comparisons focused on insect pressure, marketable yield, and season-extension potential in organic napa cabbage production in Iowa. We hypothesized that (1) mesotunnels would reduce insect abundance and decrease insecticide use relative to other management approaches, (2) mesotunnels would maintain or increase marketable yield, and (3) breathable mesh insect exclusion netting would influence crop microclimate to provide season-extension benefits without inducing detrimental heat stress on napa cabbage. Findings from this work are intended to inform regionally adapted integrated pest management strategies that reduce insecticide inputs while maintaining productivity, thereby supporting the economic and environmental sustainability of organic napa cabbage production in the Midwest.
Materials and methods
Site description
This study was conducted during the 2024 and 2025 growing seasons at Iowa State University Horticulture Research Station in Ames, IA, USA (42°6′24.12″N, 93°35′5.28″W). The 235-acre (95-ha) station is divided into organic and conventional zones. The experimental field was certified organic by the Iowa Department of Agriculture and Land Stewardship (IDALS) and had been preceded by an oat-clover mixture in 2023.
Transplant production
Untreated napa cabbage (Brassica rapa var. pekinensis) seeds (‘Minuet’; Johnny’s Selected Seeds, Winslow, ME, USA) were sown into an organic potting mix (PRO-MIX® MP ORGANIK™ Mycorrhizae™; BFG Supply Company, Burton, OH, USA) in 72-cell plug trays. Trays were maintained in a greenhouse at 22°C. Transplants were fertigated with fish emulsion fertilizer (AquaPower® 5 N–1P–1 K, JH Biotech, Inc., Ventura, CA, USA) beginning 14 d after seeding through transplanting to meet crop nutrient requirements (Midwest Vegetable Production Guide, 2023). Fish emulsion was applied at 150, 300, 300, and 150 mg N·L−1 during weeks 1 through 4, respectively. In both years, 30-d-old transplants were hardened off in an outdoor shade house prior to field transplanting.
Field preparation and crop establishment
Growing season (August–October) weather data, including mean monthly air temperature, precipitation, and relative humidity, for both years are summarized in Table 1 (Iowa Environmental Mesonet, 2025). Soils at the study site were classified as Lester loam with 2%–6% slope (USDA NRCS, 2025). Fertilizer application rates were based on baseline soil analysis test results and sufficiency recommendations (Midwest Vegetable Production Guide, 2023). Nitrogen (N) was applied at 168 kg·ha−1 and phosphorus (P₂O₅) at 112 kg·ha−1, based on soil test recommendations. Certified organic fertilizers were applied preplant and incorporated before bed formation. In 2024, Suståne® (8 N–2P–4 K; Suståne Natural Fertilizer, Inc., Cannon Falls, MN, USA) was applied using a broadcast fertilizer spreader (Model 2000; The Andersons, Maumee, OH, USA). In 2025, the same fertilizer was applied using the same spreader, with additional hand broadcasting of bone meal (3 N–15P–0 K; Down to Earth Distributors Inc., Eugene, OR, USA). Fertilizers were incorporated by rototilling, after which polyethylene mulch raised beds were established on 1.83-m centers. Drip irrigation tape was installed beneath the mulch in both years.
Monthly mean low and high air temperature, total precipitation, and relative humidity during the 2024 and 2025 growing seasons†

Table 1. Long description
The table contains five columns: Month, Mean low temperature in degrees Celsius, Mean high temperature in degrees Celsius, Total precipitation in millimeters, and Mean relative humidity percentage.
For the 2024 growing season:
* August: Mean low 17.0, Mean high 30.7, Precipitation 22.1, Humidity 82.2.
* September: Mean low 12.5, Mean high 27.0, Precipitation 50.3, Humidity 74.6.
* October: Mean low 6.0, Mean high 22.5, Precipitation 36.8, Humidity 62.0.
For the 2025 growing season:
* August: Mean low 16.6, Mean high 28.5, Precipitation 94.0, Humidity 84.4.
* September: Mean low 13.0, Mean high 27.8, Precipitation 0.8, Humidity 77.5.
* October: Mean low 8.2, Mean high 20.3, Precipitation 2.7, Humidity 76.0.
Footnotes indicate weather data was obtained from the Iowa Environmental Mesonet station A E E I 4 and relative humidity values are duration-weighted averages.
† Weather data obtained from Iowa Environmental Mesonet (station AEEI4, Ames, IA).
* Relative humidity values represent monthly means calculated as duration-weighted averages of all available observations.
Napa cabbage transplants were established in double rows per raised bed at 30 cm in-row and between-row spacing using a water wheel transplanter (Model 1600; Rain-Flo Irrigation, East Earl, PA, USA). Soil moisture was monitored using a tensiometer installed at a depth of 30 cm (Irrometer®; Irrometer Co., Inc., Riverside, CA, USA), and irrigation was turned on when the tensiometer read 207 kPa and applied for approximately 3–4 h per irrigation event. To manage weeds between raised beds, woven black polypropylene landscape fabric (Nolt’s Midwest Produce Supplies, Charles City, IA, USA) was laid between beds before treatment installation. All tunnel treatments were established within 24 h of transplanting.
Experimental design and treatment application
The study was arranged as a randomized complete block design with five treatments replicated four times (Fig. 1). Each experimental unit consisted of a single raised bed (6.1 m long and 0.6 m wide), arranged in two rows per raised bed and 20 plants in each row.
Mesotunnel and low tunnel systems used for organic napa cabbage production at Iowa State University Horticulture Research Station, Ames, IA. (A) Aerial drone view of experimental plots showing treatments arranged in replicated beds. (B) Ground-level view of mesotunnel and low tunnel structures. Mesotunnels were formed using conduit hoops bent to approximately 1.07 m in height and covered with insect exclusion netting, whereas low tunnels were supported by wire hoops 0.46 m high, covered with spunbonded polypropylene fabric.

The five treatments were as follows:
-
i. Mesotunnel (MT): Raised beds with 1.07-m-tall conduit hoops covered with mesh insect exclusion netting (mesh size 0.60 mm × 1.05 mm; ExcludeNet®, 85 g·m−2; The Berry Patch, Stephentown, NY, USA).
-
ii. Mesotunnel + OMRI-listed insecticide sprays (MT-OI): The same structure as MT, with OMRI-listed insecticides applied as needed based on scouting thresholds. Insecticides were sprayed directly through the netting without removal using a backpack sprayer (BP-4Li, DRAMM Corporation, Manitowoc, WI, USA).
-
iii. OMRI-listed insecticide sprays (OI): Beds were left uncovered and received OMRI-listed insecticides applied using a backpack sprayer as needed based on pest scouting thresholds. Pest populations were monitored and averaged across treatments. Insecticide application decisions were made based on treatment-level averages relative to the established economic thresholds.
-
iv. Low tunnel (LT): 0.46-m-tall, 9-mm galvanized iron wire hoops covered with spunbonded polypropylene fabric with 85% light transmission (18.6 g·m−2 Winterized DeWitt® Floating Row Cover; Nolt’s Midwest Produce Supplies, Charles City, IA, USA). When the pest population exceeded the economic threshold level, spunbonded fabric was temporarily removed to allow insecticide application and then replaced.
-
v. Control: Beds received no row cover or insecticide application.
Organic insect pest management in the MT-OI, LT, and OI treatments included the use of pyrethrins (PyGanic® Crop Protection EC 5.0 II; MGK Company, Minneapolis, MN, USA) for aphid control; Bacillus thuringiensis subsp. kurstaki (Javelin® WG; Certis USA, LLC, Columbia, MD, USA) for lepidopteran larvae; and potassium salts of fatty acids (M-Pede®; Gowan Company, Yuma, AZ, USA) for soft-bodied insects. Insecticides were tank-mixed and applied according to label instructions for targeted pest control. Economic thresholds were based on established pest management guidelines and included stage-specific thresholds for lepidopteran pests (20%–30% infestation during pre-cupping and cupping stages and 5%–15% during head formation). For flea beetles, insecticide applications were based on observed damage levels and pest presence using visual assessment methods. For brevity, treatments are hereafter referred to by their abbreviations (MT, MT-OI, OI, LT, and Control) as shown in Table 2.
Description of experimental treatments for pest exclusion and season extension in the organic napa cabbage study
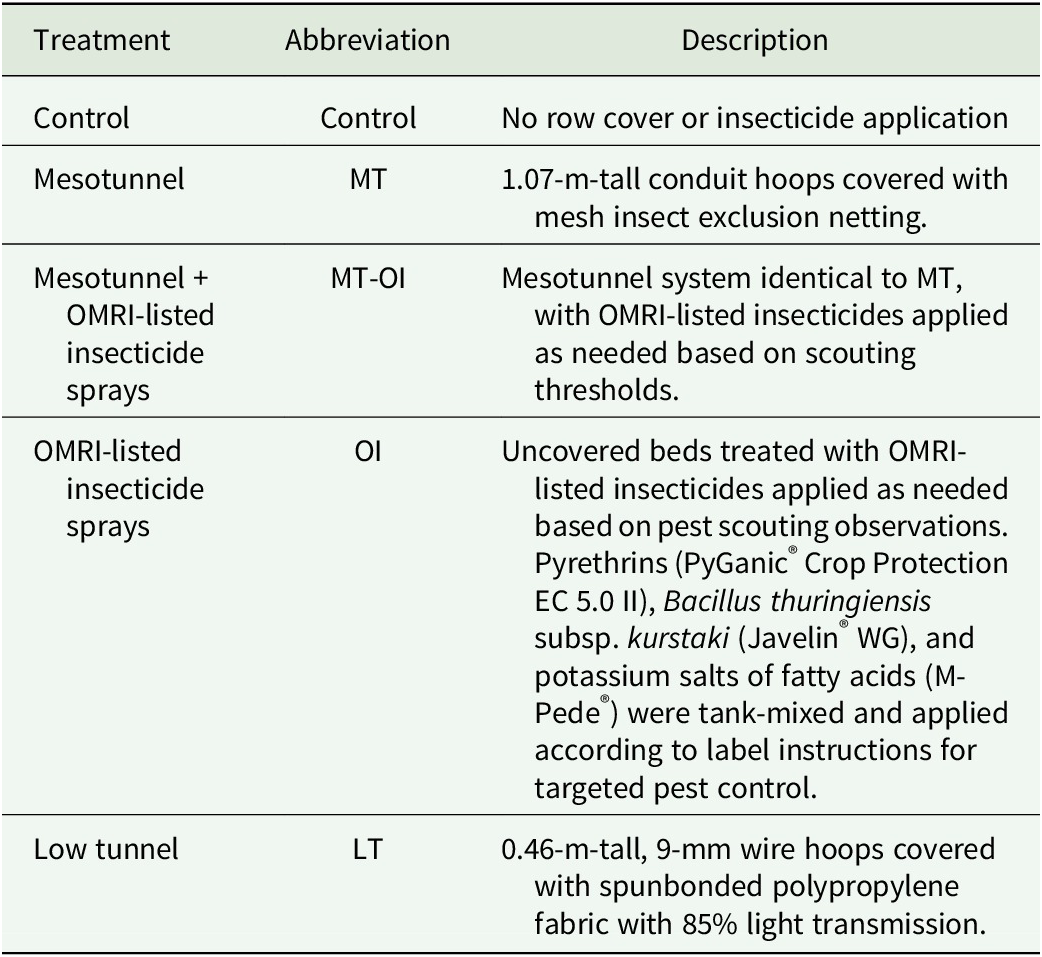
Table 2. Long description
The table consists of three columns: Treatment, Abbreviation, and Description.
1. Treatment: Control. Abbreviation: Control. Description: No row cover or insecticide application.
2. Treatment: Mesotunnel. Abbreviation: M T. Description: 1.07 meter tall conduit hoops covered with mesh insect exclusion netting.
3. Treatment: Mesotunnel plus O M R I listed insecticide sprays. Abbreviation: M T dash O I. Description: Mesotunnel system identical to M T, with O M R I listed insecticides applied as needed based on scouting thresholds.
4. Treatment: O M R I listed insecticide sprays. Abbreviation: O I. Description: Uncovered beds treated with O M R I listed insecticides applied as needed based on pest scouting observations. Pyrethrins (PyGanic Crop Protection E C 5.0 I I), Bacillus thuringiensis subspecies kurstaki (Javelin W G), and potassium salts of fatty acids (M dash Pede) were tank mixed and applied according to label instructions for targeted pest control.
5. Treatment: Low tunnel. Abbreviation: L T. Description: 0.46 meter tall, 9 millimeter wire hoops covered with spunbonded polypropylene fabric with 85 percent light transmission.
Installation of tunnel treatments
Spunbonded fabric and insect exclusion netting materials were cut into 9.14-m × 3.96-m sizes prior to installation. For MT and MT-OI, 1.27-cm-diameter, 3.04-m-long conduits were bent to form hoops, producing tunnels 1.07 m high at the center of the bed. Hoops were installed over each raised bed by inserting the ends through the landscape fabric and 10–15 cm deep into the soil on both sides of the bed. Conduit hoops were arranged in a zigzag pattern for structural support, with end hoops positioned perpendicular to the bed (Fig. 1). Each mesotunnel treatment consisted of 12 hoops and was covered with pre-cut insect exclusion netting, which was secured with prefilled sandbags, with two sandbags placed at each tunnel end and seven along each side parallel to the bed.
For LT, 9-mm galvanized iron wire hoops were spaced 0.61 m apart and covered with spunbonded fabric with 85% light transmission. Row cover edges were secured with sandbags in the same manner as in MT and MT-OI. Insect exclusion netting and spunbonded fabric remained in place throughout the season and were partially lifted during pest scouting. Additionally, during periods of high temperatures (>32°C), ends of the spunbonded fabric in LT were temporarily opened to reduce heat buildup and improve ventilation, consistent with common grower practices for managing temperature under row covers. In LT, spunbonded fabric was entirely removed during insecticide applications and replaced immediately afterward. In contrast, for MT-OI, insecticides were sprayed directly through the insect exclusion netting (Nelson et al., Reference Nelson, González-Acuña, Nair, Cheng, Mphande, Badilla-Arias, Zhang and Gleason2023; Mphande et al., Reference Mphande, Badilla-Arias, Cheng, González-Acuña, Nair, Zhang and Gleason2024).
Field data collection
Sticky traps
During the first week following tunnel installation and the final week of the experiment at harvest, two yellow sticky traps (PESTrap®, 7.6 × 12.7 cm; Phytotronics, Inc., Earth City, MO, USA) were placed in each treatment for one week at a time to monitor pest presence. Traps were collected and examined under a stereomicroscope for insect identification and counts. Sticky trap data were solely used qualitatively to confirm the presence and activity of flea beetles within and around the treatments.
Visual insect pest monitoring
At the beginning of each season, 12 plants per treatment were randomly preselected and monitored weekly throughout the study period. Scouting was conducted at a consistent time in the morning, and each plant was inspected for 45 s. During each observation period, all target insect taxa present on the entire plant were visually assessed and counted without disturbing the plant structure. The counts represent individuals observed within the fixed observation window. Monitoring focused on major Brassica pests, including caterpillars [beet armyworm (Spodoptera exigua), cabbage looper (Trichoplusia ni), cross-striped cabbageworm (Evergestis rimosalis), diamondback moth ( Plutella xylostella ), imported cabbageworm ( Pieris rapae ), southern cabbageworm (Pontia protodice), and yellow-striped armyworm (Spodoptera ornithogalli)], flea beetles (Phyllotreta spp.), harlequin bug (Murgantia histrionica) nymphs and adults, and aphids.
Aphid populations were not counted individually due to high densities. Instead, aphid infestations were assessed weekly using a categorical severity scale from 0 to 4, where 0 = no aphids, 1 = 1–20 aphids (very low), 2 = 20–50 aphids (low), 3 = 50–100 aphids (moderate), and 4 = greater than 100 aphids per plant (severe). Each categorical score corresponded to an estimated number of aphids observed on the plant.
Insecticide spray decision thresholds
Insecticide applications were based on weekly scouting observations. Caterpillar management followed stage-specific thresholds, with applications initiated based on the proportion of infested plants and growth stage, emphasizing early intervention to prevent defoliation and head contamination (Cannon and Bunn, Reference Cannon and Bunn2016). For aphids, insecticide applications were initiated immediately upon detection of small colonies or clusters on the monitored plants. This rapid-response approach is consistent with recommendations indicating that aphid populations can increase rapidly under favorable conditions and that early intervention is necessary to prevent the establishment and further spread (Cannon, Bunn and Alston, Reference Cannon, Bunn and Alston2017). Flea beetles and harlequin bugs were monitored but not used as independent criteria for insecticide applications; however, PyGanic®, included in the spray program, has activity on a broad range of insects. Therefore, the applications targeting caterpillar pests likely provided incidental suppression. All insecticide applications were recorded throughout both growing seasons, and the total number of applications was summarized by treatment to compare pest pressure and management requirements.
Microclimate variation
In the MT, LT, and OI treatments, microclimate conditions were monitored using HOBO data loggers (MX 2301, MX 2202, MX 2201; Onset Computer Corp., Bourne, MA, USA). Air temperature (°C), soil temperature (°C), and relative humidity (%) were recorded at hourly intervals from transplanting through harvest.
Sensors were mounted on wooden stakes at canopy height and installed in three replications per treatment. Soil temperature was measured using a sensor enclosed in a sealed polyethylene bag to protect it from physical damage and placed 5 cm deep at the center of the bed. Three treatments were selected for monitoring microclimate to represent distinct structural conditions: mesotunnel (MT), low tunnel (LT), and open-field conditions (OI). MT was considered representative of MT-OI due to identical tunnel structure and netting, while OI represented open-field conditions and therefore reflected an open-field microclimate comparable to the untreated control. Sensors were not equipped with solar radiation shields; therefore, measurements reflect treatment-level canopy microclimate and are used for relative comparisons among treatments rather than for absolute air temperature estimation.
Yield
Before grading and measurement, outer wrapper leaves were removed from all napa cabbage heads to expose the marketable portion. Leaves were trimmed to a commercially acceptable standard consistent with USDA grading guidelines to ensure accurate assessment of marketable head size and appearance. The number of wrapper leaves removed varied among treatments depending on leaf conditions at harvest, and additional leaves were removed as needed to reveal a clean, uniform head suitable for data collection.
In both years, two harvests were conducted to evaluate whether tunnel treatments affected the time to horticultural maturity. Harvested heads were graded as marketable or nonmarketable according to USDA commercial standards (USDA AMS, 2016). Marketable heads were defined as those with an equatorial head diameter of 18 cm or greater. Heads below this threshold but of acceptable quality were classified as small but marketable. Nonmarketable heads included those with defects such as insect injury, rot, puffiness, or loose head formation (Fig. 2).
Grading categories used to classify organic napa cabbage heads at harvest. (A) Marketable. (B) Small but marketable. (C) Insect damage. (D) Rotting. (E) Puffy heads. (F) Loose heads.

Figure 2. Long description
The photo is divided into two rows and three columns.
* Panel A at the top-left shows three large, tightly packed, pale green marketable cabbage heads.
* Panel B at the bottom-left shows three similar marketable heads that are noticeably smaller in size.
* Panel C at the top-center displays three heads with significant brown spotting and holes on the outer leaves caused by insect damage.
* Panel D at the bottom-center shows three heads in various stages of decay, with the rightmost head being almost entirely brown and shriveled due to rotting.
* Panel E at the top-right features three puffy heads where the leaves are splayed outward and lack a dense, compact core.
* Panel F at the bottom-right shows three loose heads that are taller and thinner than marketable ones, with leaves that do not wrap tightly around the center.
Napa cabbage head characteristics
After grading, five marketable heads were randomly selected from each treatment crate for measurement of napa cabbage head characteristics. Head polar length was measured from the basal stem attachment point to the apical tip, and the head equatorial width was measured across the widest horizontal portion of each head. Measurements were averaged to obtain a per-head mean value for each plot and expressed in centimeters.
Napa cabbage head biomass
Of the five marketable napa cabbage heads selected for morphological measurements, two were randomly selected for biomass determination. Heads were halved longitudinally and oven-dried at 67°C for four weeks or until a constant dry weight was achieved. Dried samples were weighed and reported as dry biomass per head in grams.
Statistical analysis
Statistical analyses were performed in SAS version 9.4 (SAS Institute Inc., Cary, NC, USA) using the GLIMMIX procedure. Data from both years were analyzed using a combined model with treatment, year, and treatment × year interaction included as fixed effects and block nested within year as a random effect. When a significant treatment × year interaction was detected (α = 0.05), treatment means were reported separately by year. When no significant interaction was detected, data were pooled across years, and the combined means are reported.
Insect abundance and microclimate variables were analyzed as repeated measures, with sampling week specified as the repeated factor within each experimental unit. End-of-season response variables, including marketable and nonmarketable yield and napa cabbage head traits, were analyzed as single-time-point measures using linear mixed-effects models with treatment, year, and treatment × year interaction as fixed effects and block nested within year as a random effect. When significant effects were detected, treatment means were separated using least square means with Fisher’s least significant difference (LSD) test and differences were considered significant at α = 0.05.
Results
Microclimate
Air and soil temperature
Seasonal mean, minimum, and maximum air temperatures differed significantly among treatments (Table 3). Low tunnel had the highest seasonal mean air temperature, followed by mesotunnel and open-field conditions. Air temperatures in low tunnels ranged from 1.8°C to 2.8°C above open-field conditions, whereas air temperatures in mesotunnels ranged from 0.4°C to 1.0°C above open-field conditions.
Effect of treatment on seasonal air and soil temperatures pooled across the 2024 and 2025 growing seasons

Table 3. Long description
The table is organized into seven columns. The first column lists the Treatment types, followed by three columns for Air temperature in degrees Celsius (Mean, Min, Max) and three columns for Soil temperature in degrees Celsius (Mean, Min, Max).
* Mesotunnel: Air Mean 19.9 b, Min 11.3 b, Max 29.0 b. Soil Mean 21.1 b, Min 16.2, Max 26.7 b.
* Low tunnel: Air Mean 20.8 a, Min 12.7 a, Max 30.8 a. Soil Mean 21.7 a, Min 16.3, Max 28.3 a.
* Open-field: Air Mean 19.4 b, Min 10.9 b, Max 28.0 c. Soil Mean 20.8 b, Min 15.9, Max 25.9 b.
* P values: Air Mean 0.0013, Min 0.0288, Max 0.0012. Soil Mean 0.0068, Min 0.6924, Max 0.0225.
* S E values: Air Mean plus or minus 0.08, Min plus or minus 0.28, Max plus or minus 0.20. Soil Mean plus or minus 0.11, Min plus or minus 0.29, Max plus or minus 0.31.
Lowercase letters a, b, and c indicate significant differences based on Fisher’s least significant difference test at P less than or equal to 0.05.
* Mesotunnel was considered representative of both MT and MT-OI due to an identical tunnel structure, while open-field reflected ambient conditions in OI and control.
i Means within a column followed by different letters differ significantly based on Fisher’s least significant difference (LSD) test at P ≤ 0.05.
Seasonal mean and maximum soil temperatures differed significantly among treatments, while seasonal minimum soil temperature did not differ (Table 3). Mean and maximum soil temperatures were significantly higher in the low tunnel than in the mesotunnel and open-field treatments, which did not differ from each other. Soil temperatures in low tunnels ranged from 0.4°C to 2.4°C above open-field conditions, whereas soil temperatures in mesotunnels ranged from 0.3°C to 0.8°C above open-field conditions.
Relative humidity
Relative humidity patterns generally corresponded with temperature differences among treatments. Seasonal mean relative humidity differed significantly among treatments (P = 0.0138; Fig. 3) with no significant treatment × year interaction detected (P = 0.0747). Low tunnel had the highest seasonal mean relative humidity (81.1%), which was significantly greater than both mesotunnel (77.1%) and open-field conditions (77.2%). Mesotunnel and open-field did not differ from each other.
Weekly mean relative humidity under open-field, mesotunnel, and low tunnel treatments, pooled across the 2024 and 2025 growing seasons. Relative humidity was recorded throughout the growing season and plotted as weeks after transplanting. Points represent treatment means ± standard error of the mean (SE).

Figure 3. Long description
The x-axis represents Weeks after transplanting, numbered 1 through 7. The y-axis represents Relative humidity percent, ranging from 50 to 100. Three colored lines track the data: a red line for Open-field, a yellow line for Mesotunnel, and a green line for Low tunnel. Vertical gray error bars indicate S E at each data point.
* From week 1 to week 2: All treatments fluctuate between 65 and 83 percent. Initially, the green low tunnel line is the lowest, but it converges with the others by week 2.
* From week 2 to week 4: The green low tunnel line rises significantly above the other two, maintaining a higher relative humidity that peaks near 92 percent at week 4. The red and yellow lines remain closely overlapped, fluctuating between 70 and 85 percent.
* From week 4 to week 6: The green line remains the highest, showing peaks near 93 percent at weeks 5 and 5.5. The red and yellow lines continue to track together at a lower level, generally 5 to 10 percent below the green line.
* From week 6 to week 7: All three treatments show a sharp decline followed by a final slight increase. By week 7, the green line remains the highest at approximately 79 percent, while the red and yellow lines end near 75 percent.
Insect abundance
Caterpillars
No significant treatment × year interaction was detected for caterpillar abundance (P = 0.4176), and data were pooled across years. Treatments differed significantly in caterpillar abundance (P < 0.0001; Fig. 4). MT-OI and MT had the lowest caterpillar counts and were statistically similar. OI did not differ from LT, but had significantly lower caterpillar counts than the control. Control had the highest caterpillar counts, which did not differ from LT.
Seasonal insect abundance across treatments in organic napa cabbage production. Insect abundance is expressed as seasonal counts per bed; aphid infestation is expressed as mean aphid severity score per bed. (A) Caterpillars and (B) harlequin bugs are presented as pooled means across the 2024 and 2025 growing seasons. Flea beetles (C, D) and aphids (E, F) showed significant treatment × year interactions and are presented by year. Bars represent treatment means ± standard error of the mean (SE). Different letters indicate significant differences among treatments based on Fisher’s least significant difference (LSD) test at P ≤ 0.05. MT = mesotunnel; MT-OI = mesotunnel + OMRI-insecticides; OI = OMRI-insecticides; LT = low tunnel.

Figure 4. Long description
The figure consists of six panels arranged in a two-column by three-row grid. All panels share a common x-axis with five treatments: Control (gray), M T (yellow), M T dash O I (orange), O I (blue), and L T (green). Error bars represent S E.
* Panel A: Caterpillars (Pooled). Y-axis is seasonal counts from 0 to 20. Control is highest at approximately 13.5 (a), followed by L T at 12 (ab), O I at 11 (b), and M T and M T dash O I both below 5 (c).
* Panel B: Harlequin bugs (Pooled). Y-axis is seasonal counts from 0 to 6. Control is highest at 4 (a), followed by O I at 3.5 (ab), L T at 3 (b), and M T and M T dash O I near 0.5 (c).
* Panel C: Flea Beetles (2024). Y-axis is seasonal counts from 0 to 25. Control is highest at 19 (a), O I at 9 (b), L T at 5 (c), and M T and M T dash O I at 2.5 (d).
* Panel D: Flea Beetles (2025). Y-axis is seasonal counts from 0 to 17.5. Control is highest at 12.5 (a), followed by L T and O I around 7.5 to 8 (b), and M T and M T dash O I around 4 (c).
* Panel E: Aphids (2024). Y-axis is Aphid score from 0 to 3.5. L T is highest at 2.25 (a), followed by M T at 1.0 (b). Control, M T dash O I, and O I are all lowest around 0.5 (c).
* Panel F: Aphids (2025). Y-axis is Aphid score from 0 to 3.0. L T is highest at 1.9 (a), followed by M T and M T dash O I around 0.75 to 1.0 (b). Control and O I are lowest at 0.25 (c).
Harlequin bugs
No significant treatment × year interaction was detected for harlequin bug abundance (P = 0.3734); data were therefore pooled across years. Treatments differed significantly in harlequin bug counts (P < 0.0001; Fig. 4). MT and MT-OI had the lowest harlequin bug counts and were statistically similar. LT had significantly lower counts than the control but higher than MT and MT-OI. Control had the highest counts and did not differ from OI.
Flea beetles
A significant treatment × year interaction was detected for flea beetle abundance (P < 0.0001), and data were reported by year (Fig. 4). In 2024, treatments differed significantly in flea beetle abundance (P < 0.0001), with the control recording the highest flea beetle counts. OI had significantly lower counts than the control but higher than all tunnel treatments. LT had fewer flea beetles than OI but more than MT and MT-OI. MT and MT-OI had the lowest counts and did not differ from each other. In 2025, treatments differed significantly in flea beetle abundance (P < 0.0001), and the control again recorded the highest flea beetle counts. OI and LT did not differ significantly from one another and had higher counts than MT and MT-OI. MT and MT-OI had the lowest counts and did not differ statistically from each other.
Aphids
A significant treatment × year interaction was detected for aphid abundance (P = 0.0464), and data were presented by year (Fig. 4). In 2024, treatments differed significantly in aphid abundance (P < 0.0001). LT recorded the highest aphid pressure and was significantly higher than all other treatments. MT had moderate aphid abundance, which was significantly higher than OI, MT-OI, and the control. The control, MT-OI, and OI did not differ from each other.
In 2025, treatments differed significantly in aphid abundance (P < 0.0001). LT followed a similar pattern to the previous year, with the highest aphid abundance. Aphid abundance under MT and MT-OI was statistically similar and greater than the control and OI, which did not differ from each other. Across both years, aphid severity scores remained low in all treatments except LT, which consistently recorded the highest aphid abundance.
Insecticide applications
The number of insecticide applications varied among treatments and years (Table 4). OI received five caterpillar-targeted applications and no aphid-targeted applications in both years. LT required the most total applications overall, whereas MT-OI required the fewest across both seasons. All insecticides were applied according to established action thresholds, as described in Materials and Methods.
Number of insecticide applications by treatment and year in the organic napa cabbage study in 2024 and 2025†

Table 4. Long description
The table consists of five columns: Treatment, Year, Aphid-focused sprays, Caterpillar-focused sprays, and Total sprays.
- Treatment M T dash O I: In 2024, there was 1 aphid spray, 1 caterpillar spray, and 2 total sprays. In 2025, there was 1 aphid spray, 2 caterpillar sprays, and 3 total sprays.
- Treatment L T: In 2024, there were 5 aphid sprays, 2 caterpillar sprays, and 7 total sprays. In 2025, there were 3 aphid sprays, 2 caterpillar sprays, and 5 total sprays.
- Treatment O I: In 2024, there were 0 aphid sprays, 5 caterpillar sprays, and 5 total sprays. In 2025, there were 0 aphid sprays, 5 caterpillar sprays, and 5 total sprays.
Footnotes indicate that M T dash O I stands for Mesotunnel plus O M R I dash insecticides, O I stands for O M R I dash insecticides, and L T stands for Low tunnel. Control and M T treatments received zero applications and are not listed in the data rows.
† Insecticide spray schedules followed established action thresholds for aphids and caterpillars as described in ‘Materials and Methods’ section. Control and MT treatments did not receive insecticide applications in either year.
* MT-OI = mesotunnel + OMRI-insecticides, OI = OMRI-insecticides, LT = low tunnel.
Refer to Table 2 for a detailed description of treatments.
Napa cabbage yield
Marketable yield
No significant treatment × year interaction was detected for marketable head number (P = 0.1304) or marketable weight (P = 0.3228), and data were pooled across years (Fig. 5). MT-OI produced the highest marketable head number and was significantly greater than all other treatments, with a 148% increase compared with the control. MT and LT produced marketable head numbers that were 107% and 95% greater than the control, respectively, and did not differ from each other. OI produced 66% more marketable heads than the control, but was significantly lower than MT and LT. Marketable weight showed a similar pattern (Fig. 5). MT-OI produced the highest marketable weight, 220% greater than the control. MT produced the second-highest marketable weight at 166% greater than the control, differing significantly from MT-OI. Marketable weights under LT and OI were 129% and 94% greater than the control, respectively, and did not differ significantly from each other but were both lower than MT and MT-OI. Overall, tunnel-based treatments (MT-OI, MT, and LT) consistently produced higher marketable yield than the untreated control.
Marketable and nonmarketable yield of organic napa cabbage across treatments. (A) Number of heads per bed and (B) weight (kg) per bed, categorized as marketable or nonmarketable. Values are means per bed (40 plants) grown on a 6.1-m-long raised bed, pooled across 2024–2025. Within each category, bars with different letters differ significantly according to Fisher’s least significant difference (LSD) test at P ≤ 0.05. Error bars represent standard errors of the mean (SE). MT = mesotunnel; MT-OI = mesotunnel + OMRI-insecticides; OI = OMRI-insecticides; LT = low tunnel.

Figure 5. Long description
A legend at the top identifies five treatments: Control in gray, M T in yellow, M T dash O I in orange, O I in blue, and L T in green.
Panel A, Napa cabbage head number: The y-axis ranges from 0 to 40. Data is grouped into Marketable and Nonmarketable categories.
* Marketable: Control is lowest at approximately 10 heads, followed by O I at 17, L T at 20, M T at 22, and M T dash O I highest at 26.
* Nonmarketable: Control is highest at 30 heads, followed by O I at 23, L T at 20, M T at 18, and M T dash O I lowest at 14.
Panel B, Napa cabbage head weight in k g: The y-axis ranges from 0 to 40.
* Marketable: Control is lowest at approximately 8 k g, followed by O I at 16, L T at 19, M T at 22, and M T dash O I highest at 27.
* Nonmarketable: Control is highest at 27 k g, followed by O I at 20, M T at 17, L T at 16, and M T dash O I lowest at 12.
In both panels, error bars indicate S E. Lowercase letters above bars denote statistical significance where M T dash O I consistently shows the highest marketable yield and lowest nonmarketable yield compared to the Control.
Nonmarketable yield
No significant treatment × year interaction was detected for nonmarketable head number (P = 0.1304) or nonmarketable weight (P = 0.1971), and data were pooled across years (Fig. 5). Treatment differences in nonmarketable yield were significant, with the control producing the highest nonmarketable head number and weight. MT-OI produced the fewest nonmarketable heads, representing a 52% reduction compared with the control. MT and LT produced 38% and 33% fewer nonmarketable heads than the control, respectively, and did not differ from each other. OI produced 23% fewer nonmarketable heads than the control. Corresponding nonmarketable weights showed a similar trend, with MT-OI producing the lowest weight and the control producing the greatest (Fig. 5).
Insect-damaged napa cabbage heads were the primary contributor to nonmarketable yield and were highest in the control (Fig. 6). No significant treatment × year interaction was detected for insect-damaged head number (P = 0.3116) or weight (P = 0.3725), and data were pooled across years. All treatments produced fewer insect-damaged heads than the control. MT-OI resulted in the greatest reduction, with 69% fewer insect-damaged heads than the control. MT and LT were statistically similar to each other and produced 50% and 44% fewer insect-damaged heads than the control, respectively. OI resulted in 28% fewer insect-damaged heads than the control.
Nonmarketable categories of organic napa cabbage across treatments. (A) Number of heads per bed and (B) weight (kg) per bed. In panel A, rot is presented separately for 2024 and 2025 due to a significant treatment × year interaction (P = 0.0221); in panel B, rot is pooled across years as no significant interaction was detected for weight. All other categories are pooled across years in both panels. Values are means per bed (40 plants) grown on a 6.1-m-long raised bed. Bars without significance letters did not differ significantly among treatments (P > 0.05). Letters within a segment indicate significant differences based on Fisher’s least significant difference (LSD) test at P ≤ 0.05. MT = mesotunnel; MT-OI = mesotunnel + OMRI-insecticides; OI = OMRI-insecticides; LT = low tunnel.

Figure 6. Long description
Two stacked bar graphs labeled A and B.
Panel A, titled Nonmarketable head number on the y-axis from 0 to 35, shows five treatments on the x-axis: Control, M T, M T-O I, O I, and L T.
* Control has the highest total around 33, dominated by insect damage labeled a.
* M T and M T-O I show lower totals, with insect damage labeled c and d respectively.
* O I and L T show intermediate levels.
* Each bar is stacked from bottom to top with: Insect damage (orange), Puffy (blue), Loose head (green), Rot 2024 (yellow), and Rot 2025 (grey).
* Significant difference letters are present within segments: insect damage ranges from a in Control to d in M T-O I; Rot 2024 ranges from a in M T-O I to b in others.
Panel B, titled Nonmarketable head weight in kilograms on the y-axis from 0 to 35, follows the same x-axis treatments.
* The stacks include Insect damage, Puffy, Loose head, and Rot pooled (yellow).
* Control remains the highest at approximately 27 kilograms, with insect damage labeled a.
* M T-O I is the lowest at approximately 13 kilograms, with insect damage labeled d.
* M T and L T show similar insect damage levels labeled c.
* Rot pooled segments are labeled a for M T and M T-O I, b for Control and O I, and a b for L T.
Other nonmarketable categories included rotting, puffiness, and loose heads (Fig. 6). Bacterial soft rot was suspected based on a diagnostic report identifying Pectobacterium carotovorum. Rot number showed a significant treatment × year interaction (P = 0.0221) and was reported by year. Treatments differed significantly in 2024 (P = 0.0109), with MT-OI and MT producing higher rot head numbers than other treatments. No treatment differences were detected in 2025 (P = 0.3876). Rot weight (P = 0.1041), puffy heads (number: P = 0.9222; weight: P = 0.7308), and loose heads (number: P = 0.9891; weight: P = 0.8841) were pooled across years and did not differ significantly among treatments.
Harvest timing
Pooled across years, a significant treatment × date interaction was detected for marketable and nonmarketable yields (P < 0.0001), indicating that treatment effects depended on harvest timing (Supplementary Table S1). At first harvest, MT-OI produced the greatest marketable number and weight, followed by MT and LT, which did not differ from each other. OI and control were the lowest and did not differ from each other.
At the second harvest, the pattern shifted, as most heads in tunnel treatments had already been harvested, leaving relatively fewer to harvest. OI produced the greatest marketable head number and was significantly higher than all other treatments, which did not differ from each other. OI also produced the greatest marketable weight and did not differ significantly from MT-OI, while MT, LT, and control were lower and similar to each other. Across years, differences in marketable head number were observed among harvest dates, with tunnel treatments producing a greater proportion of marketable yield at the first harvest.
Napa cabbage head characteristics
Head polar length and head equatorial width
A significant treatment × year interaction was detected (P < 0.0001), and data were reported by year (Table 5). In 2024, all treatments had significantly longer heads than the control. Head polar length was statistically similar among LT, MT-OI, and MT. In 2025, LT, MT, and MT-OI had longer heads than the control and were statistically similar to each other. OI did not differ from the control.
Effect of treatment on napa cabbage head characteristics and dry biomass in 2024 and 2025

Table 5. Long description
The table consists of six columns: Treatment, Head polar length in centimeters for 2024 and 2025, Head equatorial width in centimeters pooled, and Dry biomass in grams for 2024 and 2025.
* Control: Head length 24.0 c in 2024, 23.8 b in 2025. Width 9.7 b. Biomass 23.6 c in 2024, 23.9 b in 2025.
* M T: Head length 28.8 a in 2024, 24.8 a in 2025. Width 11.1 a. Biomass 38.2 a in 2024, 30.9 a in 2025.
* M T dash O I: Head length 29.0 a in 2024, 24.8 a in 2025. Width 11.0 a. Biomass 38.1 a in 2024, 32.6 a in 2025.
* O I: Head length 26.3 b in 2024, 23.7 b in 2025. Width 10.2 b. Biomass 29.3 b in 2024, 26.4 b in 2025.
* L T: Head length 29.2 a in 2024, 25.3 a in 2025. Width 10.8 a. Biomass 31.5 b in 2024, 30.4 a in 2025.
* P-values: Less than 0.0001 for all columns except 2025 head length which is 0.0223.
* S E: Plus or minus 0.42 for head length, plus or minus 0.18 for width, and plus or minus 1.02 for biomass.
Note: Letters a, b, and c indicate significant differences at P less than or equal to 0.05. M T stands for Mesotunnel, O I for O M R I dash insecticides, and L T for Low tunnel.
i Means within column followed by different letters differ significantly according to Fisher’s least significant difference (LSD) test at P ≤ 0.05.
† Head equatorial width was pooled across years; no significant treatment × year interaction was detected (P = 0.068).
* MT = mesotunnel, MT-OI = mesotunnel + OMRI-insecticides, OI = OMRI-insecticides, LT = low tunnel.
Refer to Table 2 for a detailed description of treatments.
No significant treatment × year interaction was detected for head equatorial width (P = 0.068), and data were pooled across years (Table 5). MT, MT-OI, and LT produced significantly wider heads than both OI and the control, which did not differ from one another.
Dry biomass
A significant treatment × year interaction was detected (P = 0.0038), and data were reported by year (Table 5). In 2024, MT and MT-OI produced the greatest biomass and were statistically similar. LT and OI produced greater biomass than the control and did not differ from each other. In 2025, MT-OI, MT, and LT treatments produced the greatest biomass and were statistically similar to one another. OI and control did not differ and produced lower biomass.
Discussion
Microclimate conditions
Air and soil temperature
Seasonal air and soil temperatures under mesotunnels closely tracked those in the open-field conditions throughout the growing season. These findings are consistent with the high permeability of mesh insect exclusion netting, which facilitated airflow while maintaining physical insect exclusion.
Similar responses have been reported in cucurbits, where mesh netting did not significantly alter the daily temperature profile and maintained near-ambient conditions (Athey et al., Reference Athey, Peterson, Dreyer, Harwood and Williams2022; Nelson et al., Reference Nelson, González-Acuña, Nair, Cheng, Mphande, Badilla-Arias, Zhang and Gleason2023; Pethybridge et al., Reference Pethybridge, Damann, Murphy, Diggins and Gleason2024a). Likewise, Fiske et al. (Reference Fiske, Cheng, Kuesel, Zhang, Bessin, Williams and Gonthier2024) observed no significant differences in temperatures between mesotunnel and uncovered treatments in acorn squash. These studies suggest that mesotunnels provide insect exclusion without substantially altering plant canopy temperature or soil temperature.
In contrast, low tunnels with spunbonded fabric maintained significantly higher seasonal air and soil temperatures than both mesotunnel and open-field conditions. The greater warming observed under low tunnels is consistent with previous studies showing that spunbonded fabric restricts airflow and retains solar heat (Wells and Loy, Reference Wells and Loy1993). Studies in brassicas and cucurbits have documented faster heat accumulation and increased risk of heat stress under spunbonded fabric compared with breathable mesh insect netting systems (Kalisz et al., Reference Kalisz, Cebula, Siwek, Sękara, Grabowska and Gil2014; Simon et al., Reference Simon, Komlan, Adjaïto, Mensah, Coffi, Ngouajio and Martin2014; Brockman et al., Reference Brockman, Kuesel, Archer, O’Hearn, Wilson, Scott, Williams, Bessin and Gonthier2020; Nelson et al., Reference Nelson, González-Acuña, Nair, Cheng, Mphande, Badilla-Arias, Zhang and Gleason2023). In the present study, active management practices likely moderated these effects. Spunbonded fabric ends were temporarily opened during high-temperature events (>32°C), reducing heat buildup in low tunnels. Similar ventilation requirements have been reported in muskmelon, where row covers must be removed or ventilated during critical growth stages to prevent overheating (Nelson et al., Reference Nelson, González-Acuña, Nair, Cheng, Mphande, Badilla-Arias, Zhang and Gleason2023). These management interventions reflect commercial production practices but may have reduced temperature differences among treatments. Localized leaf scorching and marginal burn were consistently observed in napa cabbage grown under low tunnels. Similar heat-related injury under spunbonded fabric has been reported in brassica crops during periods of high solar irradiance (Kalisz et al., Reference Kalisz, Cebula, Siwek, Sękara, Grabowska and Gil2014; Simon et al., Reference Simon, Komlan, Adjaïto, Mensah, Coffi, Ngouajio and Martin2014; Brockman et al., Reference Brockman, Kuesel, Archer, O’Hearn, Wilson, Scott, Williams, Bessin and Gonthier2020). However, no scorch symptoms were observed under mesotunnels or open-field treatments, suggesting that greater structural height and airflow under mesotunnels reduced localized heat accumulation relative to spunbonded fabric.
Temperature responses to insect netting are influenced by mesh porosity, tunnel height, and ventilation frequency. Simon et al. (Reference Simon, Komlan, Adjaïto, Mensah, Coffi, Ngouajio and Martin2014) reported greater warming under fine-mesh nets compared with coarse meshes, particularly when nets remained in place during peak daytime heating. The mesh used in the present study (0.60 mm × 1.05 mm) is likely more permeable than the finest mesh associated with pronounced warming effects in prior work. Additionally, the greater height of mesotunnels compared with low tunnels would have further promoted air circulation and heat dissipation.
Relative humidity
Relative humidity differences among treatments reflected variation in cover permeability and ventilation capacity. The low tunnel exhibited a higher seasonal mean relative humidity than both the mesotunnel and the open field, which did not differ from each other. This is consistent with the known tendency of spunbonded fabric to restrict ventilation and alter evaporation, often creating more humid microclimates that can favor moisture-driven diseases (Simon et al., Reference Simon, Komlan, Adjaïto, Mensah, Coffi, Ngouajio and Martin2014). In contrast, the present study showed that mesotunnels did not consistently increase humidity compared with open-field conditions, reflecting the greater air-exchange capacity of mesh insect netting. These findings align with previous studies conducted in cucurbits (Fiske et al., Reference Fiske, Cheng, Kuesel, Zhang, Bessin, Williams and Gonthier2024; Pethybridge et al., Reference Pethybridge, Damann, Murphy, Diggins and Gleason2024a).
Bacterial soft rot incidence, suspected to be caused by Pectobacterium carotovorum, was greater in mesotunnels in 2024 (Fig. 6). However, this was not consistently associated with treatment-level relative humidity differences across years. Bacterial soft rot is primarily soilborne and opportunistic, suggesting that disease incidence was not directly attributable to tunnel-induced humidity differences alone. Instead, transient moisture events, rainfall patterns, or localized canopy wetness not captured by seasonal averages may have contributed to disease development. Overall, these findings suggest that mesotunnels were not associated with sustained increases in moisture-driven disease pressure under the environmental conditions of this study.
Insect pests
Across years, insect pressure was mainly driven by tunnel structure, with mesotunnels providing similar and consistently strong suppression of key pests. These responses are influenced by multiple interacting factors, including material properties (e.g., mesh size and permeability), structural design (e.g., tunnel height), and management practices (e.g., ventilation and closure duration). Although OI reduced insect abundance relative to the control, suppression was lower than that observed under mesotunnels, suggesting that physical exclusion, rather than chemical inputs alone, was the primary driver of pest control. These findings align with prior studies reporting effective pest reduction and improved crop performance under exclusion netting in brassicas and cucurbits (Simon et al., Reference Simon, Komlan, Adjaïto, Mensah, Coffi, Ngouajio and Martin2014; Brockman et al., Reference Brockman, Kuesel, Archer, O’Hearn, Wilson, Scott, Williams, Bessin and Gonthier2020; Nelson et al., Reference Nelson, González-Acuña, Nair, Cheng, Mphande, Badilla-Arias, Zhang and Gleason2023; Fiske et al., Reference Fiske, Cheng, Kuesel, Zhang, Bessin, Williams and Gonthier2024; Mphande et al., Reference Mphande, Badilla-Arias, Cheng, González-Acuña, Nair, Zhang and Gleason2024; Pethybridge et al., Reference Pethybridge, Damann, Murphy, Diggins and Gleason2024a, Reference Pethybridge, Damann, Murphy, Diggins and Gleason2024b).
Caterpillars
Caterpillar populations were markedly reduced under mesotunnels; however, injuries were occasionally evidenced by frass presence within napa cabbage heads, indicating that some larvae remained undetected within the head tissues in all treatments. Scouting focused on externally visible larvae and foliar feeding, and individuals that penetrated developing heads or fed internally likely evaded detection during routine counts. Although mesotunnels are known to restrict the entry of foliar-feeding insects near the crop canopy, several target species, particularly armyworms, pupate in soil, allowing adults to emerge beneath the structures if pupation occurs before tunnel installation.
Targeted caterpillar pests included beet armyworm (Spodoptera exigua), cabbage looper (Trichoplusia ni), cross-striped cabbageworm (Evergestis rimosalis), diamondback moth ( Plutella xylostella ), imported cabbageworm ( Pieris rapae ), southern cabbageworm (Pontia protodice), and yellow-striped armyworm (Spodoptera ornithogalli). Both S. exigua and S. ornithogalli pupate in soil, with mature larvae burrowing into the soil to form subterranean pupal cells from which adults emerge, a life cycle trait that distinguishes them from aboveground-pupating brassica pests (Sparks, Reference Sparks1979; Zheng et al., Reference Zheng, Cong, Wang and Lei2011). Simon et al. (Reference Simon, Komlan, Adjaïto, Mensah, Coffi, Ngouajio and Martin2014) reported similar limitations of exclusion netting in cabbage, where certain lepidopteran pests bypassed exclusion by emerging from within the field or by dropping from net surfaces after pupating. These observations highlight a functional limitation of mesotunnel systems, as soil-pupating species may still contribute to within-tunnel populations following adult emergence beneath the installed netting.
Flea beetles
Sticky cards deployed during the first and final weeks of the season indicated moderate flea beetle pressure in both years. Early-season feeding injury was monitored during the initial weeks after transplanting; however, injury was not assessed later in the season. After week 4, damage from flea beetles could not be reliably distinguished from that caused by caterpillars and grasshoppers. In addition, the accumulation of wrapper leaves obscured the sources of injury. Feeding was primarily confined to outer wrapper leaves and did not affect head marketability unless damage was observed on the trimmed head, in which case plants were classified as nonmarketable due to insect damage.
Both MT-OI and MT provided strong and statistically equivalent suppression across years, with no consistent advantage of insecticide use in MT-OI. Although OI reduced insect abundance relative to the control, suppression remained lower than in mesotunnels. This pattern is consistent with prior findings showing limited efficacy of chemical control alone in organic systems. In acorn squash, OMRI-listed insecticides did not differ from the untreated control for pest suppression, whereas mesotunnels reduced cucumber beetle abundance (Fiske et al., Reference Fiske, Cheng, Kuesel, Zhang, Bessin, Williams and Gonthier2024). Similarly, full-season mesotunnels eliminated the need for insecticides in muskmelon while maintaining pest suppression and yield (Nelson et al., Reference Nelson, González-Acuña, Nair, Cheng, Mphande, Badilla-Arias, Zhang and Gleason2023). Pethybridge et al. (Reference Pethybridge, Damann, Murphy, Diggins and Gleason2024a) reported suboptimal control of squash bugs and cucumber beetles with OMRI-listed pesticides, whereas exclusion netting alone provided effective suppression of insect pests and insect-vectored diseases. Comparable results have been reported in brassica leafy greens, where fine-mesh insect exclusion netting and spunbonded fabric consistently reduced flea beetle damage to levels below those observed under both organic and conventional insecticide programs (Brockman et al., Reference Brockman, Kuesel, Archer, O’Hearn, Wilson, Scott, Williams, Bessin and Gonthier2020). Together, these findings indicate that mesotunnel systems provide effective insecticide-independent flea beetle management.
Aphids
Tunnel structures created microenvironments that favored aphid persistence as a secondary pest response, with LT exhibiting the most pronounced and consistent pressure across years. Although MT consistently exceeded open-field aphid levels across years, MT-OI surpassed open-field levels only in 2025, suggesting that aphid populations under mesotunnels may be influenced by seasonal variation in colonization pressure. Restricted predator access, modified humidity, and the absence of rainfall-mediated aphid wash-off are recognized mechanisms that promote aphid buildup under covered systems. These effects have been documented in organic acorn squash and cabbage systems and are associated with altered insect community dynamics under netted structures (Simon et al., Reference Simon, Komlan, Adjaïto, Mensah, Coffi, Ngouajio and Martin2014; Pethybridge et al., Reference Pethybridge, Damann, Murphy, Diggins and Gleason2024a). In cabbage, permanent netting has been shown to increase aphid populations unless covers are periodically removed to allow access for natural enemies, highlighting a tradeoff between protection from chewing pests and sap-feeding secondary pests (Simon et al., Reference Simon, Komlan, Adjaïto, Mensah, Coffi, Ngouajio and Martin2014). In the current study, intermittent opening of low tunnels during periods of high temperatures (>32°C) may have facilitated aphid immigration. However, permanent netting can promote population buildup once pests establish under conditions of limited natural enemy access, consistent with findings reported by Böckmann (Reference Böckmann2022). Reduced access by parasitoids and predators under low tunnels and mesotunnels likely contributed to aphid infestation in the present study, consistent with previous reports of limited biological regulation under tunnel systems (Brockman et al., Reference Brockman, Kuesel, Archer, O’Hearn, Wilson, Scott, Williams, Bessin and Gonthier2020).
Insecticide applications
Despite following a consistent spray schedule, OI produced a lower yield than mesotunnels. Both MT-OI and MT substantially outperformed OI and the control in terms of yield. The relatively modest yield advantage of MT-OI over MT suggests that physical exclusion was the primary driver of yield improvement, with insecticide inputs providing an additional but not dominant benefit under the conditions of this study.
Spunbonded fabric has been shown to reduce insect damage more consistently than insecticide-based programs in brassica systems (Brockman et al., Reference Brockman, Kuesel, Archer, O’Hearn, Wilson, Scott, Williams, Bessin and Gonthier2020), and mesh netting has also been reported to lower insect pressure sufficiently to reduce insecticide use in cabbage (Simon et al., Reference Simon, Komlan, Adjaïto, Mensah, Coffi, Ngouajio and Martin2014). OMRI-approved insecticides often exhibit limited efficacy, further constraining chemical-based control (Brockman et al., Reference Brockman, Kuesel, Archer, O’Hearn, Wilson, Scott, Williams, Bessin and Gonthier2020; Pethybridge et al., Reference Pethybridge, Damann, Murphy, Diggins and Gleason2024a). Likewise, Nelson et al. (Reference Nelson, González-Acuña, Nair, Cheng, Mphande, Badilla-Arias, Zhang and Gleason2023) reported that full-season mesotunnels in organic muskmelon eliminated the need for pesticide applications while maintaining competitive yields. Importantly, pesticides can be applied through the mesh when needed, enabling targeted intervention without removing the cover (Nelson et al., Reference Nelson, González-Acuña, Nair, Cheng, Mphande, Badilla-Arias, Zhang and Gleason2023), consistent with the approach used in the present study.
Yield and crop quality
Tunnel treatments (MT-OI, MT, and LT) strongly influenced napa cabbage yield and plant growth, with mesotunnels (MT and MT-OI) consistently producing greater marketable head numbers than the control. Across years, tunnels advanced head development, allowing a greater proportion of napa cabbage to reach horticultural maturity at the first harvest. Consequently, these treatments produced substantially more marketable heads during the early harvest window than the control and OI treatments, indicating accelerated plant growth.
Comparable yield gains have been reported in acorn squash, where mesotunnels increased marketable yield by 46%–54% compared with the control, despite higher late-season pest abundance (Fiske et al., Reference Fiske, Cheng, Kuesel, Zhang, Bessin, Williams and Gonthier2024). In muskmelon, full-season mesotunnels consistently increased yield, particularly when integrated with pollination (Nelson et al., Reference Nelson, González-Acuña, Nair, Cheng, Mphande, Badilla-Arias, Zhang and Gleason2023). Mphande et al. (Reference Mphande, Badilla-Arias, Cheng, González-Acuña, Nair, Zhang and Gleason2024) found that full-season mesotunnel coverage resulted in the highest marketable muskmelon yield compared with intermittent (on/off/on) management or open-ended tunnels. Pethybridge et al. (Reference Pethybridge, Damann, Murphy, Diggins and Gleason2024b) reported that muskmelon yield responses to mesotunnels varied by year; however, mesotunnels combined with landscape fabric consistently outperformed the control. Yield responses are not universal, as mesotunnel systems can substantially reduce insect pressure and disease incidence without increasing marketable yield under certain production conditions (Pethybridge et al., Reference Pethybridge, Damann, Murphy, Diggins and Gleason2024a). In brassicas, mesh insect netting improved cabbage yield when microclimate conditions remained within favorable thresholds (Simon et al., Reference Simon, Komlan, Adjaïto, Mensah, Coffi, Ngouajio and Martin2014). These studies support the yield gains observed in organic napa cabbage under mesotunnel systems.
Insect injury was the primary contributor to nonmarketable yield losses across treatments. Mesotunnel treatments achieved the greatest reductions in insect-damaged heads and directly translated into higher marketable yield. Similar cause-and-effect relationships have been reported in muskmelon, where pest and disease incidence declined to near zero under full-season mesotunnels compared with 55%–70% injury in uncovered plots (Nelson et al., Reference Nelson, González-Acuña, Nair, Cheng, Mphande, Badilla-Arias, Zhang and Gleason2023). Mesh netting in cabbage also improved head quality and marketable yield by reducing insect infestation (Simon et al., Reference Simon, Komlan, Adjaïto, Mensah, Coffi, Ngouajio and Martin2014). These findings suggest that yield improvements under mesotunnels were primarily driven by effective pest exclusion and maintenance of head quality.
In the present study, low tunnels reduced pressure from key chewing insect pests relative to the control but were associated with increased aphid populations. Spunbonded fabric is less selective and can induce heat accumulation that is not always beneficial to brassica crops. Consistent with this, muskmelon yields under low tunnels did not differ from those of the uncovered control across multiple years (Nelson et al., Reference Nelson, González-Acuña, Nair, Cheng, Mphande, Badilla-Arias, Zhang and Gleason2023). The low incidence of bacterial soft rot in the current study further suggests that insect suppression was likely the dominant factor influencing nonmarketable yield under mesotunnel treatments.
Modified microclimatic conditions under tunnel treatments may have contributed to observed differences in vegetative morphology (Fig. 7). Tunnel treatments were associated with greater head size and plant growth characteristics, including head length, width, and biomass. Mesotunnels and low tunnels produced greater head diameters and dry biomass than the control, indicating improved vegetative growth and head development. Spunbonded fabric reduces wind speed, thereby decreasing mechanical stress and allowing for greater expansion of the leaf lamina (Wells and Loy, Reference Wells and Loy1993). Although leaf area was not quantified, plants under mesotunnels and low tunnels appeared to develop broader leaves than those under uncovered treatments. Similar trends have been reported under fine-mesh netting, where modified microclimatic conditions promoted vegetative growth when the microclimate remained favorable, especially in cooler environments (Simon et al., Reference Simon, Komlan, Adjaïto, Mensah, Coffi, Ngouajio and Martin2014). These interactions suggest that reduced mechanical stress under both mesotunnels and low tunnels may have supported leaf lamina expansion without inhibiting head formation. Similar responses have been documented in Chinese cabbage grown under non-woven fleece, which exhibited greater plant height, rosette diameter, and leaf size than uncovered plants (Kalisz et al., Reference Kalisz, Cebula, Siwek, Sękara, Grabowska and Gil2014). Similarly, low tunnels improved vegetative growth in Brussels sprouts, increasing leaf area and plant height (Acharya, Welbaum and Arancibia, Reference Acharya, Welbaum and Arancibia2019). Positive correlations between vegetative growth and yield have also been reported in cucurbits (Nair and Ngouajio, Reference Nair and Ngouajio2010; Athey et al., Reference Athey, Peterson, Dreyer, Harwood and Williams2022), supporting the larger head size observed under tunnel treatments in this study.
Overhead images of organic napa cabbage beds under five treatments taken on 18 Sept. 2025, 4 weeks after transplanting. Treatments shown from left to right are (A) mesotunnel, (B) mesotunnel + OMRI-insecticides, (C) low tunnel, (D) OMRI-insecticides, and (E) control. Images qualitatively illustrate differences in canopy development and visible feeding injury among treatments.

Figure 7. Long description
The five panels show vertical rows of napa cabbage plants.
Panel A, mesotunnel, shows dense, vibrant green canopies with minimal visible leaf perforation.
Panel B, mesotunnel plus O M R I insecticides, displays similar high canopy density and healthy leaf structure with very few holes.
Panel C, low tunnel, shows slightly less uniform canopy closure compared to the mesotunnels but maintains relatively intact leaves.
Panel D, O M R I insecticides only, shows visible thinning of the canopy and noticeable small holes scattered across the outer leaves.
Panel E, control, shows the most significant damage, with sparse canopy development and extensive, large irregular holes and tattered leaf edges throughout the plants, indicating high feeding injury.
Advancement in maturity is consistent with the established role of spunbonded fabric and low tunnel systems as tools for season extension. Wells and Loy (Reference Wells and Loy1993) reported that row covers promote earlier crop maturity and extend the market window by enhancing early-season growth under moderate microclimate. Chinese cabbage grown under non-woven fleece matured approximately 13 days earlier than uncovered plants and exhibited greater vegetative development, supporting earlier head formation (Kalisz et al., Reference Kalisz, Cebula, Siwek, Sękara, Grabowska and Gil2014). Acharya et al. (Reference Acharya, Welbaum and Arancibia2019) observed earlier crop development under low tunnels, attributing accelerated maturity to warmer microclimate. To our knowledge, early harvest timing has not been previously documented specifically in mesotunnel systems, although it is well established in low tunnel systems. The accelerated maturity observed in this study aligns with season-extension mechanisms established across multiple row cover systems.
Together, the significant increases in marketable yield, reductions in insect-damaged heads, larger head size, and greater biomass indicate that mesotunnels function as a multifunctional system that improves crop performance through a combination of pest exclusion and enhanced plant growth.
Durability
An additional operational advantage of mesotunnels observed in this study was the superior durability and reusability of mesh exclusion netting compared with spunbonded polypropylene fabric. Mesh netting remained intact and functional after two growing seasons; new netting was cut in the first year and reused in the second year. In contrast, spunbonded fabric in the low tunnel treatment required replacement in the second year due to tearing, stretching, and material weakening. These observations align with previous reports indicating that spunbonded fabric is structurally fragile and poorly suited for multi-year use, whereas mesh exclusion netting is more durable and can be used for several years (Athey et al., Reference Athey, Peterson, Dreyer, Harwood and Williams2022). Brockman et al. (Reference Brockman, Kuesel, Archer, O’Hearn, Wilson, Scott, Williams, Bessin and Gonthier2020) also reported that spunbonded fabric developed rips that compromised exclusion and required repair, in contrast to the longer functional life of fine-mesh insect netting. Although mesotunnels incur higher initial material costs, insect netting costs approximately $8.1 m−2, compared with $0.20 m−2 for spunbonded fabric. The ability to reuse netting across seasons may offset initial costs and improve system-level economic efficiency relative to fabric-based low tunnels.
Conclusions
This study demonstrates that mesotunnel systems using breathable insect exclusion netting are an effective and practical strategy for organic napa cabbage production under Midwestern U.S. conditions. Across years, mesotunnels consistently reduced pressure from key insect pests, resulting in fewer insect-damaged heads and substantially higher marketable yield than OMRI-listed insecticides alone and the control. These yield gains were achieved while maintaining near-ambient air and soil temperatures, suggesting that mesotunnels provided pest protection without inducing the heat stress commonly associated with spunbonded low tunnels.
Mesotunnels also advanced crop maturity, shifting a larger proportion of harvest into earlier market windows and enhancing season-extension potential. Importantly, mesotunnels functioned effectively with minimal insecticide inputs, indicating that physical exclusion alone can serve as the primary pest management tool in organic napa cabbage under moderate pest pressure. However, scouting primarily targeted externally visible pests and early-season feeding injury, which may have underestimated late-season caterpillar pressure as the canopy closed and larvae fed within developing heads. Biological control dynamics were not evaluated within tunnel systems, and restricted access of natural enemies under mesotunnels may have influenced secondary pest dynamics, warranting further investigation. Future research should assess long-term economic performance and integration with biological control to mitigate potential secondary pest outbreaks. Overall, mesotunnels represent a durable, scalable, and insecticide-sparing production system that can improve yield and crop quality, supporting the long-term sustainability of organic production.
Supplementary material
The supplementary material for this article can be found at http://doi.org/10.1017/S1742170526100490.
Acknowledgments
The authors thank the staff at Iowa State University Horticulture Research Station for field assistance and logistical support. The authors also acknowledge the members of the Sustainable Vegetable Production Lab for their assistance with plot maintenance and data collection.
Data availability statement
The datasets generated and analyzed during the study are available from the corresponding author upon reasonable request.
Author contribution
S.C. assisted with experiment design, conducted field trials, collected and analyzed data, interpreted results, and drafted the original manuscript. A.N. developed the research concept, secured funding, supervised the research, and critically revised the manuscript. Both authors reviewed and approved the final manuscript.
Funding statement
This work was supported by the United States Department of Agriculture, National Institute of Food and Agriculture (NIFA), Organic Agriculture Research and Extension Initiative (OREI), project titled ‘Expanding resilient climate and pest protection systems for diversified organic specialty crop producers’ (Award Number 2023–51300-40855). A.N. served as a co-principal investigator on the project.
Competing interests
The authors declare no competing interests.
Ethical considerations
Not applicable. This manuscript does not include human or animal research.
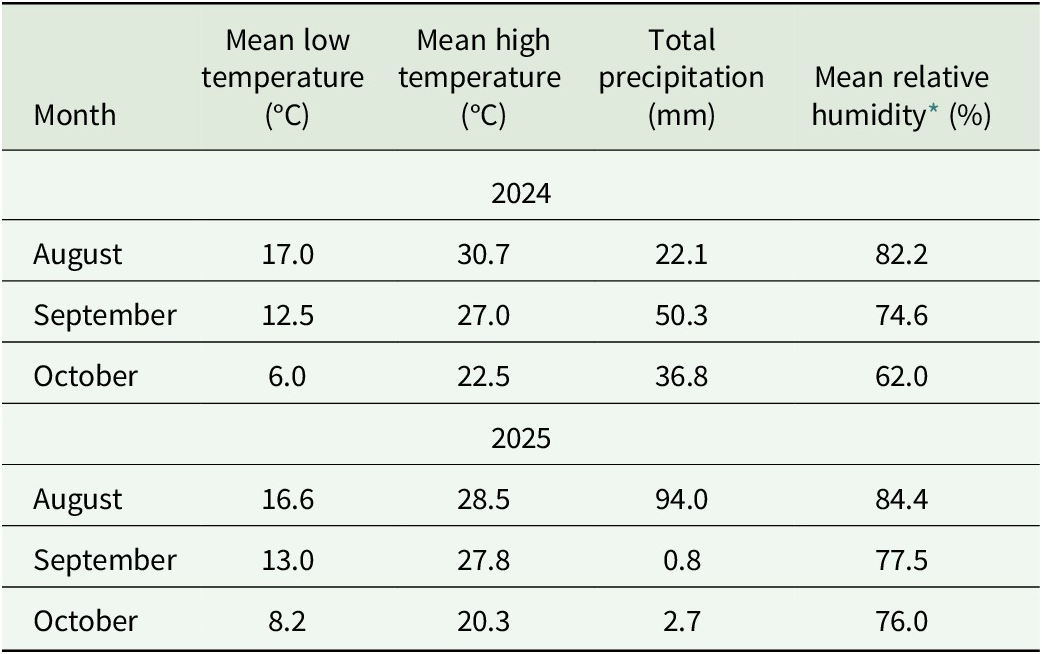

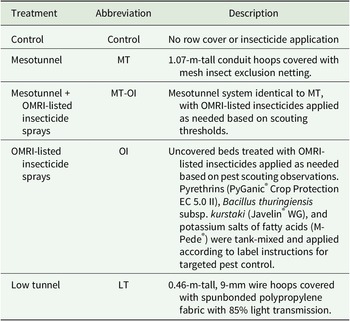
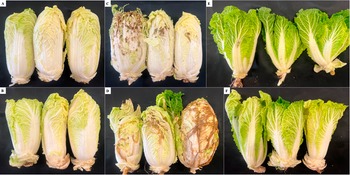
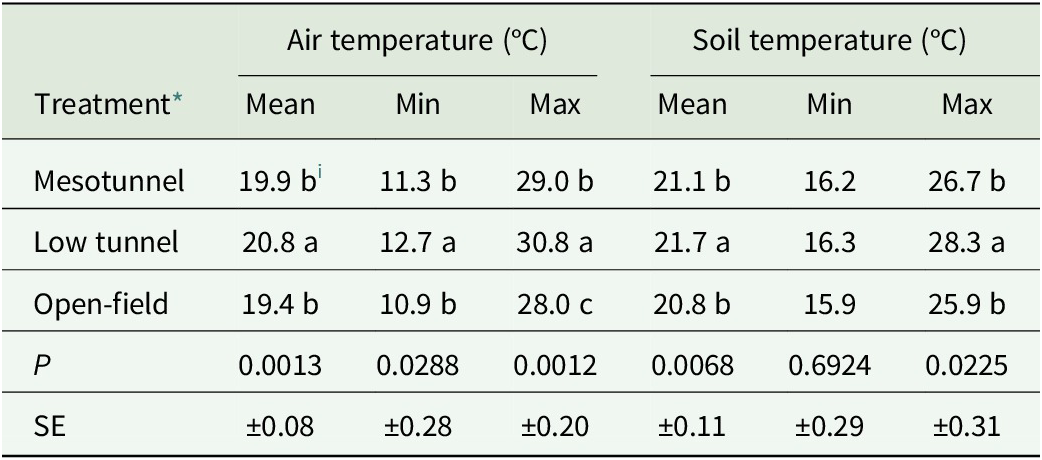

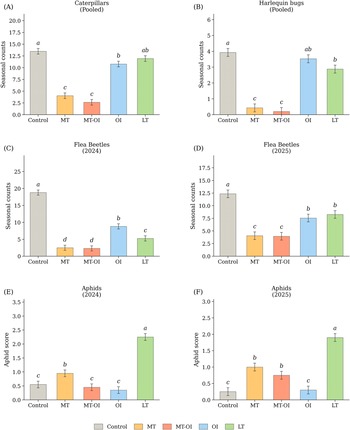
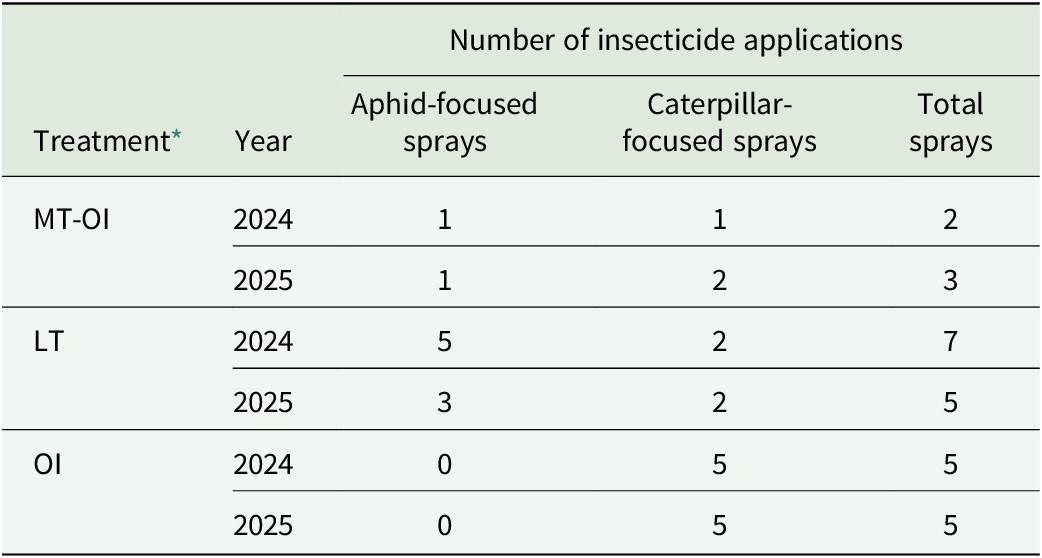


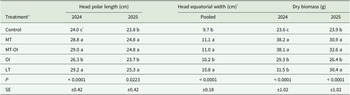


 Open access

