


Breast-feeding is epidemiologically associated with a lower incidence in childhood and adulthood obesity, compared with infant milk formula (IMF) feeding(Reference Arenz, Ruckerl and Koletzko1). Breast-feeding is also associated with lower blood pressure and lower plasma cholesterol levels in adulthood(Reference Owen, Whincup and Odoki2,Reference Owen, Whincup and Gilg3) . The nutritional composition of human milk is mimicked in IMF. However, mimicking fat emulsification is not yet possible. Fat in human milk is dispersed in particles (5 µm diameter) enveloped by a trilayered milk fat globule membrane composed mainly of phospholipids and cholesterol(Reference Gallier, Vocking and Post4). In contrast, standard IMF fat globules are much smaller (0·1 µm diameter) and coated with surface-adhering proteins(Reference Gallier, Vocking and Post4,Reference Armand, Hamosh and Mehta5) . Most likely the physicochemical structure (size and coating) of lipid globules in HM serves a biological purpose(Reference Gallier, Vocking and Post4–Reference Bourlieu and Michalski8). An experimental IMF (eIMF; Nuturis®) was developed comprising large (mode diameter 3–5 µm) phospholipid-coated lipid globules similar in size to those in human milk(Reference Gallier, Vocking and Post4,Reference Oosting, Kegler and Wopereis6) . Feeding mice an eIMF-based diet in early life, compared with standard control IMF (cIMF), resulted in a lower body weight and lower fat mass accumulation when fed a high-fat diet (HFD) challenge into adulthood(Reference Oosting, Kegler and Wopereis6,Reference Oosting, van Vlies and Kegler9,Reference Baars, Oosting and Engels10) . The underlying mechanism of this effect on fat deposition of eIMF exposure has not yet been elucidated but is hypothesised to relate to fat globule size and structure.
To confirm and extend previous observations of eIMF programming effects in mouse pups, we used a similar paradigm and determined the possible long-term effects of early life eIMF exposure on body weight accrual, glucose homoeostasis and liver and adipose tissue attributes. We tested the hypothesis that the size and coating of lipid globules, and not the composition, underlie the initial programming effect observed. We therefore compared the cIMF and eIMF with similar lipid compositions.
Materials and methods
Animals and study design
Experimental procedures were approved by an external independent animal experiment committee (Central Animal Experiments Committee, The Netherlands) and complied with the principles of good laboratory animal care following the European Union directive for the protection of animals used for scientific purposes. The present study was conducted in accordance with the institutional guidelines for the care and use of laboratory animals established by the Ethics Committee for Animal Experimentation of the University of Groningen (NVWA 10500) in full compliance with the European Directive 2010/63/EU for the use of animals for scientific purposes. All animals were kept in the same temperature-controlled room (20–22°C, 45–65 % humidity, lights on 8.00–20.00 hours) in type 1L (360 cm2) polysulfone cages bearing stainless steel wire covers (UNO BV), with wood shaving bedding, Enviro-dri® (TecniLab) and cardboard rolls. All mice were handled by the same researcher. Virgin C57BL/6JOlaHsd breeders (11 male; 22 female) 12 weeks of age (Envigo) were mated(Reference Oosting, Kegler and Wopereis6) in 2F + 1M couples. Males were removed from couples after 2 d. Pregnancy was confirmed by a >2-g increase in body weight after 1 week and occurred at approximately 66 % efficiency. Delivery day was recorded as postnatal day (PN) 0. Pups were randomised between dams, and litters were culled to 4M + 2F on PN2, weaned at PN21 and diets provided as freshly prepared dough balls (40 % water) from PN16 to PN42(Reference Oosting, Kegler and Wopereis6,Reference Oosting, van Vlies and Kegler9) . Randomisation was not performed as the programming diets were visually distinct. Breeders and female offspring were terminated (using CO2) at weaning, in compliance with the AVMA Guidelines for the Euthanasia of Animals. From PN42 onwards, male offspring was pair housed with siblings and fed an HFD (45 % energy as fat, D12451; Research Diets Inc.) and tap water ad libitum until dissection on PN168. Females were not used, as they are protected against HFD-induced metabolic changes(Reference Pettersson, Walden and Carlsson11). Glucose tolerance and calorimetry were assessed at PN133 and PN154, respectively (Fig. 1).
Programming diets
Two IMF powders (Nutricia Cuijk B.V.) were tested. The IMF powders had a similar macro- and micronutrient content (Table 1); both lipid moieties comprised about 50 % vegetable oil and 50 % milk fat (Table 1) and had a similar fatty acid profile (Table 2). cIMF comprised fat globules with a volume mean diameter (D[4,3]) of 0·8 µm, whereas eIMF comprised phospholipid-coated lipid globules with a D[4,3] of 7 µm, explained in more detail elsewhere(Reference Gallier, Vocking and Post4). IMF powders (283 g/kg feed) were supplemented with protein and carbohydrate (Ssniff Spezialdiäten GmbH) to obtain American Institute of Nutrition (AIN)-93G-compliant diets, with a fat moiety derived entirely from IMF(Reference Reeves, Nielsen and Fahey12).
Body composition
Lean and fat mass were quantified by time-domain NMR (LF90II; Bruker Optics), not requiring fasting or anaesthesia.
Glucose, insulin and pyruvate tolerance tests
Mice were fasted 6, 6 and 4 h for the glucose, pyruvate and insulin tolerance tests, respectively. The glucose tolerance test (intraperitoneal (ip) 13·9 µmol glucose/g body weight), insulin tolerance test (ip 0·5 mU insulin/g body weight) and pyruvate tolerance test (ip 28·4 µmol pyruvate/g body weight) were performed as previously described(Reference Cariou, van Harmelen and Duran-Sandoval13).
Calorimetry
Mice were single housed in a Comprehensive Laboratory Animal Monitoring System (Phenomaster; TSE Systems GmbH) at PN154 for 4 d as previously described(Reference Doktorova, Zwarts and Zutphen14).
Termination
Mice were anaesthetised (isoflurane/O2) after a 4-h fasting period (during light phase) and killed by heart puncture; a terminal blood sample was drawn. Liver, epididymal, inguinal, perirenal and interscapular fat were obtained and weighed.
Assays
Plasma was analysed using the V-PLEX Proinflammatory Panel 1 (mouse) kit (K15048D), Mouse Adiponectin kit (K152BXC), Mouse Leptin kit (K152BYC), Mouse MCP-1 Ultra-Sensitive kit (K152AYC), Mouse/Rat Total Active GLP-1, Insulin, Glucagon kit (K15171C) and the Mouse/Rat Resistin kit (K152FNC). Analyses were performed according to the manufacturer’s instructions. Kits were purchased from Meso Scale Diagnostics LLC. Blood glucose was measured using a OneTouch Select Plus (Lifescan Inc.).
Liver fatty acyl chain profiling
Cryogenically crushed liver was homogenised in Potter-Elvehjem tubes. Lipids were trans-methylated, extracted and analysed by GC as previously described(Reference Verkade, Hoving and Muskiet15).
Analysis of gene expression
Gene expression was analysed by quantitative real-time PCR as previously described(Reference Dimova, de Boer and Plantinga16). Cyclophilin and 36b4 were used as housekeeping genes for hepatic and adipose tissue gene expression, respectively. Primer and TaqMan probe sequences are given in online Supplementary Table S1.
Histological analysis
A liver lobe and the left epididymal fat pad were formalin fixed and paraffin embedded, sectioned and haematoxylin and eosin stained. Liver slices were scored blindly for (non-alcoholic) steatosis(Reference Kleiner, Brunt and Van Natta17) and ballooning(Reference Lackner18), and the findings were reviewed by a certified veterinary pathologist (AdB). Liver sections were stained for the proliferation marker Ki-67 as previously described(Reference Sutton, op den Dries and Koster19). Histological scoring of Ki-67 was performed in five separate 40× fields by a single assessor. Binucleation and karyomegaly were assessed as described(Reference Gentric, Maillet and Paradis20). Adipose tissue sections were quantified using Adiposoft(Reference Galarraga, Campion and Munoz-Barrutia21). Adipose tissue was assessed for the presence of inflammatory foci (crown-like structures) as described(Reference Greaves, Chouinard and Ernst22).
Statistical analysis
Statistics were performed using GraphPad Prism 5 (GraphPad Software) and SPSS 23 (SPSS Inc.). Data are plotted as Tukey box and whisker plots unless stated otherwise. Group sizes were calculated(Reference Rosner23) using a relevant and most varied value, previously obtained (plasma IL-6)(Reference Oosting, Kegler and Wopereis6); expected difference 12 ng/l, spread 10 ng/l, α 0·05, β 0·80. Analyses were carried out on all individuals whenever materials were available and no outliers were excluded.
Study design from postnatal days (PN) 0–168 (n 12). GTT, glucose tolerance test; IMF, infant milk formula.
Nutrient composition of the programming diets (postnatal days 16–42) and the high-fat diet (postnatal days 42–168) (Mean values and standard deviations)
IMF, infant milk formula; HFD, high-fat diet.
* All in g/kg.
Fatty acid (FA) composition of the programming diets (postnatal days 16–42)
IMF, infant milk formula.
* All in FA weight%.
Results
Experimental infant milk formula transiently lowers body weight gain on high-fat diet
An initially comparable rapid weight gain (PN42–56) preceded a period (PN63–119) of lower weight gain in eIMF compared with cIMF (–9 % on average, P < 0·05). From PN126 onwards, weights between groups were no longer significantly different (Fig. 2(a)). Fat and lean mass were similar at PN42. At PN72, 105 and 126, fat mass was substantially lower in eIMF compared with cIMF (–10, –14 and –7 %; P < 0·01), and lean mass was slightly lower (–4, –8 and –6 %; P < 0·01; Fig. 2(b)), respectively. Fat percentage and lean percentage were similar at PN42. The average fat percentage (PN42–126) was not significantly lower in eIMF (–5 %; P = 0·07), whereas lean percentage was not significantly higher in eIMF (+3 %; P = 0·08; Fig. 2(c)). To assess whether later life effects were due to differences in growth in early life, we measured body weight from weaning, which was similar between groups, and body composition at PN28 and 35; which was similar. At PN147–154, daily food intake was on average 14 % lower in eIMF (P = 0·08, Fig. 2(f)), correlating with the calculated slope of prior weight gain (PN42–PN147, Spearman’s rank order, r s = 0·6, P < 0·01). Energy expenditure (Fig. 2(g)), and locomotor activity (Fig. 2(h)) were similar. At PN133, the ipGTT time course (Fig. 2(i)) and AUC (2·1 (sd 0·6) v. 1·9 (sd 0·4) m × min) was similar between groups. The ipITT (PN140) and ipPTT (PN147) AUC (1·4 (sd 0·3) v. 1·2 (sd 0·2) and 1·6 (sd 0·5) v. 1·4 (sd 0·4) m × min, respectively) were similar.
Mice programmed with experimental infant milk formula (eIMF; ![]() ) and challenged with a high-fat diet showed a transient lower body weight (BW), lean mass and fat mass compared with animals programmed with control infant milk formula (cIMF;
) and challenged with a high-fat diet showed a transient lower body weight (BW), lean mass and fat mass compared with animals programmed with control infant milk formula (cIMF; ![]() ). BW (a), and fat and lean mass (b) are expressed in absolute weights. The percentages of fat and lean mass (c) are expressed as percentage of BW. Early-life BW (d) and fat and lean mass (e) are expressed in absolute weights. Food intake (f), energy expenditure (g) and locomotor activity (h) were measured three times 24 h from postnatal day 154. Glucose tolerance at postnatal day 133 is shown as AUC (i). (a)–(h): n 11–12; (i): n 10–11. Values are means, with standard deviations represented by vertical bars ((a)–(e), (i)). Data are shown as Tukey box plots and scatter plots ((f)–(h)). * P < 0·05. † P < 0·10. ip, Intraperitoneal.
). BW (a), and fat and lean mass (b) are expressed in absolute weights. The percentages of fat and lean mass (c) are expressed as percentage of BW. Early-life BW (d) and fat and lean mass (e) are expressed in absolute weights. Food intake (f), energy expenditure (g) and locomotor activity (h) were measured three times 24 h from postnatal day 154. Glucose tolerance at postnatal day 133 is shown as AUC (i). (a)–(h): n 11–12; (i): n 10–11. Values are means, with standard deviations represented by vertical bars ((a)–(e), (i)). Data are shown as Tukey box plots and scatter plots ((f)–(h)). * P < 0·05. † P < 0·10. ip, Intraperitoneal.
Experimental infant milk formula-programmed mice have a lower liver weight independent of body weight
Upon dissection at PN168, we noted that eIMF-fed mice had lower liver weights (Fig. 3(a); –25 %; P < 0·05) and a lower liver:body weight ratio (Fig. 3(b); –23 %; P < 0·01). The lower liver weight was not related to TAG levels, which showed moderate variability (Fig. 3(c)). Liver protein (mg/g liver) was higher in the eIMF group (+9 %; P < 0·05), whereas total liver protein was lower in eIMF (mg/liver; –20 %; P < 0·05; Fig. 3(d)). Gene expression markers for hepatic de novo lipogenesis (fatty acid synthase (Fasn), stearoyl-coenzyme A desaturase 1 (Scd1), acetyl-coenzyme A carboxylase-α (Acaca), peroxisome proliferator activated receptor-γ (Pparg)) and fatty acid oxidation (peroxisome proliferator activated receptor-α (Ppara), peroxisome proliferative activated receptor-γ, coactivator-1α (Ppargc1a, also known as Pgc1a), carnitine palmitoyltransferase 1a (Cpt1)) (Fig. 3(e)) were similar. The liver fatty acyl-chain profile (Fig. 3(g)) was similar between groups (Fig. 3(g)).
Mice programmed with experimental infant milk (eIMF; ![]() ) compared with control infant milk formula (cIMF;
) compared with control infant milk formula (cIMF; ![]() ) showed a lower liver weight with a concurrent higher protein content without a shift in fatty acyl chain profile. Dissection was performed at postnatal day 168. Liver weight (a) is expressed as wet weight. The liver:body weight (BW) ratio (b) is expressed as percentage of BW. TAG levels (c) are expressed as per g liver. Liver protein content (d) is expressed as mg per g wet liver tissues. Hepatic mRNA levels (e) were normalised to cyclophilin. Fatty acyl chain profile is expressed as fold change compared with cIMF (g). Liver histology (haematoxylin and eosin; (f)) showed a zonal distribution characterised by central microvesicular steatosis with mild to moderate mid-zonal macrovesicular steatosis. Bar: 250 μm, inset bar: 100 μm. n 11–12. Data are shown as Tukey box plots and scatter plots. * P < 0·05, ** P < 0·01. Fasn, fatty acid synthase; Scd1, stearoyl-coenzyme A desaturase 1; Acaca, acetyl-coenzyme A carboxylase-α; Pparg, peroxisome proliferator activated receptor-γ; Ppara, peroxisome proliferator activated receptor-α; Cpt1, carnitine palmitoyltransferase 1a; MANOVA, multivariate ANOVA.
) showed a lower liver weight with a concurrent higher protein content without a shift in fatty acyl chain profile. Dissection was performed at postnatal day 168. Liver weight (a) is expressed as wet weight. The liver:body weight (BW) ratio (b) is expressed as percentage of BW. TAG levels (c) are expressed as per g liver. Liver protein content (d) is expressed as mg per g wet liver tissues. Hepatic mRNA levels (e) were normalised to cyclophilin. Fatty acyl chain profile is expressed as fold change compared with cIMF (g). Liver histology (haematoxylin and eosin; (f)) showed a zonal distribution characterised by central microvesicular steatosis with mild to moderate mid-zonal macrovesicular steatosis. Bar: 250 μm, inset bar: 100 μm. n 11–12. Data are shown as Tukey box plots and scatter plots. * P < 0·05, ** P < 0·01. Fasn, fatty acid synthase; Scd1, stearoyl-coenzyme A desaturase 1; Acaca, acetyl-coenzyme A carboxylase-α; Pparg, peroxisome proliferator activated receptor-γ; Ppara, peroxisome proliferator activated receptor-α; Cpt1, carnitine palmitoyltransferase 1a; MANOVA, multivariate ANOVA.
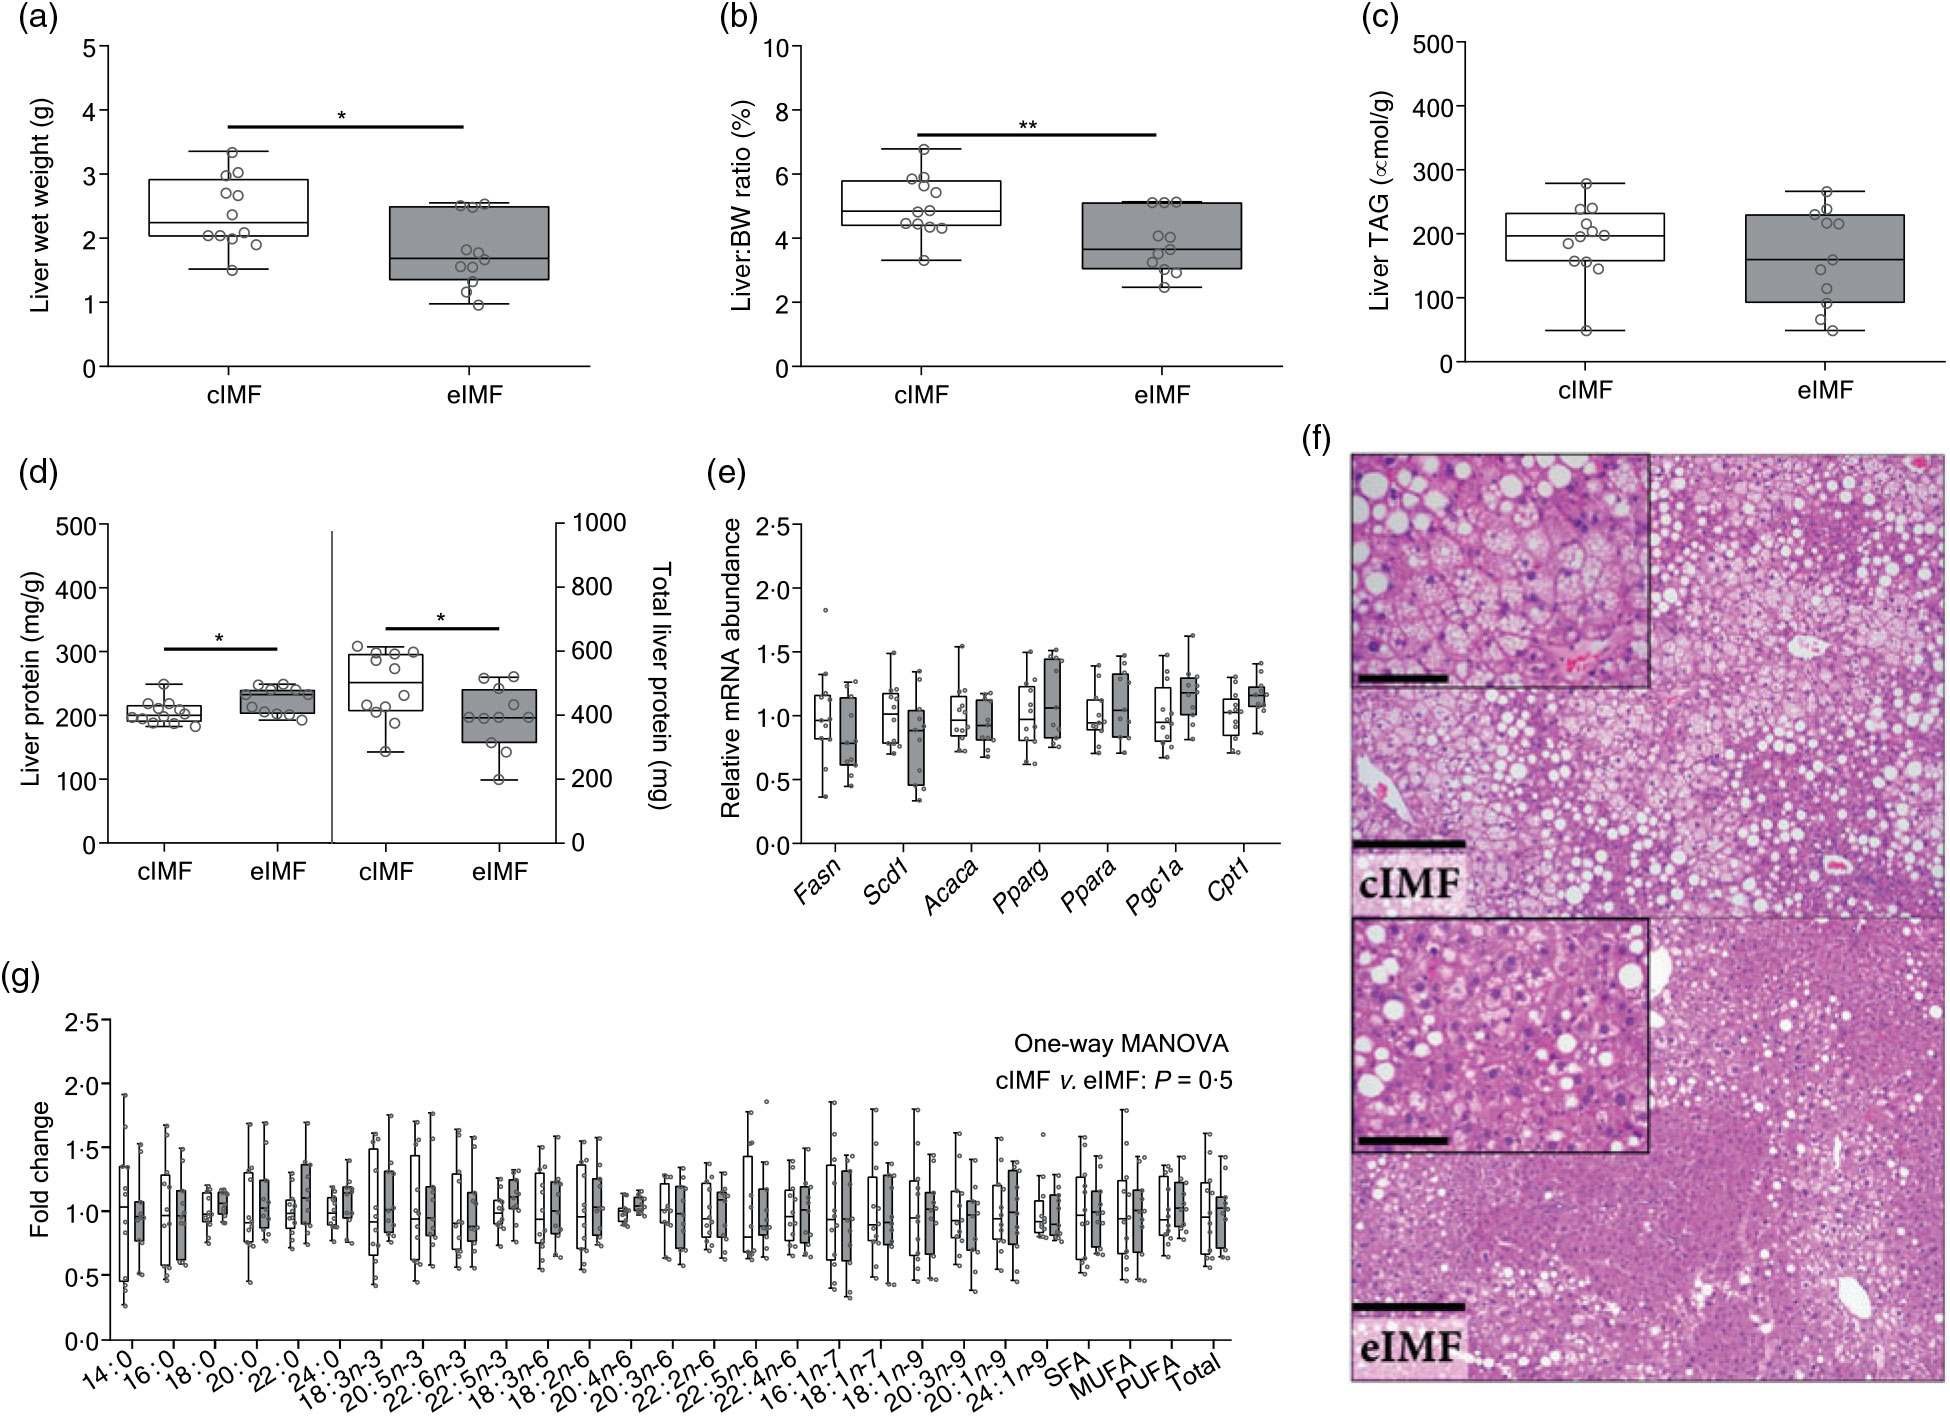
Histological analysis (Fig. 3(h), Table 3) showed that steatosis tended to be higher in cIMF (70 (sd 17) v. 57 (sd 32) %, steatosis grade 2·5 (sd 0·5) v. 2·1 (sd 1·0)), but this difference did not reach statistical significance. Microvesicular steatosis was more frequent than macrovesicular steatosis in both groups and typically showed a zonal distribution characterised by central microvesicular steatosis with mild to moderate mid-zonal (occasionally extending to portal) macrovesicular steatosis. Lobular inflammation and ballooning were similar between groups. Non-alcoholic fatty liver disease (NAFLD) score, mostly influenced by steatosis, tended to be higher in cIMF but did not reach statistical significance. Varying degrees of biliary/oval cell hyperplasia were seen in almost all mice. The mitotic index (Ki-67) was similar between groups. Binuclear hepatocyte counts in the central and mid/portal region were similar between groups. Hepatic fatty acyl chain ratios representing lipid-related enzymatic activity(Reference Kotronen, Seppanen-Laakso and Westerbacka24,Reference Jump25) were similar between groups.
Hepatic histological scoring and fatty acid ratios of mice programmed with a control infant milk formula (IMF) (n 12) or an experimental IMF (n 11) and subsequently challenged to a high-fat diet (Mean values and standard deviations)
Body fat storage was shifted by experimental infant milk formula programming without affecting adult adipokine levels
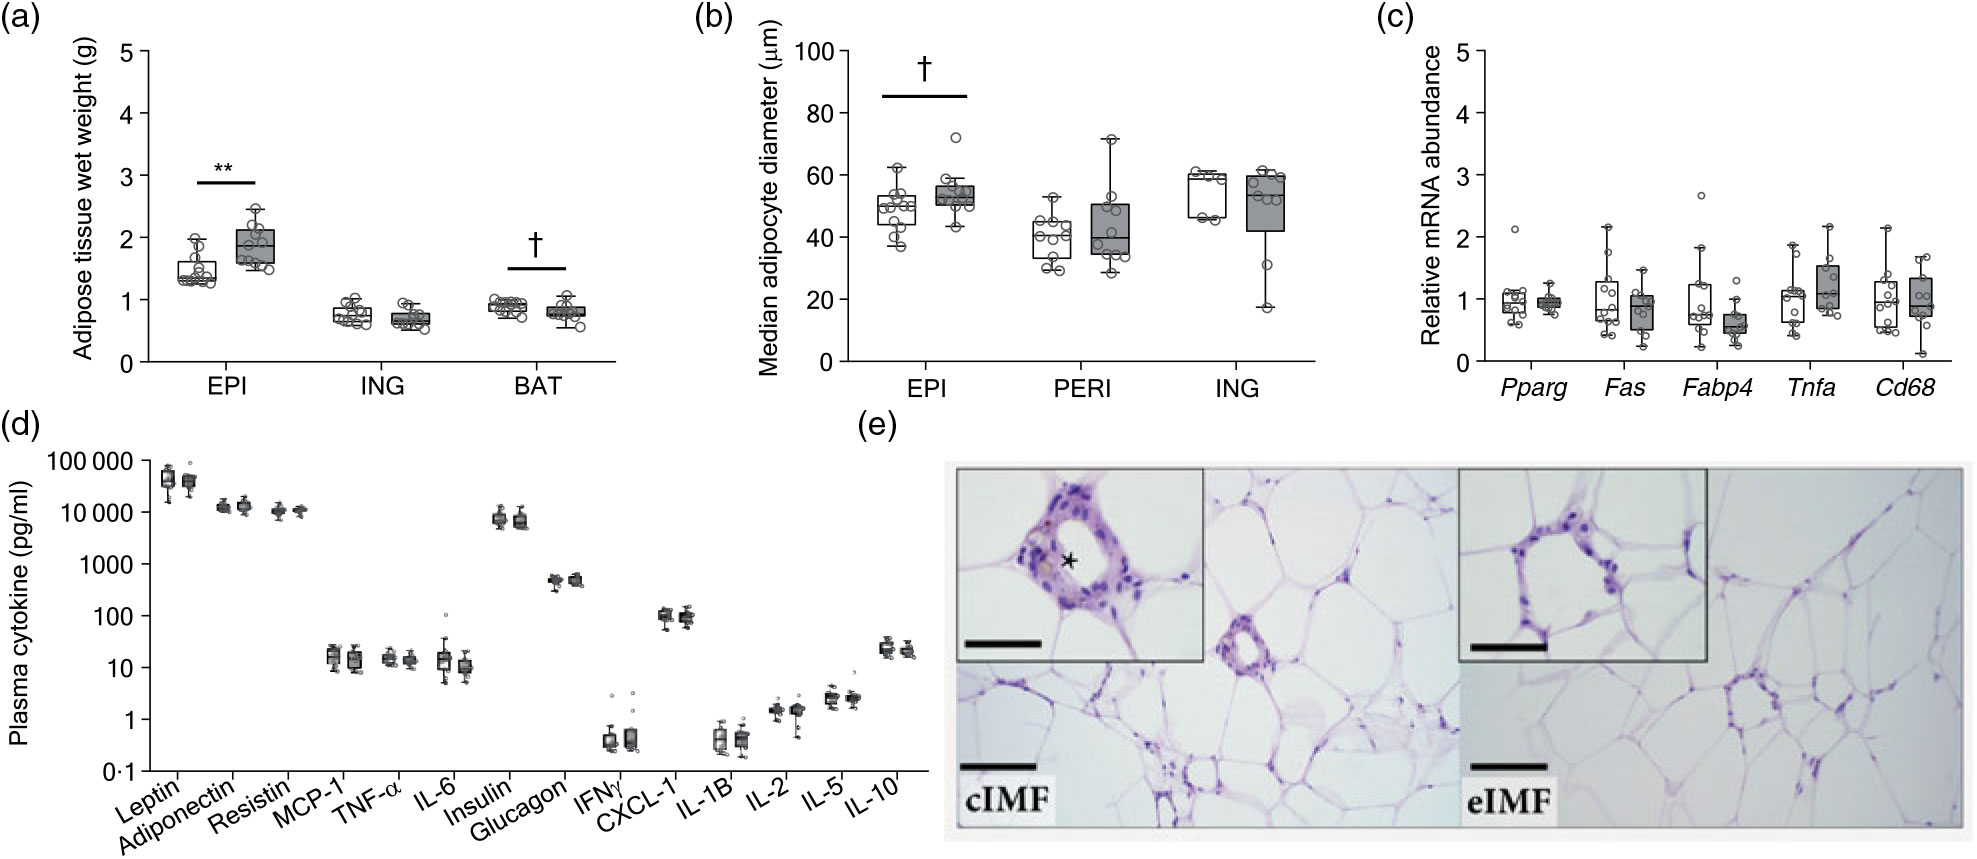
At PN168, we analysed adipose tissue and plasma adipokines (Fig. 4). Epididymal fat mass was larger in eIMF (Fig. 4(a); +27 %; P < 0·01). Inguinal fat mass was similar. Interscapular brown fat mass tended to be smaller in eIMF (–10 %; P = 0·06). The median epididymal adipocyte diameter tended to be higher in eIMF (Fig. 4(b); +11 %; P = 0·08). The median perirenal and inguinal adipocyte diameter (Fig. 4(b)) was comparable. Gene expression of peroxisome proliferator activated receptor-γ (Pparg), fatty acid synthase (Fas), fatty acid binding protein 4 (Fabp4), TNF-α (Tnfa) and Cd68 was similar between groups (Fig. 4(c)). The assessed adipokines (leptin, adiponectin, resistin, monocyte chemoattractant protein-1 (MCP-1), TNF-α and IL-6), glucostatic hormones (insulin and glucagon) and cytokines (interferon-γ (Ifnγ), chemokine (C-X-C motif) ligand 1 (Cxcl-1), IL-1β, IL-2, IL-5 and IL-10) were similar (Fig. 4(d)). Crown-like structures in adipose tissue were seen in all cIMF and in 10/11 eIMF mice but tended to occur more often in cIMF (Fig. 4(e); epididymal 8·0 (sd 8·8) v. 5·0 (sd 6·9); perirenal 9 (sd 10) v. 10 (sd 19)). This difference was not statistically significant.
Mice programmed with experimental infant milk formula (eIMF; ![]() ) compared with control infant milk formula (cIMF;
) compared with control infant milk formula (cIMF; ![]() ) showed a higher visceral adipose tissue weight and adipocyte cell diameter. Epididymal (EPI) visceral, inguinal (ING) subcutaneous and interscapular brown adipose tissue (BAT) (a) are expressed as absolute weights. EPI, perirenal (PERI) and ING (b) adipocyte diameter were calculated (Adiposoft) and expressed as equivalent diameter. The epididymal fat gene expression (c) was normalised to 36b4 and shown as fold change. Plasma adipokines, glucostatic hormones and cytokines are expressed as pg/ml (d). Adipose (epididymal depot) pathology (e) characterised by crown-like structures composed of macrophages and other mixed inflammatory cells with lipofuscin (*) surrounding a necrotic adipocyte, bar: 100 μm, inset bar: 50 μm. Data are shown as Tukey box plots and scatter plots (n 10–12). * P < 0·05, ** P < 0·01. † P < 0·10. Pparg, peroxisome proliferator activated receptor-γ; Fas, fatty acid synthase; Fabp4, fatty acid binding protein 4; Tnfa, TNF-α; Cd68, cluster of differentiation 68; MCP-1, monocyte chemoattractant protein-1; IFNγ, interferon-γ; CXCL-1, chemokine (C-X-C motif) ligand 1.
) showed a higher visceral adipose tissue weight and adipocyte cell diameter. Epididymal (EPI) visceral, inguinal (ING) subcutaneous and interscapular brown adipose tissue (BAT) (a) are expressed as absolute weights. EPI, perirenal (PERI) and ING (b) adipocyte diameter were calculated (Adiposoft) and expressed as equivalent diameter. The epididymal fat gene expression (c) was normalised to 36b4 and shown as fold change. Plasma adipokines, glucostatic hormones and cytokines are expressed as pg/ml (d). Adipose (epididymal depot) pathology (e) characterised by crown-like structures composed of macrophages and other mixed inflammatory cells with lipofuscin (*) surrounding a necrotic adipocyte, bar: 100 μm, inset bar: 50 μm. Data are shown as Tukey box plots and scatter plots (n 10–12). * P < 0·05, ** P < 0·01. † P < 0·10. Pparg, peroxisome proliferator activated receptor-γ; Fas, fatty acid synthase; Fabp4, fatty acid binding protein 4; Tnfa, TNF-α; Cd68, cluster of differentiation 68; MCP-1, monocyte chemoattractant protein-1; IFNγ, interferon-γ; CXCL-1, chemokine (C-X-C motif) ligand 1.
Discussion
In the present work, we studied the long-term effects of early life exposure (PN16–42) to eIMF v. cIMF on body weight and body compositional development into adulthood when animals were continuously challenged to a, HFD as well as its effects on size and function of liver and adipose tissues (Fig. 1). Previously, eIMF with a different lipid composition was found to program mice for a lower body fat accumulation when they were challenged with an HFD up to PN126(Reference Oosting, Kegler and Wopereis6). In the present study, IMF had a different lipid composition and HFD exposure was extended to PN168. Similar programming effects were seen up to PN126, after which differences in body weight and composition disappeared upon continued HFD exposure (Fig. 2). Interestingly, food intake, despite high variability, tended to be lower at PN154 in eIMF-fed mice (Fig. 2), strongly correlating with the slope of prior weight gain. This suggests that the differences in body weight can, at least in part, be attributed to differences in food intake. The transient effects observed may indicate that the programming response, that is, the initial lower fat accumulation in adipose stores, can be overruled by a strong and persistent dietary challenge. In addition, our study suggests these programming effects, due to early life eIMF exposure, occurred regardless of the lipid composition of the fat globules and is rather caused by the physicochemical structure of the lipids, that is, globule size and phospholipid coating(Reference Baars, Oosting and Engels10). In humans and mammals, the amount of lipids in (mature) milk, despite highly variable diets, is remarkably stable(Reference Finley, Lonnerdal, Dewey and Grivetti26,Reference Kelishadi, Hadi and Iranpour27) . The size of milk fat globules, as well as the milk TAG content, seems to be tightly regulated and species specific(Reference Gantner, Mijić and Baban28) and greatly impacts the absorption kinetics of breast milk lipids(Reference Vurma, DeMichele and Tso29,Reference Baumgartner, van de Heijning, Acton and Mensink30) . Testing eIMF (large, phospholipid-coated fat globules) v. cIMF (small, uncoated fat globules) in adult men resulted in a different postprandial response upon a single bolus intake: an earlier postprandial glucose and insulin time to peak, an earlier NEFA time to nadir and a later cholecystokinin time course(Reference Baumgartner, van de Heijning, Acton and Mensink30). We hence speculate that fat globule size and phospholipid coating program metabolic and tissue development induced by differential lipid uptake kinetics or postabsorptive lipid trafficking or tissue partitioning. Lipid uptake kinetics of eIMF, compared with cIMF, are likely to be more comparable to breast milk.
Early life feeding with eIMF compared with cIMF lowered liver weight in later life, independent of body weight (Fig. 3). The difference was not explained by mitotic index or the degree of polyploidisation. Hepatic TAG content had moderate variability without clear correlation with other parameters. Possibly the early life diet primed hepatic tissue for a different response to an HFD challenge, resulting in a differential tissue growth. It is also possible, however, that the transient difference in body weight (or adipose tissue development) triggers a difference in liver size. Previously, a non-significantly higher liver weight had been seen in cIMF compared with eIMF and to an unchallenged control group(Reference Oosting, van Vlies and Kegler9). Additionally, a higher liver weight was seen upon early life feeding with an IMF containing small compared with large lipid globules and challenging with an HFD (10). We hypothesise that PN liver development was changed due to a difference in post-absorptive lipid handling and trafficking. As mentioned earlier, eIMF is more rapidly absorbed compared with cIMF in adult men(Reference Baumgartner, van de Heijning, Acton and Mensink30). In addition, a gavage of breast milk, compared with standard formula, leads to a more rapid chylomicron (CM) production and a more rapid absorption of palmitic, arachidonic and DHA in adult rats(Reference Vurma, DeMichele and Tso29). Rapid absorption of protein-coated fat results in three-fold larger CM diameter(Reference Vors, Pineau and Gabert31). However, we believe rapid lipid absorption only leads to larger CM when enteral phospholipid supply is limited, necessitating higher volume:surface area ratios(Reference Werner, Havinga and Perton32). In contrast, CM diameter is lowered by biliary phospholipids(Reference Werner, Havinga and Perton32). It is possible that breast milk, and likewise eIMF, is rapidly absorbed and produces smaller CM compared with cIMF due to the dietary phospholipids provided with breast milk and eIMF. The observation that an IMF with large globules but lacking phospholipids does not program mice for less fat accrual in later life(Reference Baars, Oosting and Engels10), adding weight to this notion. CM size and number affect the plasma half-life, as smaller particles have a larger relative surface area available to enzymes(Reference Goldberg33,Reference Martins, Mortimer, Miller and Redgrave34) , and are more quickly removed from the plasma via liver sieving(Reference Braet and Wisse35). CM produced upon eIMF or human milk ingestion are expected to have a different fractional clearance rate compared with CM upon cIMF ingestion. It is tempting to speculate that a more rapid absorption plus utilisation, opposed to storage, of breast milk and eIMF-derived lipids in early life programs metabolism and fat accumulation capacity towards an advantageous trait for later life health.
The effect on fat pad weights and adipocyte diameter was independent of body weight and composition (Fig. 4). Previous studies showed that at PN98 the epididymal fat pad was smaller in eIMF-fed mice(Reference Oosting, van Vlies and Kegler9,Reference Baars, Oosting and Engels10) , whereas this difference between test groups had disappeared at PN126(Reference Oosting, Kegler and Wopereis6). We observed a higher epididymal fat mass in eIMF at PN168, indicating a differential fat distribution in eIMF v. cIMF, as the perirenal and inguinal fat pads were similar in mass. Counterintuitively, the larger epididymal fat pads seen in eIMF did not result in lower levels of adiponectin but did result in higher levels of inflammatory markers (TNF-α, IL-6), MCP-1 or resistin (Fig. 4) as typically seen with larger visceral adipose tissue(Reference Hamdy, Porramatikul and Al-Ozairi36). Interestingly, we found no effect on glucose metabolism and homoeostasis (Fig. 2(i)). Previously, eIMF-fed mice had lower plasma leptin, resistin, glucose and homoeostatic model assessment of insulin resistance at PN126(6), likely related to the lower fat mass. A lower fat accrual rate, transiently seen in eIMF, is advantageous to metabolic health. However, given the observed minor effects on adipose tissue at PN168, we think it is unlikely that adipose tissue initiates the programming effect and merely is a logical consequence and trait of the programmed phenotype.
Conclusion
The present study shows that feeding a PN diet containing large phospholipid-coated lipid globules has transient effects on body fat accrual during prolonged exposure to HFD. These effects are limited in strength and robustness and can be overruled by (too) strong environmental features, such as continued HFD feeding. Our findings indicate the robustness and the limits of early life programming due to eIMF exposure in the mouse model used to study. The observed programming effects are hypothesised to be due to a difference in fat absorption and/or post-absorptive handling and trafficking in the body.
Acknowledgements
We thank Eline M. van der Beek for valuable suggestions for writing the manuscript, and Ingrid A. Martini for excellent assistance with fatty acyl chain profiling.
Support for the present study has been obtained from Danone Nutricia Research.
B. J. M. v. d. H., H. J. V. and O. R. formulated the research question and designed the study. O.R. and A.J. carried out the study. A. d. B. and O. R. analysed the data. H. J. V., F. K., B. J. M. v. d. H. and O. R. wrote the paper.
B. J. M. v. d. H. is employed by Danone Nutricia Research. H. J. V. is a consultant for Danone Nutricia Research outside the submitted work, for which his institution is compensated financially.
Supplementary material
To view supplementary material for this article, please visit https://doi.org/10.1017/S0007114519002083


