


Policy Significance Statement
This research aims to enhance and review the application of deep learning (DL) methods for modeling urban sprawl indicators. It highlights the growing importance and potential of DL in simulating and predicting the complex spatial patterns of urban expansion, offering promising tools for more sustainable and data-driven urban planning strategies. Despite the effectiveness of these methods, significant challenges remain in terms of data quality, model complexity, and integration with conventional urban planning frameworks. Addressing these challenges can lead to improved decision-making in controlling urban sprawl.
1. Introduction
Global urbanization is a continuous phenomenon that offers opportunities and challenges for sustainable urban planning and development (Belinga and El Haziti, Reference Belinga and El Haziti2023). The rapid and sometimes uncontrollably expanding metropolitan regions known as “urban sprawl” have acquired attention as a significant issue influencing infrastructure development, land use/cover patterns, and environmental/climate sustainability as cities grow (Hua and Gani, Reference Hua and Gani2023). This begs the question, just what is urban sprawl exactly? Put otherwise, what are its features so that anyone can characterize, simulate, forecast, and its indicators to identify better trade-offs to direct urban growth? Urban sprawl has a reputation for being a complicated topic that is hard to generalize about among writers (Tekouabou et al., Reference Tekouabou, Diop, Azmi, Jaligot and Chenal2022b). Even the precise definition of urban sprawl and the extent of its characteristics remain up for debate, despite the abundance of works in the literature that address this problem. In general, sophisticated tools and approaches that can forecast and simulate the spatial growth of metropolitan regions are needed to address such complex dynamics of urban sprawl (Tekouabou et al., Reference Tekouabou, Diop, Azmi and Chenal2023a). As a result, numerous studies have made an effort to offer conceptual as well as empirical models for trying and describing this phenomenon, which is common for a large number of world cities (Belinga and El Haziti, Reference Belinga and El Haziti2023). Machine learning (ML) techniques, particularly DL-based approaches, have emerged as the most promising among the wide range of methodologies tried to define urban sprawl indicators in recent years (Belinga and El Haziti, Reference Belinga and El Haziti2023; Tekouabou et al., Reference Tekouabou, Diop, Azmi, Jaligot and Chenal2022b). Nevertheless, given the observed research tendency, not much has been done to create a cutting-edge conceptual framework to direct the plethora of future work that is anticipated.
Globally, ML-based methods have gained in importance in recent years, and their application has been extended to a wider variety of fields (Tekouabou et al., Reference Tekouabou, Diop, Azmi, Jaligot and Chenal2022b, Reference Tekouabou, Diop, Azmi and Chenal2023a). Particularly, DL-based methods have emerged as powerful tools in various fields, including computer vision (Voulodimos et al., Reference Voulodimos, Doulamis, Doulamis and Protopapadakis2018; Wu et al., Reference Wu, Liu, Li, Jin and Li2017), natural language processing (Mehrish et al., Reference Mehrish, Majumder, Bharadwaj, Mihalcea and Poria2023), and remote sensing (Adegun et al., Reference Adegun, Viriri and Tapamo2023; Mahyoub et al., Reference Mahyoub, Rhinane, Mansour and Fadil2022). Moreover, DL algorithms are effective in fitting non-linear patterns directly from complex data. The data used to model the behaviour of urban sprawl indicators is often complex, combining spatialized satellite image data, institutional data, and statistical surveys. This DL efficiency is often attributed to three factors: the availability of data in exponentially increasing quantities, the ever-increasing processing capacities of machines, and finally the emergence of new efficient algorithms. The most interesting example to emerge in recent years is the use of transformer-type models based on the attention mechanism, which has already been used to model certain indicators of urban sprawl (Tekouabou et al., Reference Tekouabou, Gherghina, Kameni, Filali and Gartoumi2023b). Thus, the main research questions that are raised here are: a) How are DL-based methods used to simulate or predict urban sprawl features? b) Which algorithms are currently involved to fit which type of features? c) What are the most prominent algorithms for future work from a comparison of their strengths and weaknesses to fit urban sprawl features? For well answering this question, we delve into the evolving landscape of urban sprawl modelling and explore the integration of DL methods within this domain. We aim to analyze the state-of-the-art techniques, their effectiveness and their implications for urban planning and policy formulation. By synthesizing a range of studies, we should provide insights into the suitability of DL approaches for capturing the complex interactions between socioeconomic factors, density, land use/cover changes, layout/landscape, and environmental impacts that contribute to urban sprawl.
In the remainder of this paper, we defined the issue of urban sprawl, categorizing its main features, and discussing its significance as its multifaceted challenges and implications for sustainable urban development. Subsequently, we delve into the various ways in which DL techniques have been adapted and applied to simulate or predict urban sprawl. We present a critical assessment of these methods, discussing their strengths, limitations, and potential synergies with traditional simulation techniques. Finally, we identify gaps in the literature and propose future research directions, aiming to contribute to the ongoing evolution of urban planning strategies and policies. Section 2 will present the search method and taxonomy of DL methods for urban sprawl. Section 3 will clarify the concept of urban sprawl and its various challenges. Section 4 will then look at the techniques used in the literature to predict urban sprawl, spotlighting machine learning and deep learning techniques. Finally, Section 5 will discuss the potential of deep learning for predicting urban sprawl before concluding this work in Section 6.
2. Taxonomy and literature search method
2.1. DL taxonomy for urban sprawl
The uses of DL algorithms for modelling urban sprawl indicators have evolved sufficiently in recent years to overcome the challenges of this phenomenon. Mastering the DL implementation process to model a given urban sprawl indicator requires knowledge of several elements. The different categories of these elements constitute the taxonomy of DL methods for urban sprawl applications. Figure 1 shows the diagram that summarizes this taxonomy and more specifically the domains involved.
Taxonomy of DL methods for urban sprawl applications.

The taxonomy of DL methods for urban sprawl applications in the selected study area (city) consists of four categories of elements including features, data source, DL methods (also known as DL models or algorithms), and targeted indicators. The urban sprawl features category groups together the various dependent variables that will be used to model the indicator targeted in the indicator category. Note that a target indicator in one problem may play the role of an input feature in another, and vice versa. Once the input features and target indicators have been defined for a given study, the data source category describes how the data has been collected to be more reliable. The fourth element of the taxonomy and the most important for this paper are types of DL algorithms that have been applied or are potentially applicable. In the following parts, we briefly go into more information about each issue.
2.2. Literature search method
To establish a knowledge base on a topic and locate articles to serve as a data source for additional examination, the literature search outlined in Figure 2 was implemented. The main stages in the literature search process are summarised in Figure 2 below according to preferred reporting items for systematic reviews and meta-analyses (PRISMA) methodology for systematic literature review (Mateo, Reference Mateo2020; Rethlefsen et al., Reference Rethlefsen, Kirtley, Waffenschmidt, Ayala, Moher, Page and Koffel2021).
Flow chart describing the different stages of our literature research process.

The first step of the research consisted of introducing the following keywords: “urban sprawl” OR “urban expansion” OR “urban growth” AND “deep learning.” Similar to other scientific database search queries, the review paper/book types, letters, or non-English documents were excluded using EXCLUDE instruction (Tékouabou et al., Reference Tékouabou, Chenal, Azmi, Toulni, Diop and Nikiforova2022a). So, the final research querapplications in urban sprawl feature predictiony in the Scopus database was structured as follows: TITLE-ABS-KEY ((“urban sprawl” OR “urban growth” OR “urban expansion”) AND “deep learning”) AND (EXCLUDE (DOCTYPE, “re”) OR EXCLUDE (DOCTYPE, “cr”) OR EXCLUDE (DOCTYPE, “er”) OR EXCLUDE (DOCTYPE, “sh”)) AND (EXCLUDE (LANGUAGE, “Chinese”) OR EXCLUDE (LANGUAGE, “Korean”)).
2.3. Literature outcome and filtering
After removing reviews, conference reviews, and letters, we obtained 281 raw articles and 183 after the initial filtering processes. The most pertinent publications—those discussing deep learning applications in urban sprawl feature prediction—were retained after key data about the chosen papers were obtained as .csv files and filtered (Tékouabou et al., Reference Tékouabou, Chenal, Azmi, Toulni, Diop and Nikiforova2022a, Reference Tekouabou, Diop, Azmi and Chenal2023a). Following a series of keyword-based filterings, data-analysis strategies, and topical mining with the ORANGE tool, we adjusted the search parameters to obtain relevant publications that either directly or indirectly reference the description and, consequently, the source of the related urban sprawl data (Tekouabou et al., Reference Tekouabou, Diop, Azmi, Jaligot and Chenal2022b). A few related articles that were not saved from the earlier stages but were thought to be pertinent were manually inserted. Finally, the 57 most relevant publications were crucial to the analyses in the following sections. The list of these papers is provided as Supplementary Material in an Excel file.
3. Analysis of urban Sprawl key features and Challenges
An effective study of urban sprawl requires a trans- and multi-disciplinary approach, mainly combining the fields of urban planning and computer modelling through deep learning methods specifically. Therefore, it is more than necessary first to clarify the key concepts consisting of urban sprawl, its characteristics, its manifestations, and the challenges it raises. This will be briefly addressed in the remainder of this section.
3.1. Terminology and salient characteristics
The uncontrolled and frequently unplanned growth or expansion of urban areas into neighbouring rural or undeveloped territory is referred to as urban sprawl (Sarkar and Chouhan, Reference Sarkar and Chouhan2019). The phenomenon of a town or urban area being defined by its outward expansion results in low-density development, wasteful use of land, and dispersion of both infrastructure and population (Baqa et al., Reference Baqa, Chen, Lu, Qureshi, Tariq, Wang, Jing, Hamza and Li2021). The patterns of land use, infrastructure, transportation, the environment and the general standard of living in an area can all be significantly impacted by urban sprawl. (Prayitno et al., Reference Prayitno, Sari, Hasyim and SW2020; Aithal et al., Reference Aithal, Vinay and Ramachandra2018). Hence figure 3, which best describes the key features’ categories that include: density, land use/cover, infrastructures, landscape/layout, environment and finally socio-economic and development.
Key features of urban sprawl categorised according (Tekouabou et al., Reference Tekouabou, Diop, Azmi, Jaligot and Chenal2022b).

3.1.1. Density category of features
Density indicators in a sprawling city are crucial for assessing urban planning. One of the common features of this category is population density, measured by the number of inhabitants per unit area, which influences the pressure on infrastructure, public services, and the environment (Tekouabou et al., Reference Tekouabou, Diop, Azmi, Jaligot and Chenal2022b). Higher density can promote efficient land use and encourage sustainable mobility by reducing travel distances (Baqa et al., Reference Baqa, Chen, Lu, Qureshi, Tariq, Wang, Jing, Hamza and Li2021). However, excessive density can lead to problems of congestion, access to green spaces, and quality of life. Urban sprawl leads to the creation of low-density residential and commercial areas, often characterized by spacious plots, large setbacks, and a significant distance between buildings. This contributes to the inefficient utilization of land and resources (Aithal et al., Reference Aithal, Vinay and Ramachandra2018; Dadashpoor and Salarian, Reference Dadashpoor and Salarian2020). Therefore, balancing density and quality of life is essential for sustainable urban planning in a sprawling city.
3.1.2. Land use/cover category of features
Land use and cover features play a crucial role in characterizing the urban sprawl phenomenon (Al-Najjar et al., Reference Al-Najjar, Kalantar, Pradhan, Saeidi, Halin, Ueda and Mansor2019). Low-density development leads to extensive land consumption for residential and commercial purposes (Al-Dousari et al., Reference Al-Dousari, Mishra and Singh2023). This results in the conversion of natural landscapes into built environments, often contributing to the loss of green spaces and agricultural land (Tope-Ajayi et al., Reference Tope-Ajayi, Adedeji, Adeofun and Awokola2016; Prayitno et al., Reference Prayitno, Sari, Hasyim and SW2020). As cities expand outward, agricultural lands, open spaces, and natural habitats are often converted into developed areas. This can lead to the loss of productive farmland, disruption of ecosystems, and reduced biodiversity (Sarkar and Chouhan, Reference Sarkar and Chouhan2019; Kundu et al., Reference Kundu, Halder and Mandal2020; Osman et al., Reference Osman, Shaw and Kenawy2018). The dominance of impervious surfaces such as roads and buildings negatively impacts water runoff patterns and exacerbates issues related to urban heat islands. Additionally, zoning practices that segregate land uses can contribute to the spread of urban sprawl. Single-use zoning for example can separate residential, commercial, and industrial areas necessitating longer travel distances for daily activities (Osman et al., Reference Osman, Shaw and Kenawy2018). Urban sprawl’s land use and cover features highlight the transformation of landscapes, emphasizing the need for sustainable planning that compromises development with environmental conservation and community well-being.
3.1.3. Infrastructure category of features
The characteristics associated with infrastructure are very important in describing the concept of urban sprawl (Ahmadi et al., Reference Ahmadi, Khalesi and Golroo2022). The sprawling city requires an extensive road network to interconnect the entire city due to its low density (Tekouabou et al., Reference Tekouabou, Diop, Azmi, Jaligot and Chenal2022b). Extending infrastructure such as roads, utilities, and public services to low-density areas requires more resources and funding. This can strain municipal budgets and lead to higher costs for taxpayers (Sarkar and Chouhan, Reference Sarkar and Chouhan2019; Dinda et al., Reference Dinda, Das, Chatterjee and Ghosh2019). Moreover, sprawling development often relies heavily on private automobiles as the primary mode of transportation. Longer distances between destinations make walking, cycling, and public transportation less viable options leading to increased traffic congestion, air pollution, and energy consumption (Abudu et al., Reference Abudu, Echima and Andogah2019). Better yet, urban sprawl often leads to the expansion of suburbs where residents live at a considerable distance from their workplaces. This results in longer commutes, increased traffic congestion, and associated stress and time loss (Sarkar and Chouhan, Reference Sarkar and Chouhan2019; Hua and Gani, Reference Hua and Gani2023; Abudu et al., Reference Abudu, Echima and Andogah2019; Pokojska, Reference Pokojska2019).
3.1.4. Layout/landscape category of features
The layout and landscape category of features play pivotal roles in characterizing urban sprawl. Indeed, the fact of exhibiting low-density development is characterized by expansive areas of residential housing and commercial zones with limited vertical structures (Tope-Ajayi et al., Reference Tope-Ajayi, Adedeji, Adeofun and Awokola2016; Prayitno et al., Reference Prayitno, Sari, Hasyim and SW2020). This decentralized layout leads to increased reliance on automobiles, contributing to longer commuting distances, and traffic congestion. Landscape features are characterized by fragmented green spaces, reduced walkability, and limited public areas. The lack of cohesive planning may result in disconnected neighbourhoods hindering community engagement. Urban sprawl can result in a lack of visual coherence as different architectural styles and developments are spread across the landscape without a consistent design or planning approach (Jafari et al., Reference Jafari, Majedi, Monavari, Alesheikh and Kheirkhah Zarkesh2016).
3.1.5. Environmental category of features
Environmental features of urban sprawl include increased impervious surfaces like roads and buildings, disrupting natural water drainage, and contributing to urban heat islands (Purswani et al., Reference Purswani, Verma, Jayakumar, Khan and Pathak2022). Deforestation and habitat fragmentation occur as sprawling development consumes green spaces. Air and water quality may decline due to higher vehicle use and limited green buffers (Hua and Gani, Reference Hua and Gani2023; Kundu et al., Reference Kundu, Halder and Mandal2020). Loss of biodiversity and disruption to ecosystems are common in sprawling areas. Moreover, increased energy consumption and carbon emissions result from longer commuting distances. The increased reliance on automobiles and the reduction of natural green spaces contribute to higher carbon emissions, air pollution, and the loss of natural habitats. This can have adverse effects on air and water quality as well as overall environmental health (Purswani et al., Reference Purswani, Verma, Jayakumar, Khan and Pathak2022; Hua and Gani, Reference Hua and Gani2023; Kundu et al., Reference Kundu, Halder and Mandal2020).
3.1.6. Socio-economic and development category of features
Urban sprawl’s socio-economic features include increased inequalities due to low-density development leading to segregated neighbourhoods (Shao et al., Reference Shao, Sumari, Portnov, Ujoh, Musakwa and Mandela2021; Tekouabou et al., Reference Tekouabou, Diop, Azmi, Jaligot and Chenal2022b). Limited access to essential services, education, and job opportunities disproportionately affects marginalized populations, particularly those without private vehicle access (Warih et al., Reference Warih, Rindarjono and Nurhadi2020). Sprawling development reduces community interaction contributing to social isolation and disconnectedness (Shao et al., Reference Shao, Sumari, Portnov, Ujoh, Musakwa and Mandela2021). Public health is impacted by limited access to walkable areas and healthcare facilities resulting in issues like sedentary lifestyles and obesity (Dardier et al., Reference Dardier, Christie, Simos, Roué Le Gall, Cantoreggi, Tabbone, Mallet and Jabot2023). Traffic congestion increases due to longer commuting distances impacting transportation efficiency. Additionally, urban sprawl results in fragmented and discontinuous urban development, with isolated pockets of development spread across a landscape. This can make infrastructure provision, service delivery, and efficient land use planning more challenging (Dadashpoor and Salarian, Reference Dadashpoor and Salarian2020).
3.2. Outlook from the literature review analysis
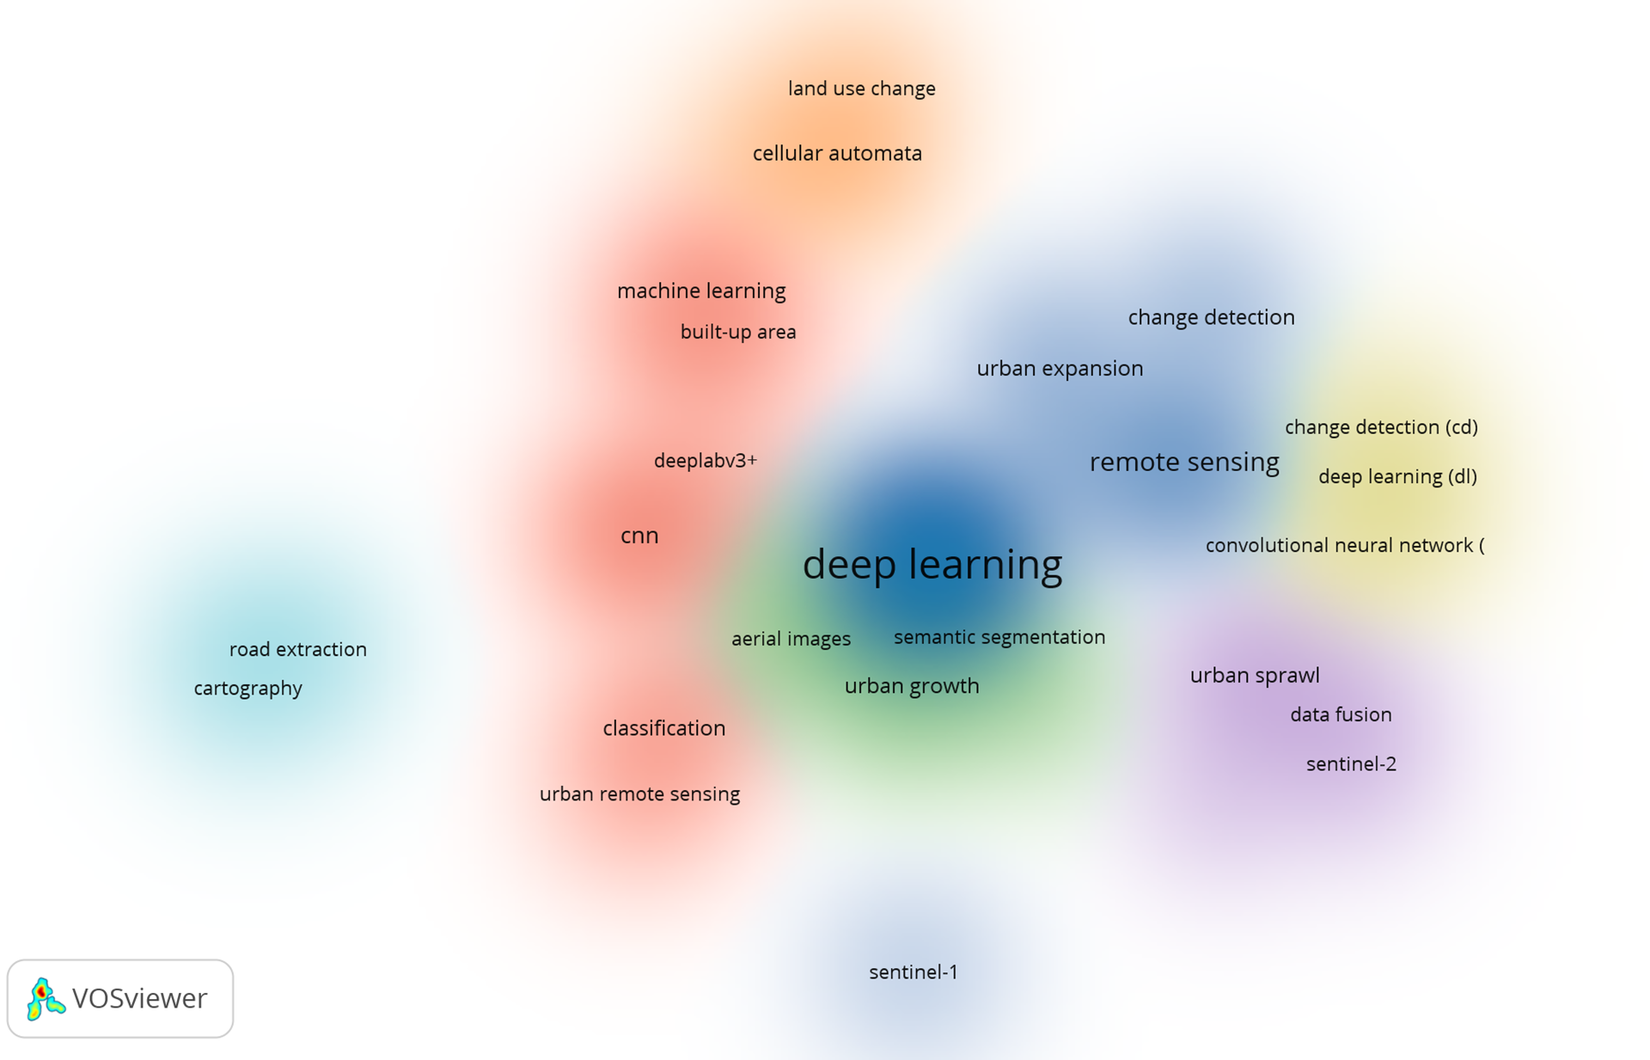
Usually, a literature review involves two major categories of analysis: bibliometric analysis and thematic trends (Tekouabou et al., Reference Tekouabou, Gherghina, Kameni, Filali and Gartoumi2023b). The bibliometric analysis is provided in the Appendix 1, and we will confine ourselves to analysing the thematic trends in this section (Tekouabou et al., Reference Tekouabou, Diop, Azmi and Chenal2023a). To highlight thematic trends, we used two types of visual analysis based on recent text mining techniques on Orange data mining (word cloud visualization in Figure 4) and Vosviewer (co-occurrence visualization in Figures 5 and 6).
Word cloud of keywords.

Network visualisation of the co-occurrence of the keywords plotted by VOSviewer.

Density visualisation of the co-occurrence of the keywords plotted by VOSviewer.
The illustration of Figure 4 shows the word cloud from a corpus consisting of the title, abstract and keywords of the most relevant papers. This figure was generated by applying text mining to the Orange data mining tool. On this figure, we can see that the words associated with the first rank of our searches are much better weighted (for example deep, learning, urban, growth, expansion, etc.).
Figures 4 and 6 show the visualization of the co-occurrence of keywords in the most relevant documents selected for the study by network and density, respectively. With a minimum threshold of two occurrences, there are seven main clusters of topical trends, each consisting of:
-
• Cluster 1: Built-up area, classification, CNN, deeplabv3+, machine learning, urban land cover, and urban remote sensing.
-
• Cluster 2: Aerial images, building extraction, semantic segmentation, transfer learning, urban growth, and urbanization.
-
• Cluster 3: Change detection, convolutional neural network, deep learning, remote sensing, sentinel-1, and urban expansion.
-
• Cluster 4: Change detection (cd), convolutional neural network, deep learning (dl), and object detection.
-
• Cluster 5: Data fusion, sentinel-2, urban sprawl, and Yangze River economic.
-
• Cluster 6: Cartography, historical maps, and road extraction.
-
• Cluster 7: Cellular automata, land use change, and urban expansion simulation.
The overall insight from the co-occurrence could be summarized in three means points: First of all, The thematic focus of all these clusters strongly emphasises remote sensing, CNNs, and change detection techniques to analyze urban sprawl. There is also a focus on applying deep learning to diverse data types (aerial, satellite, and historical) to model and predict urban expansion and land use changes. Secondly, the methodological insights, the common thread across clusters is the use of CNNs and deep learning architectures for classification, segmentation, and change detection tasks. This highlights the growing importance of AI techniques in urban growth prediction, where different types of imagery (optical, radar) and historical data are fused. The third point is the applications with a focus on case studies like the Yangtze River Economic Zone reflect the real-world application of these methods in regions experiencing rapid urbanization, suggesting practical policy implications for managing urban sprawl.
Globally, all these clusters collectively point to a multi-disciplinary approach combining AI thanks to deep learning methods, remote sensing, and spatial modelling to predict and understand urban growth patterns. However, the absence of certain key themes from this analysis shows that there are still many challenges to be met, offering gaps in the application of deep learning to simulate urban sprawl indicators.
3.3. Urban sprawl challenges
The challenges posed by urban sprawl are as numerous as they are varied. As with its characteristics, there is not necessarily a classic categorization of these challenges in the literature. However, as shown in Figure 7, we could propose to group them into three main categories: socioeconomic challenges, environmental challenges, and infrastructural challenges.
Illustrating the main challenges of urban sprawl.

3.3.1. Socioeconomic challenges
Urban sprawl worsens socioeconomic inequalities by fostering segregated neighbourhoods that restrict access to essential services, education, and job opportunities, especially for populations lacking private vehicle access (Dinda et al., Reference Dinda, Das, Chatterjee and Ghosh2019; Seevarethnam et al., Reference Seevarethnam, Rusli and Ling2022). Extended commuting distances in sprawling areas escalate transportation costs for residents. Disproportionately impacting low-income individuals who allocate a greater proportion of their income to transportation expenses, thereby diminishing their overall financial well-being (Sarkar and Chouhan, Reference Sarkar and Chouhan2019; Osman et al., Reference Osman, Shaw and Kenawy2018; Dinda et al., Reference Dinda, Das, Chatterjee and Ghosh2019). Sprawling development patterns not only contribute to social isolation by diminishing opportunities for community interaction but also hinder social cohesion and foster feelings of disconnectedness due to the absence of walkable neighbourhoods and public spaces (Sarkar and Chouhan, Reference Sarkar and Chouhan2019). In addition, the limited access to walkable areas, green spaces, and recreational facilities contributes to sedentary lifestyles, obesity and associated health problems. The inadequate availability of healthcare facilities and services further exacerbates public health challenges in such areas (Sarkar and Chouhan, Reference Sarkar and Chouhan2019; Abudu et al., Reference Abudu, Echima and Andogah2019; Baqa et al., Reference Baqa, Chen, Lu, Qureshi, Tariq, Wang, Jing, Hamza and Li2021).
3.3.2. Environmental challenges
Environmental challenges are some of the main ones of urban sprawl. The first environmental challenge is the loss of natural habitat due to the conversion of natural habitats and agricultural lands into developed areas, resulting in habitat loss for wildlife species. This can disrupt ecosystems, reduce biodiversity, and threaten vulnerable species (Purswani et al., Reference Purswani, Verma, Jayakumar, Khan and Pathak2022; Sarkar and Chouhan, Reference Sarkar and Chouhan2019; Kundu et al., Reference Kundu, Halder and Mandal2020; Dinda et al., Reference Dinda, Das, Chatterjee and Ghosh2019; Dadashpoor and Salarian, Reference Dadashpoor and Salarian2020). The second one is air and water pollution by increasing automobile use in sprawling areas leads to higher levels of air pollutants, including greenhouse gases, and particulate matter. Reduced green spaces and increased impervious surfaces contribute to poor water quality due to runoff pollutants (Sarkar and Chouhan, Reference Sarkar and Chouhan2019; Hua and Gani, Reference Hua and Gani2023; Tope-Ajayi et al., Reference Tope-Ajayi, Adedeji, Adeofun and Awokola2016). Low-density development with less vegetation and more impervious surfaces leads to the urban heat island effect, where urban areas are warmer than their rural surroundings. This can worsen heat-related health issues and increase energy demand for cooling (Purswani et al., Reference Purswani, Verma, Jayakumar, Khan and Pathak2022; Dinda et al., Reference Dinda, Das, Chatterjee and Ghosh2019).
3.3.3. Infrastructural challenges
Infrastructural challenges in a sprawling city have many aspects. The main ones being infrastructure costs, traffic problems (such as congestion), and infrastructure fragmentation. The extension of utilities, roads, and public services to sprawling areas incurs higher infrastructure costs for municipalities, straining local budgets, and prompting deferred maintenance of existing infrastructure (Sarkar and Chouhan, Reference Sarkar and Chouhan2019; Dinda et al., Reference Dinda, Das, Chatterjee and Ghosh2019; Jayasinghe et al., Reference Jayasinghe, Raghavan and Yonezawa2021). Longer commuting distances and car-centric development patterns in sprawling regions contribute to traffic congestion, diminishing transportation efficiency, prolonging travel times, and adversely affecting air quality (Sarkar and Chouhan, Reference Sarkar and Chouhan2019; Hua and Gani, Reference Hua and Gani2023; Abudu et al., Reference Abudu, Echima and Andogah2019; Malarvizhi et al., Reference Malarvizhi, Kumar and Porchelvan2021). Additionally, the fragmented and dispersed nature of development in these areas results in fragmented infrastructure networks, impeding connectivity, and complicating the delivery of essential services (Sarkar and Chouhan, Reference Sarkar and Chouhan2019; Arsanjani et al., Reference Arsanjani, Helbich, Kainz and Boloorani2013; Baqa et al., Reference Baqa, Chen, Lu, Qureshi, Tariq, Wang, Jing, Hamza and Li2021). This intricate interplay of factors underscores the multifaceted challenges associated with sprawling development.
Urban planning strategies must change to become more sustainable to address these issues. The creation of compact and mixed-use areas, enhanced public transit networks, environmentally friendly infrastructure, and the encouragement of walkable communities are important tactics for reducing the detrimental effects of urban sprawl (Belinga and El Haziti, Reference Belinga and El Haziti2023). Generally, these tactics can raise socioeconomic fairness, lessen environmental damage, and raise urban residents’ standard of living (Tekouabou et al., Reference Tekouabou, Diop, Azmi, Jaligot and Chenal2022b). This highlights the need for effective tools to support urban planning through predictive modelling of these indicators of controlled urban growth.
3.4. Urban sprawl issues in African cities context
Africa and Sub-Saharan Africa (SSA) in particular, has the highest urban growth rate, at around 3.6% per year (Yiran et al., Reference Yiran, Ablo, Asem and Owusu2020; Bocquier, Reference Bocquier2005). It is often considered the fastest urbanising region in the world with an urban population of around 472 million people at present and this figure will double over the next 25 years (Saghir and Santoro, Reference Saghir and Santoro2022). Forced or even surprised by this strong population growth, Africa’s main cities are heavily affected by the complex phenomenon of urban sprawl, which stems from rapid and above all unplanned urban growth (Forget et al., Reference Forget, Shimoni, Gilbert and Linard2021). In addition to demographic growth, urban sprawl in Africa is also characterised by indicators such as informal extensions to built-up areas often without adequate infrastructure development. The early development of areas with no regulations or basic services, the lack of formal housing are the consequent creation of shanty towns (Tekouabou et al., Reference Tekouabou, Diop, Azmi, Jaligot and Chenal2022b, Reference Tekouabou, Diop, Azmi and Chenal2023a). Concrete examples include Lagos in Nigeria, one of the fastest-growing cities in the world, where sprawl poses challenges in terms of waste management, transport infrastructure, and the provision of basic services (Yiran et al., Reference Yiran, Ablo, Asem and Owusu2020). Another example is the city of Nairobi in Kenya, which is expanding rapidly with informal developments on the outskirts, exacerbating inequalities, and putting pressure on natural resources and infrastructure (Yiran et al., Reference Yiran, Ablo, Asem and Owusu2020). Urban sprawl in Africa raises several major challenges including proper planning of the areas occupied once the population has settled in an anarchic manner, which leads to social breakdown and discontent, not to mention socioeconomic inequalities (Yiran et al., Reference Yiran, Ablo, Asem and Owusu2020). Another major challenge concerns infrastructure and basic public services which are non-existent and often difficult to implement once the population has settled (Tekouabou et al., Reference Tekouabou, Diop, Azmi and Chenal2023a). This brings with it de facto problems of transport, mobility, and security, as well as the emergence of small groups of bandits and the development of risky informal transport (Chenal and Le, Reference Chenal and Le2017). All these challenges are not without mentioning the environmental challenges arising from the destruction of natural ecosystems, deforestation around towns, and often the failure to create green spaces in occupied areas (Tekouabou et al., Reference Tekouabou, Diop, Azmi and Chenal2023a). Potential solutions to the problem of urban sprawl in Africa include developing urban planning services, facilitating procedures for registering land for legal sale, introducing affordable housing policies, and improving infrastructure. Finally, there is the funding of urban development research into the use of new techniques to strengthen the planning and monitoring of urban occupation in line with policies set in advance (Gartoumi and Tékouabou, Reference Gartoumi and Tékouabou2023).
3.5. The need for precise and forecast methods for modelling urban sprawl
The significant effects of urbanization on the environment, society, and economy need the development of forecast urban sprawl modelling methods (Shao et al., Reference Shao, Sumari, Portnov, Ujoh, Musakwa and Mandela2021). To properly understand, foresee, and manage these ramifications, accurate modeling is necessary. In urban planning, reliable insights from accurate modelling are essential for informed decision-making by urban planners, policymakers, and stakeholders (Purswani et al., Reference Purswani, Verma, Jayakumar, Khan and Pathak2022; Tope-Ajayi et al., Reference Tope-Ajayi, Adedeji, Adeofun and Awokola2016; Dinda et al., Reference Dinda, Das, Chatterjee and Ghosh2019; Arsanjani et al., Reference Arsanjani, Helbich, Kainz and Boloorani2013). These decisions pertain to land use, infrastructure development, and resource allocation, influencing the trajectory of urban growth (Hua and Gani, Reference Hua and Gani2023; Jat et al., Reference Jat, Garg and Khare2008). Resource management becomes critical in the face of urban sprawl which strains land, water, and energy. Predictive modelling identifies areas of potential resource overuse, guiding strategies for efficient utilization, and conservation (Sarkar and Chouhan, Reference Sarkar and Chouhan2019; Hua and Gani, Reference Hua and Gani2023; Osman et al., Reference Osman, Shaw and Kenawy2018). Infrastructure planning, encompassing transportation networks, and public services benefits from accurate modelling to meet future needs and optimize investments (Purswani et al., Reference Purswani, Verma, Jayakumar, Khan and Pathak2022). Environmental conservation relies on modelling to identify ecologically important areas and sensitive habitats, informing land use policies that balance development with conservation efforts (Sarkar and Chouhan, Reference Sarkar and Chouhan2019; Tope-Ajayi et al., Reference Tope-Ajayi, Adedeji, Adeofun and Awokola2016). Understanding the environmental impact of sprawl aids in formulating targeted strategies for sustainable growth, climate change mitigation, and improving air and water quality (Abudu et al., Reference Abudu, Echima and Andogah2019; Osman et al., Reference Osman, Shaw and Kenawy2018; Dinda et al., Reference Dinda, Das, Chatterjee and Ghosh2019). Economic planning involves forecasting economic consequences and enhancing resilience, while policy evaluation ensures the effectiveness of land use policies (Sarkar and Chouhan, Reference Sarkar and Chouhan2019; Osman et al., Reference Osman, Shaw and Kenawy2018; Dinda et al., Reference Dinda, Das, Chatterjee and Ghosh2019). Ultimately, the goal of urban sprawl modelling is to foster sustainable development, creating livable, resilient, and environmentally conscious urban environments through informed decision-making and thoughtful planning (Sarkar and Chouhan, Reference Sarkar and Chouhan2019; Osman et al., Reference Osman, Shaw and Kenawy2018; Dinda et al., Reference Dinda, Das, Chatterjee and Ghosh2019; Jayasinghe et al., Reference Jayasinghe, Raghavan and Yonezawa2021).
4. Analysis of the urban sprawl prediction methods
Urban sprawl prediction is a difficult endeavour that requires examining several trends and elements associated with urban development (Belinga and El Haziti, Reference Belinga and El Haziti2023). It is imperative to take into account an extensive array of indications and elements that may impact the degree and trends of urban expansion. Usually, a variety of data sources, such as demographic, economic, environmental, and geographic data, are used to create these indicators. Figure 8 shows a generic approach to urban sprawl prediction modelling. Urban form’s features are key indicators and factors to take into consideration (Tekouabou et al., Reference Tekouabou, Diop, Azmi, Jaligot and Chenal2022b). Population growth (Congedo and Macchi, Reference Congedo and Macchi2015), economic indicators like income levels and job growth, and land use and land cover (LULC) like urban, agricultural, forested, and unoccupied are a few examples of these indicators. Urban statistics are gathered from pertinent data sources such as land use, transportation, socioeconomic, historical urban development, and environmental data (Belinga and El Haziti, Reference Belinga and El Haziti2023). These datasets can be sourced from open data platforms, satellite imagery, government organizations, or surveys. Combining these indicators and utilizing them as features in prediction models is the process of forecasting urban sprawl. Depending on the particular area, the context and the objectives of the prediction task, different indicators may be chosen.
The generic urban sprawl prediction framewrok (adapted from (Tekouabou et al., Reference Tekouabou, Diop, Azmi, Jaligot and Chenal2022b)).

4.1. Conventional methods for predicting urban sprawl
A variety of methods have been employed to simulate and forecast the growth of urban areas through the use of traditional urban sprawl modelling techniques (Padilla et al., Reference Padilla, Netto and Da Silva2020). Among the prominent types of conventional urban sprawl modelling methods are cellular automata (CA) and statistical models. (Belinga and El Haziti, Reference Belinga and El Haziti2023; Adegun et al., Reference Adegun, Viriri and Tapamo2023).
The application of statistical approaches in urban sprawl features modelling is generally from a quantitative perspective (Padmanaban et al., Reference Padmanaban, Bhowmik, Cabral, Zamyatin, Almegdadi and Wang2017) for leveraging historical data. Various statistical techniques have been used to understand the factors influencing urban expansion (Tope-Ajayi et al., Reference Tope-Ajayi, Adedeji, Adeofun and Awokola2016). These models often focus on relationships among socioeconomic variables (Khan and Sudheer, Reference Khan and Sudheer2022), land use patterns (Brown et al., Reference Brown, Pijanowski and Duh2000), and demographic trends (Congedo and Macchi, Reference Congedo and Macchi2015). Notable statistical-based techniques within this category include: regression models, logistic regression, Markov chain-based models, and spatial econometric-based models (Jiang et al., Reference Jiang, Chen, Zha, Zhang and Cui2022; Qiang et al., Reference Qiang, Lin, Zhu, Wu and Lee2021).
Spatially explicit models known as (CA) split the study region into distinct cells or pixels; every single one which might be in any number of states (e.g., urban, agricultural, and unoccupied) (Belinga and El Haziti, Reference Belinga and El Haziti2023; Sarkar and Chouhan, Reference Sarkar and Chouhan2019). These models mimic land-use changes according to preset criteria that dictate how cells move from one condition to another (Belinga and El Haziti, Reference Belinga and El Haziti2023; Huang et al., Reference Huang, Huang, Liao, Liang and Tian2018). CA offers a dynamic representation of urban sprawl and can capture interactions between neighbouring cells. Key features of CA-based models include transition rules (Arsanjani et al., Reference Arsanjani, Helbich, Kainz and Boloorani2013; Cilliers et al., Reference Cilliers, van Vuuren and van Heerden2021), Neighborhood influence (Akın and Erdoğan, Reference Akın and Erdoğan2020), time steps (Cilliers et al., Reference Cilliers, van Vuuren and van Heerden2021), and calibration and validation (Akın and Erdoğan, Reference Akın and Erdoğan2020; Cilliers et al., Reference Cilliers, van Vuuren and van Heerden2021).
Table 1 summarises the published papers according to the methods they use. CA and statistical models have both made significant contributions to our understanding of the dynamics and causes of urban sprawl. They do have certain drawbacks, though, such as oversimplifying intricate procedures or making assumptions that might not hold in all circumstances (Belinga and El Haziti, Reference Belinga and El Haziti2023). Contemporary urban sprawl modelling frequently combines these more established methods with more recent ones, such as ML (Purswani et al., Reference Purswani, Verma, Jayakumar, Khan and Pathak2022) and remote sensing (Tope-Ajayi et al., Reference Tope-Ajayi, Adedeji, Adeofun and Awokola2016; Padmanaban et al., Reference Padmanaban, Bhowmik, Cabral, Zamyatin, Almegdadi and Wang2017), to improve precision and offer a more thorough comprehension of patterns of urban expansion.
Traditional methods used by article

4.2. DL techniques for simulating urban sprawl
To improve the accuracy and predictive power of urban sprawl models, various DL-based techniques have often been used in recent years (Tekouabou et al., Reference Tekouabou, Diop, Azmi and Chenal2023a). These methods, which make use of deep neural networks (DNN) can learn from enormous datasets, capture complex spatial correlations, and produce more accurate forecasts regarding urban expansion (Belinga and El Haziti, Reference Belinga and El Haziti2023). Tekouabou et al. (Reference Tekouabou, Diop, Azmi, Jaligot and Chenal2022b) presented potential ML techniques suited for urban sprawl’s features prediction according to urban form.
4.2.1. High-resolution satellite imagery analysis
To challenge the high-resolution satellite imagery analysis, many recent works have used DL methods which have proven to be very suited for this purpose (Hua and Gani, Reference Hua and Gani2023; Adel et al., Reference Adel, Pradhan, Mojaddadi Rizeei and Jung2020). Convolutional neural networks (CNNs) have been used, for instance, to identify changes in land use over time (Ahmadi et al., Reference Ahmadi, Khalesi and Golroo2022; Helber et al., Reference Helber, Bischke, Dengel and Borth2019), detect urban areas (Ahmadi et al., Reference Ahmadi, Khalesi and Golroo2022), and classify different types of land cover (Boulila et al., Reference Boulila, Ghandorh, Khan, Ahmed and Ahmad2021). This makes it possible to identify fine-grained trends and chart urban expansion accurately (Tekouabou et al., Reference Tekouabou, Diop, Azmi and Chenal2023a).
4.2.2. Feature extraction and data fusion
DL-based models can automatically extract pertinent features from raw data, doing away with the requirement for human feature engineering (Belinga and El Haziti, Reference Belinga and El Haziti2023). This is especially helpful in situations where it might be difficult to identify pertinent features, including those involving complicated, multi-dimensional data like satellite pictures (Hua and Gani, Reference Hua and Gani2023; Adel et al., Reference Adel, Pradhan, Mojaddadi Rizeei and Jung2020). Additionally, the merging of various data sources, including socioeconomic data, environmental factors, and satellite imagery (Hua and Gani, Reference Hua and Gani2023; Khan and Sudheer, Reference Khan and Sudheer2022) is made possible by DL approaches. This combined data can offer a more comprehensive picture of the variables influencing urban growth.
4.2.3. Spato-temporal dynamics and multiscale analysis
Urban sprawl spatial and temporal dependencies can be captured by DL techniques like recurrent neural networks (RNNs) and long short-term memory (LSTM) networks (Boulila et al., Reference Boulila, Ghandorh, Khan, Ahmed and Ahmad2021; Belinga and El Haziti, Reference Belinga and El Haziti2023). These networks may learn how metropolitan areas grow and change over time by processing sequential data and taking trends and patterns into account (Jayasinghe et al., Reference Jayasinghe, Raghavan and Yonezawa2021). DL models can function at many scales, ranging from individual neighbourhoods to whole cities (Belinga and El Haziti, Reference Belinga and El Haziti2023). A thorough examination of the dynamics of urban sprawl is made possible by this capacity to handle data at various resolutions (Chen et al., Reference Chen, Wu, Du and Zhang2019).
4.2.4. Transfer learning and generative models
For certain urban sprawl modeling tasks, the pre-trained DL models such as CNNs trained on extensive picture datasets like Imagenet (LeCun et al., Reference LeCun, Bengio and Hinton2015) can be adjusted. This method makes use of the pre-trained model’s expertise and customizes it for the urban environment (Belinga and El Haziti, Reference Belinga and El Haziti2023). However, using past data, generative models such as generative adversarial networks (GANs) and variational autoencoders (VAEs) can produce artificial urban growth scenarios (Man and Chahl, Reference Man and Chahl2022). These scenarios help analyze the effects of various policy initiatives and investigate possible future patterns of urban expansion. Table 2 groups the browsed articles according to the DL methods they use.
Deep learning methods use by article read

5. Discussion
This section is devoted to discussing our analysis of the literature on the potential and limited applications of DL methods for modelling urban sprawl indicators. As methods for designing decision-support tools in the elicitation process, these DL methods challenge conventional methods as we see in Section 5.1. The second main aspect (Section 5.2) of this discussion analyses the advantages offered by DL methods to deal efficiently with spatial patterns of data as is most often the case in urban sprawl. The synthetic analysis (Section 5.3) of the challenges of these methods for this task and finally the limitations of our study conclude this discussion.
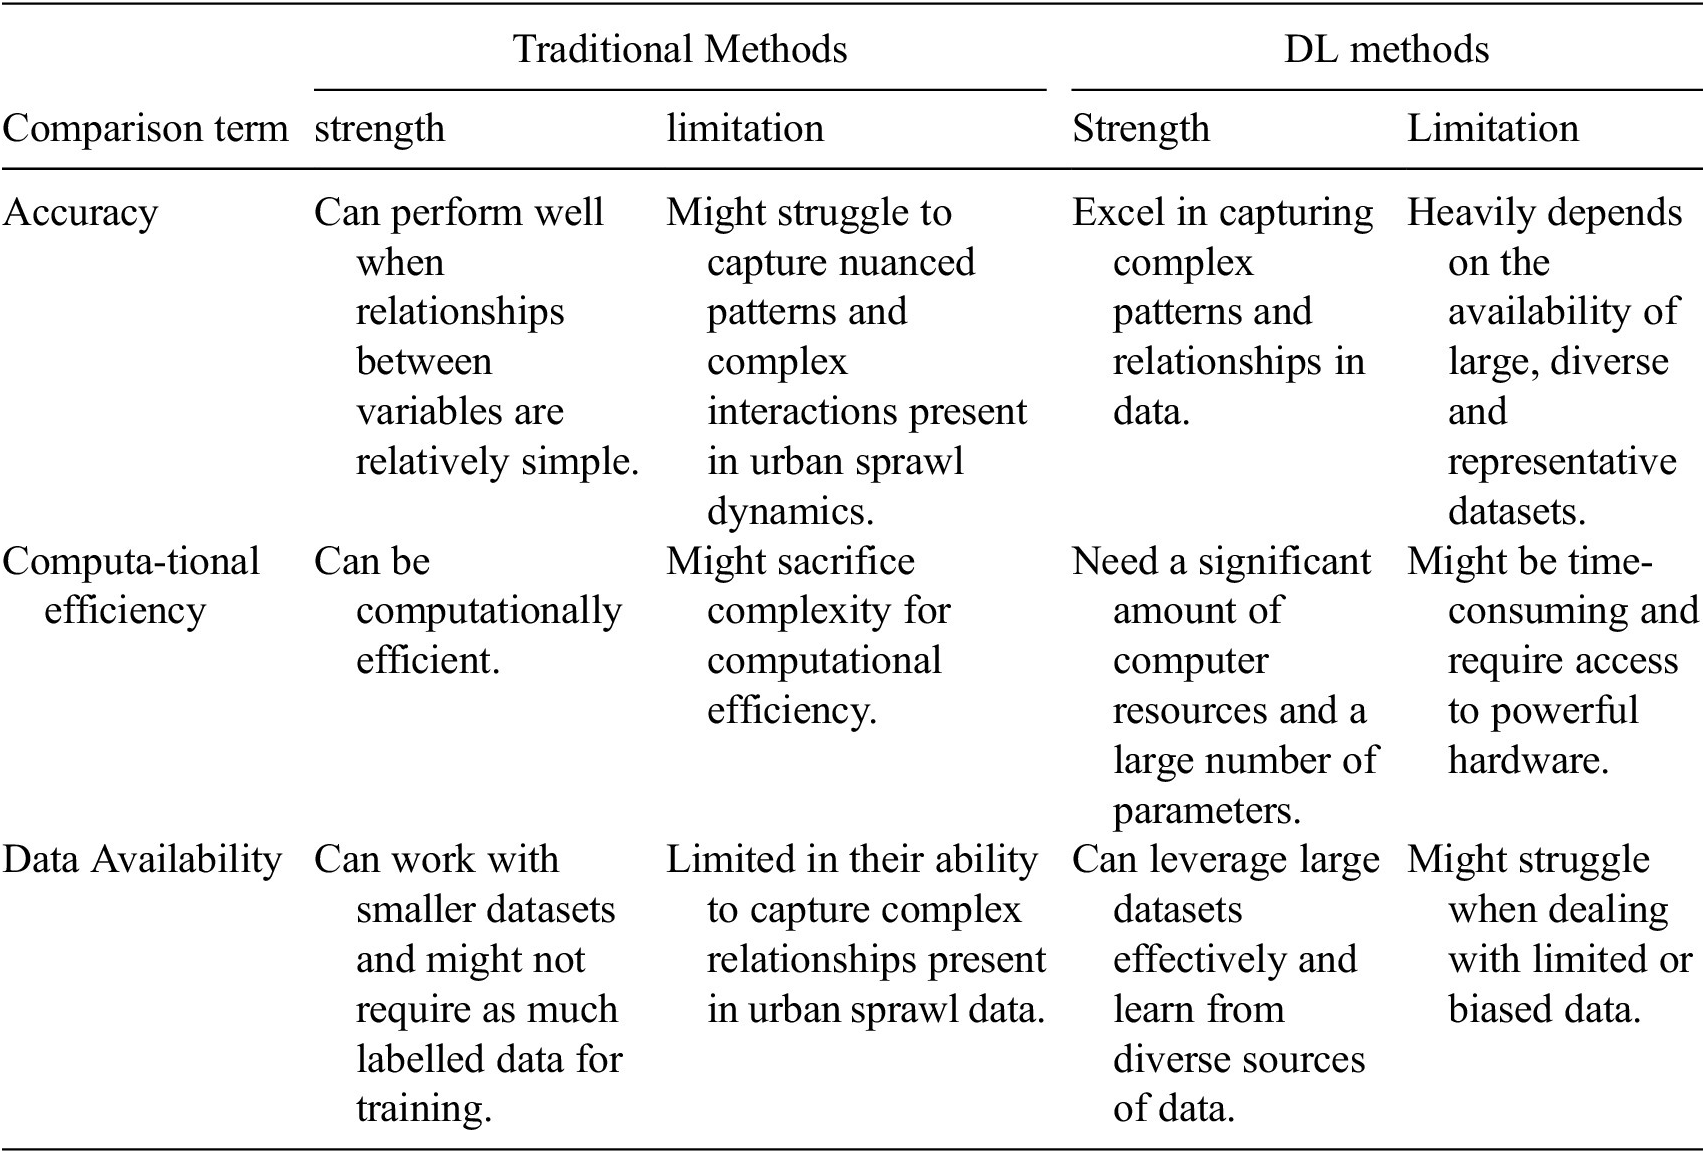
5.1. DL approaches vs traditional methods
Comparing DL approaches with traditional methods in the context of urban sprawl modelling involves evaluating their performance in terms of accuracy, computational efficiency, data availability, and interpretability. Table 3 shows the comparison between traditional and DL methods for urban sprawl modelling. DL-based models tend to offer higher accuracy by capturing complex patterns, especially when abundant and diverse data is available. However, they can be computationally intensive and require substantial data. Traditional methods can be computationally efficient and might work with smaller datasets, but they might struggle to capture intricate patterns. The choice between deep learning and traditional methods should be made based on the specific requirements of the urban sprawl modelling task, the availability of data, computational resources, and the desired level of accuracy (Tékouabou et al., Reference Tékouabou, Chenal, Azmi, Toulni, Diop and Nikiforova2022a).
Comparison between traditional and DL approaches
5.2. The advantages of DL for fitting complex spatial patterns
DL-based models offer several distinct advantages when it comes to capturing complex spatial relationships and patterns in various types of data, including satellite imagery, maps, and geospatial information (Tope-Ajayi et al., Reference Tope-Ajayi, Adedeji, Adeofun and Awokola2016; Abudu et al., Reference Abudu, Echima and Andogah2019). DNN excel in hierarchical feature learning, automatically extracting intricate spatial patterns. Their capacity to discern non-linear relationships sets them apart, making them adept at identifying complex interactions often elusive to traditional linear methods. Through abstraction, these models represent spatial features at various detail levels, capturing both fine-grained nuances and overarching spatial trends. CNN exploits spatial context, recognizing patterns based on neighbouring pixels’ arrangements, and crucial for capturing spatial relationships in images. RRN and variants like LSTMs excel at grasping long-range dependencies in sequential spatial data, essential for understanding temporal evolution. Scale-invariance ensures adaptability to changes in scale, rotation, and translation. Transfer learning allows pre-trained models to enhance spatial analysis tasks. The flexibility of DL accommodates various spatial data types and customizations for specific tasks, handling complex, and high-dimensional data with ease. Overall, the ability of DL to fit complex spatial patterns empowers researchers, analysts, and urban planners to gain deeper insights into urban growth dynamics, land use changes, density features, and other geospatial phenomena ultimately leading to more informed and effective decision-making.
5.3. Challenges and limitations
DL methods while powerful, are not without challenges and limitations. Table 4 shows the important factors to consider when applied to urban sprawl modelling. In conclusion, while DL offers numerous benefits, it is important to recognize and address the challenges and limitations associated with its application in urban sprawl modelling. A thoughtful approach that considers data availability, interpretability, model complexity, and domain expertise is essential to ensuring accurate and meaningful insights for urban planning and policy decisions.
Challenge and limitation of DL for urban sprawl modeling

6. Conclusion
This article delves into the integration of DL techniques with traditional methodologies for urban sprawl modelling. DL plays a pivotal role in advancing urban sprawl modelling, offering a transformative approach that brings new dimensions of accuracy, complexity, and insight to the field. In essence, DL’s ability to harness data-driven insights, capture intricate patterns, and integrate diverse information sources positions it as a transformative force in urban sprawl modelling. By addressing the limitations of traditional methods and enhancing accuracy, DL contributes to more informed urban planning decisions that pave the way for sustainable, resilient, and thriving cities of the future. By leveraging its capabilities, DL can facilitate data-driven decision-making, predictive modeling, and holistic strategies that promote sustainable growth and enhance the quality of urban life. By integrating DL’s predictive power with urban planning principles, sustainable development goals can be achieved, creating livable resilient cities that balance economic progress, environmental preservation, and social well-being.
Avenues of research that could further enrich the application of DL in urban sprawl modelling are emerging. Empirical validation studies could focus on evaluating the performance of DL models using real-world datasets, highlighting their practical utility, and robustness in diverse urban contexts. Interdisciplinary collaborations could foster a holistic understanding of the dynamics of urban sprawl, drawing on expertise from urban planning, environmental sciences, social economics, and data science. Case studies or field trials could demonstrate the practical application of DL techniques in urban planning and policy formulation, providing valuable insights into their effectiveness in addressing specific challenges. Comparative analyses could assess the relative strengths and limitations of DL techniques compared to traditional methods, guiding researchers and practitioners in selecting methodologies best suited to different urban contexts and research objectives.
By pursuing these future research directions, we can advance our understanding of the dynamics of urban sprawl, develop innovative methodologies, and contribute to sustainable urban planning strategies for the prosperous cities of the future.
Supplementary material
The supplementary material for this article can be found at http://doi.org/10.1017/dap.2024.87.
Data availability statement
Authors declare that all the data being used in the design and production cum layout of the manuscript is declared in the manuscript.
Author contribution
Ange Gabriel Belinga: Conceptualization, Investigation, Methodology, Writing_ Stéphane C. K. Tékouabou: Conceptualization, Investigation, Methodology, Writing, Visualization._ Mohamed El Haziti: Conceptualization, Investigation, Supervision.
Funding statement
This work received no specific grant from any funding agency, commercial or not-for-profit sectors.
Competing interest
The authors declare no competing interests exist regarding the present study.
Appendix 1: Bibliometric analysis
Orange filtering process is described in section 2.3 of the paper.

Documents by year (left) and best publishers (right). The growing trend in the number of documents published per year shows that deep learning methods are increasingly being used to model urban sprawl indicators. The list of top publishers, which is made up of the best-known names in scientific dissemination, confirms the reliability of the research carried out. By specifying that the requests were made before the end of 2023.

Document by type. By the type of publication, journal articles dominate the shortlist at nearly 70%, followed by conference papers and book chapters. This also confirms the reliability of our study, as journal articles follow a much stricter evaluation process and are generally better focused and developed in terms of content.

Document map by authors’ affiliations. The heat map shows the geographical distribution of authors’ affiliations in the most relevant documents in our study. We can see that the USA and China are in the lead position.


 Open access
Comments
No Comments have been published for this article.