




I. INTRODUCTION
Aligned carbon nanotubes (CNT), referred to as CNT forests, have repeatedly been shown to possess great potential for transforming the fabrication of thermal interfaces, electrical interconnects, nanoporous membranes, and structural fibers/composites. Reference Baughman, Zakhidov and de Heer1,Reference De Volder, Tawfick, Baughman and Hart2 However, realizing this potential has proven to be challenging. A major challenge that hinders the successful integration of functional aligned CNTs into applications is the need for building the process–structure–property relationship that governs the fabrication of tailored CNTs by chemical vapor deposition (CVD). Here, what is referred to as “process” encompasses the catalyst preparation, catalytic activation, growth and deactivation steps of CNT growth by CVD. Importantly, CVD is a promising CNT fabrication method owing to its scalability, flexibility and the high quality of CVD-grown CNTs, Reference Cassell, Raymakers, Kong and Dai3,Reference Hata, Futaba, Mizuno, Namai, Yumura and Iijima4 but a comprehensive understanding of the whole CVD process is still largely missing. The “structure” refers to the morphology of the individual CNTs, and their organization into the vertically aligned forest morphology, including their diameter distribution, number of walls, alignment, defects, deformation, and density. Finally, the “property” here focuses on the collective properties of the CNT forest structure as a whole, in contrast to the properties of individual CNTs.
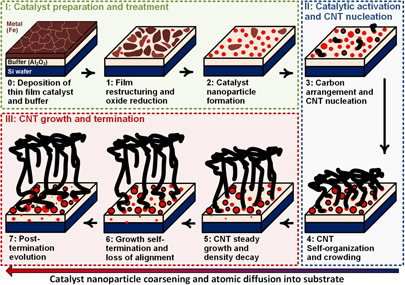
Studying how the morphology evolves during the successive stages of CNT growth by CVD from substrate bound catalyst nanoparticles has shown that a typical CNT forest exhibits spatial variations of diameter, alignment, and density, as shown schematically in Fig. 1. Reference Bedewy, Meshot, Guo, Verploegen, Lu and Hart5–Reference Bedewy, Meshot and Hart8 These variations arise from the dynamics of growth, which are dominated by time-varying kinetics of chemical decomposition, catalytic activation, catalyst poisoning/deactivation, and atomic diffusion. Reference Puretzky, Geohegan, Jesse, Ivanov and Eres9–Reference Amama, Pint, McJilton, Kim, Stach, Murray, Hauge and Maruyama16 Importantly, the non-uniform morphology of CNT forests influences their properties, such as in mechanical compression for example, which was shown to be affected by density gradients. Reference Pathak, Mohan, Decolvenaere, Needleman, Bedewy, Hart and Greer17 Hence, revealing the process–structure and structure–property relationships requires a comprehensive understanding of the atomic scale physicochemical processes underlying the bottom-up synthesis and self-organization of aligned CNTs. To that end, a large number of in situ nanoscale metrology and characterization techniques were explored over the past two decades for interrogating a large number of individual CNTs simultaneously as they grow, interact with each other, and self-assemble into the aligned morphology.
Schematic showing the successive stages of the collective CNT growth mechanism, organized into three categories: (I) Catalyst preparation and treatment; (II) Catalytic activation and CNT nucleation; and (III) CNT growth and termination.

Many model-based efforts toward understanding CNT growth and termination have relied on one type of data such as the evolution of the forest height as a function of growth time for example, and used these kinetics to explain the behavior expected of a single CNT growing from a single catalyst nanoparticle. An inherent assumption in those studies is that the areal density of CNTs is uniform throughout the forest. However, data-driven approaches enabled by collecting more measurements of the spatiotemporal evolution of CNT morphology during growth revealed that a growing CNT forest behaves as a large population with a time-varying distribution of diameters, tortuosity, and density. Reference Bedewy, Meshot, Guo, Verploegen, Lu and Hart5,Reference Bedewy, Meshot, Reinker and Hart7,Reference Bedewy, Meshot and Hart8 Moreover, the interactions among growing CNTs play an important role in creating the self-supporting aligned morphology, as well as in the eventual growth self-termination. Reference Bedewy, Meshot, Guo, Verploegen, Lu and Hart5,Reference Bedewy and Hart18
In a typical CNT forest, billions of CNTs grow simultaneously per square centimeter and interact together as they collectively build the vertically aligned structure. As shown in Fig. 1, this collective growth process can be broken down to a number of successive stages that are herein lumped into three main categories: (I) Catalyst preparation and treatment, in which the seeding nanoparticles are created by a combination of thin film deposition and thermal/chemical treatment for dewetting into a population of nanoparticles; (II) Catalytic activation and CNT nucleation, in which the introduction of the hydrocarbon gas leads to catalytic surface reactions and the formation of arranged carbon atoms on the surface of the catalyst nanoparticles that form a cap, leading to the lift-off of a population of CNTs that interact together; and (III) CNT growth and self-termination, in which the growth proceeds after CNT crowding and self-organization until the density starts to decay leading to eventual growth self-termination.
II. CATALYST PREPARATION AND TREATMENT
In most cases catalyst nanoparticles for CNT forest growth are prepared by annealing a thin film deposited by a physical vapor deposition (PVD) technique such as sputtering or electron beam evaporation. Annealing the as-deposited film causes dewetting (also referred to as agglomeration), by which a population of nanoparticles are created by atomic surface diffusion at high temperature. Reference Thompson19 Although other methods of preparing the catalyst nanoparticles such as by optical and electron beam lithography, Reference Teo, Chhowalla, Amaratunga, Milne, Hasko, Pirio, Legagneux, Wyczisk and Pribat20 colloidal self-assembly, Reference Li, Liu, Wang and Wang21,Reference Polsen, Bedewy and Hart22 and block copolymer self-assembly Reference Hinderling, Keles, Stöckli, Knapp, de los Arcos, Oelhafen, Korczagin, Hempenius, Vancso, Pugin and Heinzelmann23 have been used to successfully grow CNTs, thin film dewetting remains the most common, owing to its simplicity, ease of integration with CNT processing, and its scalability.
A number of transition metal catalysts, and combinations thereof, were used to grow CNTs including Ni, Fe, Mo, Co, and others. Reference Hata, Futaba, Mizuno, Namai, Yumura and Iijima4,Reference Li, Liu, Wang and Wang21,Reference Baker, Barber, Harris, Feates and Waite24–Reference Bachilo, Balzano, Herrera, Pompeo, Resasco and Weisman26 Also, a number of different materials were used as a buffer layer between the metal catalyst and the substrate (usually a Si wafer), such as Al, Al2O3, TiN, and TiO2. Reference de los Arcos, Gunnar Garnier, Oelhafen, Mathys, Won Seo, Domingo, Vicente García-Ramos and Sánchez-Cortés27 It was shown that the catalyst–substrate interactions dictated the chemical changes that the as-deposited iron catalyst undergoes on different buffers upon exposure to C2H2. In particular, high growth rate of small-diameter CNTs was observed from FeO on Al2O3 buffer, as opposed to the slow growth of large CNTs having thick walls on both TiN and TiO2 buffers. Moreover, for the same buffer layer material aluminum oxide, different processing routes and film properties were shown to significantly influence CNT growth. Reference Amama, Pint, Kim, McJilton, Eyink, Stach, Hauge and Maruyama15 Over the years, many approaches were explored for modifying the catalyst to improve growth. For example, growth was prolonged by tuning the stoichiometry of bimetallic catalyst particles, such as Ni–Fe, Reference Chiang and Sankaran28 and Co–Mo. Reference Kitiyanan, Alvarez, Harwell and Resasco29 In another study, the stability of the support (aluminum oxide) layer was improved by doping with Lanthanum (La), Reference Wang, Borisevich, Rashkeev, Glazoff, Sohlberg, Pennycook and Pantelides30 which enabled growing CNT forests as high as 18 mm. Reference Shanov, Gorton, Yun and Schulz31 Recently, ion bombardment was used to modify the surface properties for CNT growth. Reference Islam, Nikolaev, Amama, Saber, Zakharov, Huffman, Erford, Sargent, Semiatin, Stach and Maruyama32
It’s noteworthy that the catalyst nanoparticle could act as a seed for CNT growth while remaining strongly bound to the substrate surface, in which case the growth is referred to as base-growth. On the other hand, if the catalyst nanoparticle is pushed upwards by the growing CNT, it is referred to as tip-growth, as has been shown for some Mo- and Co-containing catalysts. Reference Dai, Rinzler, Nikolaev, Thess, Colbert and Smalley33 In cases of strong interactions between the active catalyst nanoparticles and the underlying support layer, such as between iron and aluminum oxide, base-growth is the dominant mechanism. Reference Amama, Pint, Kim, McJilton, Eyink, Stach, Hauge and Maruyama15,Reference Sushumna and Ruckenstein34 Moreover, the growth mechanism was shown to shift between tip growth and base growth based on the diameter of the catalyst nanoparticle. Reference Gohier, Ewels, Minea and Djouadi35 Previously, backscatter-electron imaging was used to show that there are no traces of metal nanoparticles on the top of grown CNT forests, Reference Stadermann, Sherlock, In, Fornasiero, Park, Artyukhin, Wang, De Yoreo, Grigoropoulos, Bakajin, Chernov and Noy36 to confirm the base-growth process for Fe nanoparticle catalysts on aluminum oxide support layers. The rest of this article will focus on studying this catalyst system.
Film restructuring of the iron/aluminum oxide system was studied previously by a number of surface characterization techniques, such as scanning electron microscopy (SEM), atomic force microscopy (AFM), electron diffraction (ED), X-ray diffraction (XRD), X-ray photoelectron spectroscopy (XPS) and in situ grazing incidence small angle X-ray scattering (GI-SAXS). Reference Bedewy, Meshot, Reinker and Hart7,Reference Amama, Pint, Kim, McJilton, Eyink, Stach, Hauge and Maruyama15,Reference de los Arcos, Gunnar Garnier, Oelhafen, Mathys, Won Seo, Domingo, Vicente García-Ramos and Sánchez-Cortés27,Reference Hasegawa and Noda37–Reference Bedewy, Viswanath, Meshot, Zakharov, Stach and Hart43 Many imaging and chemical characterization techniques such as electron microscopy and XPS are typically difficult to employ in situ owing to the stringent requirements of low pressure, and limitations on the gases that can be introduced into the measurement chamber. On the other hand, scattering-based methods such as GI-XRD and GI-SAXS provided unique information on the morphology and chemical state of the catalyst during the preparation steps at higher pressures.
Environmental transmission electron microscopy (E-TEM) was recently used, as shown in Fig. 2, for the real-time observation of the collective process of catalyst nanoparticle preparation, CNT nucleation and eventual catalytic deactivation on thin TEM membranes. Electron diffraction (ED) enabled studying the structural and associated chemical changes as iron oxide reduces in the H2 environment. Finally, real-time TEM imaging also enabled monitoring the evolution of a population of nanoparticles during annealing. Results revealed the progressive restructuring and reduction of the as-deposited iron oxide film that occur during annealing in H2. As shown in Figs. 2(b)–2(e), the ED patterns before annealing exhibited multiple continuous rings, indicating diffraction from multiple crystalline structures that represent a mixture of oxide phases. As temperature is raised during annealing up to 750 °C, distinct reflection points on the rings emerge, which signifies the restructuring of a polycrystalline film to form larger crystallites. Even with dwelling at 750 °C for more than 100 min, the oxide reduction is not complete, as can be inferred from the presence of a mixture of rings corresponding to metallic Fe and oxide phases [Fig. 2(e)].
In situ characterization of catalyst film evolution during annealing by TEM and ED. (a) Schematic showing the growth of CNTs on TEM membranes inside an E-TEM. (b–e) ED patterns during heating the Fe x O y /Al x O y catalyst film in hydrogen, showing the reduction to metallic Fe with extended dwell time at 750 °C, as confirmed by the emergence of the red rings at interplanar spacings that are characteristic of metallic Fe (scale bar: 3 nm−1). (f, g) TEM images taken at different temperatures, showing film restructuring during annealing and particle formation by dewetting after 96 min at 750 °C (scale bar: 10 nm). Adapted with permission from Ref. Reference Bedewy, Viswanath, Meshot, Zakharov, Stach and Hart43. Copyright 2016 American Chemical Society.

Hence, annealing the thin film iron oxide up to 750 °C in H2 in vacuum (40 mTorr) does not fully reduce the catalyst to the metallic phase. Reference Hofmann, Blume, Wirth, Cantoro, Sharma, Ducati, Hävecker, Zafeiratos, Schnoerch, Oestereich, Teschner, Albrecht, Knop-Gericke, Schlögl and Robertson42,Reference Sharma, Moore, Rez and Treacy44 Experimental studies have also shown that heating using a hot tungsten filament up to 2000 °C produces atomic hydrogen that rapidly reduces the catalyst. Reference Amama, Pint, McJilton, Kim, Stach, Murray, Hauge and Maruyama16,Reference Xu, Flor, Schmidt, Smalley and Hauge45 Other strong reducing agents such as ammonia (NH3) Reference Hofmann, Blume, Wirth, Cantoro, Sharma, Ducati, Hävecker, Zafeiratos, Schnoerch, Oestereich, Teschner, Albrecht, Knop-Gericke, Schlögl and Robertson42 and hydrazine (N2H4) Reference Pint, Kim, Stach and Hauge46 were also shown to cause the complete reduction of iron oxide. The reduction and phase change of Fe catalyst are therefore dependent on the annealing conditions, such as temperature, pressure, dwell time, and the gas environment.
As shown in Fig. 3, in situ GI-SAXS was used to study the dynamics of nanoparticle formation by dewetting (agglomeration), and the results showed that this process is rapid once a sufficiently high temperature is reached during fast heating. Mounting the reactor in the beamline of a synchrotron source also enabled GI-SAXS to uniquely track the time evolution of the statistical distribution of nanoparticle sizes and shapes. Reference Meshot, Verploegen, Bedewy, Tawfick, Woll, Green, Hromalik, Koerner, Philipp, Tate, Gruner and Hart38 Although GI-SAXS is well-suited to studying dewetting, once CNTs start nucleating it becomes difficult to decouple the scattering coming from CNTs form that coming from the nanoparticles. Eventually, CNT scattering dominates, obscuring any information about the evolution of nanoparticles during growth. Importantly, using scattering intensity as an indication of CNT, both GI-SAXS and GI-XRD clearly demonstrate that the lift-off of aligned CNT forests from tangled CNT mats is an abrupt process. Reference Meshot, Verploegen, Bedewy, Tawfick, Woll, Green, Hromalik, Koerner, Philipp, Tate, Gruner and Hart38,Reference Landois, Pinault, Rouzière, Porterat, Mocuta, Elkaim, Mayne-L’Hermite and Launois47
Schematics and in situ GI-SAXS patterns of the successive stages of catalyst preparation and CNT nucleation: (a) As-deposited Fe/Al x O y film before heating; (b) Fe/Al x O y film being rapidly heated, showing the formation of nanoparticles by dewetting; (c) CNT nucleation from Fe catalyst nanoparticles; and (d) CNT growth, where scattering from CNTs from the transmitted X-ray beam dominate the collected 2D pattern, obscuring scattering from the nanoparticles. A schematic of scattering geometry corresponding to each pattern is shown above the pattern, and a plot of X-ray intensity (I) versus inverse space parameter (q) along the dashed line in the SAXS pattern is shown below each pattern. The blue shaded part of scattering is used for analysis. Reprinted with permission from Ref. Reference Meshot, Verploegen, Bedewy, Tawfick, Woll, Green, Hromalik, Koerner, Philipp, Tate, Gruner and Hart38. Copyright 2012 American Chemical Society.

III. CATALYTIC ACTIVATION AND CNT NUCLEATION
Although, there are different schools of thought with respect to the exact atomic scale physicochemical processes underlying catalytic activation and nucleation of CNTs, Reference Tessonnier and Su48 the process generally proceeds by the arrangement of carbon atoms on the surface of the catalyst nanoparticles, leading to cap formation and liftoff. A major challenge is identifying which phase is the catalytically active phase and which pathways leads to the most active CNT growth (faster growth kinetics and higher density of CNTs). Toward this end, Hofmann et al. used in situ XPS to demonstrate that reducing Fe3+ and Fe2+ to the more catalytically active metallic Fe phase is required for efficient CNT nucleation. Reference Hofmann, Blume, Wirth, Cantoro, Sharma, Ducati, Hävecker, Zafeiratos, Schnoerch, Oestereich, Teschner, Albrecht, Knop-Gericke, Schlögl and Robertson42 De los Arcos et al. also used the same characterization technique of in situ XPS, as shown in Fig. 4, to identify that active catalyst phase to be either Fe or FeO depending on properties of the buffer layer (chemical and morphological). Reference de los Arcos, Garnier, Seo, Oelhafen, Thommen and Mathys39 An advantage of using XPS is that it enabled directly monitoring that the transition from chemisorbed carbon to graphitic carbon deposition by looking at the evolution of the core carbon 1s peak. This transition of binding energy, shown in Fig. 5, can be used as an indication of the formation and lift-off of nucleating CNTs. Reference Hofmann, Sharma, Ducati, Du, Mattevi, Cepek, Cantoro, Pisana, Parvez, Cervantes-Sodi, Ferrari, Dunin-Borkowski, Lizzit, Petaccia, Goldoni and Robertson41 However, the penetration depth in XPS analysis is typically limited (∼2 nm), which prevents the continued characterization once CNTs cover the catalyst nanoparticles.
In situ XPS results, showing the Fe 2p core lines at successive stages of catalyst preparation and CNT nucleation on different support layers (Al2O3, TiN and TiO2). (a) Measurement collected before annealing (as-deposited). (b) Measurement collected after annealing in a vacuum (10−5 mbar) up to 840 °C for 8 min. (c) Measurement collected after annealing the samples for 8 min followed by exposure to C2H2 for 5 s. Reprinted with permission from Ref. Reference de los Arcos, Garnier, Seo, Oelhafen, Thommen and Mathys39. Copyright 2004 American Chemical Society.

In situ XPS of the C 1s core level during Fe exposure to C2H2 at 580 °C (∼2 × 10⁻⁷ mbar). Inset on the right show an SEM image of CNTs grown on the same part of the substrate. Inset on the left show the time-evolution of the chemisorbed (dots) and graphitic (crosses) carbon peaks. Adapted with permission from Ref. Reference Hofmann, Sharma, Ducati, Du, Mattevi, Cepek, Cantoro, Pisana, Parvez, Cervantes-Sodi, Ferrari, Dunin-Borkowski, Lizzit, Petaccia, Goldoni and Robertson41. Copyright 2007 American Chemical Society.

The catalytic activity and phase dynamics of Fe-based catalysts were also studied by in situ ED, and results showed that iron carbide is formed as a result of exposing body-centered cubic (BCC) metallic iron to C2H2. In that study, the cementite phase (Fe3C) was shown to be the active phase required for CNT growth, and the carbon-rich Hägg phase (Fe5C2) was shown to be the inactive (catalytically poisoned) phase. Reference Mazzucco, Wang, Tanase, Picher, Li, Wu, Irle and Sharma49 Additional in situ GI-XRD characterization also showed the dynamics of catalyst phase change, wherein if you start with FCC-rich iron catalyst (γ-Fe), the metallic Fe is the active phase without the need for carbide formation. On the other hand, if you start with a BCC-rich metallic phase (α-Fe), carbide formation is important for the growth process. Reference Wirth, Bayer, Gamalski, Esconjauregui, Weatherup, Ducati, Baehtz, Robertson and Hofmann50
Hence, individual catalyst nanoparticles within large populations typically follow a variety of different pathways during the successive stages of annealing and changes in the gas environment. These observations highlight the importance of any inherent variability in size, shape, and chemical composition among catalyst nanoparticles. Also, the spatial distribution of surface contaminants and any other local interactions can play a role in influencing the catalytic activity and the phase change dynamics.
At the scale of individual nanoparticles, in situ E-TEM imaging of CNT nucleation informed the understanding of the atomic scale mechanisms of graphitic cap formation and liftoff. Reference Hofmann, Sharma, Ducati, Du, Mattevi, Cepek, Cantoro, Pisana, Parvez, Cervantes-Sodi, Ferrari, Dunin-Borkowski, Lizzit, Petaccia, Goldoni and Robertson41,Reference Wirth, Bayer, Gamalski, Esconjauregui, Weatherup, Ducati, Baehtz, Robertson and Hofmann50–Reference Moseler, Cervantes-Sodi, Hofmann, Csanyi and Ferrari53 Hence, E-TEM enabled the direct measurement of CNT growth kinetics of individual CNTs growing from a single catalyst nanoparticle, as shown in Fig. 6.
(a–d) In situ TEM images showing the growth of a single CNT with time. (e) Extracted growth kinetics for an individual CNT. Adapted with permission from Ref. Reference Lin, Tan, Boothroyd, Loh, Tok and Foo51. Copyright 2006 American Chemical Society.

More recently, E-TEM has been applied to observe the nucleation and growth of a large number of CNTs within the field of view, as shown in Fig. 7. In situ E-TEM imaging of catalyst populations, with more than 200 particles in the same image enabled plotting the population kinetics of catalyst nanoparticle formation by dewetting [Fig. 7(e)]. The accelerated dewetting behavior upon C2H2 exposure observed in this study was attributed to the reduction of iron oxide, leading to the sudden appearance, or “popping,” of the fully formed catalyst nanoparticle in view in the E-TEM image. Reference Bedewy, Viswanath, Meshot, Zakharov, Stach and Hart43 In situ TEM imaging also enabled studying the mechanical interactions between CNTs as they crowd each other and self-organize into the aligned structure [Figs. 7(f) and 7(g)]. Reference Bedewy, Viswanath, Meshot, Zakharov, Stach and Hart43,Reference Balakrishnan, Bedewy, Meshot, Pattinson, Polsen, Laye, Zakharov, Stach and Hart54
(a–d) In situ E-TEM images showing the population dynamics of nanoparticle formation by dewetting as well as the nucleation of CNTs (Scale bar is 50 nm). (e) Time evolution of the number of nanoparticles and nucleating CNTs. (f, g) TEM images showing the mechanical interactions between CNTs and their self-organization during crowding (Scale bar is 50 nm). Adapted with permission from Ref. Reference Bedewy, Viswanath, Meshot, Zakharov, Stach and Hart43. Copyright 2016 American Chemical Society.

Importantly, different carbon-containing feedstock gases were used in CVD growth of CNTs, including acetylene, Reference Huang, Xu, Ren, Wang, Siegal and Provencio55 ethylene, Reference Fan, Chapline, Franklin, Tombler, Cassell and Dai56 methane, Reference Kong, Cassell and Dai57 ethanol, Reference Maruyama, Einarsson, Murakami and Edamura58 and carbon monoxide. Reference Zheng, Lu, Gu, Makarovski, Finkelstein and Liu59 Moreover, other additives were explored to assist growth by either accelerating the growth rate or prolonging the catalyst life, such as water, oxygen, air, ethanol, carbon dioxide, acetone, tetrahydrofuran, methylbenzoate, and benzoaldehyde. Reference Hata, Futaba, Mizuno, Namai, Yumura and Iijima4,Reference Zhang, Gregoire, van Dover and Hart60–Reference Li, Zhang, Ci, Shah, Wolfe, Kar, Talapatra and Ajayan63 This review focuses on CVD growth of CNTs using acetylene and ethylene feedstock, and does not focus on the chemistry of growth enhancers.
IV. CNT GROWTH AND TERMINATION
Toward a mechanistic understanding of CNT growth and termination, characterization of the structure of a CNT forest is needed: from the macroscopic dimensions down to the atomic scale structure. In contrast to the previous category, which relied heavily on surface characterization techniques, the third category involves noncontact sensing of CNT forests and imaging their hierarchical morphology at multiple length-scales, shown in Fig. 8, along with spectroscopic and scattering-based techniques. For example, the evolution of forest morphology was heavily studied using ex situ SEM, to reveal the mechanism of growth temination. Reference Zhu, Hess and Wong64,Reference Vinten, Marshall, Lefebvre and Finnie65
Imaging a CNT forest at multiple length-scales. (a) Optical imaging of the macroscale forests (Adapted with permission from Ref. Reference Bedewy, Meshot, Reinker and Hart7. Copyright 2011 American Chemical Society) (b) SEM imaging of the microstructure (Adapted with permission from Ref. Reference Bedewy, Meshot, Reinker and Hart7. Copyright 2011 American Chemical Society). (c) Schematic of the nanoscale and mesoscale morphology of the tangled array of tortuous CNTs. (d) SEM showing the hierarchical forest morphology of bundled and tortuous CNTs (Adapted with permission from Ref. Reference Bedewy, Meshot, Reinker and Hart7. Copyright 2011 American Chemical Society). (e) Schematic showing the concentric walls of a multi-wall CNT. (f) TEM image showing the walls of a CNT (Adapted with permission from Ref. Reference Bedewy, Meshot, Reinker and Hart7. Copyright 2011 American Chemical Society). (g) Schematic showing the atomic structure of graphitic carbon walls with a Stone–Wales defect (Adapted with permission from Ref. Reference Meunier and Lambin66. Copyright 2000 Elsevier). (h) STM image of CNT wall with Stone-Wales defect (Adapted with permission from Ref. Reference Meunier and Lambin66. Copyright 2000 Elsevier).

A large number of in situ and ex situ techniques were previously explored for the nondestructive characterization of CNT growth kinetics. For example, optical photography and videography, Reference Hart, van Laake and Slocum67,Reference Puretzky, Eres, Rouleau, Ivanov and Geohegan68 optical interference, Reference Kim, Jang, Kim, Cho, Yang, Kang, Min and Lee69 single-slit laser diffractography, Reference Dell’Acqua-Bellavitis, Ballard, Ajayan and Siegel70 time-resolved reflectivity, Reference Puretzky, Geohegan, Jesse, Ivanov and Eres9 laser triangulation, Reference Meshot and Hart71,Reference Meshot, Plata, Tawfick, Zhang, Verploegen and Hart72 and cycling of growth to create stacked structures visible by SEM. Reference Zhu, Hess and Wong64,Reference Iwasaki, Zhong, Aikawa, Yoshida and Kawarada73,Reference Patole, Park, Lee, Lee, Patole and Yoo74 Importantly, all of the abovementioned methods only enables quantifying the height kinetics. On the other hand, real-time mass measurements are more challenging, and have been achieved in the past generally by using a microbalance either ex situ, Reference Bedewy, Meshot, Guo, Verploegen, Lu and Hart5,Reference Yasuda, Hiraoka, Futaba, Yamada, Yumura and Hata75 or in situ. Reference Valiente, Lopez, Ramos, Ruiz, Li and Xin76 Weighing samples, however, imposes limitations on the resolution of the measurement and does not enable spatial mapping of mass and density across an individual forest.
Indirect measurements of density were obtained from ex situ Z-contrast transmission electron microscopy (Z-STEM) imaging, as well as from real-time changes in the effective extinction coefficient in time-resolved optical reflectivity (TRR). Reference Jackson, Puretzky, More, Rouleau, Eres and Geohegan77–Reference Puretzky, Geohegan, Jackson, Pannala, Eres, Rouleau, More, Thonnard and Readle79 Also, in situ Raman spectroscopy can be used to provide a measure of relative mass kinetics from real-time integration of the area under the G-band. Reference Picher, Anglaret, Arenal and Jourdain80–Reference Latorre, Romeo, Cazana, Ubieto, Royo, Villacampa and Monzon83 Real-time monitoring of the G-band during growth of single-wall CNTs was instrumental in demonstrating that the growth rate is dependent on CNT chirality. Reference Rao, Liptak, Cherukuri, Yakobson and Maruyama84 Recently, in situ electron energy loss spectroscopy (EELS) was used to quantify the accumulating carbon on the surface during CNT growth inside E-TEM, by plotting the time evolution of the carbon K-edge near-edge structure. Reference Bedewy, Viswanath, Meshot, Zakharov, Stach and Hart43 While some of these indirect approaches can be utilized for spatial mapping of density, they can only infer relative density.
As shown in Fig. 9, X-ray attenuation has been shown to enable accurate spatial mapping of absolute mass density of CNT forests down to a spatial resolution of 10 μm (limited by the size of the focused/trimmed synchrotron X-ray beam). A major advantage of this approach is that information about the evolution of diameter distribution and alignment are obtained simultaneously by analyzing SAXS patterns, as shown in Fig. 10. Reference Bedewy, Meshot, Guo, Verploegen, Lu and Hart5–Reference Bedewy, Meshot, Reinker and Hart7,Reference Meshot, Plata, Tawfick, Zhang, Verploegen and Hart72,Reference Wang, Bennett, Verploegen, Hart and Cohen85 In fact, Hermans orientation parameter can be used to measure the degree of alignment by quantifying the anisotropy in scattering patterns, obtained by either small angle neutron scattering (SANS) Reference Wang, Xu and Eres86 or SAXS. Reference Bedewy, Meshot, Guo, Verploegen, Lu and Hart5,Reference Meshot, Plata, Tawfick, Zhang, Verploegen and Hart72,Reference Wang, Bennett, Verploegen, Hart and Cohen85 Combining high resolution spatial mapping of X-ray scattering and intensity attenuation measurements, Reference Bedewy, Meshot, Guo, Verploegen, Lu and Hart5,Reference Bedewy, Meshot, Reinker and Hart7 with real-time height kinetics of CNT growth obtained by noncontact laser triangulation, Reference Meshot and Hart71,Reference Meshot, Plata, Tawfick, Zhang, Verploegen and Hart72 enabled revealing the spatiotemporal evolution of mass density, number density, and cumulative CNT areal density with unprecedented accuracy throughout the stages of CNT growth [Fig. 9(b)].
(a) Schematic of the experimental set-up, wherein a CNT forest is placed on a motorized stage in a synchrotron beamline, and the beam is focused to a 10 μm spot. (b) Time evolution of mass density and number of density of CNTs, fitted to a Gompertz model of population growth. Adapted with permission from Ref. Reference Bedewy, Meshot, Reinker and Hart7. Copyright 2011 American Chemical Society.

(a) Spatial mapping of the Hermans orientation parameter by processing SAXS patterns for forests grown in a hot wall reactor for different growth times. Adapted with permission from Ref. Reference Bedewy, Meshot, Guo, Verploegen, Lu and Hart5. Copyright 2009 American Chemical Society. (b) Probability density function of CNT diameter distribution in the topmost and bottommost slices of a CNT forest. Adapted with permission from Ref. Reference Bedewy, Meshot and Hart8. Copyright 2012 Elsevier. (c) Diameter dependent growth kinetics obtained by combing diameter distributions with forest mass kinetics. Adapted with permission from Ref. Reference Bedewy, Meshot and Hart8. Copyright 2012 Elsevier.

As a result, CNT forest growth is explained as a time-varying population of individual CNTs that have a variation of growth rates, while interacting together within a growing forest. This collective growth picture emerged in contrast to studies that explain CNT forest growth behavior based on mathematical modeling of the behavior of a single catalyst nanoparticle-CNT system. Reference Puretzky, Geohegan, Jesse, Ivanov and Eres9,Reference Stadermann, Sherlock, In, Fornasiero, Park, Artyukhin, Wang, De Yoreo, Grigoropoulos, Bakajin, Chernov and Noy36,Reference Louchev, Laude, Sato and Kanda87,Reference Wood, Pannala, Wells, Puretzky and Geohegan88 As shown in Fig. 9(b), the mass kinetics exhibit an S-shaped curve, which is fitted by the Gompertz model of population growth. This phenomenological fit indicated that the CNT population dynamics exhibit an autocatalytic nature. Combing this result with the evolution of diameter distributions during CNT growth [Fig. 10(b)] reveals the diameter dependent population growth dynamics [Fig. 10(c)]. Hence, small angle X-ray scattering (SAXS) Reference Wang, Bennett, Verploegen, Hart and Cohen85,Reference Wang, Bennett, Verploegen, Hart and Cohen89 and ultra-small angle X-ray scattering (USAXS) Reference Verploegen, Hart, De Volder, Tawfick, Chia and Cohen90 provide accurate information about density, diameters, bundle size, and alignment of CNTs in a growing forest.
Taken together, these results help paint a picture of the collective growth mechanism of CNT forests, as shown schematically in Fig. 1, starting with the nucleation of randomly oriented CNTs that interact with each other as their density increases. This crowding leads to the build-up of a self-supporting aligned morphology when the density reaches a threshold that was previously identified by numerical and experimental analysis to be in the order of 109 CNTs/cm2. Reference Bedewy, Meshot, Guo, Verploegen, Lu and Hart5,Reference Bedewy, Meshot, Reinker and Hart7 The CNT forest then grows steadily until density starts to decay as a result of the deactivation of individual CNTs in the growing population. This density decay proceeds until the density becomes too low to support the vertically aligned forest structure (lower than the abovementioned threshold density), at which point growth self-termination is observed. At the point of termination, forest height stops increasing, which is characterized by significant loss of alignment at the bottom of the forest. Reference Bedewy, Meshot, Guo, Verploegen, Lu and Hart5,Reference Bedewy, Meshot, Reinker and Hart7
It is also probable that some CNTs continue to grow beyond the apparent cessation of forest height kinetics, but their number is too small to push the forest upward. This post-termination evolution likely leads to the accumulation of more tortuous CNTs at the interface between the forest and substrate, and may help control the adhesion of the as-grown CNT forest to the substrate on which it is grown. Hence, employing different cooling recipes, along with using H2O etching can tune forest–substrate interactions. Reference Pint, Xu, Pasquali and Hauge91
V. OUTLOOK ON REMAINING CHALLENGES
Based on the current understanding of CNT growth dynamics, there have been significant advances toward controlling CNT growth by CVD, such as efforts toward improving the control on CNT diameters, chirality, and/or density. Reference Hasegawa and Noda37,Reference Futaba, Goto, Yasuda, Yamada, Yumura and Hata61,Reference Zhong, Warner, Fouquet, Robertson, Chen and Robertson92–Reference Esconjauregui, Bayer, Fouquet, Wirth, Ducati, Hofmann and Robertson95 In the future, more improvements are expected in the area of catalyst design and process engineering toward more deterministic control on the overall CNT quality (straightness and defect density) and precise atomic structure, including both mono-chiral and monodisperse diameter distribution of as-grown CNTs. In addition, more understanding on what factors determine whether a catalyst nanoparticle becomes active or inactive in a large population is likely to come by combining multiple in situ characterization techniques, such as combining TEM, ED, and EELS inside the E-TEM. Reference Bedewy, Viswanath, Meshot, Zakharov, Stach and Hart43 Understanding the spatial distribution of catalytic activity on substrates that arise from chemical coupling effects, Reference Bedewy, Farmer and Hart96 or from designed catalyst gradients/steps, Reference Zhang, Gregoire, van Dover and Hart60,Reference De Volder, Park, Tawfick and Hart97 also enables engineering the three-dimensional geometry of microscale/macroscale CNT structures.
Another challenge that still plagues CNT growth is the deactivation of growth or self-termination, which was previously heavily studied, leading to proposing multiple mechanisms that are likely to be competing, such as catalyst poisoning, overcoating, evaporation or diffusion, nanoparticle coarsening and CNT mechanical coupling. Reference Puretzky, Geohegan, Jesse, Ivanov and Eres9,Reference Amama, Pint, McJilton, Kim, Stach, Murray, Hauge and Maruyama16,Reference Bedewy and Hart18,Reference Stadermann, Sherlock, In, Fornasiero, Park, Artyukhin, Wang, De Yoreo, Grigoropoulos, Bakajin, Chernov and Noy36,Reference Futaba, Hata, Yamada, Mizuno, Yumura and Iijima98–Reference Kim, Pint, Amama, Zakharov, Hauge, Maruyama and Stach100 Studying the mechanochemical aspects of CNT growth, wherein the effects of mechanical forces on the catalytic process are analyzed both experimentally and numerically, is an area of current research and will enable better understating and control on the CNT growth process. A deeper understanding of all the competing deactivation mechanisms and identifying the dominant ones will open the door for approaches to overcome them. This is still required for the fabrication of ultra-long CNTs for application such as structural fibers and transmission lines.
Finally, from a practical perspective, the realization of many applications requires scaling the fabrication process, such as by roll-to-roll processing, Reference de Villoria, Figueredo, Hart, Steiner, Slocum and Wardle101 along with exercising more control on the inherent process variabilities that could compromise the properties of produced CNTs. Integrating aligned CNT films into functional devices invites the need to grow CNTs directly on different types of substrates such as metallic foils for instance. Reference Polsen, Bedewy and Hart22,Reference Yoshikawa, Asari, Kishi, Hayashi, Sugai and Shinohara102 Moreover, some applications require weak adhesion with substrate, such as in cases of transfer. Reference Zhou, Hu and Grüner103 Other applications require strong adhesion, such as using CNTs as adhesives, Reference Ge, Sethi, Ci, Ajayan and Dhinojwala104 and rolling CNTs to form horizontally aligned structures. Reference Pint, Xu, Pasquali and Hauge91,Reference Tawfick, O’Brien and Hart105 Hence, controlling the post-termination evolution, shown in Fig. 1, could be an important complement to controlling CNT growth, to tune the mechanical adhesion, as well as the electrical and thermal resistance at the CNT-substrate interface.
VI. CONCLUSIONS
This article presented a nonexhaustive overview of different characterization techniques that were utilized to study the successive stages of collective CNT forest growth, with particular focus on methods that are based on synchrotron X-ray scattering and mass attenuation, environmental transmission electron microscopy (E-TEM), electron diffraction (ED), and other spectroscopic techniques. In situ techniques were classified into three categories depending on the stage of the growth process. As shown schematically in Fig. 1, in the first category of catalyst preparation and treatment, thin film restructuring and nanoparticle formation by dewetting are characterized by surface characterization techniques during annealing. The second category of studying catalytic activation and CNT nucleation included efforts toward understanding the atomic pathways leading to the arrangement of carbon atoms on the catalyst and the lift-off of CNTs that interact with other CNTs in proximity. Finally, the third category summarized research on monitoring CNT growth and termination, with emphasis on methodologies for understanding the mechanochemical kinetics and mechanisms of catalytic deactivation. Combining all three categories together provides insights into building the process–structure relationship, which is at the heart of the science and technology of CNT fabrication. Hence, these efforts open the door for producing designed CNT structures having predictable morphology and tailored properties for specific applications.


 Open access

