


Agreement on a common set of facts is widely seen as promoting productive political discussion and democratic accountability. Based on survey data, many have argued that partisanship inhibits such agreement, acting as a “perceptual screen” that “shap[es] citizens’ perceptions of and reactions to the political world” (Campbell et al. Reference Campbell, Converse, Miller and Stokes1960, 133; Bartels Reference Bartels2002, 117). A threat to such inferences is partisan expressive responding: in at least some cases, the beliefs people express in surveys are more partisan than their underlying perceptions. Understanding the nature and magnitude of expressive responding is crucial to assessing its importance. While some think of expressive responding as insincere misreporting, others attribute it to bias in the recall and weighting of relevant information. Whereas the former account suggests that surveys exaggerate the strength of the relationship between beliefs and political preferences, the latter suggests that survey responses that are affected by expressive responding are more similar to the politically relevant judgments people make in real life.
This article asks what two decades of research can tell us about the magnitude, nature, and importance of partisan expressive responding. Based on a standardized dataset of 44 studies from 25 previously published articles and preprints, I conduct a systematic assessment of existing evidence regarding partisan expressive responding in the United States. Across studies, the average partisan belief difference is equal to about 19% of the scale in the control group. In response to treatments designed to reduce expressive responding, this shrinks to about 14% of the scale, approximately a 5 percentage point (pp) or 25% reduction in measured partisan bias. Aggregating across the more than 500 treatment $ \times $
question pairs in the data, treatments increase the correlation between the average Democrat’s and Republican’s beliefs from 0.81 to 0.86. This suggests that on average, expressive responding is a modest component of measured partisan bias, which is itself a modest component of beliefs. Topically, evidence for expressive responding is especially strong when it comes to economic conditions, guns, immigration, presidential popularity, recent news headlines, and voting method and is weakest when it comes to the COVID-19 pandemic, dating preferences, and party stereotypes.
$ \times $
question pairs in the data, treatments increase the correlation between the average Democrat’s and Republican’s beliefs from 0.81 to 0.86. This suggests that on average, expressive responding is a modest component of measured partisan bias, which is itself a modest component of beliefs. Topically, evidence for expressive responding is especially strong when it comes to economic conditions, guns, immigration, presidential popularity, recent news headlines, and voting method and is weakest when it comes to the COVID-19 pandemic, dating preferences, and party stereotypes.
The article next turns to the nature of expressive responding. Some frame expressive responding as insincere misreporting (“partisan cheerleading”), wherein partisan respondents deliberately misreport their beliefs in order to send a partisan message (Bullock et al. Reference Bullock, Gerber, Hill and Huber2015). Another explanation, congenial inference, holds that people’s partisan identities motivate them to make biased on-the-spot inferences about the survey question (Bullock and Lenz Reference Bullock and Lenz2019; Prior, Sood, and Khanna Reference Prior, Sood and Khanna2015). If a treatment designed to reduce expressive responding heightens accuracy motivation, respondents will make more even-handed, less partisan inferences. The heterogeneous effects analysis furnishes two cases in which both theories predict the same pattern: expressive responding should be more pronounced among respondents with stronger partisan identities (whose partisanship should exert a stronger influence on reasoning and reporting) and higher levels of education (who are more likely to have the background knowledge required to engage in partisan misreporting or congenial inference). Neither prediction bears out. A bit more clarity emerges from a systematic assessment of which mechanisms are most plausible for each technique that has been used to study expressive responding. Relative to early pay-for-correct studies, some newer designs more credibly isolate misreporting as a mechanism (Schaffner and Luks Reference Schaffner and Luks2018; Shino, Smith, and Uribe Reference Shino, Smith and Uribe2022) or include design-based tests that cast doubt on the congenial inference account (Peterson and Iyengar Reference Peterson and Iyengar2021).
In sum, the findings suggest that expressive responding is generally a modest component of beliefs. Misreporting is sometimes at play, but the lack of evidence of heterogeneities that both leading explanations anticipate suggests a need to keep an open mind regarding the nature and importance of expressive responding. Greater emphasis on design-based tests of mechanisms can help researchers pin down the phenomenon’s scope and substantive importance. In particular, while expressive responding clearly causes surveys to exaggerate the extent to which partisanship acts as a perceptual screen, the same forces that produce expressive responding in surveys may also affect the political judgments people make in real life.
TWO THEORIES OF EXPRESSIVE RESPONDING
A broad, mechanism-agnostic definition of expressive responding is that people sometimes give survey responses that are more partisan than their underlying perceptions. Existing research offers two accounts of how this could occur. As a running example consider Roy, a hypothetical Republican taking a survey in 2024. Roy thinks that the president, Democrat Joe Biden, has generally done a poor job. He has some personal experience that suggests that the economy is doing pretty well but does not think that Biden deserves credit for this. If asked in a survey about the economy in general or some statistic that quantifies its state, such as the unemployment rate, Roy may claim that the economy is doing poorly. Something about being asked to express his beliefs in a survey has created a disconnect between Roy’s underlying perceptions of the economy and his response to the survey question.
One account of expressive responding is deliberate misreporting, also known as partisan cheerleading. This could occur for reasons that are internal or external to the respondent. Externally, respondents may think of their survey response as signaling to an audience what they or their group think (Connors Reference Connors2023). Expressing a party-congenial belief may have expressive benefits, while expressing an uncongenial belief may have expressive costs. For example, Roy may think of his response as a signal about what Republicans think of Biden’s job performance. His insincere claim to think that the unemployment rate is going up could be intended to send a signal that Republicans disapprove of Biden or to avoid sending a signal that Republicans approve of his performance. Internal costs and benefits are also possible (Graham and Huber Reference Graham and Huber2022). For example, Roy may find it more enjoyable to state responses that are more consistent with his partisan identity or less enjoyable to state responses that are inconsistent with it.
The other major account, congenial inference (Bullock and Lenz Reference Bullock and Lenz2019; Prior, Sood, and Khanna Reference Prior, Sood and Khanna2015), marries theories of survey response and theories of motivated reasoning. Survey response theory holds that the beliefs measured in surveys are not generally preexisting beliefs that respondents extract directly from memory, like a file drawn from a drawer (Wilson and Hodges Reference Wilson and Hodges1992). Instead, responses are constructed on the spot based on whatever relevant information the respondent calls to mind (Tourangeau, Rips, and Rasinski Reference Tourangeau, Rips and Rasinski2000; Zaller Reference Zaller1992). Theories of motivated reasoning argue that identities like partisanship create directional motives that bias people’s recall and inferences (Kunda Reference Kunda1990). When asked how well the economy is doing, Roy could rely on a partisan heuristic like “Biden is doing a bad job.” If Roy were more motivated to make an accurate inference, he might be more likely to recall considerations that point in the opposite direction, like “my sister had no problem finding work after she got laid off.” In this way, heightened accuracy motivation could result in inferences that are more representative of people’s underlying perceptions.
Throughout, my terminology aims to strike a balance between legibility to non-experts and fidelity to the relevant theory. When I write “underlying perceptions,” I mean what Zaller (Reference Zaller1992) and Tourangeau, Rips, and Rasinski (Reference Tourangeau, Rips and Rasinski2000) call considerations and what Prior, Sood, and Khanna (Reference Prior, Sood and Khanna2015) and Kuklinski et al. (Reference Kuklinski, Quirk, Jerit, Schwieder and Rich2000) describe as information held in memory. People can, of course, forget things that they perceive, but the considerations stored in memory are the raw material that people carry around with them to help them make sense of the political world. By “beliefs,” I mean the inferences or judgments people make based on their perceptions. People may form politically convenient beliefs because a partisan perceptual screen encourages them to see the world in a biased manner, but they could also form biased beliefs because partisanship warps the conclusions they draw from a less biased set of underlying perceptions. In a handful of cases, perceptions and beliefs could be synonymous. If Roy read and remembers a news story about the unemployment rate, he may draw only from his memory of the numbers in that news story when answering the question. Theories of the survey response counsel that more often, people form beliefs on the spot based on underlying perceptions (Tourangeau, Rips, and Rasinski Reference Tourangeau, Rips and Rasinski2000; Zaller Reference Zaller1992). According to this view, the typical survey response regarding a specialized topic like the unemployment rate is best viewed as a summary judgment based on considerations that the respondent thinks are relevant, such as personal experience and beliefs about government competence.
For some substantive questions, the difference between the two accounts determines the importance of expressive responding. The difference matters a great deal for summary evaluations that are relevant to government performance, such as general economic and social conditions (Bartels Reference Bartels2002). Such questions require people to make inferences based on a range of relevant perceptions, including personal experience and information they learn from the media or their social networks. Similarly, the difference matters for studies of media literacy—for example, the ability to discern whether headlines are accurate or inaccurate (Jakesch, Naaman, and Macy Reference Jakesch, Naaman and Macy2022; Rathje et al. Reference Rathje, Roozenbeek, Van Bavel and van der Linden2023) or distinguish between factual and opinion statements (Graham and Yair Reference Graham and Yair2025). While misreporting would distort such measures of media literacy, congenial inference could affect the analogous real-world activity and would thus be a desirable component of survey responses.
In other cases, the difference between the two accounts does not matter much. In particular, the difference does not matter for assessing the extent to which partisanship acts as a perceptual screen. Misreporting and congenial inference would both result in survey responses that paint a distorted picture of the underlying considerations or information that people hold in their memories—above and beyond whatever partisan bias was at play when that information was encountered. Regardless of which account better explains expressive responding, measures that are less affected by expressive responding are better measures of perceptions. In general, the question of substantive importance comes down to how the motivations that shape survey responses align with the corresponding real-world belief or behavior.
In sum, whereas the misreporting explanation holds that people intentionally choose survey responses that do not match their underlying perceptions, the congenial inference explanation holds that this same outcome emerges from biased reasoning. Though both accounts imply that survey responses are more biased than underlying perceptions, they differ in their implications for research on partisan bias in political judgments, which may be affected by the same sources of bias that would produce congenial inferences in surveys.
TECHNIQUES FOR STUDYING EXPRESSIVE RESPONDING
Researchers use a variety of techniques to detect and quantify expressive responding. These techniques vary in terms of which reasons for expressive responding they target, as well as other possible pathways through which they could affect responses. This section reviews the techniques used in previous research and plausible reasons for their effects. Table 1 summarizes this discussion and links it to the previous section’s example of Roy, a Republican whose underlying perceptions suggest that the economy is doing well under a Democrat president but who nonetheless says in a survey that it is doing poorly.
Techniques for Studying Expressive Responding

Payment for correct answers (pay-for-correct). The most popular method for studying partisan expressive responding in the United States is to offer randomly selected respondents financial incentives in exchange for correct answers. This could reduce either misreporting or congenial inference. Bullock et al. (Reference Bullock, Gerber, Hill and Huber2015) focus on misreporting, coining the term “partisan cheerleading” to describe their findings. They present a model in which payment increases incentives to be honest, outweighing expressive benefits. Prior, Sood, and Khanna (Reference Prior, Sood and Khanna2015, 493) suggest three reasons why people’s survey responses may be more partisan than “the information [they hold] in their memory”: the accessibility of information in memory, the on-the-spot inferences drawn from it, and insincere misreporting. The first two reasons fall under congenial inference.
Payment for correct answers could plausibly affect responses through other pathways as well. I refer to these as threats because they would not be consistent with any reasonable definition of expressive responding. For one, payment could motivate respondents to look up the correct answers. Bullock et al. (Reference Bullock, Gerber, Hill and Huber2015) and Prior, Sood, and Khanna (Reference Prior, Sood and Khanna2015) make an effort to address this concern using a combination of question timers, “catch” questions that are hard to answer correctly without cheating, and self-reports. These efforts are likely to be somewhat but not completely effective (Graham Reference Graham2024; Reference Graham2025a). Fortunately, one would expect cheating to make both Democrats and Republicans answer more accurately. Since expressive responding studies code the two parties’ responses in opposite directions or subtract them from one another, each party’s increase in cheating at least partly cancels out the other’s (Appendix B2 of the Supplementary Material elaborates). Accordingly, cheating is most likely to be a serious concern in an analysis that only examines one political party. Cheating is also not a concern if the correct answer is hard or impossible to look up. For example, Allcott et al. (Reference Allcott, Boxell, Conway, Gentzkow, Thaler and Yang2020) and Graham and Yair (Reference Graham and Yair2024) offer financial incentives to correctly predict the future, meaning that the correct answers could not have been looked up at the time of the survey.
Payment for correct answers could also induce a form of demand effects, motivating respondents to try to anticipate the researcher’s beliefs about the correct answer rather than relying on their own beliefs. This threat is plausibly circumvented by selecting questions with clear and indisputable referents. For example, given partisan controversy over what counts as the true unemployment rate (Vavreck Reference Vavreck2014), question wording could specify the researcher’s interest in the official unemployment rate as defined by the Bureau of Labor Statistics. Researchers also sidestep demand effects by avoiding pay-for-correct experiments in cases when respondents’ preferred source of truth could diverge from researchers’—for example, political rumors (Berinsky Reference Berinsky2018).Footnote 1
Requests and pledges. Researchers also use requests to respond honestly or accurately. As with payment for correct answers, honesty encouragement can be framed as increasing incentives to be sincere (Berinsky Reference Berinsky2018; Bullock et al. Reference Bullock, Gerber, Hill and Huber2015) or as increasing accuracy motivation (Rathje et al. Reference Rathje, Roozenbeek, Van Bavel and van der Linden2023). The appeal of honesty encouragement is its ability to credibly rule out threats to inference. Given the lack of financial incentives, it seems unlikely to encourage cheating. Because honesty encouragement does not tie anything to the researcher’s perception of what is correct, it also seems less likely to induce demand effects.
Asking the unasked question. The theory of response substitution gives rise to another paradigm for studying expressive responding. Response substitution is the idea that people sometimes misreport their beliefs because they want to answer a different question than the one that was asked. Gal and Rucker (Reference Gal and Rucker2011) give the example of a restaurant with terrible food and great service. If asked at the end of the meal about the quality of the service, one might say “terrible” in order to express their disapproval of the food. But if given a chance to rate the food, one might rate the service more honestly. Researchers who apply this paradigm seek to anticipate and ask the “unasked question” that the respondent wants to answer (Yair and Huber Reference Yair and Huber2020; Yair and Schaffner Reference Yair and Schaffner2022).Footnote 2 For example, Democrats and Republicans often claim that opinions they agree with are facts (Mitchell et al. Reference Mitchell, Gottfried, Barthel and Sumida2018). This tendency is reduced when partisans are first given the opportunity to state their agreement or disagreement with the statement (Graham and Yair Reference Graham and Yair2025). Such interventions aim to reduce misreporting without altering the motivational structure that could produce congenial inferences.
Although unasked question treatments can more credibly rule out congenial inference, they also raise a different set of threats to inference. One is priming. Answering the unasked question could change responses by priming respondents to call to mind considerations that they would not otherwise have thought about. Graham and Yair (Reference Graham and Yair2025) argue that priming is unlikely in their case, as the instructions and question wording already made extensive reference to the agreeableness of the statements. Another threat is that asking the unasked question may clarify the intent of the original question. Under this interpretation, asking unasked questions signals to the respondent that the researchers intend them to exclude considerations that might otherwise have seemed relevant. This concern is not typically addressed in the design. Yair and Huber (Reference Yair and Huber2020) and Graham and Yair (Reference Graham and Yair2025) use post-hoc analysis to argue that it did not affect their results.
List experiments. Researchers also use list experiments, also known as the item count technique, to study expressive responding. List experiments were originally developed to increase sincere reporting of sensitive traits like illegal behavior (Miller Reference Miller1984). Rather than asking respondents to directly answer the question of interest, researchers present respondents with a list of statements and ask how many apply to them. For a random subset of respondents, the item of interest (the “sensitive item”) is omitted from the list. The difference in the number of statements endorsed between the two lists provides an estimate of the prevalence of the trait of interest.
List experiments have been used to study a wide range of beliefs and traits. Conventional wisdom regarding when and how they work is generally divined from examining cases in which there is a statistically significant difference between the list estimate and a direct question. Among these cases are beliefs and traits that would threaten people’s self-image or self-presentation (Blair, Coppock, and Moor Reference Blair, Coppock and Moor2020), which plausibly includes political leanings. For example, Heide-Jørgensen (Reference Heide-Jørgensen2022) finds that conservatives are more likely to endorse progressive taxation in list experiments than with direct questions. Although self-image could be viewed as a source of internal expressive pressure, the mechanical fact that the treatment operates by anonymizing responses leads me to believe that it primarily operates by reducing external pressures.
Threats to inference in list experiments manifest through the characteristics of the other items in the list, which must not be too similar or different from the item of interest. If the other items are topically proximate to the item of interest, they may prime considerations that would not otherwise have been salient. If they are too different, respondents may guess the purpose of the list experiment. In addition, lists must be constructed with pairs of items that are highly negatively correlated with one another. This makes it less likely that respondents will agree with all or none of the statements, which would reveal their response about the statement of interest and break the veil of anonymity that is theorized to encourage honesty.
Implausible beliefs. This strategy takes advantage of situations in which a belief is so unlikely to be sincerely held that it can be ruled out by assumption. Schaffner and Luks (Reference Schaffner and Luks2018) developed the approach to study a controversy over the relative size of the crowd at Barack Obama’s and Donald Trump’s presidential inaugurations. It rained the day of Trump’s 2017 inauguration, dampening attendance for reasons unrelated to his popularity. Trump nonetheless claimed that his crowd had been larger. Schaffner and Luks showed survey respondents photos of the two crowds and asked which was larger. About 15% of Republicans picked the obviously smaller crowd, defying the plain visual evidence to express an implausible but party-congenial belief. By comparison, just 4% of Democrats picked the same. This provides strong evidence of insincere misreporting. Other possible reasons for choosing the incorrect answer seem unlikely to explain the partisan difference.Footnote 3
The key limitation of the implausible beliefs strategy is its reliance on the assumption that the belief is implausible. Effectively, the strategy observes what respondents would say in an experiment’s control condition (which includes whatever expressive responding exists) and imputes that if a treatment eliminated all expressive responding, belief in the statement would be zero. This is not usually a reasonable assumption. Consequently, to date, both studies using the technique have focused on the crowd size case (Ross and Levy Reference Ross and Levy2023; Schaffner and Luks Reference Schaffner and Luks2018).
External validation. This strategy takes advantage of situations in which surveys ask about behaviors that can be verified externally. After mail-in voting became politicized during the 2020 presidential election, Shino, Smith, and Uribe (Reference Shino, Smith and Uribe2022) asked registered voters in Florida how they usually voted. Echoing Republican politicians’ attacks on mail-in voting, a sizeable proportion of Republicans who usually voted by mail claimed that they usually voted in person. This provides solid evidence of misreporting. In principle, though, self-reports could be inconsistent with administrative records because people forget what they did and fill gaps in their memory with congenial inferences. For the meta-reanalysis, I mitigate this concern by focusing only on respondents who voted the same way in all four elections.
Summary. Altogether, considering the alignment between techniques, mechanisms, and threats yields a few key insights. These are clearest in view of Table 2, which summarizes my assessment of the plausibility of each possible pathway for each technique. First, whereas the initial round of expressive responding studies did not use techniques that could distinguish between misreporting and congenial inference, subsequently developed techniques are more equipped to rule out the pathways associated with the congenial inference account. This does not mean that congenial inference never happens but does suggest that misreporting sometimes happens. Second, different strategies vary in their susceptibility to threats to inference. One might think that requests have smaller effects than payment for correct answers because payment is “stronger” than simply asking, but payment also has stronger potential to activate theoretically irrelevant pathways. Third, the techniques that are most limited in terms of their perceived strength or applicability (requests and pledges, implausible beliefs, external validation) are also the least susceptible to threats to inference. Despite their limitations, these techniques play an important role by clearly establishing that the theorized mechanisms operate in at least some cases.
Summary of Possible Mechanisms and Threats to Inference

Note: Table summarizes the “Techniques for Studying Expressive Responding” section. “Plausible” indicates a plausible mechanism that is consistent with expressive responding theory. “Unlikely” indicates a mechanism that is probably not present. “Depends” indicates a pathway whose plausibility depends on implementation details (e.g., topic, question wording, timing).
META-REANALYSIS
To learn more about the issues raised above, I conduct a meta-reanalysis of 52 treatments in 44 studies from 25 articles or preprints. Meta-reanalysis differs from traditional meta-analysis in its use of the raw data (Galos and Coppock Reference Galos and Coppock2023). With help from research assistants, I collected data from each study’s replication file or original author. I then harmonized the data structure across studies, specified common scoring rules and estimation strategies, separately calculated the quantities of interest for each study, and used random effects meta-analysis to aggregate the study-by-study estimates. Two benefits of this approach are to (1) force an examination of the original estimation strategies and their relationship to one another and (2) permit analysis that was not part of the original studies, including heterogeneous effects.
Figure 1 displays a timeline of all of the included studies by technique (y-axis) and the start date of the study (x-axis). Prior, Sood, and Khanna (Reference Prior, Sood and Khanna2015) conducted the first study of expressive responding in the United States in 2004 and in 2008 were also the first to use a request or pledge. Berinsky (Reference Berinsky2018) and Nyhan (Reference Nyhan2020) brought list experiments (well established in other contexts) into the study of US partisan bias in 2012. Yair and Huber (Reference Yair and Huber2020) and Schaffner and Luks (Reference Schaffner and Luks2018) debuted the unasked question and implausible belief techniques in winter 2015–16. Most recently, Shino, Smith, and Uribe (Reference Shino, Smith and Uribe2022) introduced the external validation method.
Timeline of Included Research
Note: Dots represent studies; x-axis is the start date of the study as reported in the original articles or preprints; y-axis is the technique used to study expressive responding. Vertical lines connect studies that used multiple techniques.

Scoring Rules
Existing research quantifies expressive responding in two main ways: partisan differences and congenial responding. In both cases, researchers begin by preprocessing the data based on a conception of which end of the response scale is more congenial to which party. For example, to quantify partisan differences, Bullock et al. (Reference Bullock, Gerber, Hill and Huber2015) coded all responses so that “the most Republican response to each question (either the largest or smallest response) is coded as 0 [and] the most Democratic response is coded as 1” and then estimated the average difference between Democrats and Republicans. To quantify party-congenial responding, Prior, Sood, and Khanna (Reference Prior, Sood and Khanna2015) scored each response as a congenial error, approximately correct, or an uncongenial error, and then subtracted the proportion of congenial and uncongenial errors. This procedure is equivalent to scoring the responses as a 1, 0, or −1 and taking the average.Footnote 4
Though the use of different scoring rules in different studies looks thorny, measures of partisan difference and congenial responding turn out to be closely related to one another. Across the study-by-study estimates in Table A1, the correlation between the estimated effects on partisan differences and congenial responding is 0.91. To provide a deeper sense of the relationship between the two measures, Appendix B1 of the Supplementary Material examines them analytically. Effects on both measures can be expressed as averages of the conditional average treatment effects among Democrats and Republicans. Effects on partisan differences weight the two parties equally, while effects on congenial responding weight each party by its proportion of the sample. Consequently, estimated effects on congenial responding are sensitive to chance differences in the proportion of Democrats and Republicans who are randomly assigned to each treatment condition, while estimated effects on partisan differences are not. These features explain why the two approaches yield slightly different estimates from study to study but average out to similar magnitudes in the meta-analysis.
One advantage of the response congeniality measure is that it can be used in studies that only include one party. This applies to three of the 44 studies (Fahey Reference Fahey2023; Graham and Yair Reference Graham and Yair2024, Study 1; Nyhan Reference Nyhan2020) and four of the 52 treatments. These studies are included in the congenial responding estimates but excluded from the partisan difference estimates.Footnote 5
Data
With help from research assistants, I obtained data from 25 previously published articles or preprints. These contain 44 total studies conducted in the United States.Footnote 6 I harmonized the data structure so that each row contains one respondent’s answer to one survey question. For example, a study with 10 questions has 10 rows per respondent. In total, the data contain about 250,000 responses from 71,000 respondents, of whom 63,000 indicated a partisan preference (for data, see Graham Reference Graham2026).
To support the analysis of heterogeneous effects, I worked with a research assistant (Binh Hoang) to identify respondent-, question-, and study-level characteristics whose coding could be harmonized across a clear majority of studies. We identified six respondent characteristics that appeared in most replication archives: age, educational attainment, gender, race, Hispanic ethnicity, and strength of partisan identity. We obtained these variables for additional studies through personal communications with the authors. We also inspected appendices and replication archives for study characteristics, including field dates, sample provider, question wording, and response scales.
Estimation
For most techniques, treatment effects can be estimated using linear regression. To estimate effects on partisan differences, I estimate
 $$ {YR}_{ik}={\displaystyle \begin{array}{l}{\beta}_0+{\beta}_1{\mathrm{Republican}}_i+{\beta}_2{\mathrm{Treatment}}_i\\ {}+\hskip2px {\beta}_3{\mathrm{Republican}}_i\times {\mathrm{Treatment}}_i+{\epsilon}_{ik},\end{array}} $$
where $ i $
indexes respondents,
$ i $
indexes respondents, $ k $
indexes questions,
$ k $
indexes questions, $ {YR}_{ik} $
is a survey response coded from 0 (most Democratic response option) to 1 (most Republican response option), Republican
$ {YR}_{ik} $
is a survey response coded from 0 (most Democratic response option) to 1 (most Republican response option), Republican $ {}_i $
is a Republican indicator, and Treatment
$ {}_i $
is a Republican indicator, and Treatment $ {}_i $
is a treatment indicator. This matches the estimation strategy used by Bullock et al. (Reference Bullock, Gerber, Hill and Huber2015). The key parameters are
$ {}_i $
is a treatment indicator. This matches the estimation strategy used by Bullock et al. (Reference Bullock, Gerber, Hill and Huber2015). The key parameters are $ {\beta}_1 $
, the partisan difference in the control group, and
$ {\beta}_1 $
, the partisan difference in the control group, and $ {\beta}_3 $
, the treatment effect on partisan differences. Because each observation is a respondent
$ {\beta}_3 $
, the treatment effect on partisan differences. Because each observation is a respondent $ \times $
question pair, I cluster standard errors by respondent. For congenial responding, I estimate
$ \times $
question pair, I cluster standard errors by respondent. For congenial responding, I estimate
 $$ {YC}_{ik}={\beta}_0+{\beta}_1{\mathrm{Treatment}}_i+{\epsilon}_{ik} $$
where $ {YC}_{ik} $
is a survey response coded from −1 (least party-congenial response option) to 1 (most party-congenial response option) and all other terms are defined above. The key parameters are
$ {YC}_{ik} $
is a survey response coded from −1 (least party-congenial response option) to 1 (most party-congenial response option) and all other terms are defined above. The key parameters are $ {\beta}_0 $
, which is congenial responding in the control group, and
$ {\beta}_0 $
, which is congenial responding in the control group, and $ {\beta}_1 $
, the treatment effect on congenial responding. The scoring rule is equivalent to the estimation strategy used by Prior, Sood, and Khanna (Reference Prior, Sood and Khanna2015), which conveniently makes the theoretical range of
$ {\beta}_1 $
, the treatment effect on congenial responding. The scoring rule is equivalent to the estimation strategy used by Prior, Sood, and Khanna (Reference Prior, Sood and Khanna2015), which conveniently makes the theoretical range of $ YC $
match the theoretical range of
$ YC $
match the theoretical range of $ YR $
(Appendix B1 of the Supplementary Material).
$ YR $
(Appendix B1 of the Supplementary Material).
Some designs require modifications to this strategy. For implausible beliefs, the assumption that nobody believes it implies that if a treatment were to eliminate expressive responding, everyone would answer correctly. I impute the missing potential outcome under this assumption. For the partisan differences outcome, the correct response (that more people were in the picture of Obama’s crowd) is the least Republican response: $ {YR}_i=0\hskip0.35em \forall i\hskip-0.25em $
. For the congenial responding, the correct response is the most congenial response for Democrats (
$ {YR}_i=0\hskip0.35em \forall i\hskip-0.25em $
. For the congenial responding, the correct response is the most congenial response for Democrats ( $ {YC}_i=1 $
if
$ {YC}_i=1 $
if $ i $
is a Democrat) and the least congenial for Republicans (
$ i $
is a Democrat) and the least congenial for Republicans ( $ {YC}_i=-1 $
if
$ {YC}_i=-1 $
if $ i $
is a Republican). For the list experiments, I bootstrap the direct question estimate, the list experiment estimate, and the difference between them.
$ i $
is a Republican). For the list experiments, I bootstrap the direct question estimate, the list experiment estimate, and the difference between them.
After computing the study-by-study estimates, I aggregate across studies by conducting a meta-analysis. I begin this step by extracting the relevant estimates and standard errors. This table of estimates has one estimate and standard error per treatment condition, meaning that studies with multiple treatment conditions contribute more than one estimate. Using these estimates, I conduct a random effects meta-analysis using the meta package in R (Schwarzer, Carpenter, and Rücker Reference Schwarzer, Carpenter and Rücker2015). To account for the fact that some estimates share the same control group, I cluster the meta-analysis at the level of the study. In the analysis of heterogeneous effects, I repeat the procedure within each category of respondents, questions, or studies.
EFFECTS ON PARTISAN BIAS
To place partisan bias in context, I begin by comparing the average Democrat’s and Republican’s response to each question. In total, there are 242 study $ \times $
question pairs and 525 study
$ \times $
question pairs and 525 study $ \times $
question
$ \times $
question $ \times $
treatment combinations. For each combination, Figure 2 plots the average response among Democrats and Republicans on a 0 to 1 scale from most Democratic to most Republican (above,
$ \times $
treatment combinations. For each combination, Figure 2 plots the average response among Democrats and Republicans on a 0 to 1 scale from most Democratic to most Republican (above, $ YR $
). The black dots and smoothed line represent the control means for each question. The orange triangles and dashed smoothed line represent the treatment group means. The thin black 45-degree line represents an absence of partisan bias. Almost all of the dots appear above the 45-degree line, indicating that partisan bias is observed on almost all questions. The dashed line is modestly closer to the 45-degree line, loosely indicating that treatment tends to reduce partisan bias.
$ YR $
). The black dots and smoothed line represent the control means for each question. The orange triangles and dashed smoothed line represent the treatment group means. The thin black 45-degree line represents an absence of partisan bias. Almost all of the dots appear above the 45-degree line, indicating that partisan bias is observed on almost all questions. The dashed line is modestly closer to the 45-degree line, loosely indicating that treatment tends to reduce partisan bias.
Average Response by Question, Party, and Treatment Condition
Note: Each dot represents one question in one treatment condition from one study. Both axes are coded on a 0 to 1 scale from the most Democratic response to the most Republican response (in the text, $ YR $
). The x-axis is the average response for a Democrat; the y-axis, for a Republican. The thin 45-degree line corresponds to no partisan difference. Appendix A4 of the Supplementary Material displays a version of this figure with arrows connecting each study’s treatment and control groups.
$ YR $
). The x-axis is the average response for a Democrat; the y-axis, for a Republican. The thin 45-degree line corresponds to no partisan difference. Appendix A4 of the Supplementary Material displays a version of this figure with arrows connecting each study’s treatment and control groups.

The question-by-question estimates suggest that even within a universe of questions that is intentionally selected based on the suspicion of partisan bias, there is also a strong common component to people’s beliefs. Across the 242 questions, the correlation between Democrats’ and Republicans’ beliefs is 0.81 in the control conditions and 0.86 in the treatment conditions. This suggests that partisan bias is a modest component of what people believe.
To aggregate across questions, I begin by estimating treatment effects within each study using both measures of partisan bias discussed above. The full set of estimates appears in the top panel of Figure 3. Across the 48 estimated effects on partisan differences, 39 (81%) are negative and 20 (42%) are statistically significant. Across the 52 response congeniality estimates, 41 (78%) are negative and 16 (31%) are statistically significant. The largest estimates are in the −0.10 to −0.15 range, while the smallest tend to be close to 0. One estimate is statistically significant in the unanticipated direction (Fahey Reference Fahey2023, unasked question).
Effects by Study and Technique
Note: Figure displays treatment effects on two measures of partisan bias, partisan differences and congenial responding. The y-axis lists studies in order of the start date of the survey (the same temporal order as Figure 1). Dots are point estimates. Horizontal bars are 95% confidence intervals. Standard errors clustered by respondent. Tables A1 and A2 in the Supplementary Material present the same estimates in tabular form.

To aggregate across studies, I conduct a random effects meta-analysis. The results are summarized in Figure 3 and presented fully in Table A2 in the Supplementary Material. In the treatment conditions, partisan differences and congenial responding each shrink by −0.047 (s.e. = 0.007). Both estimates are equal to about 25% of the “baseline” difference observed in the control group. Treatment effects vary across studies. The estimated standard deviation of the effect sizes, known as $ \tau $
, is 0.031 for effects on congenial responding and 0.030 for effects on partisan difference. Cochran’s
$ \tau $
, is 0.031 for effects on congenial responding and 0.030 for effects on partisan difference. Cochran’s $ Q $
is 125 for the congenial responding estimates and 124 for the partisan difference estimates, which is statistically significant in both cases (
$ Q $
is 125 for the congenial responding estimates and 124 for the partisan difference estimates, which is statistically significant in both cases ( $ p<0.0001 $
).
$ p<0.0001 $
).
The strongest evidence for expressive responding comes from the 23 pay-for-correct treatments, which on average reduce partisan bias by 0.060 to 0.063, about one-third of the baseline, with some heterogeneity ( $ \tau $
= 0.021 and 0.016,
$ \tau $
= 0.021 and 0.016, $ p $
-value for Cochran’s
$ p $
-value for Cochran’s $ Q $
= 0.031 and 0.105; Table A2 in the Supplementary Material). The implausible belief and external validation techniques also provide strong evidence based on a small number of studies. For the second- and third-most common techniques, asking the unasked question (5 articles, 12 studies) and requests or pledges (6 articles, 9 studies), the estimates are consistent with smaller effects of about −0.02. There is little evidence of heterogeneity among request/pledge studies, which is consistent with the idea that these treatments are broadly applicable but weak (Table 2). In contrast, there is clear evidence of heterogeneity among unasked question treatments, which is consistent with the notion that the treatment must be well targeted at a sentiment that people want to express instead (Table 2). Of the five articles using unasked question treatments, the reanalysis only finds consistent evidence of expressive responding in one case. List experiments have been the least “successful” technique, with no evidence for expressive responding in the meta-analysis or in any single study.
$ Q $
= 0.031 and 0.105; Table A2 in the Supplementary Material). The implausible belief and external validation techniques also provide strong evidence based on a small number of studies. For the second- and third-most common techniques, asking the unasked question (5 articles, 12 studies) and requests or pledges (6 articles, 9 studies), the estimates are consistent with smaller effects of about −0.02. There is little evidence of heterogeneity among request/pledge studies, which is consistent with the idea that these treatments are broadly applicable but weak (Table 2). In contrast, there is clear evidence of heterogeneity among unasked question treatments, which is consistent with the notion that the treatment must be well targeted at a sentiment that people want to express instead (Table 2). Of the five articles using unasked question treatments, the reanalysis only finds consistent evidence of expressive responding in one case. List experiments have been the least “successful” technique, with no evidence for expressive responding in the meta-analysis or in any single study.
Pinpointing reasons for cross-study heterogeneity is difficult due to a lack of within-study variation in topic and technique. Of the 44 studies, only eight use multiple techniques. Half of these are variations of the same strategy; when variants are lumped into the categories from Tables 1 and 2, the number using multiple techniques falls to 4. Topics are also heavily concentrated within studies. Using a coding scheme that places each question from each study in one of 18 topic areas (Appendix C of the Supplementary Material), 29 of the 44 studies cover only one topic area. No topic is covered in more than 25% of studies. This lack of within-study variation means that for any given comparison, one is simultaneously varying technique, substantive topic, time, and sample characteristics. This may be an unavoidable feature of the techniques used to study expressive responding: as explained above, most carry scope conditions that limit their applicability (Table 2).
Despite the overlap between topic and technique, it is still informative to examine the topic areas for which existing evidence for expressive responding is strongest and weakest—with the understanding that evidence regarding one topic may be stronger than another due to idiosyncrasies in the relationship between topic and technique rather than politically relevant features of the topics. Figure 4 presents the results of a topic-by-topic version of the meta-reanalysis using the 18-category scheme mentioned above. Evidence for expressive responding is strongest when it comes to economic conditions, guns, immigration, minor news events (mostly driven by Jakesch, Naaman, and Macy Reference Jakesch, Naaman and Macy2022 and Rathje et al. Reference Rathje, Roozenbeek, Van Bavel and van der Linden2023), presidential traits like popularity and age, and voting method (exclusively Shino, Smith, and Uribe Reference Shino, Smith and Uribe2022). The evidence is weakest with respect to COVID-19, party composition (exclusively Ahler and Sood Reference Ahler and Sood2018), and dating preferences (exclusively Yair and Huber Reference Yair and Huber2020, whose analysis emphasizes subgroup effects). Every other topic sits in a gray area: there is at least weak suggestive evidence for expressive responding but not enough to confidently declare it present or absent. Although the sum of this evidence suggests that expressive responding is probably present in a wide range of topic areas, it provides little basis for conclusions regarding the relationship between expressive responding and substantive features of the topics.Footnote 7
Effects by Topic
Note: Figure displays treatment effects (x-axis) by substantive topic (y-axis) based on the 18-category coding scheme described in Appendix C of the Supplementary Material. Columns to the left list the number of studies and articles that use each sample type, as well as the number of unique questions in those articles (i.e., questions that are repeated in multiple studies are not double-counted). Table A3 in the Supplementary Material presents the same estimates in tabular form. Table A5 in the Supplementary Material lists each question and its topical category.

HETEROGENEOUS EFFECTS
Treatment effect heterogeneity is often of interest to researchers but is challenging to learn about. Estimates of subgroup effects and differences in effects have larger standard errors, making precise comparisons difficult. Meta-analysis helps overcome this by combining information from many studies. Meta-reanalysis accentuates this benefit by making it possible to include studies that did not originally report a given quantity (Galos and Coppock Reference Galos and Coppock2023).
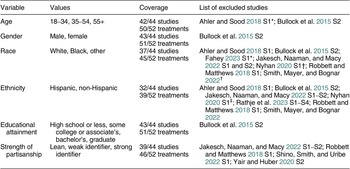
In the present case, the opportunity for a deeper and more precise examination of heterogeneity has two benefits. First, theory-testing. As explained below, both leading accounts of expressive responding imply that people with stronger partisan identities and higher levels of education should be more prone to expressive responding. Second, generalizability. Existing research is mostly conducted in nonprobability samples and uses a wide range of response scales, raising questions about whether effects generalize across samples or are limited to particular question types. Accordingly, this section breaks down the results according to six respondent characteristics whose codings could be harmonized across a large majority of studies (strength of partisan identity, educational attainment, age, gender, race, and Hispanic ethnicity; Table 3) as well as two study characteristics (sample type and response scale). The more similar the results across the various categories, the less reason to worry that expressive responding depends on respondent or study characteristics.
Variables and Coverage for Heterogeneous Effects Analysis

Note: *Collected in the original study but less than 10 respondents in the smallest category × treatment condition. †Collected as part in the original study but only available values are white and non-white. ‡Original study only sampled white, non-Hispanic respondents. All other exclusions indicate that the variable was not collected as part of the original study.
Strength of Partisan Identity
Strength of partisan identity is relevant to both theories of expressive responding. The congenial inference account revolves around directional motivations, which are thought to be rooted in identities (Leeper and Slothuus Reference Leeper and Slothuus2014). Accordingly, one might expect people with stronger partisan identities to have a greater tendency to engage in expressive responding. The misreporting account does not specify any particular source of insincerity beyond partisanship. Despite this, it seems likely that people with stronger partisan identities have more self-image at stake (internal motivations) and have more fun being a partisan cheerleader (external motivations). Given this, finding that effects are increasing in partisan identity strength would add to the credibility of both theories. Conversely, a lack of such heterogeneity would suggest a need to develop alternative explanations that have weaker connections to identity.
Little evidence emerges that expressive responding is more pronounced among people with stronger partisan identities (Figure 5, bottom right). When partisan bias is measured in terms of congenial responding, the estimated effects are −0.038 among leaners, −0.045 among weak partisans, and −0.042 among strong partisans. All estimates are within one standard error of the others. When partisan bias is measured in terms of partisan differences, the effects range from −0.032 to −0.048, with the point estimates increasing in strength of partisanship—a hint of the expected heterogeneity. However, the largest difference, between leaners and strong partisans, is not statistically significant (two-tailed $ p $
= 0.13). Moreover, the appearance of heterogeneity vanishes when the effect sizes are compared to the baseline differences observed in the control group. Among leaners, the treatment effect estimate amounts to a 17% reduction relative to the baseline (−0.032/0.163);Footnote
8 among weak partisans, 27% (−0.041/0.155); and among strong partisans, 21% (−0.049/0.234). Using the response congeniality measure, strong partisans have the smallest effect relative to the baseline (−0.042/0.242, a 17% reduction). Despite the slight hint of the expected heterogeneity, these results ultimately amount to a poor showing for the two theories’ clearest prediction regarding heterogeneous effects.
$ p $
= 0.13). Moreover, the appearance of heterogeneity vanishes when the effect sizes are compared to the baseline differences observed in the control group. Among leaners, the treatment effect estimate amounts to a 17% reduction relative to the baseline (−0.032/0.163);Footnote
8 among weak partisans, 27% (−0.041/0.155); and among strong partisans, 21% (−0.049/0.234). Using the response congeniality measure, strong partisans have the smallest effect relative to the baseline (−0.042/0.242, a 17% reduction). Despite the slight hint of the expected heterogeneity, these results ultimately amount to a poor showing for the two theories’ clearest prediction regarding heterogeneous effects.
Effects by Respondent Characteristics
Note: Dots are meta-analytic estimates of the conditional average treatment effect for the subgroup on the x-axis. Vertical bars represent 95% confidence intervals. The “all categories” estimates pool all respondents who are included in one of the categories to the right. Table A4 in the Supplementary Material presents the same estimates in tabular form.

Educational Attainment
Educational attainment provides another opportunity to check predictions derived from the two theories. Both accounts depend on a respondent’s awareness of which response options are more or less favorable to one’s partisan team. For example, in order to cheerlead or make a congenial inference about the unemployment rate, one must know that high unemployment rates are bad and that observers of politics are likely to credit or blame the president’s party for whatever happens to unemployment. In other domains, more-educated people have a better sense of “what goes with what” (Bishop Reference Bishop1976).
The congenial inference account provides a second reason to expect heterogeneity by educational attainment. Theories of motivated reasoning ascribe a role to cognitive resources: one who is more skilled at reasoning and critical thinking is likely to be more capable of engaging in the mental acrobatics required to make a congenial inference (Joslyn and Haider-Markel Reference Joslyn and Haider-Markel2014).Footnote 9 Whereas the “what goes with what” line of reasoning provides both accounts with a reason to expect effects to increase in education, cognitive resources are only clearly relevant to congenial inference. Given this, heterogeneous effects by education provide another opportunity to check a prediction that is consistent with both accounts, with higher stakes for congenial inference.
No evidence emerges to suggest that a higher level of education predicts a greater tendency to engage in expressive responding (Figure 5, bottom left). Using the congenial responding measure, the point estimates of the treatment effects decrease monotonically in educational attainment, from −0.058 among those with a high school degree or less to −0.043 among those with a graduate degree. Only one pair of point estimates is more than one standard error apart (and even in that case, by only 0.001). The point estimates based on the partisan difference measure decrease almost monotonically, from −0.058 in the high school or less category to −0.043 among bachelor’s degree holders and −0.044 among those with graduate degrees. No pair of estimates is more than one standard error apart. Expressing effects relative to the baseline diminishes the appearance of heterogeneity in the unexpected direction: at baseline, partisan bias is largest among the less-educated categories (Table A4 in the Supplementary Material), making the relative effects more similar than the absolute effects.
Age, Gender, Race, and Ethnicity
The remaining background characteristics that could be coded across a substantial majority of studies were age, gender, race, and ethnicity. Although accounts of expressive responding do not make clear predictions about heterogeneity according to these traits, examining heterogeneous effects can also be informative as to the importance of representative samples. In general, two conditions must be met for a treatment effect estimate to be unrepresentative: (1) the study population must be different from the population of interest and (2) the characteristics that define those differences must also predict treatment effect heterogeneity (Huber and Graham Reference Huber and Graham2025). To the extent that treatment effects are homogeneous across different types of people, the second condition is not met, making it more reasonable to draw inferences about the general population.
Little evidence of heterogeneity emerges according to age (Figure 5, top left). Charitably, there is perhaps some suggestive evidence that expressive responding is more pronounced among the young. Using the congenial responding measure, the point estimates decrease monotonically in age but are always within one standard error of one another. The picture is similar with the partisan difference measure, with a slightly larger difference between the youngest and oldest respondents. When effect sizes are expressed relative to the control group, the evidence for heterogeneity appears a bit stronger. For example, using the partisan difference measure, the treatment effect among 18–34-year-olds is almost one-third of the baseline (−0.053/0.160), whereas the effect among 55-year-olds and above is only about one-sixth of the baseline (−0.039/0.223).
There is no evidence of heterogeneity by gender (Figure 5, top middle-left). The point estimates are nearly identical using both measures. Using the congenial responding measure, the estimate for men is slightly higher (−0.051 versus −0.045). Using the partisan difference measure, the point estimates are equal (−0.048).
There is evidence of heterogeneity by race, particularly between Black and white respondents (Figure 5, top right). Point estimates for white respondents are slightly higher than the overall average treatment effect estimate (−0.057 and −0.052). For Black respondents, the congenial responding measure is one-third the magnitude of the estimate for white respondents (−0.019); the partisan difference measure was dropped because many studies had few or no Black Republicans. The difference between Black and white respondents is statistically significant (two-tailed $ p $
= 0.03). In addition, Black respondents answer more congenially at baseline; the effect size for Black respondents is less than 10% of the baseline (−0.019/0.279), while for white respondents it is nearly one-third of the baseline (−0.057/0.186). The point estimates for respondents of other races fall between those of white and Black respondents (−0.036 with both measures), with no statistically significant differences. In terms of ethnicity, point estimates are slightly lower for Hispanics than for non-Hispanics, but the differences are not statistically significant.
$ p $
= 0.03). In addition, Black respondents answer more congenially at baseline; the effect size for Black respondents is less than 10% of the baseline (−0.019/0.279), while for white respondents it is nearly one-third of the baseline (−0.057/0.186). The point estimates for respondents of other races fall between those of white and Black respondents (−0.036 with both measures), with no statistically significant differences. In terms of ethnicity, point estimates are slightly lower for Hispanics than for non-Hispanics, but the differences are not statistically significant.
The evidence of heterogeneity by race and the hint of heterogeneity by age suggest that demographically representative samples are important to the study of expressive responding. It also suggests that differential tendencies to engage in expressive responding may sometimes cause researchers to underestimate differences in partisan bias between different demographic subgroups. However, there is not sufficient evidence of heterogeneity to dismiss expressive responding as a concern based on the composition of one’s sample. Since there is at least suggestive evidence of expressive responding in every category, a study that over- or underrepresents one category or another is unlikely to be dramatically more or less affected by expressive responding.
Sample Type
For a more direct look at the importance of sample type, Appendix A2 of the Supplementary Material breaks the analysis down according to the type of sample. Based on the study metadata, I broke the studies down into four categories. Probability samples (five studies) are the gold standard in survey research. Although they can still be unrepresentative due to differential non-response, respondents to such studies are selected for recruitment with known probability from a well-defined sampling frame, giving them the most credible claim to representativeness that is possible in survey research. Among nonprobability samples, two vendors at opposite ends of the reputational spectrum (8 YouGov studies, 16 Mechanical Turk studies) were common enough to merit their own categories. The remaining 15 studies were categorized as “other nonprobability.”
No evidence of heterogeneity by sample type emerges (Figure A1 in the Supplementary Material). In absolute terms, the largest point estimate comes from YouGov studies while the smallest comes from the Mechanical Turk studies. As a percentage of the baseline, the largest point estimate comes from the probability sample studies. Although no category of studies is statistically significantly different than the others, it is reassuring to find similar point estimates in each category. Consequently, although more than one-third of existing studies of expressive responding were conducted on Mechanical Turk, there is no basis to conclude that expressive responding is an artifact of unusual responses to treatment in lower-quality samples.
Scale Type
Rounding out the analysis of heterogeneity, Appendix A3 of the Supplementary Material splits the analysis into five categories based on the response scale: two scale points (binary), three to five scale points, six to eight scale points, sliders, and open-ended questions. There is no evidence of heterogeneity (Figure A2 in the Supplementary Material). The clearest evidence emerges in the binary, three to five, and six to eight scale point categories, which are the most common. All are similar in magnitude to the overall average and easily attain statistical significance. The estimates for sliders and open-ended questions are similar in magnitude but less precise and are not statistically significant. Consequently, although there is no evidence of heterogeneity by type of response scale, there is also only weak evidence for expressive responding in the latter two categories.
THE PROMISE OF DESIGN-BASED MECHANISM TESTS
Although the analysis of heterogeneous effects provided two new opportunities to assess the plausibility of the leading explanations for expressive responding, neither test provided evidence in favor of either explanation. Moreover, the fact that both explanations generated the same prediction in both cases suggests that heterogeneous effects may be fundamentally limited in their ability to resolve the uncertainty regarding the nature of expressive responding. This highlights a need for design-based mechanism tests. Though existing research does not furnish enough such tests to justify meta-analysis, several previously published studies include promising features. This section examines extant research designs that shed light on the nature of expressive responding.
Future research has room to answer even the most fundamental questions about how techniques for studying expressive responding actually work. Consider the seemingly obvious notion that stronger treatments ought to have larger effects. Existing research provides limited evidence to confirm this. Neither extant experiment that varies the size of financial incentives provides convincing evidence that larger incentives result in larger treatment effects (Bullock et al. Reference Bullock, Gerber, Hill and Huber2015; Peterson and Iyengar Reference Peterson and Iyengar2022).Footnote 10 Of the three experiments that randomize some respondents to payment for correct answers and some to an honesty request, payment is no more effective in two cases (Bullock et al. Reference Bullock, Gerber, Hill and Huber2015; Prior, Sood, and Khanna Reference Prior, Sood and Khanna2015) and substantially more effective in the third case (Rathje et al. Reference Rathje, Roozenbeek, Van Bavel and van der Linden2023). If it is true that requests result in smaller treatment effects, this could be either because requests are weaker or because requests raise fewer threats to inference (Table 2). Though it seems natural to think that stronger treatments work better, all this implies is monotonicity. Too large a financial incentive could even result in enough cheating to “crowd out” the partisan difference (Appendix B2 of the Supplementary Material). A better foundation for considering the importance of treatment strength—including whether larger incentives heighten threats to inference—would be valuable.
Research designs that can help distinguish between misreporting and congenial inference are also needed. In the realm of pay-for-correct treatments, one clever strategy is to inform respondents that they will be paid for a correct answer only after they read the text of the survey question (Khanna and Sood Reference Khanna and Sood2018). This assures that congenial inference can still operate as the respondent forms their belief while also providing a financial disincentive to misreport. Unfortunately, this assumption is only credible for the first question in a study, since previously treated respondents may anticipate the incentive regardless of when it is mentioned again. A more scalable approach is to use additional dependent variables as mechanism checks. Peterson and Iyengar (Reference Peterson and Iyengar2021) allow respondents to choose which information they will use to help them answer the question and then examine the treatment’s effect on information-seeking (analogous to biased sampling; Table 2). They find no evidence that incentives change information choices, casting doubt on one pathway for congenial inference and, by extension, suggesting that misreporting is the more plausible explanation. Likewise, Graham (Reference Graham2025b) includes supplemental outcomes that measure response effort and partisan differences in reasoning. Building on strategies like these could help researchers distinguish between the two mechanisms.
There is also a need for research that probes whether techniques work as assumed. Karpowitz et al. (Reference Karpowitz, Austin, Crandall and Macias2023) find that list experiments fail to completely eliminate race-of-interviewer effects in in-person surveys, suggesting either that list experiments fail to fully eliminate external pressures or that interviewer race can also prime considerations that affect people’s on-the-spot inferences about whether they agree with the item of interest. In an exploratory analysis, Graham and Yair (Reference Graham and Yair2025) find that asking unasked questions that are more closely related to what respondents likely want to express results in larger treatment effects on classifications of factual and opinion statements. Classifications of opinion statements are more accurate when respondents are allowed to dis/agree with the statement rather than to say it is in/accurate. For classifications of factual statements, this pattern is reversed. This suggests that asking the unasked question is not simply a matter of allowing respondents to “blow off steam” (Yair and Huber Reference Yair and Huber2020). Instead, unasked questions may need to be targeted at the specific sentiment respondents want to express.
Although none of the studies discussed above resolve the question on their own, all of them constitute design-based strategies that can shed light on the nature of expressive responding. Given that almost all treatments could plausibly work through multiple pathways (Table 2) and the difficulty of generating predictions regarding patterns of heterogeneous effects that would distinguish between the two theories (Figure 5), extensions of these approaches will likely be necessary to move from “at least some of it is misreporting” to a more specific understanding of the nature of expressive responding.
DISCUSSION
To what extent does expressive responding exaggerate measured partisan bias? Across existing research, the typical treatment designed to reduce expressive responding shrinks partisan differences by about one-quarter. Given that some treatments may not be strong enough to eliminate all expressive responding, this may be an underestimate of the total effect of expressive responding. Even so, partisan bias is far from the only force shaping people’s beliefs. From question to question, Democrats’ and Republicans’ responses strongly predict one another, with correlations of 0.81 and 0.86 in the control and treatment groups. This suggests that in general, expressive responding is only a modest component of partisan bias, which itself is only a modest component of beliefs.
The analysis highlights our limited collective knowledge of the mechanisms behind what is called expressive responding, which in turn raises questions about the phenomenon’s substantive importance. Both the qualitative assessment of the alignment between theory and research design (Table 2) and the analysis of heterogeneous effects (Figure 5) point to the difficulty of pinning down the mechanism. Some studies provide clear evidence of partisan misreporting. But congenial inference is plausible in many cases, including in the most commonly used research design, payment for correct answers. A resolution would help determine whether beliefs that are affected or unaffected by expressive responding are more relevant in a particular setting. As discussed above, the mechanism question matters most for political judgments (e.g., evaluations of economic and social conditions, media literacy skills). In contrast, both explanations suggest that survey responses exaggerate the extent to which partisanship acts as a perceptual screen.
These questions regarding substantive implications are distinct from some other recent assessments. Malka and Adelman (Reference Malka and Adelman2023) conclude that because “the expressive motivation that sometimes underlies responses to factual questions is a powerful influence on real-world political behavior … making [it] operative in the survey context has advantages” (1207). Of January 6, they argue that “there is not a strong basis for expecting that those Trump supporters who say, but do not really mean, that the 2020 election was stolen will do anything but act on the political commitments that motivated them to cheerlead in the first place” (1206). Similarly, Iyengar et al. (Reference Iyengar, Lelkes, Levendusky, Malhotra and Westwood2019) write that “the correlation between vote choice and nonincentivized economic beliefs outstrips the correlation between vote choice and incentivized beliefs, suggesting that paying survey participants to be honest only results in an expensive version of cheap talk” (139). These arguments value a high correlation between beliefs and behavior over an accurate one. From a construct validity standpoint, non-believers clearly should not count as believers just because they act as one assumes a believer would act. In contrast, the argument here is that the uncertain nature of expressive responding makes it unclear whether the treated or untreated measure of belief is more relevant to particular real-world situations. This centers the measure of belief’s validity as a measure of belief, regardless of theoretical expectations about its relationship to other factors.
Looking ahead, the dependence between the suitability of research designs and the substantive details of a topic is likely to remain a persistent challenge. Most designs have some major scope condition that limits the range of applicable topics (Table 2). This may make some correlation between topic and technique inescapable, which in turn limits what existing evidence can say about how expressive responding varies by topic and technique. If so, the best way to make the most of our limits may be to stay attuned to the substantive details of political events. Some of the clearest evidence that partisans sometimes misreport their beliefs comes from highly situational research designs: a visual comparison of crowd sizes (Schaffner and Luks Reference Schaffner and Luks2018) and a partisan controversy over a behavior that is available in administrative data that survey researchers regularly use for other purposes (Shino, Smith, and Uribe Reference Shino, Smith and Uribe2022). This same innovative spirit may help identify situations in which multiple techniques can be fielded within the same study, overcoming some of the dependence between topic and technique. In turn, this could help the literature transition from an exploratory stage of finding new topics and techniques to an explanatory stage that builds a deeper understanding of when and why interventions work.
After two decades of research, the partisan expressive responding literature has taken important strides, developing several useful strategies and applying them to a variety of cases. There is clear evidence that survey responses are sometimes more partisan than people’s underlying perceptions and solid evidence that deliberate misreporting is sometimes at play. However, the understanding of the mechanisms is limited. In turn, for some research areas, it is not clear whether expressive responding should be viewed as a feature or a bug. As the literature enters its third decade, design-based mechanism tests have potential to clarify the nature and importance of expressive responding.
SUPPLEMENTARY MATERIAL
To view supplementary material for this article, please visit http://doi.org/10.1017/S0003055426101452.
DATA AVAILABILITY STATEMENT
Research documentation and data that support the findings of this study are openly available at the American Political Science Review Dataverse: https://doi.org/10.7910/DVN/QJMCID.
ACKNOWLEDGEMENTS
Binh Hoang and Joseph Murphy assisted with data collection. Adam Berinsky, Greg Huber, Erik Peterson, Andrea Robbett, and Gaurav Sood shared additional variables from their data. James Fahey, Maurice Jakesch, Brendan Nyhan, Steve Rathje, and Enrijeta Shino answered questions about their data. Alex Coppock, Eli Rau, Lilla Orr, Dan Hopkins, Marc Meredith, Matt Levendusky, Mike Sances, Yph Lelkes, Diana Mutz, Madeline Pfaff, and Gaurav Sood provided helpful comments. Earlier versions were presented at the University of Pennsylvania; Rutgers University; the second annual meeting of the Polarization Research Lab; the Conference on Measurement in (Survey) Experiments, Center for the Study of Democratic Politics, Princeton University; the University of Rochester Democracy Center; and the annual meetings of the American Association for Public Opinion Research and the American Political Science Association.
FUNDING STATEMENT
Support for research assistance was provided by the Liberal Arts Undergraduate Research Award (LAURA) program, Temple University.
CONFLICT OF INTEREST
The author declares no ethical issues or conflicts of interest in this research.
ETHICAL STANDARDS
The author affirms this research did not directly involve human participants.


 Open access
Comments
No Comments have been published for this article.