


1. Introduction
At around two years of age, a vocabulary spurt begins where a child’s productive vocabulary increases exponentially (Mervis & Bertrand, Reference Mervis and Bertrand1994; Samuelson & McMurray, Reference Samuelson and McMurray2017). However, it is not vocabulary alone undergoing these changes during the preschool years. Hand preference and fine motor skills support exploration, executive function (EF) continues to improve, attention span lengthens, and social competence (SC), which guides interactions with others, also markedly improves (Carson et al., Reference Carson, Hunter, Kuzik, Wiebe, Spence, Friedman and Hinkley2016). It is common to see studies of early childhood development focus on pairs of these skills (e.g., language and EF), but there is immense value in considering an integrative approach, as each of these separate skills ultimately support each other during this developmental “spurt” (Samuelson & McMurray, Reference Samuelson and McMurray2017).
As stated, it is not just vocabulary developing during the preschool period. EF describes the top-down processes which support goal-directed behaviour (Diamond, Reference Diamond2020). In preschool, examples of well-developed EF manifest in a child following instructions, waiting their turn, sharing, and generating new ideas. EF is often separated into several main categories, including working memory, self-regulation, inhibition/switching, and emotional control (Diamond, Reference Diamond2020). In addition to EF, another early developing skill associated with vocabulary is social emotional ability and SC (Slot et al., Reference Slot, Bleses and Jensen2020). SC describes a child’s intrapersonal and interpersonal skills which allow emotional management and helps the child interact and sympathize with others (Murano et al., Reference Murano, Sawyer and Lipnevich2020). Children who display disruptive behaviours or do not build/maintain social relationships in an age-appropriate manner likely possess poor SC (Murano et al., Reference Murano, Sawyer and Lipnevich2020). Both EF and SC are strongly intertwined with both vocabulary size and complexity (Longobardi et al., Reference Longobardi, Spataro, Frigerio and Rescorla2016; Pakarinen et al., Reference Pakarinen, Salminen, Lerkkanen and Von Suchodoletz2018; Slot et al., Reference Slot, Bleses and Jensen2020; Teepe et al., Reference Teepe, Molenaar, Oostdam, Fukkink and Verhoeven2017). EF skills such as inhibition or emotional control facilitate successful social interactions (Teepe et al., Reference Teepe, Molenaar, Oostdam, Fukkink and Verhoeven2017). Extensive research argues that receptive language is ancillary for both EF and SC.
Slot et al. (Reference Slot, Bleses and Jensen2020) investigated the long-term benefits of a well-developed vocabulary through a longitudinal study. The results showed that toddlers with better language abilities possessed better self-regulation and social-emotional skills compared to children with more limited vocabulary, and this persisted over years into preschool. Furthermore, early language ability at the first assessment proved the best predictor of math and numeracy skills later in life (Slot et al., Reference Slot, Bleses and Jensen2020). The stability of language skills alongside the associated performance in math and numeracy reported by Slot et al. (Reference Slot, Bleses and Jensen2020) suggest that it is important for children to develop a strong vocabulary even before preschool. These findings are echoed in the longitudinal study by Guez et al. (Reference Guez, Piazza, Pinheiro-Chagas, Peyre, Heude and Ramus2023) where preschool children with larger vocabulary and strong visuospatial skills performed better in middle- and late-elementary math abilities. While there are many known factors that influence early vocabulary development (genetics, Byrne et al., Reference Byrne, Coventry, Olson, Samuelsson, Corley, Willcutt and DeFries2009; family history and socioeconomic status, Heath et al., Reference Heath, Bishop, Bloor, Boyle, Fletcher, Hogben and Yeong2014), one of particular interest is the role of both functional and neural lateralization (Forrester & Todd, Reference Forrester and Todd2018).
Functional lateralization refers to the division of sensorimotor/cognitive processes between the two hemispheres of the brain (Gonzalez et al., Reference Gonzalez, van Rootselaar and Gibb2018). Some well-known lateralized functions include visually guided motor control and language, both of which are more specialized to the left hemisphere in most of the human population (Kolb & Whishaw, Reference Kolb and Whishaw2009). One proxy of functional lateralization is hand preference which reflects the dominant use of one hand over the other for tasks requiring fine motor skills, such as writing or tool use (Gonzalez et al., Reference Gonzalez, van Rootselaar and Gibb2018; Kolb & Whishaw, Reference Kolb and Whishaw2009). Handedness is often used as an indicator of underlying brain lateralization, as the preferred hand is typically controlled by the opposite hemisphere of the brain (i.e., right-handed individuals tend to have more left-hemisphere dominance, and vice versa). This relationship between hand preference and hemispheric specialization provides valuable insights into the neural organization of cognitive and motor functions (Corballis, Reference Corballis2009; Gonzalez & Goodale, Reference Gonzalez and Goodale2009; Howells et al., Reference Howells, Thiebaut de Schotten, Dell’Acqua, Beyh, Zappalà, Leslie and Catani2018). For example, early appearance of strong “lateralization,” such as a precocious hand preference in young children, has suggested advantageous development (Gonzalez et al., Reference Gonzalez, van Rootselaar and Gibb2018; Nicoladis et al., Reference Nicoladis, Dueck and Zarezadehkheibari2021). There is no direct proof of this hypothesis (Nicoladis et al., Reference Nicoladis, Dueck and Zarezadehkheibari2021; van Rootselaar et al., Reference van Rootselaar, Grandmont, Gibb, Li and Gonzalez2021), but it is supported by some behavioural research (Gonzalez et al., Reference Gonzalez, van Rootselaar and Gibb2018). For example, past studies in preschool children have shown a relationship between strong right-hand preference and more adult-like speech (Gonzalez, Li et al., Reference Gonzalez, Li, Mills, Rosen and Gibb2014) and better parent-rated EF (Gonzalez, Mills, et al., Reference Gonzalez, Mills, Genee, Li, Piquette, Rosen and Gibb2014). Regarding language development and hand preference, there is a strong evidence that infants with an early right-hand preference for pointing and gesturing will have better vocabulary and language development compared to those who show weak right-hand preference (Gonzalez et al., Reference Gonzalez, Campbell, Marcinowski, Michel, Coxe and Nelson2020; Mumford & Kita, Reference Mumford and Kita2016; Michel et al., Reference Michel, Babik, Nelson, Campbell and Marcinowski2013; Nelson et al., Reference Nelson, Campbell and Michel2014; Nelson et al., Reference Nelson, Gonzalez, Coxe, Campbell, Marcinowski and Michel2017; Vauclair & Cochet, Reference Vauclair and Cochet2013). The literature also reports a connection between increased hand use for general communication at 15 months of age and better language and EF development as a toddler/preschooler (Kuhn et al., Reference Kuhn, Willoughby, Wilbourn, Vernon-Feagans, Blair and Investigators2014), as well as general motor skills (both fine and gross motor abilities) predicting language and communication skills (Gonzalez et al., Reference Gonzalez, Alvarez and Nelson2019). This body of research contributes to the theoretical framework of this study, where we argue that if sensorimotor lateralization scaffolds cognitive specialization (Gonzalez et al., Reference Gonzalez, van Rootselaar and Gibb2018), hand preference, an approximate correlate of lateralization, will predict achievement in different cognitive areas, including vocabulary, EF, and SC.
Multiple studies have investigated the possibility that right-hand preference predicts performance by testing the relationship between hand use and only one of the previously listed skills (i.e., vocabulary size: Mumford & Kita Reference Mumford and Kita2016; van Rootselaar et al., Reference van Rootselaar, Grandmont, Gibb, Li and Gonzalez2021, speech: Gonzalez, Li et al., Reference Gonzalez, Li, Mills, Rosen and Gibb2014; EF: Gonzalez, Mills, et al., Reference Gonzalez, Mills, Genee, Li, Piquette, Rosen and Gibb2014), but never in conjunction with multiple measures/skills in a within-subjects design. The goal of the current study, therefore, is to examine this relationship in a single cohort of preschool children. We hypothesized that children’s right-hand use for pointing and/or grasping would be a predictor of vocabulary, EF, and SC performance. Further, we predicted that there would be reciprocal relationships between the cognitive measures, where vocabulary size and SC would predict EF, SC and EF would predict vocabulary, and vocabulary and EF would predict SC.
Notably, a previous study conducted by our laboratory challenged the idea that a simple correlation between right-hand use and cognitive skills exists in preschoolers. Van Rootselaar et al. (Reference van Rootselaar, Grandmont, Gibb, Li and Gonzalez2021) found no relationship between percentage right-hand use for pointing and vocabulary score on the Peabody Picture Vocabulary Test (PPVT). However, a logistic regression did reveal that if a child used their right hand for a trial, the odds of selecting a correct answer increased. This result suggests a more nuanced relationship between right-hand preference and vocabulary. In a climate of irreproducible findings, in the current study, we aimed to replicate the result that preschool children who use their right hand during each trial in the vocabulary task would be more likely to select the correct word (van Rootselaar et al., Reference van Rootselaar, Grandmont, Gibb, Li and Gonzalez2021). The current experimental design also allows for a comprehensive analysis of early childhood behaviours that include motor, cognitive, and social competency measures.
2. Methods
2.1. Participants
Eighty-eight parents with a child between the ages of three to five years old (M= 52.70 months SD= ±10.69; 34 males, 68 right-handed) consented to participate in this study. Data from 81 children are included in the results. We recruited 24 families from the community who completed the study at the University of Lethbridge. An additional 64 families were recruited through three local daycares and three preschools – hereafter referred to as early learning centres (ELCs) in and around Lethbridge, AB, Canada. Of the 64 families, nine families were not included in the study. This was due to the following reasons: the child was too young at the time of testing (n=2); the child did not attend the program during the testing period (n=2); technical failure of the camera during the tabletop activities (n=2); and/or their child had a diagnosed developmental disorder (n=3). The parents completed a questionnaire confirming that their child was not diagnosed with any developmental delays and had normal hearing and normal or corrected to normal vision. All children passed the basal testing level of the PPVT-V. The parents provided written informed consent, and the child provided verbal assent during the study. The University of Lethbridge Human Subjects Research Committee and the University of Alberta Ethical Review Board approved the study.
2.2. Materials
2.2.1. Questionnaires
Parents who returned the consent form completed a package of five questionnaires regarding their child: Ages and Stages Questionnaire-Social Emotional (ASQ:SE2), Behavior Rating Inventory of Executive Function-Preschool (BRIEF-P), Social Responsiveness Scale-2 (SRS-2), Waterloo/Edinburgh Handedness Questionnaire, and a general developmental questionnaire. Only data from the ASQ:SE2, BRIEF-P, and SRS-2 are used in the results of this study. The Waterloo/Edinburgh Handedness Questionnaire is not always reflective of hand preference (Flindall & Gonzalez, Reference Flindall and Gonzalez2019) but was completed by some of the parents (n=46), and used in exploratory statistics. A goal of this study was to treat hand preference as a continuous variable (Flindall & Gonzalez, Reference Flindall and Gonzalez2019; Michel, Reference Michel2021) rather than a dichotomy. As such, the Waterloo/Edinburgh Handedness Questionnaire is not used in the study. An additional questionnaire completed by all families was the developmental questionnaire (see Coelho et al., Reference Coelho, Amatto, Gonzalez and Gibb2020; Gibb et al., Reference Gibb, Coelho, Van Rootselaar, Halliwell, MacKinnon, Plomp and Gonzalez2021) to determine whether a child met developmental milestones and to control for developmental delays or diagnoses. The group of parents recruited from ELC completed four additional questionnaires (Ages and Stages Questionnaire-2, Parental Protective Factors Inventory, Brain Development Quiz, and the BRIEF-Adult) which are not included in this study. See Table 1 for a summary of the questionnaires/measures used in this study and the data outcome.
List of tasks and variables used in the results of this study

Table 1. Long description
The table consists of four columns and eight data rows.
* Row 1: B R I E F dash P questionnaire. Outcome measure is B R I E F G E C score. Standardized score is Yes. Associated component is E F.
* Row 2: S R S dash 2 questionnaire. Outcome measure is S R S score. Standardized score is Yes. Associated component is S C.
* Row 3: A S Q colon S E questionnaire. Outcome measure is A S Q colon S E score. Standardized score is Yes. Associated component is S C.
* Row 4: P P V T dash V. Outcome measure is P P V T score. Standardized score is Yes. Associated component is Vocabulary.
* Row 5: P P V T dash V. Outcome measure is Right-hand use for pointing percentage. Standardized score is No. Associated component is Right-hand preference.
* Row 6: Small block construction task. Outcome measure is Grasping errors percentage. Standardized score is No. Associated component is E F, fine motor skills.
* Row 7: Small block construction task. Outcome measure is Right-hand use for grasping percentage. Standardized score is No. Associated component is Right-hand preference.
* Row 8: D C C S. Outcome measure is D C C S errors percentage. Standardized score is No. Associated component is E F.
* Row 9: Animal Stroop. Outcome measure is Stroop errors percentage. Standardized score is No. Associated component is E F.
2.2.1.1 BRIEF-P
The Behavior Rating Inventory for Executive Function-Preschool (Isquith et al., Reference Isquith, Crawford, Espy and Gioia2005) is used to assess EF in children ages three to five years old. The questionnaire includes 63 questions with the prompt: “During the past 6 months, how often has each of the following behaviours been a problem?” Examples of the questions include “Has outbursts for little reason” and “When given two things to do, remembers only the first or last.” Parents respond with “never,” “sometimes,” or “often” to these prompts. Each question relates to one of five domains: inhibit, shift, emotional control, working memory, and plan/organize. These domains can be combined to create broad subscales of EF including the Metacognition Index (MI) and Behavioural Index (BRI). The total raw BRIEF-P score is summed to create the global executive composite score (GEC) which summarizes a child’s EF. The response of “often” results in a higher score, and when a parent indicates “rarely,” a lower score is recorded. A lower score suggests better EF. The raw scores are transformed into standardized scores using the provided manual (Sherman & Brooks, Reference Sherman and Brooks2010).
2.2.1.2. ASQ:SE
The Ages and Stages Questionnaires: Social-Emotional is designed to assess age appropriate social-emotional development in children aged one month to 72 months (Squires et al., Reference Squires, Bricker, Heo and Twombly2001). The questions address seven domains: self-regulation, compliance, communication, adaptive functioning, autonomy, affect, and interaction with others. The number of questions varies according to the child’s age, where parents responded to at least 35 questions by checking a box of “always,” “sometimes,” or “rarely/never” and note whether the behaviour was a concern. Examples from the survey include “Does your child like to play with other children?” and “Does your child seem happy?” Each concerning behaviour that a child sometimes or always exhibits or typical behaviour that a child sometimes or rarely exhibits is given a higher score. The scores are standardized for age, but in all cases, a lower score suggests age-appropriate social development.
2.2.1.3. SRS-2
The Social Responsiveness Scale-2 is a questionnaire designed to measure the dimensions of interpersonal behaviour and communication. It can be used as a screening tool for autism spectrum disorder, often associated with the scoring dimension of repetitive/stereotypic behaviour (Constantino & Gruber, Reference Constantino and Gruber2012). There is a preschool version appropriate for children ages four to six, and a school aged version for children aged 4–18. We used both forms in this study. Parents completed 65 questions, rating how often the statements described their child’s behaviour as “not true,” “sometimes true,” “often true,” and “almost always true.” Examples of the questions include the following: “behaves in a way that seems strange or bizarre” or “is aware of what others are thinking or feeling.” These questions are associated with five domains representing social development: social awareness, social cognition, social communication, social motivation, and restricted interests and repetitive behaviours (RIRB). These domains can be combined into two main subscales: “social communication and interaction” and “RIRB.” All the domains are summed to create the SRS-2 composite score. A lower score indicates better, more age-appropriate social development. These raw scores are transformed into age-standardized scores using the norms provided (Constantino & Gruber, Reference Constantino and Gruber2012).
Two social questionnaires, both age-adjusted standardized measures, are included in the study – the ASQ:SE and the SRS-2. Both were chosen to ensure a well-rounded and externally validated perspective on the social development on our children sample. As mentioned, the ASQ:SE is used as a simple screening tool for parents to determine whether their child is meeting appropriate milestones (Pooch et al., Reference Pooch, Natale and Hidalgo2019). It is not widely utilized in research and does not aim to diagnose specific social impairments (Squires et al., Reference Squires, Bricker, Heo and Twombly2001). Furthermore, it has been reported to be less effective in identifying children with diagnosable social delays compared to other questionnaires designed to assess social-emotional development (de Wolff et al., Reference de Wolff, Theunissen, Vogels and Reijneveld2013; Velikonja et al., Reference Velikonja, Edbrooke‐Childs, Calderon, Sleed, Brown and Deighton2017). Conversely, the SRS-2 appears more frequently as a research tool; however, it is most often associated with studies that measured autistic traits in young children (Hus et al., Reference Hus, Bishop, Gotham, Huerta and Lord2013). An advantage of using a diagnostic tool is that we could screen our youngest participants (three-year-olds) who might present with autistic traits, but not be diagnosed yet. In Canada, only 53% of people with autism received the diagnosis before turning five years old (Statistics Canada, 2022). Children who received an SRS score higher than 65 were flagged as potentially atypically developing. We used this information in preliminary statistical analyses to help us screen for outliers. It did occur where a child who received an abnormal SRS score did not receive an abnormal ASQ:SE score in this study.
In conclusion, both tests are included individually as dependent and independent variables in the results section. Both tests are valuable because they ultimately capture different aspects of social behaviour and development.
2.2.2. Tabletop assessments
The children located in ELC completed additional activities that are not reported here. The activities included MEGA® block construction (Gibb et al., Reference Gibb, Coelho, Van Rootselaar, Halliwell, MacKinnon, Plomp and Gonzalez2021), grass and snow (Carlson & Moses, Reference Carlson and Moses2001; Gibb et al., Reference Gibb, Coelho, Van Rootselaar, Halliwell, MacKinnon, Plomp and Gonzalez2021), block sorting (single dimension sorting task, like grass and snow), speech production task (Gonzalez, Li et al., Reference Gonzalez, Li, Mills, Rosen and Gibb2014), and social play testing (modified from MacCormack et al., Reference MacCormack, Matheson and Hutchinson2015). The following four tasks are included in the analyses of the results section: small block construction, PPVT-V, dimensional change card sort (DCCS) task, and animal Stroop.
2.2.2.1. Small block construction
This is a measure of fine motor skill, handedness, and EF. To complete the grasp-to-construct task, the child is seated at a table. There are 20 small building blocks (LEGO® pieces) distributed over four symmetrical quadrants in front of the child (see Figure 1). There are four copies of five different blocks. The child was not made aware that there are four copies of each block. One copy of each block was placed in a quadrant (right/left, near/far). During the task, the child was presented with a simple model composed of the five unique blocks. The experimenter asked the child to construct an exact match as quickly as possible. After the child completed the model, they were asked to complete a different model. This continued until the child built four models. If the models were built correctly, the child used all the blocks on the table. If the child did not replicate the model, they were encouraged to build something with all the blocks on the table and allowed to build until they lost interest, or up to five minutes. The time to complete this task ranges from under four minutes up to eight minutes. There are two measures we calculated from the block construction task: percentage right-hand use, and grasping errors. To calculate right-hand use, we recorded the hand used for each grasp of a block, and determined what percentage of grasps were completed with the right hand out of the total number of grasps. Grasping errors measured both motor skill and EF. A grasping error is defined as a grasp that does not result in a correct replication of the model. This occurs in many different situations. For example, when the child dropped the block after picking it up (motor skill error), or the child grasped a block that does not belong on the model (EF error). As discussed in van Rootselaar et al. (Reference van Rootselaar, Beke and Gonzalez2020), these examples represent errors not only in construction or motor skills but also in planning, working memory, and inhibition. These grasping errors suggest the child is either using ineffective planning when trying to replicate the model, may be unable to access working memory to grasp the block they need to build the model, or lacks inhibition, and cannot resist the desire to grasp an inappropriate block.
Small block construction task. One of the four models is on the bottom left of the picture. The model is composed of five different blocks. At the start of the task (pictured), there is one copy of each of the five different blocks placed in four different reaching quadrants in front of the participant, for a total of 20 blocks.

2.2.2.2. PPVT-V
It is a standardized measurement of vocabulary for anyone over the age of two years old (Dunn & Dunn, Reference Dunn and Dunn2007). It is administered through a testing booklet/computer that features four images on each “page” (see Figure 2). The experimenter stated a word and asked the child to point to the picture that matched the pronounced word. If the child was unsure, the experimenter prompted the child to guess. The experimenter did not provide feedback during the trials and encouraged the child to continue the assessment. After the child selected an image, the experimenter presented the next image. The child continued the assessment until they made six consecutive errors. All the errors are added together and subtracted from the level number the child achieved to calculate a raw score. The standardized score is calculated using the PPVT-5 manual to control for the age of the child. This task will take children anywhere from ten minutes up to thirty minutes to complete.
The Peabody Picture Vocabulary Test (PPVT-V). This test was administered on a laptop, where children were prompted to point to one of the four images that match the pronounced word, in this case, “banjo.” After the child pointed to a picture, the experimenter advanced to the next set of images. The child did not need to touch the screen or a mouse.

2.2.2.3. DCCS
This task is also referred to as “bunnies and boats” or “turtles and trains.” It is a variation of the DCCS task, developed for preschool-aged children (Zelazo, Reference Zelazo2006). This task is designed to measure EF, specifically working memory, inhibition, and task-switching. In this task, two buckets were placed in front of the child, one featured a picture of a purple turtle, and the other had an orange train (see Figure 3). The child is told to play a colour sorting game and shown cards with purple trains or orange turtles. The child is expected to sort the purple trains into the bucket with the purple turtle, and the orange turtles into the bucket with the orange train. After they sorted six cards, one at a time into the buckets, the child was told to play a shape-sorting game. The child was shown the same cards but expected to sort the purple trains into the bucket with the orange train, and the orange turtles into the bucket with the purple turtle. This task takes one to five minutes for the child to complete. To assess EF, we calculated the percentage errors from both the shape and colour sorting trials (percentage error).
Dimensional change card sort (DCCS) task. Children played a colour sorting game (left). They placed pseudo-randomly ordered cards into one of the buckets with the purple turtle or orange train. First, children were told to play a colour sorting game and given two practice cards. After sorting six cards, they were told to play a new game, a shape sorting game (right). The children were asked to repeat the rules to the experimenter (place turtles in the turtle bucket and trains in the train bucket) and were reminded to ignore the colour.

2.2.2.4. Animal Stroop
This test is a variation of the colour-word Stroop task (Wright et al., Reference Wright, Waterman, Prescott and Murdoch-Eaton2003) adjusted for children (Gonzalez et al., Reference Gonzalez, van Rootselaar and Gibb2018). This assessment is designed to measure inhibition in children ages three to six years old. In this task, a child is asked to name twelve “normal” animal cards which consist of simple drawings of four common animals: duck, pig, cow, and sheep (see Figure 4). After completing the normal (or congruent) round, the child was shown an example of a “silly” animal. These animals had mismatched heads and bodies (incongruent; see Figure 4), and the child was instructed to only name the body. The child completed four training cards, where the experimenter gave feedback and pointed to the body to help the child learn the new rule. After completing four training cards, the child was asked to correctly name the animals (bodies) on twelve cards. These animals are a combination of the same animals observed during the congruent trials, for example, a pig head on a duck body. To assess EF (inhibition, working memory, shifting), we calculated the percentage errors during the incongruent trials (percentage error). Children took two to five minutes to complete both the congruent and incongruent condition. The methods for this task are also reported in Gonzalez et al. (Reference Gonzalez, van Rootselaar and Gibb2018).
Animal Stroop. The top row shows images of the animals during the congruent condition where the child is asked to name the animal in the image. The bottom row shows cards used for the incongruent condition where the child must name only the body of the animal. The correct response from left to right for both rows would be duck, pig, cow, and sheep.

2.3. Procedure
As mentioned under the participants section, a portion of the children in this data set was tested at the University of Lethbridge in a laboratory setting. A parent was typically present in the room during testing but asked not to interrupt or interact with their child during testing. These parents were asked to complete the questionnaire package during the time their child spent at the laboratory. This often took parents the duration of the child testing (anywhere from 1 hour to 1.5 hours). For the children who completed the test at the childcare/education centres (ELCs), the questionnaires were sent home, and parents were asked to complete the questionnaires and return them in a sealed envelope to the school. The children at the ELCs were tested in a room or hall adjacent to their classroom. The remaining testing procedures were nearly identical between all children with two exceptions. The children who completed the experiment in the laboratory completed all activities in a single testing session, while the children in the ELCs were tested over one-to-three sessions. The second difference is that the children at the ELCs completed three more assessments that are not reported in this study as they are part of a different research project. The ELC testing typically took anywhere from one hour to two hours per child but was separated into 10- to 45-minute-long testing sessions.
To keep the child engaged, the experimenter provided a treasure map with several symbols on the map at the start of the session and explained that there was a surprise treasure for the child at the end of the map. Each symbol/image represented one of the assessments the child had to complete. The child found matching images around the testing space. Once they found the image, the experimenter and child would complete one assessment (referred to as games), and then, the child could find the next image to move onto the next assessment. At the end of each testing session, the child was rewarded with a sticker (treasure). The maps allowed the researchers to pseudo-randomize the order of the assessments. The child completed all assessments at a table set to an appropriate height with a child-sized chair. The experimenter recorded each task with a video camera for analysis. All data were scored and analysed after testing.
2.4. Data analysis
The scores from a total of three parent-completed questionnaires, a standardized direct measure of child performance, and three direct, non-standardized assessments of child behaviour are used in the results. We used the age-standardized aggregate scores from the following questionnaires: the BRIEF-P (known as the GEC score), the SRS-2 (SRS score), and the ASQ: Social-Emotional 2 (ASQ:SE). A Pearson correlation analysis was used to investigate relationships between all the variables from Table 1. This was followed by four multiple linear regression analyses. The standardized measures composed the dependent variables described in part one of the results section (PPVT-V, GEC score, SRS score, and the AQS:SE). For each of the four regressions, the independent variables included the other standardized measures as well as the three non-standardized direct measures of performance. See Table 1 for a list of each task and the resultant measures.
The direct measures of performance included right-hand preference (grasping and pointing), fine-motor skills, and EF. To measure hand preference for pointing, during the PPVT-V we calculated the number of times the right-hand was used to point during each trial then divided this value by the total number of points and multiplied the outcome by 100. The remaining measures were all percentages calculated with the same formula: [number of trials where the behaviour of interest occurred/total number of trials) × 100]. For the block building task, we also calculated two measures: the percentage grasping errors during model replication as well as the percentage right-hand use for grasping. See the “small block construction” section for specific information about how we determined which grasps were a grasping error. For the remaining two tasks, we calculated the total percentage errors when sorting cards during the DCCS and the total errors naming animals during the silly version of the animal Stroop task.
We used R (R Core Team, 2013, version 4.4.1) and RStudio (Posit team, 2024, version 2024.4.2.764) to complete the analyses of the data. Within RStudio (Posit team, 2024), we used the packages dplyr (Wickham et al., Reference Wickham, François, Henry, Müller and Vaughan2023) and tidyr (Wickham et al., Reference Wickham, Vaughan and Girlich2024) to organize and prepare the data.
3. Results
3.1. Descriptive statistics
The mean, SE, and minimum and maximum scores for the main variables are presented in Table 2 and Table 3.
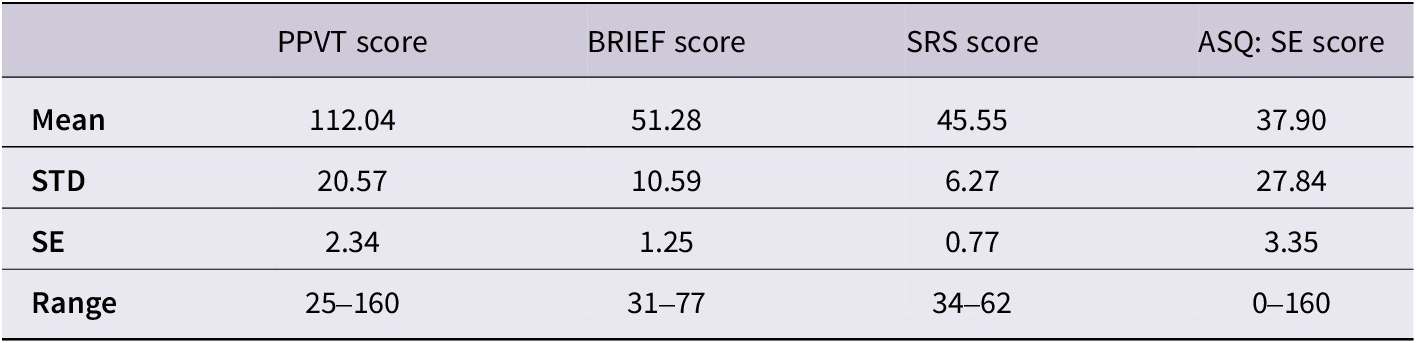
Descriptive statistics of the standardized values. Each variable is used once as a dependent variable in a linear regression. Note: The values for the PPVT, BRIEF, SRS, and ASQ: SE are age-standardized scores

Table 2. Long description
The table consists of four columns representing different age-standardized scores and four rows of statistical measures.
Column 1: P P V T score. Mean is 112.04. S T D is 20.57. S E is 2.34. Range is 25 to 160.
Column 2: B R I E F score. Mean is 51.28. S T D is 10.59. S E is 1.25. Range is 31 to 77.
Column 3: S R S score. Mean is 45.55. S T D is 6.27. S E is 0.77. Range is 34 to 62.
Column 4: A S Q colon S E score. Mean is 37.90. S T D is 27.84. S E is 3.35. Range is 0 to 160.
Descriptive statistics for direct measures of child behaviour used as independent variables in the linear regression models

Table 3. Long description
The table consists of seven columns and four rows of data.
Column headers from left to right are:
1. Variable name (blank header)
2. Age in months
3. Right-hand use P P V T in percent
4. Right-hand use construction in percent
5. Grasping errors in percent
6. D C C S task errors in percent
7. Animal stroop errors in percent
Row-by-row data:
- Mean: Age 52.43, Right-hand use P P V T 70.00, Right-hand use construction 63.33, Grasping errors 38.73, D C C S task errors 8.62, Animal stroop errors 27.33.
- S T D: Age 10.82, Right-hand use P P V T 25.21, Right-hand use construction 14.90, Grasping errors 31.28, D C C S task errors 13.13, Animal stroop errors 27.85.
- S E: Age 1.22, Right-hand use P P V T 2.85, Right-hand use construction 1.69, Grasping errors 3.54, D C C S task errors 1.60, Animal stroop errors 3.65.
- Range: Age 36 to 71.43, Right-hand use P P V T 10.95 to 100, Right-hand use construction 11.53 to 90.47, Grasping errors 0 to 96.88, D C C S task errors 0 to 50, Animal stroop errors 0 to 91.67.
3.2. Correlations between hand preference, language, EF, and SC
As an exploratory analysis, we conducted Pearson’s correlation tests between all nine variables listed in Table 1 (see Figure 5). We used the package corrplot (Wei & Simko, Reference Wei and Simko2024) to run the correlations and create Figure 5. This analysis was used to investigate whether any relationships existed between right-hand preference for pointing or grasping and the other measures. The score from the modified Edinburgh-Waterloo handedness questionnaire is not reported for two reasons. First, there was a large amount of missing data points from the handedness questionnaire, where parents often overlooked the second page of the survey. Second, previous research suggests that handedness questionnaires do not fully capture hand preference (Flindall & Gonzalez, Reference Flindall and Gonzalez2019). For example, despite a strong correlation between right-hand preference during grasping and pointing (r= 0.50, p<0.001), such correlation does not consistently exist between the handedness questionnaire score and right-hand preference for pointing (r= 0.13, p>0.3). Based on the results in Figure 5, right-hand preference was not significantly correlated with any of the other cognitive measures. Figure 5 shows correlation coefficients for all correlations where p<0.1. The circled values indicate the value is significantly correlated. For example, both measures of right-hand use (pointing and grasping) are strongly correlated with each other (r=0.50, p<0.001). For the measures of right-hand use, two relationships are approaching significance in the correlation chart. These are right-hand use for grasping and grasping errors (r=−0.28, p=0.075) and between right-hand use for pointing and DCCS errors (r=−0.23, p=0.054). The direction of these non-significant relationships indicated that children who used their right hand more may have made fewer errors. Regardless, we did not see evidence in this sample that children with a greater rate of right-hand use perform better on vocabulary, EF, or social tasks. One clear pattern in the correlation chart is the interrelationship between the standardized questionnaires/measures; PPVT, BRIEF, SRS, and the ASQ: SE scores. Regression analyses offer a stronger method to help understand complex relationships and how performance in one task/area might predict performance in another task or area.
Correlation plot of all variables. Above is a correlation plot for all the variables included in the results section. The black value is the Pearson R correlation coefficient. Correlation coefficients with a p<0.1 are included, and any blank squares had a p>0.1. The significant correlations are highlighted by a blue or red circle. The colour of the circle corresponds to the direction of the relationship. All significant relationships exist in the expected direction, where if a child performed better on one task, they also performed better on the correlated task.

Figure 5. Long description
A lower triangular matrix displays correlations between nine variables. The vertical axis labels from top to bottom are S R S underscore score, A S Q 3 underscore S E, P P V T underscore Standardized, Grasping underscore Errors, D C C S underscore Errors, Stroop underscore Errors, Right underscore Hand underscore Grasp, and Right underscore Hand underscore Point. The top diagonal labels from left to right are G E C underscore B R I E F, S R S underscore score, A S Q 3 underscore S E, P P V T underscore Standardized, Grasping underscore Errors, D C C S underscore Errors, Stroop underscore Errors, and Right underscore Hand underscore Grasp.
Significant correlations with p less than 0.1 are marked with circles and numerical values. Blue circles indicate positive correlations and red circles indicate negative correlations.
Row 1: S R S underscore score and G E C underscore B R I E F have a blue circle with 0.42.
Row 2: A S Q 3 underscore S E correlates with G E C underscore B R I E F at 0.47 (blue circle) and S R S underscore score at 0.64 (blue circle).
Row 3: P P V T underscore Standardized correlates with G E C underscore B R I E F at negative 0.38, S R S underscore score at negative 0.43, and A S Q 3 underscore S E at negative 0.36 (all red circles).
Row 4: Grasping underscore Errors correlates with S R S underscore score at 0.21, A S Q 3 underscore S E at 0.30, and P P V T underscore Standardized at negative 0.20 (no circles).
Row 5: D C C S underscore Errors correlates with Grasping underscore Errors at 0.34 (blue circle).
Row 6: Stroop underscore Errors correlates with D C C S underscore Errors at 0.25.
Row 7: Right underscore Hand underscore Grasp correlates with Grasping underscore Errors at negative 0.28.
Row 8: Right underscore Hand underscore Point correlates with D C C S underscore Errors at negative 0.23 and Right underscore Hand underscore Grasp at 0.50 (blue circle).
A color bar at the bottom ranges from negative 1 (dark red) through 0 (white) to 1 (dark blue).
3.3. Predictors of early childhood language, EF, and SC
As discussed, we collected proxy measures (parent questionnaires) as well as objective assessments (tabletop tasks) on a range of early developmental skills including hand preference, fine motor skill, language ability, EF, and SC. We conducted four separate multiple linear regressions for each of the standardized measures of cognitive developmental behaviours. Thus, the dependent variables included vocabulary standardized scores (PPVT score), EF (BRIEF-P GEC score), and two analyses for SC (one each with the SRS score and the ASQ:SE score). For each regression, we entered the following independent variables: two measures of handedness (percentage right-hand use during the PPVT, percentage right-hand use during the block construction task), one measure of fine-motor skills (grasping errors for block construction, see EF-van Rootselaar et al., Reference van Rootselaar, Beke and Gonzalez2020), one measure of language (PPVT standardized score), two measures of EF (GEC score from the BRIEF-P, percentage errors during the DCCS task), and two social measures (SRS total score, ASQ:SE). We did not include age as a factor because the standardized assessments adjust the score based on the age of the child. As a final note, we excluded Stroop from the regression analyses due to multiple unique missing data points which limited the number of participants to as low as 30. These missing data points were largely due to a camera malfunction.
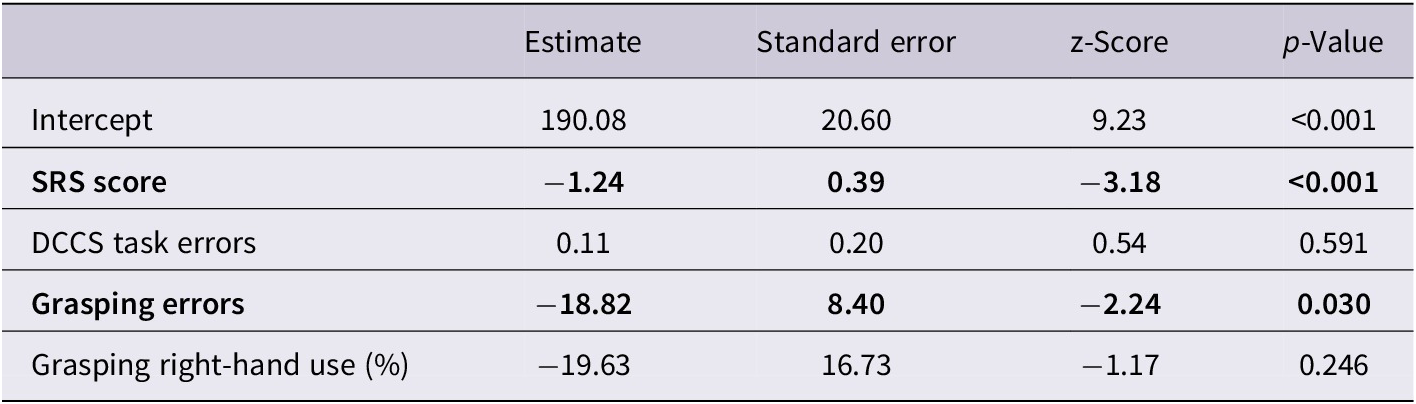
For each of the four models, we used the package “olsrr” (Hebbali, Reference Hebbali2024) and function “ols_step_best_subset” from RStudio to compare the different iterations and identify the model with the best fit (lowest Akaike information criterion (AIC)) that explained the most variance (highest adjusted R2 score). We used the “lm” function in RStudio to execute the multiple linear regressions. For each model, we determined that the basic assumptions of the model were met. The data were normally distributed, without significant outliers. There was a small degree of multicollinearity between two of the parent surveys to measure SC – the SRS and ASQ: SE. To address this, we compared models where the ols_step_best_subset function identified both the SRS and ASQ:SE as significant factors. We compared the models with both variables and with only one of the variables to determine whether both factors significantly changed the model. We also did not use the other social score as a predictor in the regression models of social performance (e.g., the ASQ:SE was not included as a predictor for the regression model with SRS as the dependent variable). The model that best explains receptive vocabulary in preschool children (F(4,50)=4.76, p=0.002), with R2 of 0.23 is shown in Table 4, and included the SRS score, the DCCS task, grasping errors, and right-hand use for grasping. This model suggests that vocabulary is best predicted by SC as captured by the SRS, where a larger vocabulary indicates a lower (better) SC score. Motor skills and EF also significantly predict vocabulary, where fewer grasping errors predicted better PPVT score.
Multiple regression model to predict receptive vocabulary (PPVT score)

Table 4. Long description
The table consists of five columns: Predictor, Estimate, Standard error, z-Score, and p-Value.
* Intercept: Estimate 190.08, Standard error 20.60, z-Score 9.23, p-Value less than 0.001.
* S R S score: Estimate negative 1.24, Standard error 0.39, z-Score negative 3.18, p-Value less than 0.001. This row is highlighted in bold.
* D C C S task errors: Estimate 0.11, Standard error 0.20, z-Score 0.54, p-Value 0.591.
* Grasping errors: Estimate negative 18.82, Standard error 8.40, z-Score negative 2.24, p-Value 0.030. This row is highlighted in bold.
* Grasping right-hand use percent: Estimate negative 19.63, Standard error 16.73, z-Score negative 1.17, p-Value 0.246.
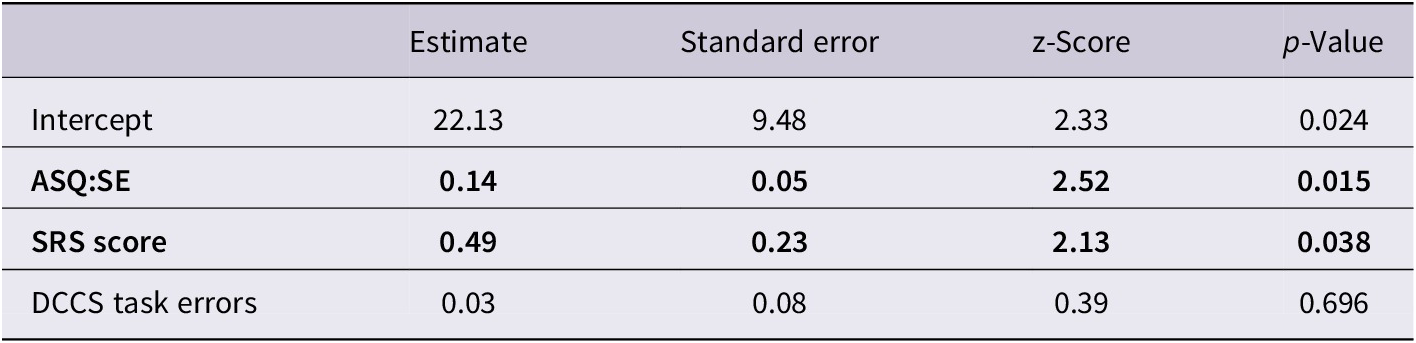
The model that best explains EF in preschool children (F (3,49)=12.41, p<0.001), with R2 of 0.40 is shown in Table 5. The included variables were SRS score, ASQ:SE, and DCCS task errors. This model suggests that EF is best predicted by SC as captured by the SRS and the ASQ 3:SE, where a lower GEC score (better EF) is related to a lower (better) SC score (for both the SRS and ASQ 3: SE).
Multiple regression model to predict executive function (BRIEF-P GEC score)

Table 5. Long description
The table consists of five columns: Predictor, Estimate, Standard error, z-Score, and p-Value.
* Intercept: Estimate 22.13, Standard error 9.48, z-Score 2.33, p-Value 0.024.
* A S Q S E: Estimate 0.14, Standard error 0.05, z-Score 2.52, p-Value 0.015. This row is highlighted in bold.
* S R S score: Estimate 0.49, Standard error 0.23, z-Score 2.13, p-Value 0.038. This row is highlighted in bold.
* D C C S task errors: Estimate 0.03, Standard error 0.08, z-Score 0.39, p-Value 0.696.
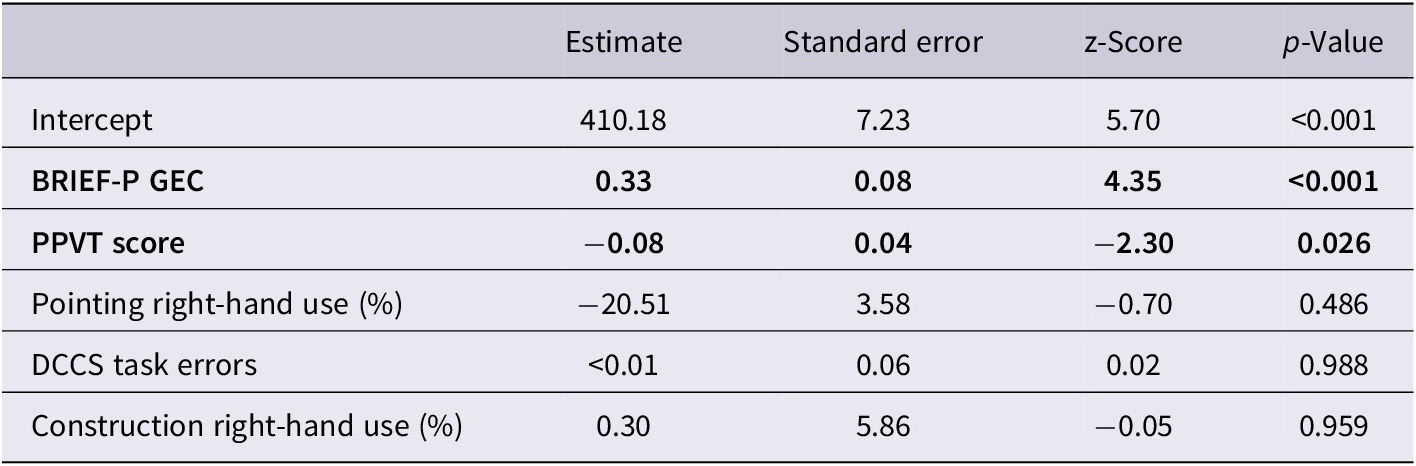
The model that best explained SC (F(5,48)=7.38, p<0.001), with R2 of 0.38 is shown in Table 6. This model suggests that SC, according to the SRS questionnaire, is best predicted by EF, where a lower (better) GEC score relates to a lower (better) SRS score. Vocabulary is also a significant contributor, where a larger vocabulary is related to a lower (better) SRS score.
Multiple regression model to predict social competence (SRS score)

Table 6. Long description
The table presents a multiple regression model with five columns: Variable, Estimate, Standard error, z-Score, and p-Value.
* Intercept: Estimate 410.18, Standard error 7.23, z-Score 5.70, p-Value less than 0.001.
* B R I E F P G E C: Estimate 0.33, Standard error 0.08, z-Score 4.35, p-Value less than 0.001. This row is bolded.
* P P V T score: Estimate negative 0.08, Standard error 0.04, z-Score negative 2.30, p-Value 0.026. This row is bolded.
* Pointing right-hand use percentage: Estimate negative 20.51, Standard error 3.58, z-Score negative 0.70, p-Value 0.486.
* D C C S task errors: Estimate less than 0.01, Standard error 0.06, z-Score 0.02, p-Value 0.988.
* Construction right-hand use percentage: Estimate 0.30, Standard error 5.86, z-Score negative 0.05, p-Value 0.959.
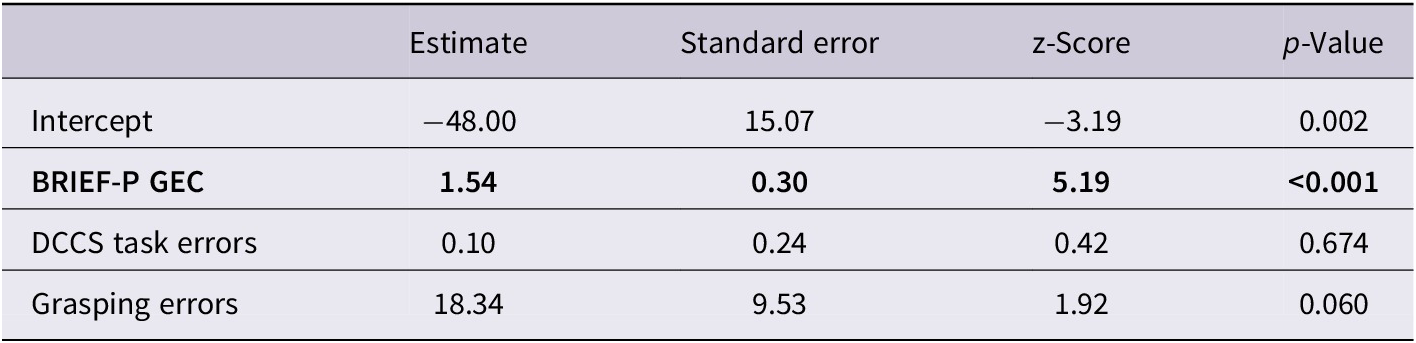
The model that best explained SC as measured by the ASQ:SE (F(3,53)=12.35, p<0.001), with R2 of 0.55 is shown in Table 7. This model suggests that SC is best predicted by EF, where a lower (better) GEC score relates to a lower (better) ASQ:SE score.
Multiple regression model to predict social competence (ASQ:SE)

Table 7. Long description
The table consists of five columns: Predictor Variable, Estimate, Standard error, z-Score, and p-Value.
* Intercept: Estimate -48.00, Standard error 15.07, z-Score -3.19, p-Value 0.002.
* B R I E F P G E C (bolded): Estimate 1.54, Standard error 0.30, z-Score 5.19, p-Value less than 0.001.
* D C C S task errors: Estimate 0.10, Standard error 0.24, z-Score 0.42, p-Value 0.674.
* Grasping errors: Estimate 18.34, Standard error 9.53, z-Score 1.92, p-Value 0.060.
3.4. Replication of van Rootselaar et al. (Reference van Rootselaar, Grandmont, Gibb, Li and Gonzalez2021)
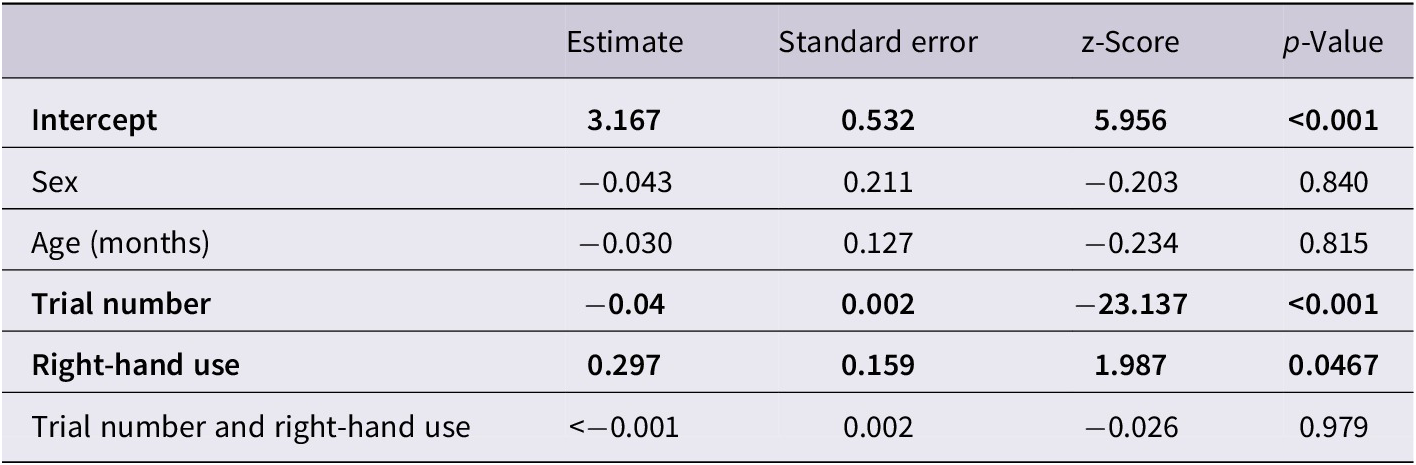
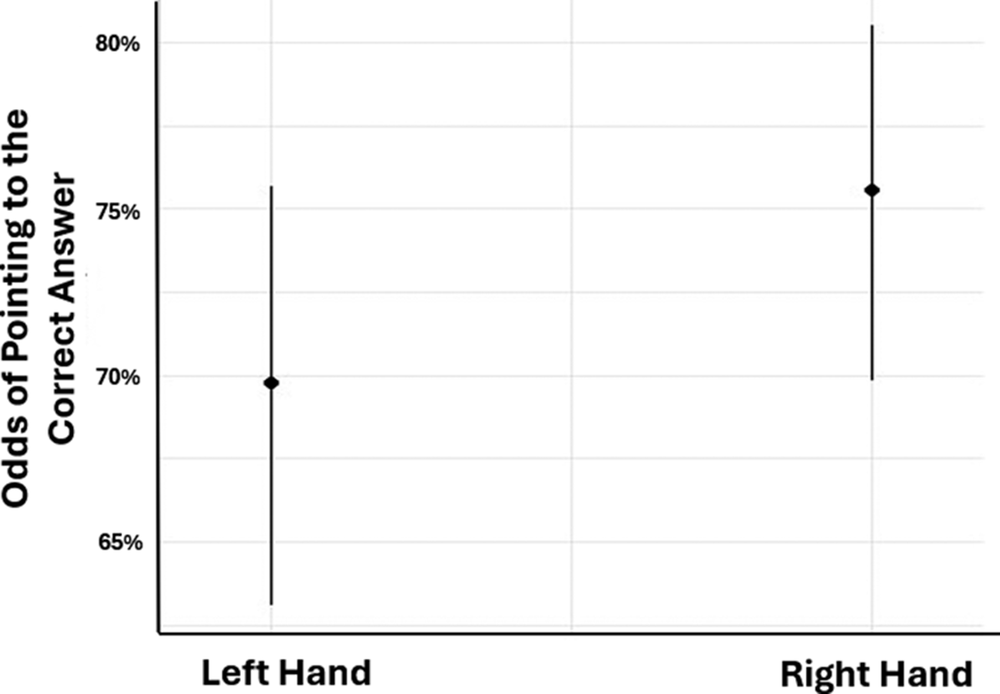
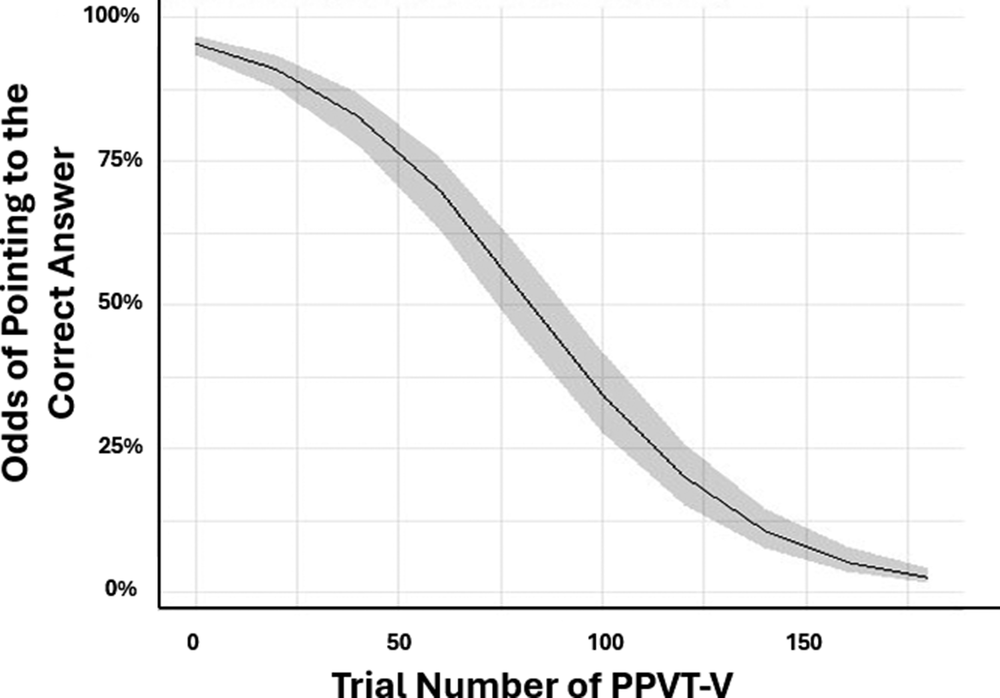
We replicated the analysis described in van Rootselaar et al. (Reference van Rootselaar, Grandmont, Gibb, Li and Gonzalez2021). First, we used a Pearson correlation to assess whether there was a relationship between right-hand use (pointing during PPVT) and receptive vocabulary size in preschool children. Identical to the results reported in van Rootselaar et al. (Reference van Rootselaar, Grandmont, Gibb, Li and Gonzalez2021) we did not find any relationship between right-hand use for pointing and vocabulary size (r= −0.08, p =0.47), as shown in Figure 5. Van Rootselaar et al. (Reference van Rootselaar, Grandmont, Gibb, Li and Gonzalez2021) provide a detailed rationale for conducting a logistic regression as a follow-up analysis to the initial correlation. To align with the methodology of the previous study, we implemented a mixed-effects logistic regression in our analysis. Specifically, we investigated whether the use of the right hand to point the answer during the PPVT significantly predicted an increase in the likelihood of a correct response per trial. We used package lme4 (Bates et al., Reference Bates, Mächler, Bolker and Walker2015) and function “glmer.” We set the model up identically to van Rootselaar et al. (Reference van Rootselaar, Grandmont, Gibb, Li and Gonzalez2021) with “correctness” as the dependent variable (coded binomially where 1 represented a correct response and 0 an incorrect response). The independent fixed effects were hand use, trial number, age, sex, and an interaction between hand use and test length (trial number). The participant was included as a random effect, so the repeated trials were nested under each child. In contrast with van Rootselaar et al. (Reference van Rootselaar, Grandmont, Gibb, Li and Gonzalez2021), we were less concerned about fatigue as a factor in the current study because the children received several breaks during testing, and only a few completed the PPVT-5 in a single sitting. As shown in Table 8, hand use was a significant predictor of a correct response (see Figure 6). When using their right hand, a child had a log-odds increase of 0.297 (z=1.99) for pointing to the correct image. This is comparable to the value reported in van Rootselaar et al. (Reference van Rootselaar, Grandmont, Gibb, Li and Gonzalez2021: 0.04). The only other significant predictor of correct responses in this model was trial number. As illustrated in Figure 7, there is a log-odds decrease of selecting the correct answer as the child progresses through the assessment (−0.030, z= −23.14) which makes sense as the difficulty of the test increases over trials.
Results of a binomial logistic regression for correct responses during the PPVT-5. The scales for the values are as follows: correct response (dependent variable, 1=correct/0=incorrect; sex(M/F); age (36–71.43 months); trial number (24–260 trials); and right-hand use (10.95–100%)

Table 8. Long description
The table consists of five columns: Variable, Estimate, Standard error, z-Score, and p-Value.
* Intercept: Estimate 3.167, Standard error 0.532, z-Score 5.956, p-Value less than 0.001.
* Sex: Estimate minus 0.043, Standard error 0.211, z-Score minus 0.203, p-Value 0.840.
* Age in months: Estimate minus 0.030, Standard error 0.127, z-Score minus 0.234, p-Value 0.815.
* Trial number: Estimate minus 0.04, Standard error 0.002, z-Score minus 23.137, p-Value less than 0.001.
* Right-hand use: Estimate 0.297, Standard error 0.159, z-Score 1.987, p-Value 0.0467.
* Trial number and right-hand use: Estimate less than minus 0.001, Standard error 0.002, z-Score minus 0.026, p-Value 0.979.
Significant predictors highlighted in the source data include the Intercept, Trial number, and Right-hand use based on p-Values less than 0.05.
Relationship between PPVT-V correct responses and hand use. The graph shows that when a child points with their right hand during a PPVT trial, they are more likely to select the correct response.

Relationship between PPVT-V trial number and correct responses. The graph shows the expected decline in correct responses as the child advances through the vocabulary test to more challenging words.

Figure 7. Long description
The horizontal X axis is labeled Trial Number of P P V T V with numerical markers at 0, 50, 100, and 150. The vertical Y axis is labeled Odds of Pointing to the Correct Answer with percentage markers at 0 percent, 25 percent, 50 percent, 75 percent, and 100 percent. A solid black line represents the data trend, surrounded by a light gray shaded area indicating the confidence interval or margin of error. The data follows a sigmoidal downward curve. Starting at trial 0, the odds are near 95 percent. The curve maintains a high plateau until approximately trial 25, then enters a steep linear decline between trials 50 and 125. By trial 100, the odds have dropped to 40 percent. After trial 150, the curve flattens out, approaching 0 percent as it reaches the final trials near 175.
4. Discussion
The purpose of this study was threefold. First, we explored if right-hand use for pointing or grasping would be predictors of cognitive development; specifically, language, EF, and SC through a within-subjects design. The variables included proxy measures (parent-completed questionnaires) of child EF and SC, as well as direct performance measures from the children: language (PPVT) and EF (block building task, DCCS, and animal Stroop). Second, we aimed to replicate the previous finding that right-hand use predicted correct responses during a vocabulary test for preschool children (PPVT; van Rootselaar et al., Reference van Rootselaar, Grandmont, Gibb, Li and Gonzalez2021). Finally, we investigated possible reciprocal relationships amongst cognitive and motor domains. Many previous studies have used several measures to document child development, but just in two areas. For example: hand preference and EF (Marlow et al., Reference Marlow, Hennessy, Bracewell, Wolke and Group2007; Gonzalez, Mills, et al., Reference Gonzalez, Mills, Genee, Li, Piquette, Rosen and Gibb2014; Gonzalez et al., Reference Gonzalez, Campbell, Marcinowski, Michel, Coxe and Nelson2020); hand preference and vocabulary (Michel, Reference Michel2021; Nelson et al., Reference Nelson, Gonzalez, Coxe, Campbell, Marcinowski and Michel2017; Nicoladis et al., Reference Nicoladis, Dueck and Zarezadehkheibari2021; van Rootselaar et al., Reference van Rootselaar, Grandmont, Gibb, Li and Gonzalez2021); vocabulary and EF (Longobardi et al., Reference Longobardi, Spataro, Frigerio and Rescorla2016; Pakarinen et al., Reference Pakarinen, Salminen, Lerkkanen and Von Suchodoletz2018; Ramsook et al., Reference Ramsook, Welsh and Bierman2020; Slot et al., Reference Slot, Bleses and Jensen2020); vocabulary and SC (Gertner et al., Reference Gertner, Rice and Hadley1994; Longobardi et al., Reference Longobardi, Spataro, Frigerio and Rescorla2016; Pakarinen et al., Reference Pakarinen, Salminen, Lerkkanen and Von Suchodoletz2018; Rice et al., Reference Rice, Sell and Hadley1991; Slot et al., Reference Slot, Bleses and Jensen2020); and EF and SC (Alduncin et al., Reference Alduncin, Huffman, Feldman and Loe2014; Benavides-Nieto et al., Reference Benavides-Nieto, Romero-Lopez, Quesada-Conde and Corredor2017; Caporaso et al., Reference Caporaso, Boseovski and Marcovitch2019; Longobardi et al., Reference Longobardi, Spataro, Frigerio and Rescorla2016; Pakarinen et al., Reference Pakarinen, Salminen, Lerkkanen and Von Suchodoletz2018; Romero- Lopez et al., Reference Romero-Lopez, Pichardo, Bembibre-Serrano and Garcia-Berben2020). The novel contribution of this study was to comprehensively (using both parent questionnaires and direct assessments of child behaviour) measure hand preference, fine motor skills, language, EF, and SC within the same cohort of preschool children. Based on our previous work (Gonzalez, Li, et al., Reference Gonzalez, Li, Mills, Rosen and Gibb2014; Gonzalez, Mills, et al., Reference Gonzalez, Mills, Genee, Li, Piquette, Rosen and Gibb2014; Gonzalez et al., Reference Gonzalez, van Rootselaar and Gibb2018; van Rootselaar et al., Reference van Rootselaar, Grandmont, Gibb, Li and Gonzalez2021), we predicted that hand preference would be related to most of the other behavioural measures. Further, we expected to observe a reciprocal relationship between the cognitive skills of language, EF, and SC, our main dependent variables. The simplified outcomes from this study are that (1) right-hand preference was not correlated with vocabulary size, EF, or SC; (2) right hand preference did predict correct responses in the PPVT test; (3) The three cognitive skills were interrelated; and (4) SC may be at the heart of preschool development.
The fact that right-hand preference did not predict EF and SC was unexpected. The goal of this experimental design was to expand on the literature which showed that strong right-hand preference supports EF to include SC. Given the previous evidence that in right-handed children, greater right-hand preference was related to better vocabulary (Gonzalez et al., Reference Gonzalez, Campbell, Marcinowski, Michel, Coxe and Nelson2020; Nelson et al., Reference Nelson, Campbell and Michel2014; Vauclair & Cochet, Reference Vauclair and Cochet2013), speech production (Gonzalez, Li, et al., Reference Gonzalez, Li, Mills, Rosen and Gibb2014), and EF (Gonzalez, Mills, et al., Reference Gonzalez, Mills, Genee, Li, Piquette, Rosen and Gibb2014), we expected to see right-hand preference predict these skills. A possible explanation for the lack of relationships between hand preference and the other behaviours may be partially attributed to the experimental design, where we collected data from multiple behavioural domains (and measures) derived from a single group of children. In the case of previous reports where hand preference predicted vocabulary (Mumford & Kita, Reference Mumford and Kita2016; Nelson et al., Reference Nelson, Gonzalez, Coxe, Campbell, Marcinowski and Michel2017), speech (Gonzalez, Li, et al., Reference Gonzalez, Li, Mills, Rosen and Gibb2014), or EF (Gonzalez, Mills, et al., Reference Gonzalez, Mills, Genee, Li, Piquette, Rosen and Gibb2014), only the two metrics were collected. Further, the measures used in the current study differed slightly from the measures used in the previous literature (e.g., right-hand use was based on model construction versus collecting blocks, as in Gonzalez, Mills, et al., Reference Gonzalez, Mills, Genee, Li, Piquette, Rosen and Gibb2014). Along the same argument, it is possible that if more measures were included in the previous studies, hand preference would not have been a significant predictor in a more robust analysis like a multiple linear regression with several factors. Another notable difference between the cited studies and the current one is the age of the children. Many of the studies included younger children in a longitudinal design (Gonzalez et al., Reference Gonzalez, Campbell, Marcinowski, Michel, Coxe and Nelson2020; Nelson et al., Reference Nelson, Gonzalez, Coxe, Campbell, Marcinowski and Michel2017) or had different age ranges (younger [Mumford & Kita, Reference Mumford and Kita2016] or older [Gonzalez, Li, et al., Reference Gonzalez, Li, Mills, Rosen and Gibb2014; Gonzalez, Mills, et al., Reference Gonzalez, Mills, Genee, Li, Piquette, Rosen and Gibb2014]) of children participate. It is possible that the relationship between right-hand preference and cognitive development is highly sensitive to developmental age. Finally, one more possibility that could explain the absence of a relationship between right hand use and the rest of the behaviours is the fact that SC emerged as a strong predictor of language and EF. Perhaps when multiple skills are collected simultaneously, the measure of SC overpowers the strength of the relationship between any other skills, including hand preference.
As a secondary outcome of the study, we did replicate the findings from van Rootselaar et al. (Reference van Rootselaar, Grandmont, Gibb, Li and Gonzalez2021). There was no significant correlation between right-hand use during the PPVT and children’s receptive vocabulary score (as in van Rootselaar et al., Reference van Rootselaar, Grandmont, Gibb, Li and Gonzalez2021). In the original study a logistic regression indicated that right-hand use was a significant predictor of correct responses during the first level of the PPVT. The results of the current study showed that right-hand use during each trial of the PPVT significantly increased the odds of a correct response. If a child used their right hand to point to the corresponding image, they were more likely to choose the correct answer. The result that children use their right hand to point to the correct answer suggests a consistent relationship between active hand use and language comprehension. For a more in-depth discussion, please see van Rootselaar et al., (Reference van Rootselaar, Grandmont, Gibb, Li and Gonzalez2021). This result highlights the importance of looking beyond simple correlational outcomes and suggests that a more nuanced relationship between hand preference and cognitive performance may exist in preschool aged children.
To better understand the role that the right hand for motor actions plays in development, a possible venue is to collect data from a large sample of children who are exclusively left-handed. Children with a strong left-hand preference are still an example of strong functional lateralization, but more often present with atypical neural organization (Gonzalez & Goodale, Reference Gonzalez and Goodale2009). Their performance, in comparison to children with a strong right-handed preference, would offer invaluable insight into the working theory presented in this manuscript. Another route of investigation would be to include children who are not typically developing. For example, children with diagnoses that impact any of the domains tested in this study, like motor skills, vocabulary, EF, or SC. Notably, some of these diagnoses also present with higher rates of left-hand preference, such as developmental coordination disorder (Darvik et al., Reference Darvik, Lorås and Pedersen2018), autism spectrum disorder (Knaus et al., Reference Knaus, Kamps and Foundas2016), fetal alcohol syndrome (Lindell, Reference Lindell2016), and attention deficit hyperactivity disorder (Nastou et al., Reference Nastou, Ocklenburg, Hoogman and Papadatou-Pastou2022). This link suggests that these developmental disorders and their behavioural features can be associated with atypical neural lateralization (Ocklenburg et al., Reference Ocklenburg, Mundorf, Gerrits, Karlsson, Papadatou-Pastou and Vingerhoets2024).
A major finding from the current study is the interwoven relationships between the cognitive measures. First, we found a reciprocal relationship between vocabulary and SC; the score of the PPVT was predicted by the score of the SRS and vice versa, where the SRS score was also predicted by the score of the PPVT. Furthermore, we also found that EF was related to both measures of SC (SRS, ASQ:SE), and this relationship was bidirectional in that both the SRS and ASQ:SE predicted the BRIEF-P GEC score. For each of these areas, better performance on one of the tests related to better performance or a better score on the related measures. These significant predictors from the stepwise regression models create a picture where aspects of language and SC are deeply connected in preschool children. Similarly, aspects of EF and SC seem to be intimately related. Intriguingly, the BRIEF score was not predicted by PPVT. This could be related to the nature of the BRIEF score, used as the dependent variable, as different measures of EF are not always related to each other (Ducan et al., Reference Duncan, Gerner, Neel, Burton, Byrne and Warschausky2024; Willoughby & Blair, Reference Willoughby and Blair2016), or as previously argued, due to having many dependent variables within the analysis.
EF did not appear to be a part of a reciprocal relationship between vocabulary size and SC. Previous research has shown the BRIEF-P is related to receptive vocabulary (Mann et al., Reference Mann, Hund, Hesson-McInnis and Roman2017), or the PPVT is predicted by measures of EF (Teepe et al., Reference Teepe, Molenaar, Oostdam, Fukkink and Verhoeven2017). In the current study, there was a significant negative correlation where a child with a better EF rating was more likely to possess a larger vocabulary (r=−0.38, p = 0.03). Despite the correlation, when the BRIEF score was entered into a regression model to predict PPVT score, it was not a significant factor. This result suggests that although EF and SC are deeply imbricated, EF is somewhat independent from vocabulary skill. Other studies also report a complex relationship between vocabulary and EF (Weiland et al., Reference Weiland, Barata and Yoshikawa2014). In this longitudinal study, researchers found that early preschool EF performance predicted vocabulary and EF three years later, while early vocabulary did not predict EF over the years (Weiland et al., Reference Weiland, Barata and Yoshikawa2014). We argue that language is somewhat more dissociable from EF compared to SC, with the acknowledgement that this idea is controversial (see Kuhn et al., Reference Kuhn, Willoughby, Wilbourn, Vernon-Feagans, Blair and Investigators2014; Marcovitch & Zelazo, Reference Marcovitch and Zelazo2009). Social interaction is nearly impossible without the assistance of a lexicon, whether it is a language or rudimentary gestures. Acquiring a lexicon is done most effectively through social interaction (Tomasello, Reference Tomasello1992), and children with both a sufficient lexicon and sufficient EF skills will be more likely to develop stronger SC. Arguably, EF could exist without a narrative of its components (Weiland et al., Reference Weiland, Barata and Yoshikawa2014; Marcovitch & Zelazo, Reference Marcovitch and Zelazo2009). However, elucidating this is beyond the scope of the current study. What emerged as a strong finding was that of SC predicting both vocabulary and EF.
With respect to language and SC, our findings support a large body of literature detailing the relationship between early childhood language/vocabulary and SC (Ramsook et al., Reference Ramsook, Welsh and Bierman2020; Longobardi et al., Reference Longobardi, Spataro, Frigerio and Rescorla2016; Pakarinen et al., Reference Pakarinen, Salminen, Lerkkanen and Von Suchodoletz2018; Slot et al., Reference Slot, Bleses and Jensen2020; Teepe et al., Reference Teepe, Molenaar, Oostdam, Fukkink and Verhoeven2017). In fact, some definitions of SC include communication as a sub-category of SC itself (Longobardi et al., Reference Longobardi, Spataro, Frigerio and Rescorla2016). Other assessments of SC use the term “social communication skills” (defined as the ability to use language appropriately in the classroom) in place of SC (Ramsook et al., Reference Ramsook, Welsh and Bierman2020). This evidence highlights how integral sufficient vocabulary can be to establishing social connections (Ramsook et al., Reference Ramsook, Welsh and Bierman2020). Studies also point to the idea that children who experience language delays may be viewed as sub-optimal play partners (Rice et al., Reference Rice, Sell and Hadley1991). When vocabulary was measured by the PPVT, it proved to be the best predictor of social success in preschoolers (Gertner et al., Reference Gertner, Rice and Hadley1994). The children chosen as preferred playmates were those with a more extensive vocabulary (Gertner et al., Reference Gertner, Rice and Hadley1994). They entered other variables into the regression analysis (age, IQ, and two other measures of language: the Reynell-Receptive test and Reynell-Expressive test), but these variables did not significantly contribute to the model (Gertner et al., Reference Gertner, Rice and Hadley1994). Together with the results of the current study, it appears that vocabulary size plays a pivotal role in the advancement of SC.
The other bidirectional relationship from the current study occurred between EF and SC, where children with better EF also had better SC. Other studies have shown similar findings in preschool and school-aged children (Alduncin et al., Reference Alduncin, Huffman, Feldman and Loe2014; Benavides-Nieto et al., Reference Benavides-Nieto, Romero-Lopez, Quesada-Conde and Corredor2017; Caporaso et al., Reference Caporaso, Boseovski and Marcovitch2019; Romero-Lopez et al., Reference Romero-Lopez, Pichardo, Bembibre-Serrano and Garcia-Berben2020); see Riggs et al., Reference Riggs, Jahromi, Razza, Dillworth-Bart and Mueller2006 for a review). One study found a significant relationship between the GEC score of the BRIEF-P and a standardized social questionnaire in preschool children (Alduncin et al., Reference Alduncin, Huffman, Feldman and Loe2014). Many previous studies argue that it is almost intuitive that elements of EF are intrinsic to achieving SC (Caporaso et al., Reference Caporaso, Boseovski and Marcovitch2019). For example, working memory allows a child to reflect on interactions and their own behaviour and to consider how they might change their behaviour for a more successful social encounter (Caporaso et al., Reference Caporaso, Boseovski and Marcovitch2019). A child employs inhibition to resist grabbing a toy from another child and avoids a disruptive social interaction (Riggs et al., Reference Riggs, Jahromi, Razza, Dillworth-Bart and Mueller2006). Beyond correlational findings, an EF intervention study revealed children in a training group outperformed controls in both EF and SC measured at the conclusion of the study (Romero-Lopez et al., Reference Romero-Lopez, Pichardo, Bembibre-Serrano and Garcia-Berben2020). In that study, 100 kindergarten children were separated into an EF intervention group and a control group (Romero-Lopez et al., Reference Romero-Lopez, Pichardo, Bembibre-Serrano and Garcia-Berben2020). The EF intervention required educators to spend two thirty-minute-long sessions a week over several months rehearsing EF skills, either playing games to promote inhibition development (e.g., Red light-green light; see Coelho et al., Reference Coelho, Amatto, Gonzalez and Gibb2020), or active role playing to practice emotional regulation and switching (e.g., classic fairy tales with reversed roles, Little Red Riding Hood where the wolf is good and the girl tricks the wolf; Romero-Lopez et al., Reference Romero-Lopez, Pichardo, Bembibre-Serrano and Garcia-Berben2020). The fact that the EF intervention significantly improved the post-test BRIEF scores as well as SC performance highlights the value of EF and its tight-knit relationship to SC. Because we found a bidirectional relationship between EF and SC, our study suggests that an intervention based on social interactions would also be effective in enhancing EF. This remains to be tested.
In conclusion, our findings suggest that cognitive functions develop both synergistically, building upon each other, but also independently, where a well-developed skill in one area does not ensure the same success in another (e.g., language and EF). By understanding how these skills are interrelated, there is the potential to refine a single intervention to promote development of multiple cognitive skills, including vocabulary, EF, and SC. Further research is needed to understand the role of hand preference in the early development of these skills. This research contributes to a body of literature that has reported both convincing results and null results regarding the impact of hand preference. The interrelatedness of the questionnaires and lack of strong relationships with the tabletop tasks and hand preference raise an important point for future research to carefully consider what each measure is truly addressing. It is possible that more naturalistic measures better reflect the child’s development is relationship to hand preference.
Acknowledgements
We are very grateful to the many families in Lethbridge and area who were willing to complete the questionnaires and those who donated time to bring their child into the university to participate in this study. We are also grateful to our wonderful community partners who helped us connect with parents and allowed us into their spaces. We would also like to thank Serena Jenkins, Sally Sade, Jonathon Ruiz, and the many other students who assisted with data collection. This research was funded by Natural Sciences and Engineering Research Council of Canada (NSERC), Community of Research Excellence and Development Opportunities (CREDO), the City of Lethbridge, and the University of Lethbridge.
Competing interests
The authors declare none.


 Open access