

1 Introduction
The two suffixes -ity and -ness are both very frequent and, on the face of it, seem to fulfill exactly the same core function: deriving a noun describing a quality or state from an adjective. The noun redness describes the quality or state of being red, and the noun insularity the quality or state of being insular. But although in these two cases the addition of the suffix seems to have the same effect, they are also a good example of the different behavior of the two suffixes: when searching in a huge up-to-date corpus like iWeb (Davies Reference Davies2018), one finds neither redity nor insularness, illustrating that the two suffixes do not seem to be attracted to the same adjectival bases.
At the same time, it is easy to find bases that occur with either affix, sometimes with a clear meaning difference between the two resulting derivations on specific usages; cf. activity vs. activeness in (1) and (2).
But it is similarly easy to find instances with no such obvious discernible meaning difference; cf. inclusivity in (3) vs. inclusiveness in (4).
These observations drive the two questions addressed in the article: what exactly determines the distribution of affixes with respect to bases, and what, if any, are the meaning differences between the two suffixes? While the first question has been much discussed and many pertinent factors have been identified, the role of the semantics of the bases in this has not been considered on a quantitative empirical basis. For the second question, there have been several attempts at identifying a semantic difference, but no large-scale empirical evidence has been put forward.
I use distributional semantics to address both questions, hypothesizing that: 1a. If the semantics of the bases drives affix selection, a clear semantic difference between bases taking -ity and bases taking -ness is expected. 1b. This difference should even hold for complex bases that end in the same suffix (e.g. -ive). These cases are of particular interest, because selection of either -ity or -ness cannot be based on the form of the ending or the final morpheme itself, as it stays the same. 2a. If -ity and -ness are synonymous, the change in meaning they bring about should be the same; in terms of distributional semantics, the shift in semantic space induced by the two suffixes should be the same for both -ity and -ness derivatives. 2b. Doublets (such as aggressivity–aggressiveness) should show no systematic difference in the semantic vectorspace.
2 Background and objectives
While both suffixes occur also with other bases, especially nouns (see Bauer, Lieber & Plag Reference Bauer, Lieber and Plag2013: chapter 13 for an overview), I will restrict my analysis to -ity and -ness derivatives with adjectival bases. This approach abstracts away from the complications arising with bound bases and prepositions, nouns, or phrases as bases (see Bauer et al. Reference Bauer, Lieber and Plag2013 for discussion). I will leave it to future research to explore the semantic space of these derivatives.
2.1 The role of the base in affix selection
Historically, -ness is the older of the two suffixes. It has been used since Old English to turn adjectives into nouns. Perhaps as a reflection of this, the majority of its bases are native although the suffix ‘may be tacked on to any adjective’ (Marchand Reference Marchand1969: 335). In contrast, -ity is newer, with -ity words, being whole-word borrowings from French, starting in the fourteenth and fifteenth centuries (see Riddle Reference Riddle and Fisiak1985 and Lindsay Reference Lindsay, Ralli, Booij, Scalise and Karasimos2012 for the complex borrowing history). This history is in line with the often observed aversion of -ity to native bases (Marchand Reference Marchand1969: 314) or even the claim that it is restricted to just Latinate bases (Aronoff Reference Aronoff1976: 51). Leaving history aside, there are intriguing differences in the distribution of the two affixes even in Present-Day English. On hapax-conditioned productivity measures, -ness is more productive than -ity (cf. Baayen & Renouf Reference Baayen and Renouf1996; Plag Reference Plag2006). Lindsay (Reference Lindsay, Ralli, Booij, Scalise and Karasimos2012), based on Google hits for 3,256 potential rival pairs, arrives at a more differentiated picture when looking more closely at the endings of potential bases: while -ness is overall more productive (in terms of its distribution across bases), -ity dominates in some subdomains. For example, bases ending in -ing, -ish and -ful occur only with -ness in Lindsay’s data, but both suffixes occur to a considerable extent with bases ending in -ous/-os and -ive, and -ity is dominant for bases ending in -able, -al, -ic and -ar (see also Anshen & Aronoff Reference Anshen and Aronoff1981 for experimental support of an -ity preference for -able/-ible bases).
Lindsay (Reference Lindsay, Ralli, Booij, Scalise and Karasimos2012) discusses this distributional difference in terms of a morphological constraint on -ity, but Arndt-Lappe (Reference Arndt-Lappe2014) points out that previous studies do not allow for a distinction between a preference for either suffix based on the morphological makeup of the base, or just the form of the base. To take just one example, is the decisive feature for the status of the adjective affective as a potential base for -ity or -ness just its form, that is, its ending on the string -ive, or the fact that it consists of a base and the morpheme -ive? In her own analogical modeling of whether a base takes -ity or -ness, Arndt-Lappe (Reference Arndt-Lappe2014) used a mostly form-based coding, with word-status (word vs. non-word, e.g. phrase/bound form) the only non-form-based information available to the model. The form-based coding was constituted by six phonetic features describing the two final syllables of the base. Using the set of the 564 twentieth-century neologisms in the OED as both training set and test set with a leave-one-out approach, her simulation yields a macro-averaged F-score of 0.88, indicating that the phonetic makeup of the last two syllables and the word-status of the base are good predictors of whether a neologism will end in -ity or -ness. This result suggests that the morphological status of the endings themselves is irrelevant.
While the morphological make-up of the base and its form features are central to the discussion in the literature, Riddle (Reference Riddle and Fisiak1985) points out that there are some semantic groups of bases that show very clear preferences, regardless of form. For example, color words only go with -ness. In addition, Riddle (Reference Riddle and Fisiak1985) argues that the suffixes within the bases might actually influence the choice between -ity and -ness because the suffixes still have semantic significance. In other words, that bases ending on -ful prefer -ness might equally well be based on a preference of -ness for a form feature, or for the specific morpheme -ful, or for adjectives whose meanings are similar because they all are formed with the help of this morpheme.
As we will shortly see, distributional semantics allows us to explore the role of semantics in affix selection on a large empirical scale.
2.2 Meaning differences between -ity and -ness
Looking exclusively at features of the base as the driving force in the selection of either -ity or -ness only makes sense under the assumption that -ity and -ness are synonyms, an assumption that is often left implicit and arises only from meaning descriptions. For example, Marchand (Reference Marchand1969: 312) characterizes -ity as ‘form[ing] abstract substantives from adjectives with the meaning “state, quality, condition of –”’, and -ness as ‘form[ing] abstract substantives with the meaning “state, quality, condition of –”’ Marchand (Reference Marchand1969: 334). For him, the only difference between the two suffixes lies in the restriction to adjectival bases for -ity, otherwise they are synonymous. Riddle (Reference Riddle and Fisiak1985: 437) markedly breaks with this assumption of synonymy, claiming that ‘the suffixes themselves have different meanings when occurring on many bases, but the distinction is not realized on all bases’. To support her view, she discusses a number of doublets, that is, pairs of -ity and -ness derivatives from the same base like hyperactivity and hyperactiveness, and argues that
-ness tends to denote an embodied attribute or trait, while -ity tends to denote an abstract or concrete entity. Examples of what I consider to be abstract entities are the names of concepts and situations and of characteristics in the generic sense. For example, an -ity word may refer to a characteristic, in the generic sense, while there is a tendency for the corresponding -ness word formed on the same base to describe an embodied attribute. (Riddle Reference Riddle and Fisiak1985: 437)
Supporting evidence for her are the usages of -ity and -ness in the two passages drawn from the same 1982 newspaper article, her (1):

In (5a), hyperactiveness, according to Riddle, ‘denotes an embodied attribute of a particular child’ (Reference Riddle and Fisiak1985: 438), while hyperactivity in (5b) denotes the condition. Riddle’s distinction has received much comment. Cowie (Reference Cowie1999: 263) convincingly argues that it is simply not possible to consistently distinguish between Riddle’s attribute and abstract entity senses. Bauer et al. (Reference Bauer, Lieber and Plag2013: 257) understand this difference in terms of the reification of the quality denoted by the adjective, that is, here, hyperactivity is reified because it is the name of a diagnosable condition. However, they note that this kind of difference does not obtain across the board for all doublets, and hypothesize that the observed difference might be linked to
the greater propensity of forms in -ity to be high frequency established forms and to have lexicalized meanings. Lexicalized forms can denote reified concepts or concrete objects. And indeed many -ity forms have such reified denotations. Indicative of this reification is the fact that some -ity nouns have become count nouns on specific readings, … (Bauer et al. Reference Bauer, Lieber and Plag2013: 257)
Baeskow (Reference Baeskow2012) is likewise dissatisfied with Riddle’s description of the nature of the observed difference and instead argues that -ness is sensitive to the scalar structure of its base, tending to select a ‘large degree of ADJ’ reading. One effect of this reading is the availability of degree interpretations even if the base adjective is non-gradable, e.g. in intense aliveness. In contrast, -ity selects the bare property, which is, according to Baeskow, in line with its preferred usage with Latinate scientific terms, for example the -ic and -il bases. Perhaps most interestingly, Baeskow (Reference Baeskow2012: 26–30), follows up on a footnote in Riddle (Reference Riddle and Fisiak1985) suggesting a link between between -ness and -ity usages and specific and generic readings. Baeskow argues that there is indeed such a connection between the two affixes and the possible readings. This preference for different readings is in turn linked to different syntactic environments: specific usages often occur together with an explicit realization of the external argument of the base adjective. For example, the pureness of the water receives a specific reading already because of the of -PP: we are talking about the specific pureness of a specific water. Even so, Baeskow (Reference Baeskow2012) is careful to note that both affixes may be used specifically as well as generically, and the exact quantitative basis of her observations does not become clear. The counterexamples that Bauer et al. (Reference Bauer, Lieber and Plag2013) adduce against Riddle’s analysis are similarly unexpected on Baeskow’s account. Riddle’s and Baeskow’s accounts suffer from the fact that even for the doublets neither explanation works satisfactorily, and that for the majority of derivatives, which do not have a corresponding form with the other suffix (from now on called ‘non-doublets’ in this article), the proposed semantic difference of the two affixes seems to play a role only for a very limited subset of bases. Again, distributional semantics allows us to investigate this on a large empirical scale.
2.3 Other aspects in the distribution of -ity and -ness
Two other aspects in the distribution of -ity and -ness derivatives that have received considerable attention are register and gender.
Plag, Dalton-Puffer & Baayen (Reference Plag, Dalton-Puffer and Baayen1999) lament that ‘very little attention has been devoted to the role derivational morphology may play in register variation’, pointing out that nominalizations in -tion, -ment, -ness or -ity are the only clearly word-formation related feature of the overall 67 linguistic features used in Biber (Reference Biber1988) for the analysis of register in English. Since -ity and -ness are both part of the same feature set, they cannot themselves distinguish between registers there. They are part of one feature set, because they both serve the function of compressing information into more compact form and ‘promoting’ more abstract concepts (Biber Reference Biber1986: 395). Plag et al. (Reference Plag, Dalton-Puffer and Baayen1999) further observe that they play only a limited role in distinguishing between the six basic factors of variation in English as identified in Biber (Reference Biber1988) and further analyzed in Biber (Reference Biber1995): nominalizations are associated with elaborated reference and emerge as one of the significant factors only for Biber’s dimension 3, situation-dependent versus elaborated reference. Plag et al. (Reference Plag, Dalton-Puffer and Baayen1999) themselves analyze both -ity and -ness individually, along with a third suffix producing abstract nominals, -ion and 12 other derivational affixes. They investigate differences in the productivity of the individual suffixes across speech and writing by using the three domains of the British National Corpus (BNC 2007), written, spoken context-governed and spoken demographic language. While they find that suffixes usually differ in their productivity across registers, they also find that these patterns are not uniform. In terms of differences between -ity and -ness in particular, they report that -ness is more likely to be used to coin new words, but, importantly, this difference obtains across all three registers. In terms of the average number of types, -ity and -ness appear to behave relatively similarly. Guz (Reference Guz2009) also investigates the distribution of -ity and -ness derivations in the BNC, comparing the category spoken as a whole against five subtypes of written texts. Notably, -ness derivatives are more frequent in fiction than in academic texts, while -ity derivatives are most frequent in academic texts. Guz also reports that the derivatives show marked differences in their patterns when considering the morphological structure of the bases, and that these effects are more marked for -ness than for -ity derivatives.
Clear differences in -ity and -ness use are also reported in works using historical data. Rodríguez-Puente, Säily & Suomela (Reference Rodríguez-Puente, Säily and Suomela2022) show that -ity became more frequently used relative to -ness during the Early Modern English period, and that this development was linked to register in that it started in written registers and only later spread to speech-related registers (e.g. ranging from diaries and letters to drama and sermons). Cowie (Reference Cowie1999) investigates both affixes in the ARCHER corpus ranging from 1650 to 1990 and finds different register preferences, for -ity in scientific and medical writing, for -ness in sermons and fiction. But ‘all registers have derivations in both suffixes, and there is no clear and unambiguous preference’ (Cowie Reference Cowie1999: 248).
For gender, Säily & Suomela (Reference Säily, Suomela, Renouf and Kehoe2009) found no difference for -ness, but a clear difference for -ity in the seventeenth-century part of the Corpus of Early English Correspondence: it is used less productively by women. This difference, however, disappears in the eighteenth-century part of the same corpus (Säily Reference Säily, Nevalainen, Palander-Collin and Säily2018). For Present-Day English, Säily (Reference Säily2011), using the BNC, found again clear gender differences. For -ity in written English, the results are the same as for the seventeenth century: women use -ity less productively. In contrast, the same diverse usage is found for -ness across both genders. In the spoken subcorpus, both suffixes are used less productively by women, with the difference tied to lower-class women in the case of -ness.
2.4 Distributional semantics in morphology
Over the last decade, distributional semantics has become a mainstream method in linguistics (Boleda Reference Boleda2020), including word-formation semantics (cf. the overview and Kotowski & Schäfer Reference Kotowski and Schäfer2023, Bonami & Naranjo Reference Bonami and Naranjo2023 and Schäfer Reference Schäfer2023 in Kotowski & Plag Reference Kotowski and Plag2023). The fundamental idea behind distributional semantics is that the meaning of a word is reflected in its distribution, with the distributional hypothesis that ‘[w]ords with similar distributional properties have similar meanings’ Sahlgren (Reference Sahlgren2006: 21). Key to the computational implementation of this idea is the step of encoding the distribution of a word by means of a vector in geometrical space.
To see how distributional semantics works and how it can fruitfully be used for morphological questions, let’s say we are interested in whether the two derivatives inclusivity and inclusiveness are semantically more or less similar to each other than to their base, inclusive. For our toy example of a distributional semantics analysis, we collect the cooccurrences of inclusivity, inclusiveness and inclusive with different context words, for example the nouns environment, part or price. Tabulating the cooccurrences gives us table 1, where the first cell tells us that inclusive cooccurred twice with environment.
Toy example illustrating the first step in creating a simple distributional model: collecting cooccurrence counts for the target words, here the cooccurrences of inclusive, inclusiveness and inclusivity with the three nouns environment, part and price

We now take the cooccurrence counts to represent vectors, so that the vector (2,1,4) represents inclusive, and the vector (4,3,1) represents the word inclusiveness, that is, the vectors correspond one-to-one to the rows in the tabulated cooccurrences. Figure 1 illustrates how these vectors can be mapped into geometrical space: the context words, here environment, part and price, represent the dimensions of the vectorspace, and the cooccurrence counts with the target words determine the length and directionality of the three vectors, each of which encodes the distribution of the corresponding lexeme.
A three-dimensional space showing the distributional vectors of inclusiveness, inclusivity and inclusive based on the toy data in table 1. The three dimensions stand for the cooccurrences with the nouns verbs environment, part and price

This visualization by itself already shows that the three vectors are not equally similar to each other. Among the three, the vector representing inclusive is clearly the outlier, and we can already gauge the answer to our initial question from the visualization: apparently, the two derivatives are more similar to each other than to their base. A common measure to quantify similarity between vectors is the cosine similarity (Boleda Reference Boleda2020). The cosine similarity is simply the cosine of the angle that holds between any two vectors. The angle $ \phi $
between the vector for inclusiveness and the vector for inclusivity in figure 1 is 16 degree, taking the cosine yields the cosine similarity of 0.96. In contrast, the vectors of the two other pairings, inclusiveness and inclusive as well as inclusivity and inclusive, are far less similar on this measure. For the first pair, the 50 degree angle results in a cosine similarity of 0.64, for the second pair, the angle of 53 degree results in a cosine similarity of 0.60.
$ \phi $
between the vector for inclusiveness and the vector for inclusivity in figure 1 is 16 degree, taking the cosine yields the cosine similarity of 0.96. In contrast, the vectors of the two other pairings, inclusiveness and inclusive as well as inclusivity and inclusive, are far less similar on this measure. For the first pair, the 50 degree angle results in a cosine similarity of 0.64, for the second pair, the angle of 53 degree results in a cosine similarity of 0.60.
The cosine similarity has been established as a good stand-in for semantic similarity between the words represented by the vectors, with correlations between human judgments of semantic similarity between word pairs and the corresponding cosine similarity commonly used as benchmarks for the quality of distributional models (Baroni, Dinu & Kruszewski Reference Baroni, Dinu and Kruszewski2014). The highest possible cosine similarity value is 1, the angle between the two vectors is 0 degree and the distribution as captured by the vectors is extremely similar (and in fact identical if all vectors have the same length). In contrast, a cosine similarity value close to zero indicates that the vectors are separated by a 90 degree angle and are basically unrelated. In our toy example, the cosine similarities suggests that inclusiveness and inclusivity are semantically extremely similar, while cosine similarities between the vector for inclusive and the two derivatives suggest that it is less semantically similar to both.
The vectors in our toy example can be visualized easily because we just need three dimensions. To visually explore the high-dimensional vectors that are standardly used in distributional semantics, dimension-reduction techniques can be applied, usually mapping the high-dimensional vectors into two-dimensional space. This article uses the t-SNE dimension-reduction technique and subsequent visualization.
Finally, classification techniques can be applied to check for patterns in the vectors. This article uses Linear Discriminant Analysis (LDA) for this purpose. LDA is a supervised classification method that predicts the class of an item, in this case a word, out of a set of given classes with the help of numerical predictors, in this case, the corresponding word vectors. For our toy example, we could check whether LDA can correctly classify the three words into the two classes BASE and DERIVATIVE based on their vectors. Since LDA lets us quantitatively express the success of its application, it is the ideal complement to the combination of t-SNE and subsequent visualization.
While the first distributional semantic encodings were based on cooccurrence counts and additional normalization steps, since the publication of the word2vec algorithm (Mikolov, Chen, Corrado & Dean Reference Mikolov, Chen, Corrado and Dean2013), word vectors are most often created via machine learning, and many thus trained vector sets are freely available. In a comparative study by Baroni et al. (Reference Baroni, Dinu and Kruszewski2014), these vectors, often called embeddings, on average outperform the count models. The fastText set of vectors (Mikolov, Grave, Bojanowski, Puhrsch & Joulin Reference Mikolov, Grave, Bojanowski, Puhrsch and Joulin2017) used in this article is such a pretrained vector set, containing word vectors with 300 dimensions.
Before closing this section on distributional semantics and morphology, one word on the status of distributional vectors with regard to the possible difference between -ity and -ness derivatives due to their usage in different registers or by different speakers. Both types of differences, if they are indeed reflected in different distributions, can and ideally will contribute to differences between the vectors of the respective words. I will come back to the consequences of this for the interpretation of the results of this investigation in the respective discussion sections.
2.5 Expectations and hypotheses
I will address the following research questions: (i) What is the role of the base adjectives’ semantics in determining the choice between -ity and -ness and (ii) Are the two suffixes synonymous? Concerning the role of base semantics in affix selection, I hypothesize that:

To address the issue of synonymy of -ity and -ness, I hypothesize that:

These questions are addressed via two separate studies. The first study investigates non-doublets with a dataset of -ity and -ness derivatives and their bases. The second study investigates the semantics of doublets. In both studies, I also consider whether the absolute frequency of the derivatives plays a role, hypothesizing that higher frequencies, taken as indicators of lexicalization, might also be associated with a higher proportion of idiosyncratic meaning shifts that might obscure an understanding of the typical behavior of the derivatives relative to their bases. This is particularly relevant for the second study, since lexicalization has been considered as a factor for non-synonymy of -ity/-ness doublets.
For both study 1 and study 2, all preparatory steps and all further analysis are reproducible via the scripts and data available at https://doi.org/10.6084/m9.figshare.23538207.
3 Study 1: semantic clustering of bases and derivatives
The first study focuses on hypotheses (ia), (ib) and (iia). To address whether the semantics of the bases is linked to a preference for -ity or -ness, I test whether non-doublet bases are semantically different. To investigate the semantics of the -ity and -ness affixes for the non-doublets, I compare the clustering of base vectors to the clustering of the derivative vectors themselves. To address (iia) in more detail, I also investigate the cosine similarities between bases and derivatives, and the possible influence of the lemma frequencies of both bases and derivatives on these.
3.1 Materials and techniques
I first sampled all pairs of adjectival bases and -ity/-ness derivatives in the ukWaC corpus (Baroni, Bernardini, Ferraresi & Zanchetta Reference Baroni, Bernardini, Ferraresi and Zanchetta2009) with pretrained fastText vectors (Mikolov et al. Reference Mikolov, Grave, Bojanowski, Puhrsch and Joulin2017). These vectors are analyzed with t-SNE, a dimensionality reduction technique, and Latent Discriminant Analysis, a classification technique. For comparisons of the cosine similarities, standard statistical comparisons and regression analyses are used.
3.2 Dataset
The ukWaC corpus is a web-derived 2-billion-word corpus of English (see Baroni et al. Reference Baroni, Bernardini, Ferraresi and Zanchetta2009). Its size is big enough to contain enough lower-frequency -ity and -ness words, while at the same time not too big to be used outside of high-performance computing contexts. It is fully part-of-speech-tagged and lemmatized with TreeTagger (www.cis.uni-muenchen.de/~schmid/tools/TreeTagger/), and conveniently provides frequency lists. The ukWaC corpus does not come with pretrained vectors, nor are pretrained vectors based on it available elsewhere. In principle, it is possible to derive vectors from the ukWaC, but this would require computing power and subsequent evaluation of the quality of the vectorspace that far exceeds the bounds of what is possible and reasonable to do in this article. In addition, given that it is well known that vectors created for low-frequency words tend to be unreliable, with 50 occurrences often used as a threshold for the minimal occurrence of one lemma, using the ukWaC itself as the base for the vectors would also have meant the exclusion of almost half of the pairs that were selected in the ukWaC for the investigation. Instead, I looked for a pretrained vectorset that has been trained on language data that is by and large comparable to the ukWaC, and that, in addition, contains vectors for a high number of base-derivative pairs in the ukWaC. The vectorset that best fulfilled these conditions were the fastText vectors.
I chose the fastTest vectors that do not include subword information (wiki-news-300d-1M.vec.zip available at https://fasttext.cc/docs/en/english-vectors.html (last accessed 18 March 2024)), as this subword information would automatically help to differentiate between our target derivatives via their different endings, -ity and -ness. The vectors are trained on 16 billion tokens, using a corpus that itself was concatenated from 5 different web-sources and web-derived corpora. This raw corpus is not available (and cannot easily be reconstructed). Importantly, for our purposes it is similar enough to the corpus base of the ukWaC in that exclusively English-language web-based content is used. One additional advantage of using a set of independently trained vectors is the very fact that it was created independently from the main questions of this article, that is, the vectorspace has not been created with the aim of maximally distinguishing between -ness and -ity items.
The combination of the ukWaC corpus and the fastText vectors thus guarantees a large number of vector presentations for base-derivative pairs and allows us to meaningfully include part-of-speech tagging and lemma frequencies in our further data preparation and analysis. To establish the pairs of base adjective and derived -ity or -ness words, the following steps were taken:
A. Identifying all base-derivative pairs in the ukWaC
-
1. To obtain the derivatives, I selected all forms ending in either -ity or -ness from the ukWaC unigram lemma lists. These lists contain 33,011 -ity and 17,796 -ness items, with upper- and lowercase items treated as distinct.
-
2. These lists were first cleaned by only keeping items either consisting of alphabetic characters only, or consisting of alphabetic characters in combination with a single non-initial hyphen. Further, lower- and uppercase lemmata were merged. Some compounds with high-frequency derivatives as the final element were also excluded (for example, hyphenated compounds ending in -capacity or -business). This leaves 20,509 -ity lemmata and 15,464 -ness lemmata.
-
3. Adding possible bases to each item in the list and filtering
Both -ity and -ness show variation in the way the adjectival base is combined with the affix. To find an adjectival base for a given derivative, possible base forms were created by exploiting the following patterns, each exemplified by an existing base/derivative pair:

Whenever a possible base was added, the resulting pair was only kept when the possible base also occurred in the ukWaC unigram list. If not, the next orthographic variant was considered, until a base occurring in the unigram list had been found or all possibilities had been exhausted, in which case the derivative was not further considered. This filtering followed the order in (6). To illustrate, for brutality, the first three patterns, (6ai)–(6aiii), do not match the ending and were therefore skipped. The next pattern fits, but the resulting possible base, brutale, does not occur in the unigram list, therefore the final pattern, just stripping the -ity, is used, successfully identifying the pair brutal-brutality.

This results in 7,285 -ity base-derivative pairs and 8,785 -ness base-derivative pairs.
B. Final filtering steps
-
1. The resulting items were checked against all available fastText-vectors, and only those pairs were kept for which the vectorspace provided both a vector for the derivative as well as for the base. This results in 1,572 -ity pairs and 1,836 -ness pairs.
-
2. Only those pairs were selected for which the base was tagged as an adjective in the ukWaC (including cases where this was not the only POS-tag). Some items with obvious spelling errors or nonstandard spelling variants were also excluded (e.g. possiblity etc.). This leaves 1,475 -ity pairs and 1,802 -ness pairs.
No attempt was made to identify or exclude items that might be construed via different pathways. For example, unchastity is here paired with unchaste because it fits the -e/-ity pattern and the adjective unchaste exists in the ukWaC corpus. Whether a derivation via un- prefixation from chastity is historically or psychologically more adequate was not explored: neither is there the relevant etymological data for all pairs, nor are there any clear criteria to decide when etymologically correct derivations do or do not correspond to the actual synchronic analyses of speakers.
From this dataset I eliminated the doublets and set them aside for separate analysis (see study 2). This leaves us with 1,343 -ity and 1,671 -ness pairs. The derivatives cover a wide frequency range for both -ity and -ness words. Table 2 shows the distribution of the derivatives across the full frequency range by binning the lemmata via their frequencies. The bins were chosen to give a representative overview across the frequency ranges, keeping an eye on an even distribution of the two affixes in each bin and reasonable bin sizes.
Distribution of the -ity and -ness lemmata in terms of token frequency. Doublets are excluded

The distribution of -ity and -ness derivatives in terms of token frequency is in line with the overall greater productivity of -ness, reflected in more -ness derivatives in the lower-frequency bins. It is also in line with Bauer et al. (Reference Bauer, Lieber and Plag2013: 257) in that the distribution clearly shows a propensity of -ity derivatives in the higher-frequency ranges.
Table 3 shows the distribution of the -ity and -ness lemmata over notable patterns in their endings, illustrated with examples from the data. Classification is exclusively based on orthography. Patterns were manually identified by sorting all bases by their reverse endings and looking for repeated characters and morphemes.
Distribution of endings in the adjective bases of -ity/-ness derivatives, with one example for each affix. Doublets are excluded

Again, this distribution is in line with previous studies. For example, that -ble, -al, -ic, -ar favor -ity and -ed, -ing, -less, -ish, -ful, -nt, -ous, -ive favor -ness also emerges in Lindsay (Reference Lindsay, Ralli, Booij, Scalise and Karasimos2012). The table also shows that form-based and meaning-based factors in the choice between -ity and -ness for bases that fall in notable form classes often cannot be teased apart because the distribution within specific forms is too uneven. Only bases ending in the string -ive have a sufficiently high number of both -ity and -ness derivatives (90 -ity and 108 -ness). This subset, that is, the non-doublets with bases ending on -ive, will be analyzed separately because it allows me to investigate the influence of meaning independent of form.
3.3 Analysis
The main analysis of the data consists of two steps. First, the 300-dimensional word vectors are mapped onto two-dimensional space using t-Distributed Stochastic Neighbor Embedding (t-SNE), a technique designed to reveal patterns in the data. These patterns can be identified directly from the visualization. It is an unsupervised, exploratory approach to the data. Second, I use a classification technique, Linear Discriminant Analysis (LDA), to corroborate the results of the visual inspection of the mapping. This, in contrast, is a supervised approach: LDA is used to find the best way to classify the data in the classes identified by me beforehand. With this two-step approach, I follow Shafaei-Bajestan, Moradipour-Tari, Uhrig & Baayen (Reference Shafaei-Bajestan, Moradipour-Tari, Uhrig and Baayen2022). For the analysis of the cosine similarities, I use standard inferential statistics and regression modeling.
t-Distributed Stochastic Neighbor Embedding (t-SNE) (van der Maaten & Hinton Reference Van der Maaten and Hinton2008) first converts the high-dimensional data into a matrix of pairwise similarities, with the aim of efficiently finding a low-dimensional equivalent that is as faithful as possible to the pairwise similarities. Searching for a transformation that minimizes the error between input and output similarities, ‘t-SNE is capable of capturing much of the local structure of the high-dimensional data very well, while also revealing global structure such as the presence of clusters at several scales’ (van der Maaten & Hinton Reference Van der Maaten and Hinton2008: 2587). Visualizing the resulting dimensions has proven highly successful in cluster-detection (Arora, Hu & Kothari Reference Arora, Hu and Kothari2018; see also van der Maaten & Hinton Reference Van der Maaten and Hinton2008 for comparison with other dimensionality reduction techniques on a variety of datasets). In using t-SNE, a number of parameters can be set that influence the behavior of the algorithm. The settings used in this study are the same as used in Shafaei-Bajestan et al. (Reference Shafaei-Bajestan, Moradipour-Tari, Uhrig and Baayen2022). This was done because their study was also on English morphology, and, more importantly, the results for my data when using these settings showed clear and interpretable patterns. Note that this does not mean that other settings would not have produced even better interpretable results, the interested reader can experiment with the settings when inspecting the data and scripts that come with this article where the detailed settings are documented.
Linear Discriminant Analysis (LDA), in contrast, is used here for classification. I use LDA to predict the class of an item, in this case a word, with the help of numerical predictors, in this case, the corresponding word vectors. In this first study, I am always interested in the classification into two classes: for the bases, whether it is a base for an -ity or a -ness derivative, and for the derivatives, whether they are -ity or -ness derivatives. It is an instance of supervised classification, because the number of classes that the classifier is supposed to identify was decided on beforehand. To evaluate how well this classification works, the whole dataset is divided into a training set and a test set. The LDA classifier is trained on the training set, having pairs of vectors and their class available, and then evaluated against the test set, where the classifier predicts the class of the vectors.To assess the quality of the predictions, the results are checked against the true value in the dataset. The average weighted F1-score is used to quantify the success. The F1 score in its simple form (sometimes just called F-score), as in (7), takes into account the precision and recall of the classifier.
(7)
 $$ \mathrm{F}1=2\ast \frac{\left(\mathrm{Precision}\ast \mathrm{Recall}\right)}{\left(\mathrm{Precision}+\mathrm{Recall}\right)} $$
Precision is the ratio of items that are correctly predicted for a given category, divided by the total number of items for which the classifier predicts this category. Recall is the ratio of the number of correct predictions of items in a category divided by the total number of items in this category. This is best explained with the help of an example: let’s say we have 250 word vectors representing 100 -ity and 150 -ness derivatives. We use our LDA classifier to predict for each word vector whether it belongs to a -ness derivative or not. We then compare the predictions to what we have in our dataset. This is usually done via a confusion matrix; see table 4. This matrix shows us how many word vectors were correctly predicted to correspond to -ness words, the true positives, and how many were wrongly predicted to be -ness words but are in fact not -ness words, the false positives. And we also have the false negatives, word vectors that are predicted to be not -ness but are in fact -ness, and the true negatives, word vectors that are correctly predicted to not be -ness derivatives.
Toy confusion matrix for an LDA classifier predicting the class, -ity or -ness, for 250 vectors

Precision quantifies the number of correct predictions and is the ratio of correct predictions to positive predictions overall; see (8) with the numbers from the table:
(8)
 $$ \mathrm{precision}=\frac{\mathrm{true}\ \mathrm{positives}}{\mathrm{true}\ \mathrm{positives}+\mathrm{false}\ \mathrm{positives}}=\frac{100}{100+30}=0.77 $$
Recall quantifies the number of correct predictions relative to the number of correct predictions that would have been possible. It is the ratio of true positives to the sum of true positive and false negatives; see (9).
(9)
 $$ \mathrm{Recall}=\frac{\mathrm{true}\ \mathrm{positives}}{\mathrm{true}\ \mathrm{positives}+\mathrm{false}\ \mathrm{negatives}}=\frac{100}{100+50}=0.67 $$
So, in our case the F1 value assessing the correct prediction of -ness derivatives is:
(10)
 $$ \mathrm{F}1=2\ast \frac{\left( precision\ast recall\right)}{\left( precision+ recall\right)}=0.71 $$
Using the same toy data to calculate the F1 value for the correct prediction of -ity items, Precision is 70/120 = .58 and Recall 70/100= .7, yielding the F1 score .64. The weighted F1 score is the combination of these two scores in proportion to the number of occurrences of -ity/-ness in the dataset:
(11)
 $$ \mathrm{weighted}\hskip0.55em \mathrm{F}1=100/250\ast {\mathrm{F}1}_{ity}+150/250\ast {\mathrm{F}1}_{ness}=0.68 $$
The average weighted F1-score reported below is based on a repeated stratified cross-validation, using ten splits and three repetitions. This means that the data is split into ten equal parts (or folds), and then the LDA classifier is trained on nine parts and tested against the remaining tenth part. This is done ten times, with each fold of the dataset being the test set once. This whole procedure is repeated three times, with each time a different split into ten parts.
This score is compared against the average weighted F1-score of a baseline classifier that either assigns the most frequent category to everything, or either of the two categories in the case of an exact split.Footnote 2 For our toy example above, the baseline classifier would assign -ness to every vector, because it is the most common category. With precision at 150/250 = .6 and recall at 150/150 = 1, the F1 score is .75. For -ity, the F1 score is 0. The weighted F1 score is .45. That is, the classifier in our toy example clearly outperforms the baseline classifier.
All calculations of cosine similarities and vector manipulations were done with Python, the software implementations of both t-SNE as well as LDA I use come from Python’s scikit-learn library (Pedregosa et al. Reference Pedregosa, Varoquaux, Gramfort, Michel, Thirion, Grisel, Blondel, Prettenhofer, Weiss, Dubourg, Vanderplas, Passos, Cournapeau, Brucher, Perrot and Duchesnay2011). All statistical analysis of cosine similarities was done with R Statistical Software (v4.1.2; R Core Team Reference Team2021), using the mgcv package for beta regression (Wood Reference Wood2017) and and visreg (Breheny & Burchett Reference Breheny and Burchett2017) for visualization.
3.4 Results (study 1)
Figure 2 shows the t-SNE visualization of the 300-dimensional vectors of the adjectival bases on a two-dimensional plane. Blue circles represent the projections of the vectors of the bases of -ness derivatives, red crosses represent the vectors of bases of -ity derivatives.
Projection of the vectors of the adjective bases into two-dimensional space using the t-SNE dimension reduction technique. Bases of doublets are excluded

We see that each set of bases clearly clusters together, with -ity bases concentrated in the right half, -ness bases in the left half. There are bases of both types outside their clusters and intruding into the other cluster, overall in equal measure for both -ity and -ness bases. The existence of these two clusters shows that the bases of -ity derivatives are clearly semantically distinct from the bases of -ness derivatives. The clear clustering is supported by the LDA classifier, trained to predict the vectors as either -ity or -ness bases: the average weighted F1 score is 0.849 (0.018 std), against the weighted F1 of 0.395 for a baseline classifier. In other words, the LDA performs well in classifying the bases into -ity and -ness bases, while the baseline classifier performs very poorly.
Figure 3 shows the t-SNE visualization of just the -ive bases within the set of non-doublets, again with blue circles representing projections of the vectors of -ness bases and red crosses projections of the -ity bases.
Projection of the vectors of the adjective bases ending in -ive into two-dimensional space using the t-SNE dimension reduction technique. Bases of doublets are excluded

In figure 3, the -ness bases cluster in the upper half, the -ity bases in the lower half (note that the orientation of the clusters on the plane is meaningless). We see that even if we restrict the dataset to bases with the same ending, -ive, both types of bases are again clearly separated. So, even when no form-based feature allows for a distinction (all bases share the same form in that they end in -ive), there is a clear semantic difference between bases of -ity derivatives and bases of -ness derivatives. Again, the LDA similarly shows a high mean weighted F1 score of 0.744, standard deviation of 0.098, against the weighted F1 score of the baseline classifier of 0.385.
Turning now to the projections of the derivatives themselves, figure 4 shows the clustering of all derivatives, figure 5 that of only the derivatives with -ive bases. Except for different placements of the two clusters in the two-dimensional space, the overall pattern, that is, two big clusters, is very similar to the pattern observed for the bases.
Projection of the vectors of the non-doublet derivatives into two-dimensional space using the t-SNE dimension-reduction technique. Derivatives forming doublets are excluded

Projection of the vectors of derivatives of adjectives ending in -ive into two-dimensional space using the t-SNE dimension-reduction technique. Derivatives forming doublets are excluded

Again, LDA supports these clusterings, both for all derivatives (mean weighted F1 score = 0.858, std = 0.017), as well as for the -ive derivatives (mean weighted F1 = 0.863, std = 0.069).
Across frequency bands, the clustering into two main clusters of -ity and -ness vectors remains relatively stable, except for the two highest-frequency bands, where -ness items are relatively rare (see figures 14 to 27 in the Appendix). Importantly, the clustering for base vectors and for derivative vectors is similar within each frequency band, as can also be seen in the LDA summary table in 5, which, for reference, repeats the value for the full dataset in the top row.
LDA performs best on the whole dataset, and across frequency bands the mean weighted F1 score never drops below 0.665 (median = 0.753) for the base vectors and 0.645 (median = 0.747) for the derivatives vectors, and the values are highly correlated (Kendall’s tau = 0.905, p = 0.003). In contrast, the baseline classifier performs poorly across the board, with the exception of the superhigh- and ultrahigh-frequency bands, where the scoring profits from the high imbalance of ity to ness items (superhigh: 115 to 48, ultrahigh 97 to 18, see table 2). However, even there the LDA scores are better.
When we compare the cosine similarities between the -ity and -ness base-derivative pairs, we observe considerable variation for both the -ity and -ness pairs. Descriptively, they are roughly similar, cf. the values characterizing the distribution in table 6, further illustrated in the density plot in figure 6.
Density plots for cosine similarities between paired -ity and -ness bases. Derivatives forming doublets are excluded

Overview of LDAs across frequency bands for both bases and derivatives, reporting the mean weighted F1-score and the standard deviation. The weighted F1-score of the baseline classifier is given in the rightmost column

Cosine similarities between the base and the derivative for all -ity and -ness pairs (excluding doublets)

Both are not normally distributed and show a similar range of variation. Even so, they significantly differ statistically both with regard to their mean as well as their variance (Wilcoxon: W = 1189258, p-value = 0.004666; F-test: F = 1.5035, p-value = 2.887e-15).
To explore the influence of lemma frequencies on the cosine similarities between the base-derivative pairs, I modeled the cosine similarities with a beta regression model; see table 7. This model includes the affix (-ity or -ness) and the weakly correlated log-frequencies (Kendall’s tau = 0.301, p = <2.2e-16) of bases and derivatives as predictors. The frequencies emerge as highly significant predictors and participate in an interaction. Lemma frequency accounts for almost all of the variance explained by the model. The affix itself is also a significant factor, but contributes very little to explained variance (its inclusion leads to an improvement of the adjusted R-squared by just 0.0016).
Beta regression for cosine similarity between the non-doublets. R-sq.(adj) = 0.09 deviance explained = 9.81%

In other words, there is a very slight influence of the affix as such on the observed cosine similarity.
3.5 Discussion (study 1)
The patterning of the data in figure 2 shows that the bases of -ity and -ness derivatives fall into two clear clusters. This is in line with hypothesis 1a and shows that the meaning of the base is a very powerful predictor of whether the base selects for -ity or -ness. Addressing hypothesis 1b, figure 3 shows that this even holds for the -ive bases, a test set where the last syllable does not contain any useful information for morphological or form-based approaches. The results for -ive bases very clearly show that the observed effects are independent of the morphological and formal makeup of the bases. This result is in line with the points made by Riddle (Reference Riddle and Fisiak1985) with regard to small semantically consistent swathes of the lexicon showing clear preferences (e.g. the color words) and the idea that the morphological endings of bases might be useful as formal predictors because they serve as indicators of shared semantics.
Turning to the derivatives, figures 4 and 5 show that the derivatives also fall into two main clusters, in this respect similar to their bases. When looking at the cosine similarities between bases and derivatives, the overall distributions for -ity and -ness pairs differ significantly, although they are roughly similar in shape: they both are not normally distributed and left-skewed, and have very similar medians and means. When modeling the cosine similarities, the interaction of base and derivative frequencies accounts for almost all of the explained variation, but the affix still emerges as a significant predictor. How does this link to hypothesis 2a, to what extent can we say that the change in meaning induced by the two affixes is the same? It is obviously not exactly the same, but I believe that overall we can say that the change in meaning they adduce is still relatively similar. The affix emerges as significant predictor, but it accounts only for a minimal part of the variation. At the same time, saying that it is relatively similar does not mean that we can identify a very specific change in meaning that is induced, since part of what makes the two similar is the huge variation and also the skewedness of the distributions. And what does it mean for the meaning change induced by the affixes that both bases and derivatives show comparable distinct clusterings? Together with the cosine similarities, it can again be taken to support the view that the meaning change is similar: the effect of adding either affix does not make the resulting derivatives more or less similar than their respective bases already are, that is, they are moved in the distributional space, but these shifts are similar for both affixes.
This interpretation is not in line with regard to the hypothesis from Baeskow (Reference Baeskow2012) that the derivatives also show a ‘syntactic effect’ in that -ness derivatives favor the syntactic realization of the external argument of the adjective base. This would lead us to expect a clearer difference between the vectors of the derivatives than between the vectors of the bases, and also a clearer pattern in the cosine similarities, something we do not find. In a similar vein, this finding is also unexpected on the assumption of a pervasive register difference between -ity and -ness derivatives: again, we would expect a clearer difference between the vector of the derivatives, and also a clearer pattern in the cosine similarities.
4 Study 2: doublets
Study 2 considers all (and only) doublets. Doublets are pairs of -ity and -ness derivatives formed from the same base. Hypothesis 2b is in focus here: If -ity and -ness are synonymous, doublets (such as aggressivity/aggressiveness) should show no systematic meaning difference, as they share the same bases. Here, I again use the same techniques as before for the analysis of the derivatives: first, t-SNE for visualization and LDA for statistical corroboration of the derivative vectors. Second, I also consider the similarities between the doublets in order to see whether any general trend can be identified in the data. Derivative frequencies are also considered. If frequency is correlated with lexicalization, then I expect a higher likelihood of higher-frequency items having developed idiosyncratic meanings.
4.1 Materials and techniques
4.1.1 Materials
There are 130 doublets in the data. The doublets also show clear differences between the -ity and -ness items in their distribution across the frequency spectrum, as shown in the density plot in figure 7.
Density plot of the log frequencies of the ity and ness derivatives in the doublets

Just as for the non-doublets, the -ity derivatives tend to have higher token frequencies, whereas the -ness derivatives on average have lower frequencies and only very few high- frequency items. The frequencies of -ity and -ness items within the doublets are not correlated (Kendall’s tau = -0.02, p = .68).
When we look at the endings of the bases (see table 8), we see a smaller subset of possible adjective endings as expected, with none of the 100 percent -ness endings from study 1 occurring here. Notably, 47 doublets are derived from adjectives ending in -ive.
Distribution of endings in the bases of all doublets

4.1.2 Techniques
For looking at the vectors themselves, I use the same techniques as in study 1, that is, t-SNE visualization combined with LDA. Further, to explore the within-doublet similarities, I look at the cosine similarities between members of a doublet. In order to probe the role of lexicalization via lemma frequency, I use beta regression to model the similarity within doublets.
4.2 Results (study 2)
Figure 8 shows the projection of all derivatives participating in doublets, again using the t-SNE visualization. In sharp contrast to the projections in study 1, there is no discernible clustering of the -ity and -ness vectors.
Projection of the vectors of all doublets into two-dimensional space using the t-SNE dimension reduction technique

The LDA results in a notable low mean weighted F1 score of just 0.562 (0.101 std), against a baseline classifier weighted F1 score of 0.333.
When it comes to the cosine similarities within doublets, we observe considerable variation, with a minimum similarity of 0.268 and a maximum of 0.867 (median = 0.639, mean = 0.614). Table 9 illustrates the data by showing doublets across the distribution of cosine similarity values.
Illustration of doublets across the distribution of cosine similarities within doublets. The two doublets closest to the respective cosine similarity values have been selected

This variation is not caused by any specific pattern in the endings. When just considering the largest subset with the same ending, again -ive, we find a similarly shaped wide distribution across the cosine similarity space, see table 10.
Distribution of cosine similarities within -ive doublets

To explore the role of lemma frequency of the derivatives, I modeled the cosine similarity between the items within a doublet with a beta-regression model. The uncorrelated log-frequencies of -ity and -ness items show an interaction, cf. the model summary in table 11 and the interaction plot in figure 9.
Interaction plot of log frequencies of -ity and -ness derivatives in the beta regression model for doublet similarity. The individual panels show the relationship between the -ity log frequency and the cosine similarity within doublets for specific values of -ness log frequencies. These -ness log frequencies values increase across the panels, from left to right, as shown at the top of the panels

Beta regression for cosine similarity between the doublets. R-sq.(adj) = 0.137 deviance explained = 16.4%

The interaction plot shows in its first three panels that for very low up to medium high -ness frequencies, higher -ity frequencies are associated with lower cosine similarity values of the doublets. These negative associations all come with tight confidence bands, showing that this negative association is reliable. Doublets that illustrate this effect are officiality/officialness vs. morbidity/morbidness with cosine similarities of 0.82 and 0.41. Both officiality and officialness come from the ultralow-frequency band. In contrast, morbidity is from the ultrahigh-frequency band, while morbidness again is an ultralow-frequency item. Across the first three panels, the slope of the negative association and its starting point change: the highest cosine similarity predicted by the model becomes successively lower, and the slope successively less steep. However, this second aspect is less reliable: if we concentrate on the effect of -ness frequency when -ity frequency is low, that is, on the leftmost points in each of the three panels, we see that each starting point is contained in the other two panels’ confidence intervals. Similarly, at the end point on the right-hand side, the confidence intervals overlap from panel to panel. For the high-frequency end of the -ness items, shown in the rightmost panel, the relationship changes and a positive association is plotted. Here, the model is very unsure about the association, as shown by the huge confidence intervals. Pairs such as inclusivity/inclusiveness and reasonability/reasonableness, with cosine similarities of 0.87 and 0.73, illustrate this panel, with inclusivity in the superhigh bracket and inclusiveness in the high bracket, but reasonability in the low bracket and reasonableness again in the high bracket.
4.3 Discussion (study 2)
Study 2 lets us address hypothesis 2b: figure 8 reveals no clustering, again in line with the idea that -ity and -ness are synonymous. At the same time, the range of cosine similarities within doublets is in line with the observations from the literature that there are doublets which clearly show a meaning difference in specific contexts or for which one would even be hard pressed to find a context where they could be used interchangeably. But, and this backs the points by Bauer et al. (Reference Bauer, Lieber and Plag2013), there is no systematic pattern across the doublets. The similarity within doublets can be successfully modeled with the frequencies of the participating -ity and -ness forms, which participate in an interaction. This interaction is difficult to interpret, and I will restrict the interpretation here to the one single clear effect: when the -ness frequency is low to midhigh, the cosine similarity between doublets is negatively correlated with -ity frequency. This is in line with the idea expressed in Bauer et al. (Reference Bauer, Lieber and Plag2013) that high-frequency -ity items are associated with a large number of different lexicalization pathways, moving the corresponding vectors away from more conventional usages. That is, if we assume that high-frequency items are in general liable to become lexicalized, and if we further assume that there is not only one possible lexicalization pathway for -ity derivatives, then we would expect (a) that high-frequency items are used differently from low-frequency items and (b) that these different usages show not one, clearly discernible, pattern, but only more or less idiosyncratic differences. If we complementarily also assume that the same is to be expected for -ness, that is, the higher the frequency, the more often we find different lexicalization pathways, we would expect that for low frequencies, both -ness and ity derivations show a more conventional picture. The high cosine similarity here is then again supporting the idea that the two suffixes have the same semantic effect on their bases. The weaker effect of -ness frequency given a low -ity frequency could indicate that -ness derivatives show less variety in their lexicalization pathways. All in all, the reliable patterns in the results for the doublets are in line with the idea that -ity and -ness induce similar meaning shifts and that diverging usages of doublets are likely to have arisen from lexicalization.
5 General discussion
5.1 Prediction via bases and the relationship of semantic vectors to other predictors
One core result of this study is that the distributional vectors of the bases already predict whether the base comes with a corresponding -ity or -ness derivative. What exactly are then the semantic properties shared by the respective bases, and how does this relate to morphological and form-based prediction?
Mapping the data onto traditional semantic classes turns out to be problematic. This is due to the fact that there are no off-the-shelf classifications of adjectives that allow meaningful distinctions across the 3,277 adjectival bases considered here. This holds for classifications used in theoretical works as well as for classifications used in natural language processing. Intuitively clear classes, for example the speed class introduced in Dixon (Reference Dixon1982) or the class of color words discussed by Riddle (Reference Riddle and Fisiak1985), yield extremely small subsets, while most adjectives, in terms of Dixon’s classification, can be assigned to the human propensity class, which thus is not diagnostically helpful. And a large lexical database like WordNet (Fellbaum, Reference Fellbaum1998) has only a crude distinction into two adjective classes, relational vs. all other adjectives. As a result, studies using distributional semantics to explore adjective semantics often look at a very small number of adjectives. For example, in Schäfer (Reference Schäfer2023) I use the Dixon classification and investigate just 11 human propensity and 11 speed adjectives. At least we can use these small sets as a proof of concept that the t-SNE algorithm does cluster semantic features. In figure 10, this is shown for the adjectives from the two classes explored in Schäfer (Reference Schäfer2023) that are also in the dataset, along with all color adjectives in the dataset.
Projection of adjective bases from three different semantic classes of adjectives: color (6 bases), human propensity (9 bases), and speed (9 bases) into two-dimensional space using the t-SNE dimension reduction technique

While admittedly these 24 bases are an extremely small subset of the dataset, they show that traditional semantic classes are in fact recognized by the t-SNE algorithm. For the -ity/-ness dataset, we can therefore assume that these traditional classifications are part of the structure that is exploited in the vectorspace for clustering the vectors and for the LDA-predictions.
Moving away from the traditional semantic classes, there is the question of how the structure in the distributional vectors exploited here relates to the classic findings with regard to the influence of the morpheme makeup of the bases and/or their form. Starting with the morphemic endings associated with either -ity or -ness derivatives, there is one obvious way in which to explore the semantic space further: we have Riddle’s (Reference Riddle and Fisiak1985) suggestion that the suffixes within the bases might actually influence the choice between -ity and -ness because the suffixes still have semantic significance. If this is the case, then we would expect that complex bases with affixes that are known to play a role in the selection (see the discussion in section 2.1 and also the overview at the end of table 3 for the non-doublets and in table 8 for the doublets) would also cluster together within the distributional vectors of all bases. I will explore this here by looking at three endings that usually correspond to morphemes: the big group of -ble bases, containing all bases that are formed with either -able or -ible, as the group that most favors -ity; and two smaller groups of bases ending in -ful and -ish, containing all bases formed with the respective affixes and showing a clear preference for -ness.
Figure 11 shows the t-SNE visualization for -ble against all other base vectors in the dataset. The -ble bases are further categorized into three groups: ble_onlyIty for the bases that only take -ity, ble_doublet for the doublet bases, and ble_onlyNess for those bases that go only with -ness. We see that the ble_onlyIty bases form a large cluster towards the bottom of the plot, and several smaller ones in the upper half. Most clusters, including the biggest cluster, overlap with non-ble bases. The ble_doublet and the ble_onlyNess bases do not form clusters and, in the majority, are relatively removed from the central cluster.
Projection of the vectors of all bases into two-dimensional space using the t-SNE dimension reduction technique. All -ble bases are labeled

That is, the majority of -ble bases that are only associated with -ity in my dataset are also close to each other in our vectorspace, while the more peripheral members, the doublet and -ness bases, do not form a consistent group and are removed from the core group of -ble bases. Overall, the finding that quite a number of ble_onlyIty bases occur all over the vectorspace indicates that as a whole they do not form a consistent semantic group, by itself a likely explanation for the development of doublets and items with even a -ness preference. That these bases do not form a consistent group is also in line with categorizations of the affixes -able/-ible into several distinct categories in qualitative analyses. For example, Hamawand (Reference Hamawand2007: 51–3) distinguishes five meaning variants for -able alone, with these variants varying with the different semantics of the bases they combine with.
Turning to the bases favoring -ness, both -ful and -ish are only associated with -ness forms, there are no doublets nor instances of bases prefering -ity. Figure 12 shows that this is reflected very clearly in the corresponding semantic vectors: both groups mainly cluster in the upper left third, and overall distribute over just a bit more than half of the vectorspace. Just as with -ble, they do not occupy unique spaces within the bases, but overlap with each other and other bases.
Projection of the vectors of all bases into two-dimensional space using the t-SNE dimension reduction technique. All -ful and -ish bases are labeled

Already the overlap between the -ful and -ish bases is intriguing. In the literature, both suffixes, -ful and -ish, are usually argued to contribute distinct semantic content, clearest in the case of -ful with a gloss like ‘full of BASE’, cf. Hamawand (Reference Hamawand2007: 216) or Bauer et al. (Reference Bauer, Lieber and Plag2013: 311). t-SNE with subsequent visualization provides a pathway to explore this further in future research, especially in conjunction with the question of how much of the difference in meaning of a complex adjective is already dependent on the semantics of the base. Even though both groups overlap, their overall clustering in such a clearly defined area of the vectorspace partially explains why the t-SNE visualizations and LDA predictions without the knowledge of the internal make-up of the bases already work so well: semantically, too, they are clearly set apart from roughly half of the other bases.
What about -ive bases? We have already seen the plots and LDA analysis of just its non-doublet bases. Figure 13 shows all -ive bases in the context of all other bases, again with the three groups, -ive bases that go with -ity, -ive bases that go with -ness, and doublet bases marked.
Projection of the vectors of all bases into two-dimensional space using the t-SNE dimension reduction technique. All -ive bases are labeled

We clearly see that they do not form any sort of clear cluster in the vectorset of all bases but are distributed with one relatively tight cluster of -ity bases in the upper left corner, and most -ness bases placed outside the third of the graph extending from this cluster. While the picture for the doublet bases is not absolutely clear, many are located in the middle area between these two regions or at the edge of the -ness area. So in terms of the distribution of the vectors of -ive bases within the semantic space of all bases, the reason why -ive bases are not a good predictor of a base taking either -ity or -ness is simply that they do not form a clear cluster that would go with either of the two affixes.
Given these figures, it seems plausible to assume that in many cases including information about the endings would not yield better predictions, but this is an issue left to further research here: I have not looked at the placement of all affixes in the model, and I have also not distinguished between endings in terms of form and in terms of morphemes. The mean weighted F1 score for the LDA of the bases in the whole dataset without doublets is 0.849. This is slightly lower than the weighted F1 score of 0.887 for Arndt-Lappe’s AM model trained and targeting OED twentieth-century neologisms, but our two studies cannot be compared directly. First, the set of OED twentieth-century neologisms is smaller than the dataset investigated here, with 344 -ity and 220 -ness derivatives in her dataset against the 1,475 -ity pairs and 1,802 -ness in my non-doublet dataset (note: Arndt-Lappe also models the OED neologisms of the two previous centuries, but not all taken together, and her model is best at modeling the twentieth-century neologisms). Second, the bases compared in my study are more tightly constrained in being all adjective bases, while Arndt-Lappe (Reference Arndt-Lappe2014) used a dataset with bases of different word classes and also non-word bases. The difference in word status, i.e. word vs. non-word (e.g. phrase/bound form), was one of the predictors in the analogical model, the other predictors were a purely form-based coding, in particular, six phonetic features describing the two final syllables of the base. It is an intriguing question how the two systems, my LDA based on distributional vectors and Arndt-Lappe’s model using word status and form features, would perform on the respective other datasets. Given that the predictive power of Arndt-Lappe’s model diminishes when she uses the neologisms of previous centuries (eighteenth and nineteenth) to predict the neologisms of the following century, we can hypothesize that the base vectors might also form tighter sets when considered in comparable time brackets corresponding to first occurrence of the respective derivatives. A further open question is to what extent Arndt-Lappe’s models were successfully able to deal with subsets with the same ending, in our dataset exemplified by the -ive non-doublets, in which the distributional vectors of the bases are still good predictors. Ideal, but left here for further research, would be a direct comparison of the different approaches on the same dataset, or, as a first step, the investigation of the data used in my study with the help of vectors that are sensitive to the internal structure of the words, for example fastText vectors with subword information.
5.2 The issue of affix synonymy
The results with regard to affix synonymy have been less clear than the results concerning the role of base semantics in affix selection. In fact, as one reviewer points out, if we also approach synonymy from a purely distributional perspective, we would have to say that they are clearly not synonymous: they typically occur in different contexts, with the subset of doublet bases constituting only 4 percent of the full set of bases. Thus, a more moderate question to ask is whether they have the same effect on the meaning of the base. Here, study 1 showed that the semantic similarity in terms of cosine similarities between base and derivatives is relatively similar but nevertheless significantly different. We also saw from study 1 that the semantic effect of the affixes does not result in the sets of derivatives becoming more or less similar than the bases already were. From study 2 we saw very clearly that there is no consistent pattern in the doublets, that is, it does not look as if accounts that assume one function for -ity and one for -ness in the case of doublets could explain the distribution. All the same, given the huge variance in the vector similarities observed for both the set of non-doublets and the set of doublets, the assumption of one single meaning change consistently induced by either affix does not seem justified. This finding is not surprising if one compares the -ity/-ness rivalry to other affix rivalries in English discussed against corpus data. Kaunisto (Reference Kaunisto, McConchie, Honkapohja and Tyrkkö2009) concludes that the type and degree of differentiations shown by -ive/-ory doublets like illusive/illusory in the BNC and the COCA is ‘fairly heterogeneous’. While he does not provide a quantitative measure of similarity across the ten target pairs in his corpus analysis, his qualitative assessment reveals a variety of ways in which the pairs show differentiation, with compulsive/compulsory showing the highest degree of differentiation, but at least three pairs only differentiated through their usage frequencies. Gries (Reference Gries2003) (building on Gries Reference Gries2001) explores the similarity between -ic/-ical pairs (e.g. magic/magical) via a visualization technique placing the bases of 47 pairs in two-dimensional space based on the percentage of overlapping significant collocates for each member of the pair. This is statistically backed up by adapting the sub(stitution) test proposed in Church, Gale, Hanks, Hindle & Moon (Reference Church, Gale, Hanks, Hindle, Moon, Atkins and Zampolli1994). As in the findings reported here, Gries finds a continuum of similarity, and no consistent difference between pairs. Applying his methods to my dataset must be left to future work but is of considerable interest, not only as a cross-validation but also because mapping and comparing cosine similarities is, once the vectors are available, technically the easier of the two methods. Another avenue for further research lies again in the distributional semantics approach itself: a more detailed look at the offset vectors of the bases and derivatives, that is, the vectors that result from subtracting the vector of the base from the vector of the derivative, could yield more insights and also allow notable subsets within the datasets to be identifed more easily.
Finally, I argued in the discussion of study 1 that the findings are not in line with a syntactic-based explanation for the difference between -ity and -ness derivatives, nor with a register-based explanation. In both cases we would expect a clearer difference between the semantic vectors of the derivatives than what we find for the bases. If the contexts are more distinct for the derivatives, this should allow the vectors to be separated more easily, and we would also expect a very clear difference in the cosine similarities between the two groups. Can I exclude an influence of register altogether? No, technically, for example, it could be that the semantic effect of adding either -ity or -ness in terms of traditional semantics, e.g. non-distributional semantics, makes the set of derivatives more similar. But if it is in fact true that -ity and -ness are associated with clearly different registers, this greater semantic similarity in terms of classic meaning description might be hidden due to the register differences also encoded in the vector representations. Such possibly very complex interactions of different shifts in semantic space and register cannot be detected in my setup. It is, however, not impossible to detect them in principle. A pathway for further research is to use a register-tagged corpus instead of the ukWaC, and to start from the categories identified for -ness in particular in Guz (Reference Guz2009), that is, to exploit the fact that already patterns in the bases are linked to different register preferences, and also consider the register preferences of the bases themselves.
6 Summary
This article addressed two core questions concerning the affix rivalry between -ity and -ness with the help of distributional semantics. Study 1 has shown that already the distributional vectors of the adjectival bases of -ity and -ness derivatives are good predictors of the affix choice. This does not only hold across all forms, but also for the only substantial subset of bases sharing the same ending, the -ive bases. Even for those, the bases associated with either -ity or -ness clearly cluster together. That is, bases that select -ity have different semantic properties than bases that select -ness. These results leave open whether Arndt-Lappe’s phonological effect of the word’s endings might emerge from the shared semantics of the respective bases, but as we saw in the general discussion, at least for the three clearly -ity- or -ness-leaning base endings we also observe clear distinct patterns within the set of all bases considered in the study, indicating that here distributional semantics and morpheme/form-based information go hand in hand. Besides establishing base semantics as a major factor in affix selection, study 1 has also shown that the distribution of the derivatives in the vector space shows a very similar clustering, in line with the idea that -ity and -ness induce similar meaning shifts. But as similar as these are, given the huge variation in resulting cosine similarities between bases and affixes and the fact that the affix itself remains a significant predictor in the model, this question needs further investigation. Study 2 used doublets to investigate the question of affix synonymy further. Since the doublets show only unsystematic differences, and since the frequencies of the derivatives play a significant role in accounting for this variation, one plausible explanation for any observed difference between pairs lies not in a systematic difference in meaning shifts brought about by the two affixes themselves but in effects of lexicalization.
In short, the semantic properties of the bases are a major factor in affix selection, while the two affixes themselves are synonyms to the extent that they have relatively similar effects on their bases.
Appendix: t-SNE across frequency bands
Below are the t-SNE visualizations for the data from study 1 within the individual frequency bands, starting at the low end, the ultralow band, and finishing with the highest band, the ultrahigh band. For ease of reference, the LDA scores already reported in table 5 are also given in the figure captions of the visualizations.
Ultralow-frequency band
ADJ bases, ultralow frequency, no doublets. Corresponding mean weighted LDA scores: 0.686, standard deviation 0.061

ADJ derivatives, ultralow frequency, no doublets. Corresponding mean weighted LDA scores: 0.693, standard deviation 0.066

Low-frequency band
ADJ bases, low frequency, no doublets. Corresponding mean weighted LDA scores: 0.816, 0.04 standard deviation

ADJ derivatives, low frequency, no doublets. Corresponding mean weighted LDA scores: 0.821, 0.032 standard deviation

Mid frequency band
ADJ bases, mid frequency, no doublets. Corresponding mean weighted LDA scores: 0.753, 0.057 standard deviation

ADJ derivatives, mid frequency, no doublets. Corresponding mean weighted LDA scores: 0.747,0.057 standard deviation

Midhigh-frequency band
ADJ bases mid high frequency, no doublets. Corresponding mean weighted LDA scores: 0.665, 0.079 standard deviation

ADJ derivatives, mid high frequency, no doublets. Corresponding mean weighted LDA scores: 0.683, 0.08 standard deviation

High-frequency band
ADJ bases, high frequency, no doublets. Corresponding mean weighted LDA scores: 0.678, standard deviation 0.072

ADJ derivatives, high frequency, no doublets. Corresponding mean weighted LDA scores: 0.645, 0.094 standard deviation

Superhigh-frequency band
ADJ bases, super high frequency, no doublets. Corresponding mean weighted LDA scores: 0.756, standard deviation 0.075

ADJ derivatives, super high frequency, no doublets. Corresponding mean weighted LDA scores: 0.777, standard deviation 0.102

Ultrahigh-frequency band
ADJ bases ultrahigh, no doublets. Corresponding mean weighted LDA scores: 0.785, 0.09 standard deviation

ADJ derivatives, ultrahigh frequency, no doublets. Corresponding mean weighted LDA scores: 0.805, 0.087 standard deviation

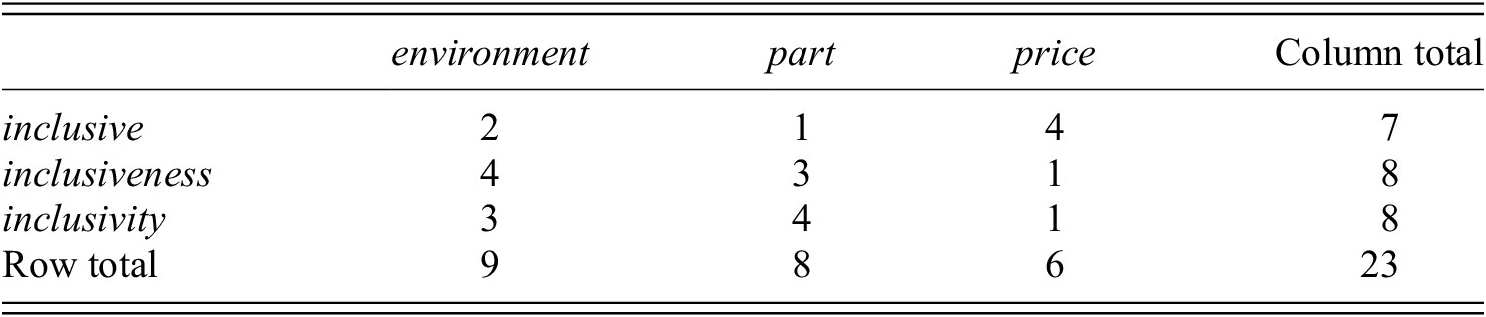
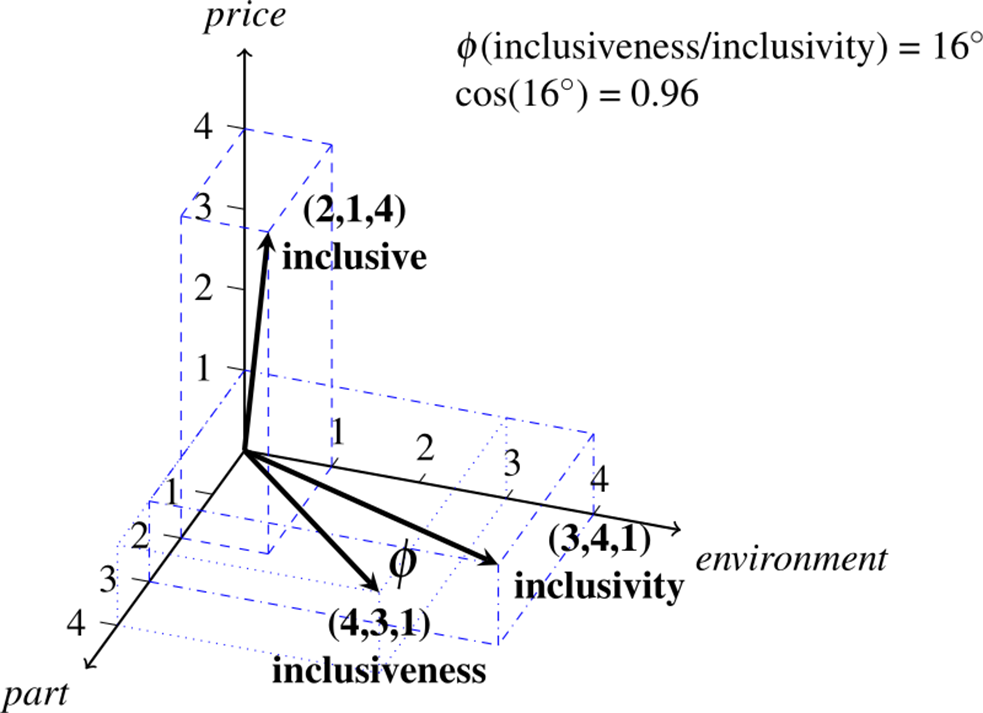
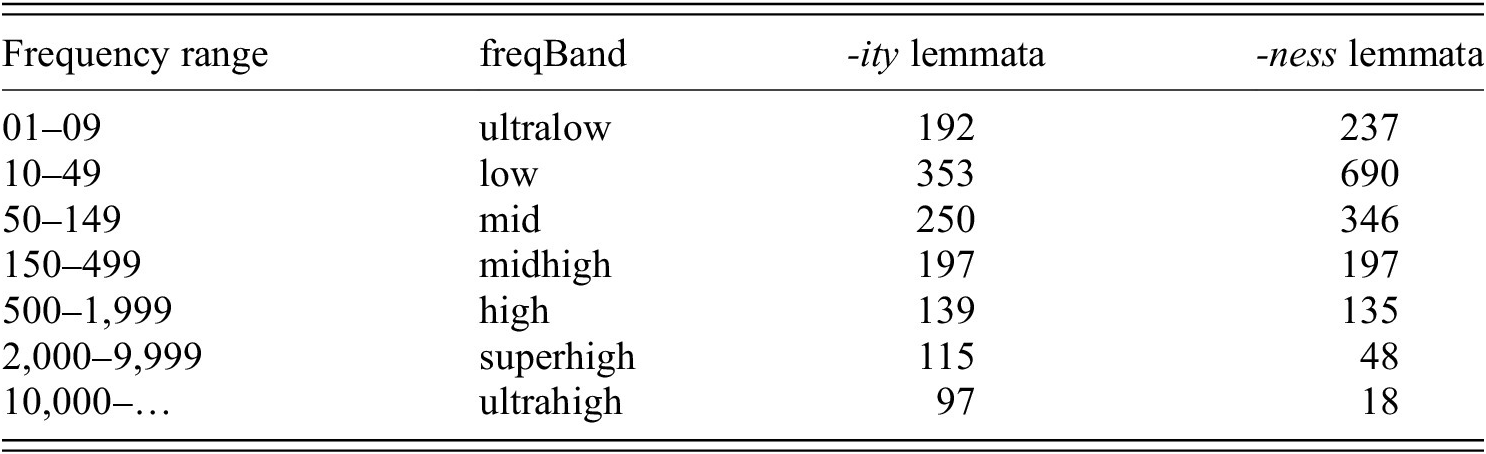
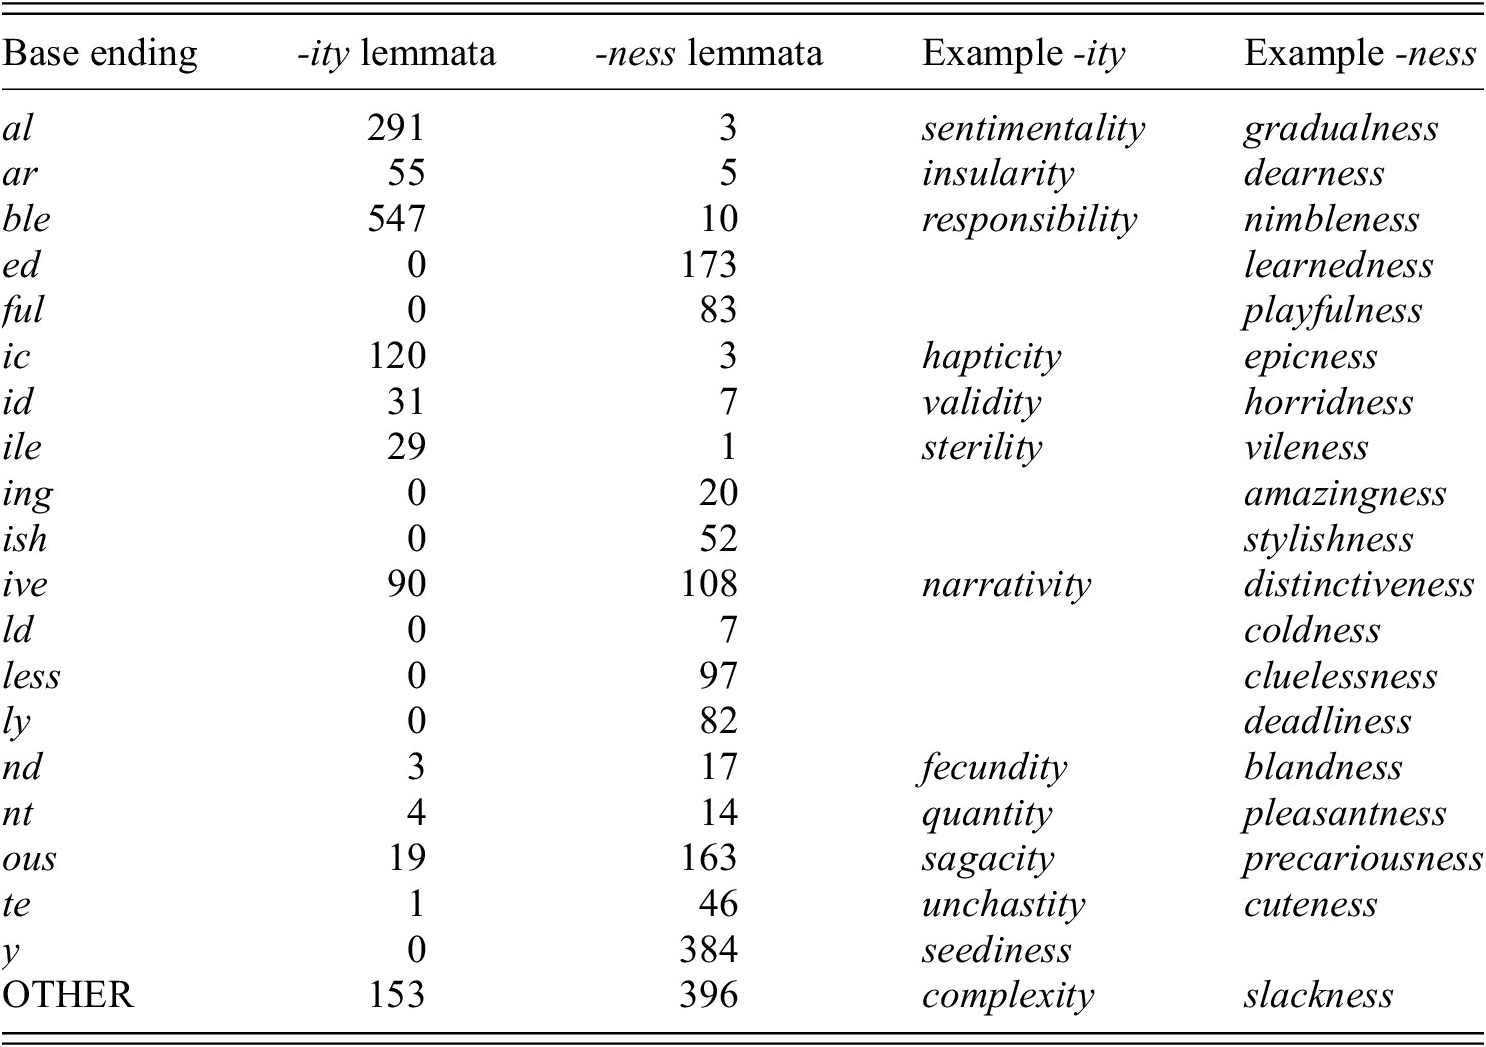
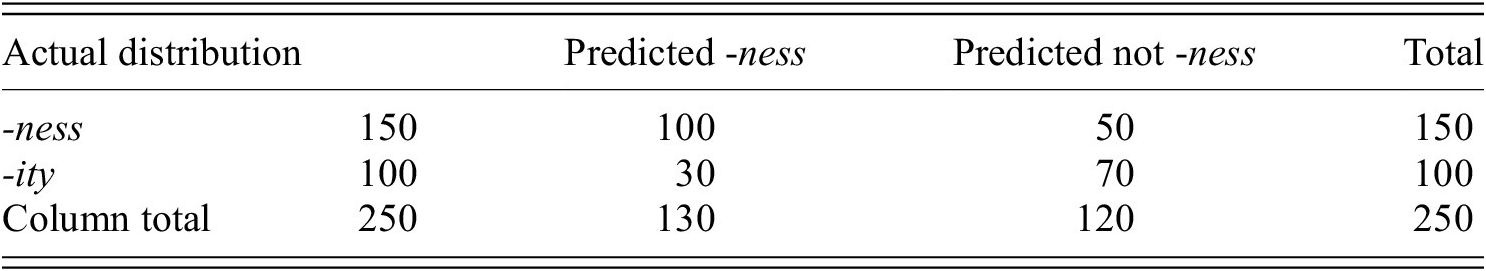

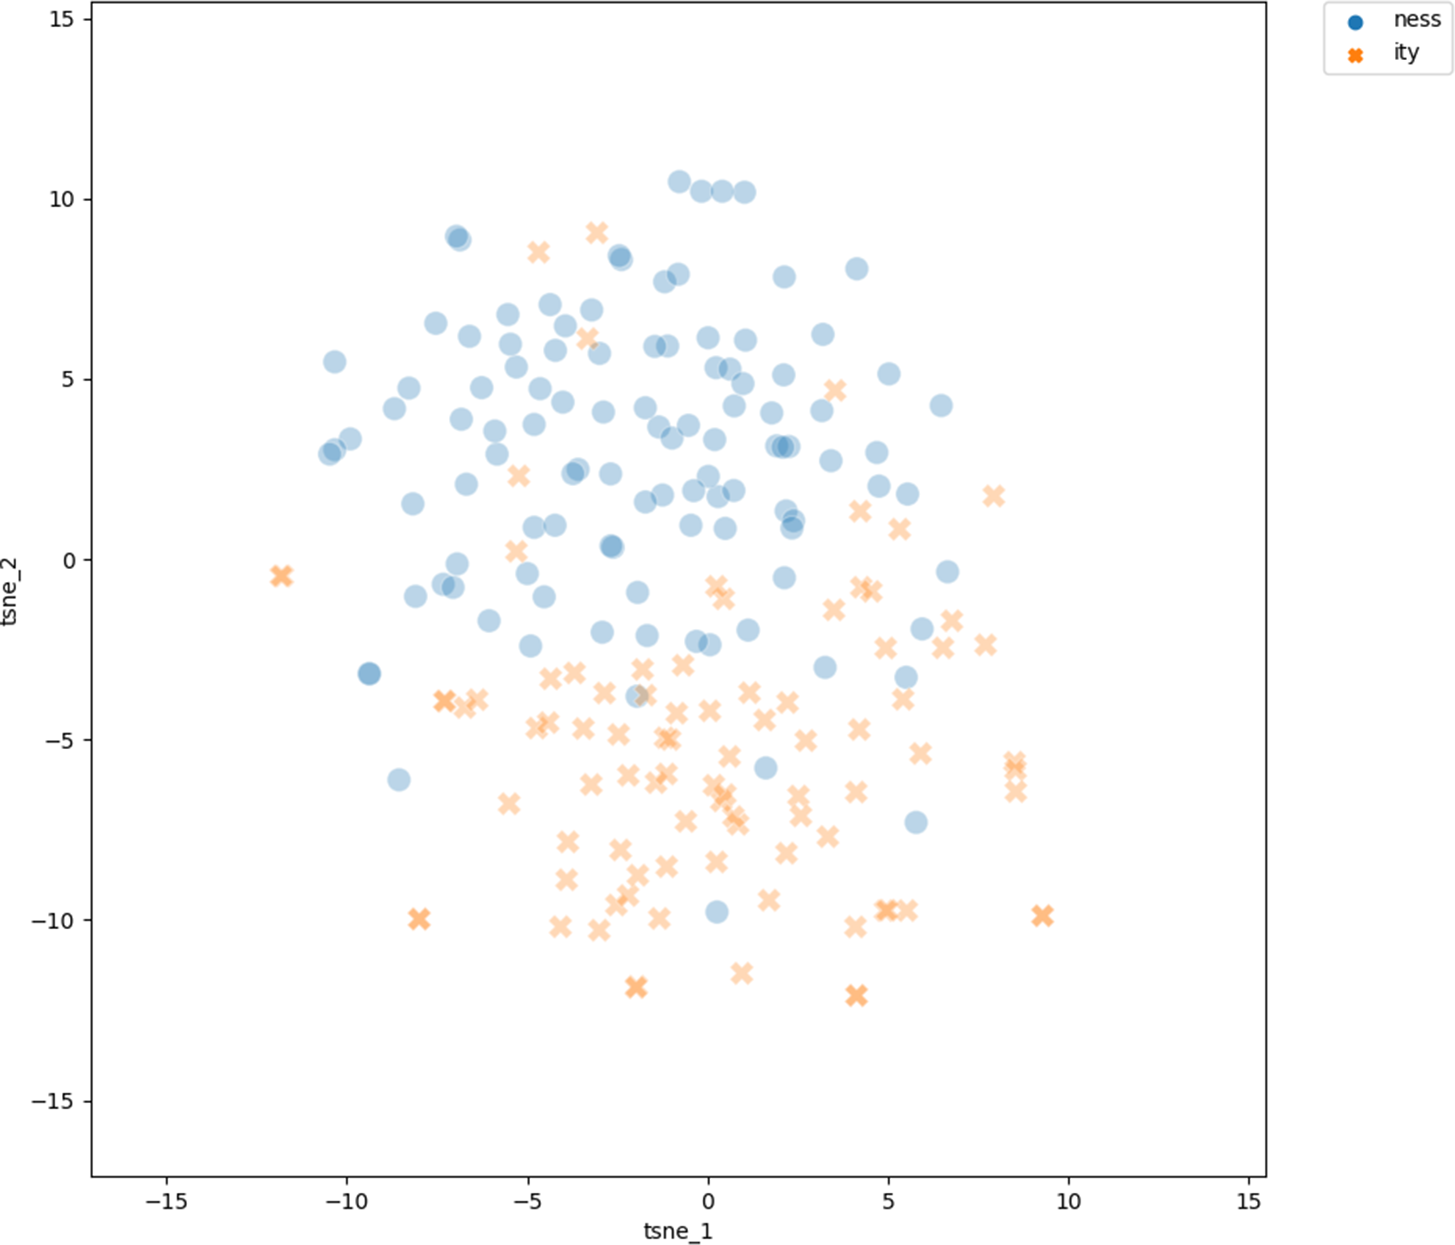

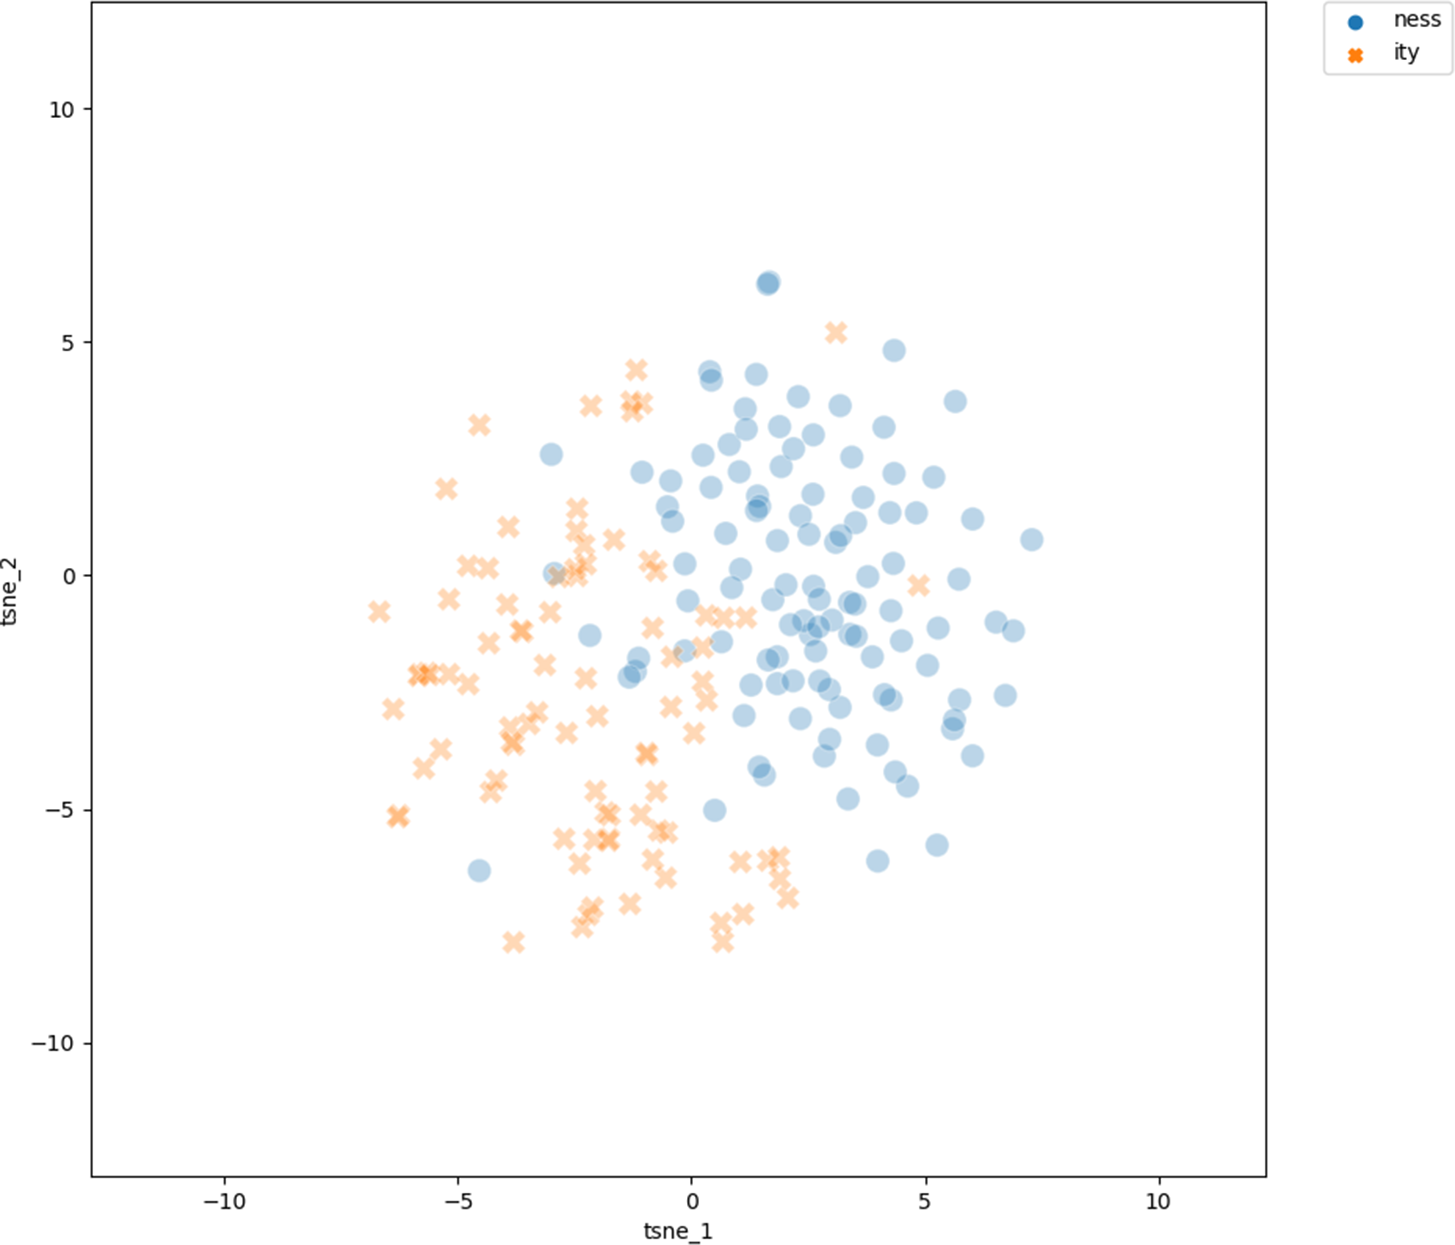
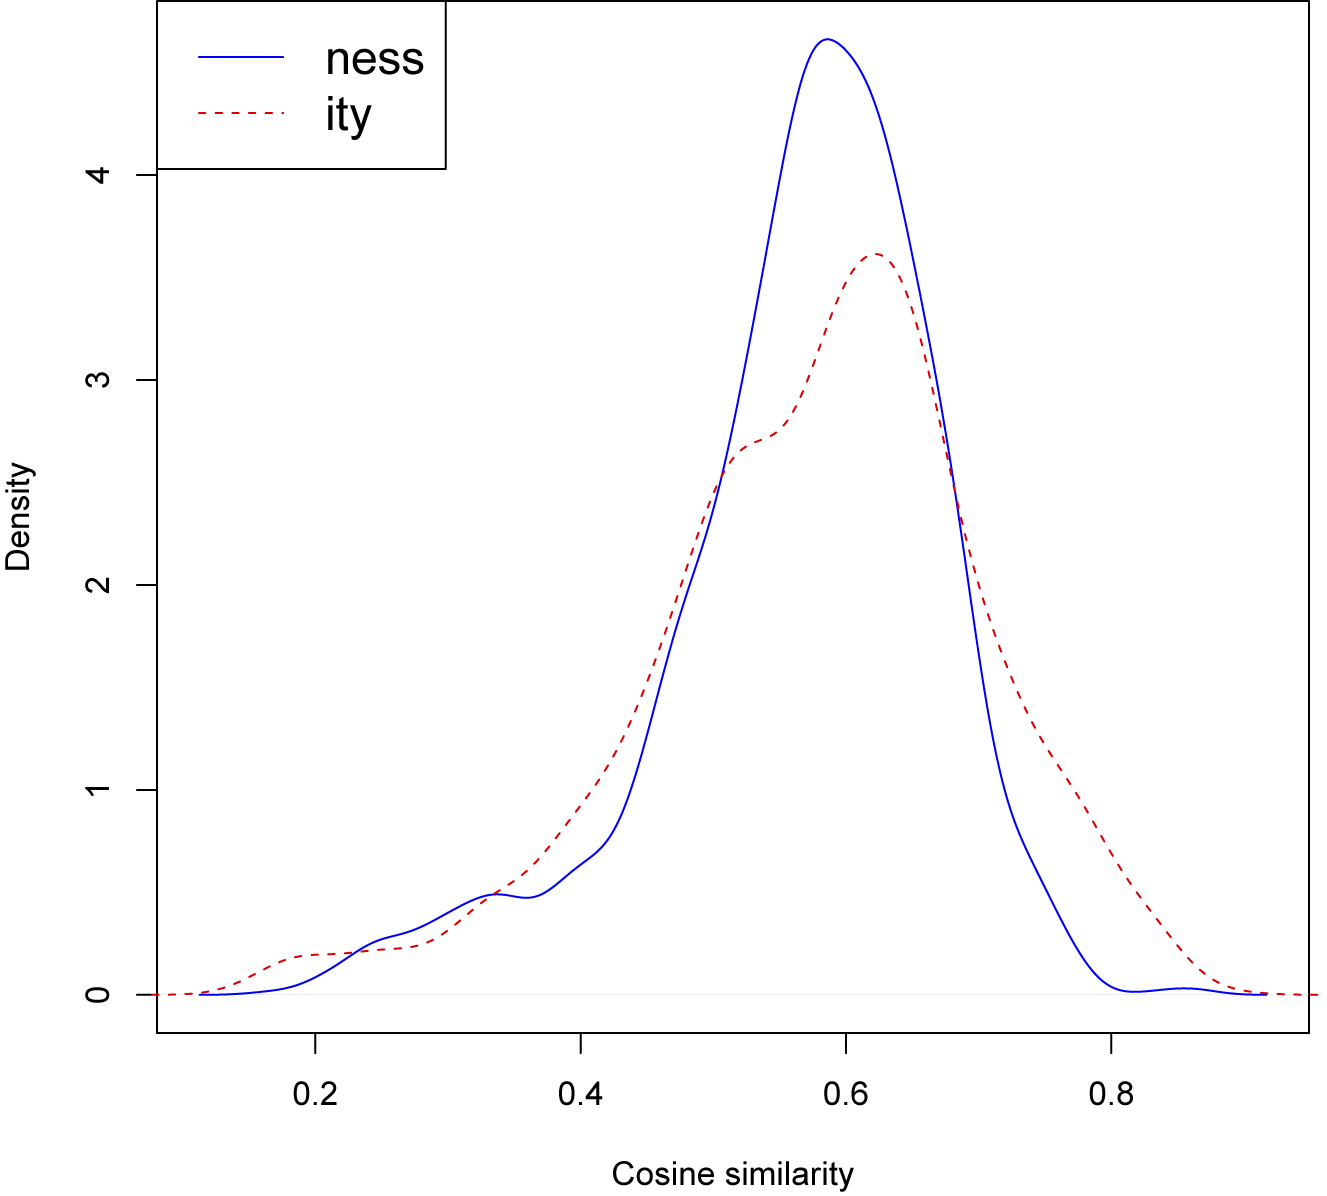
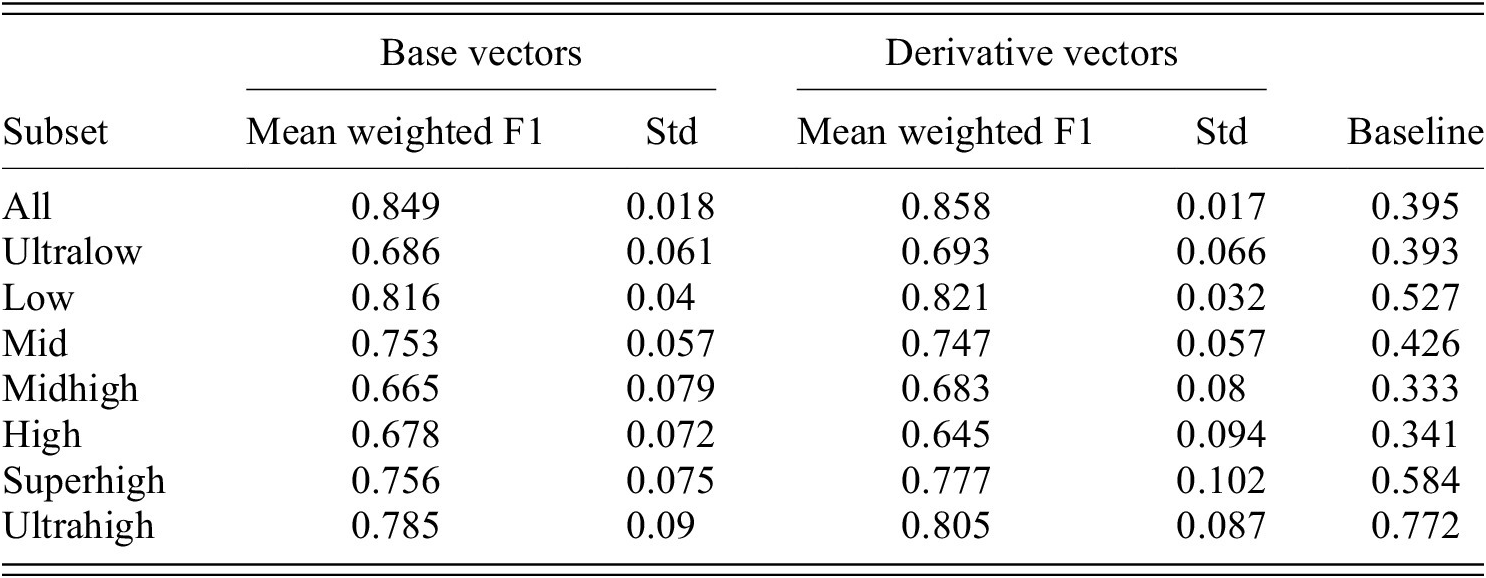
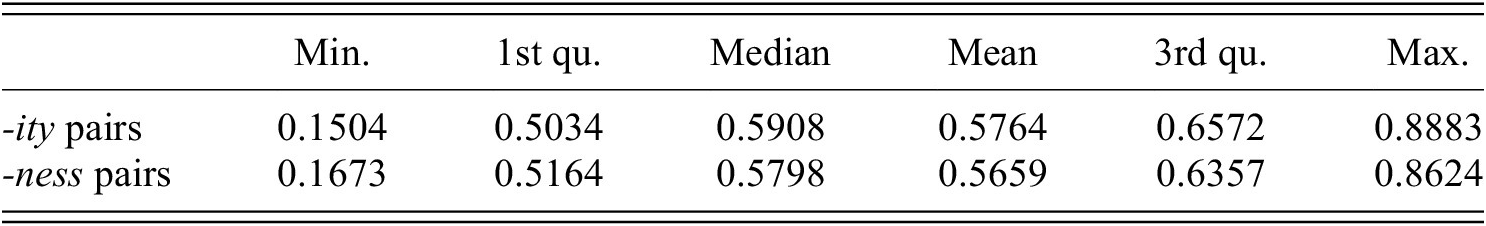
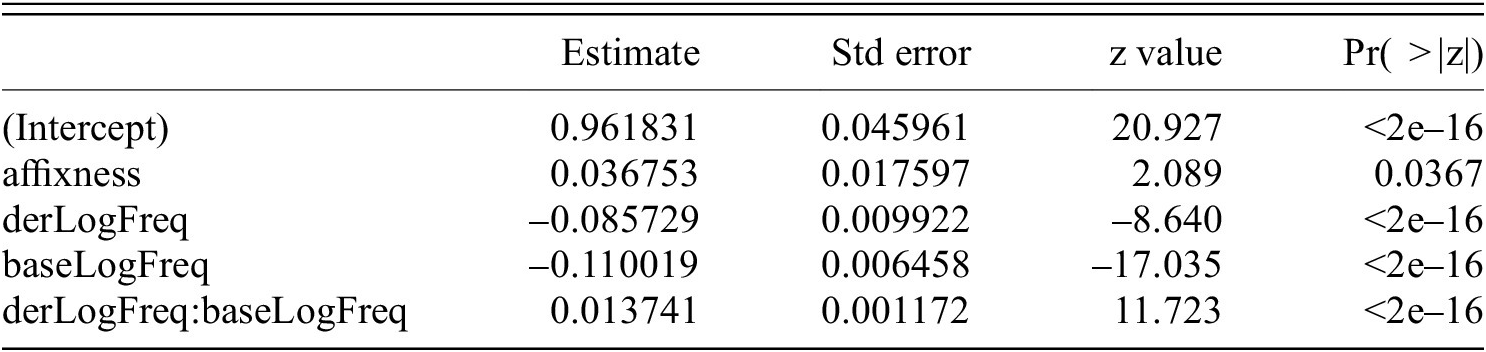
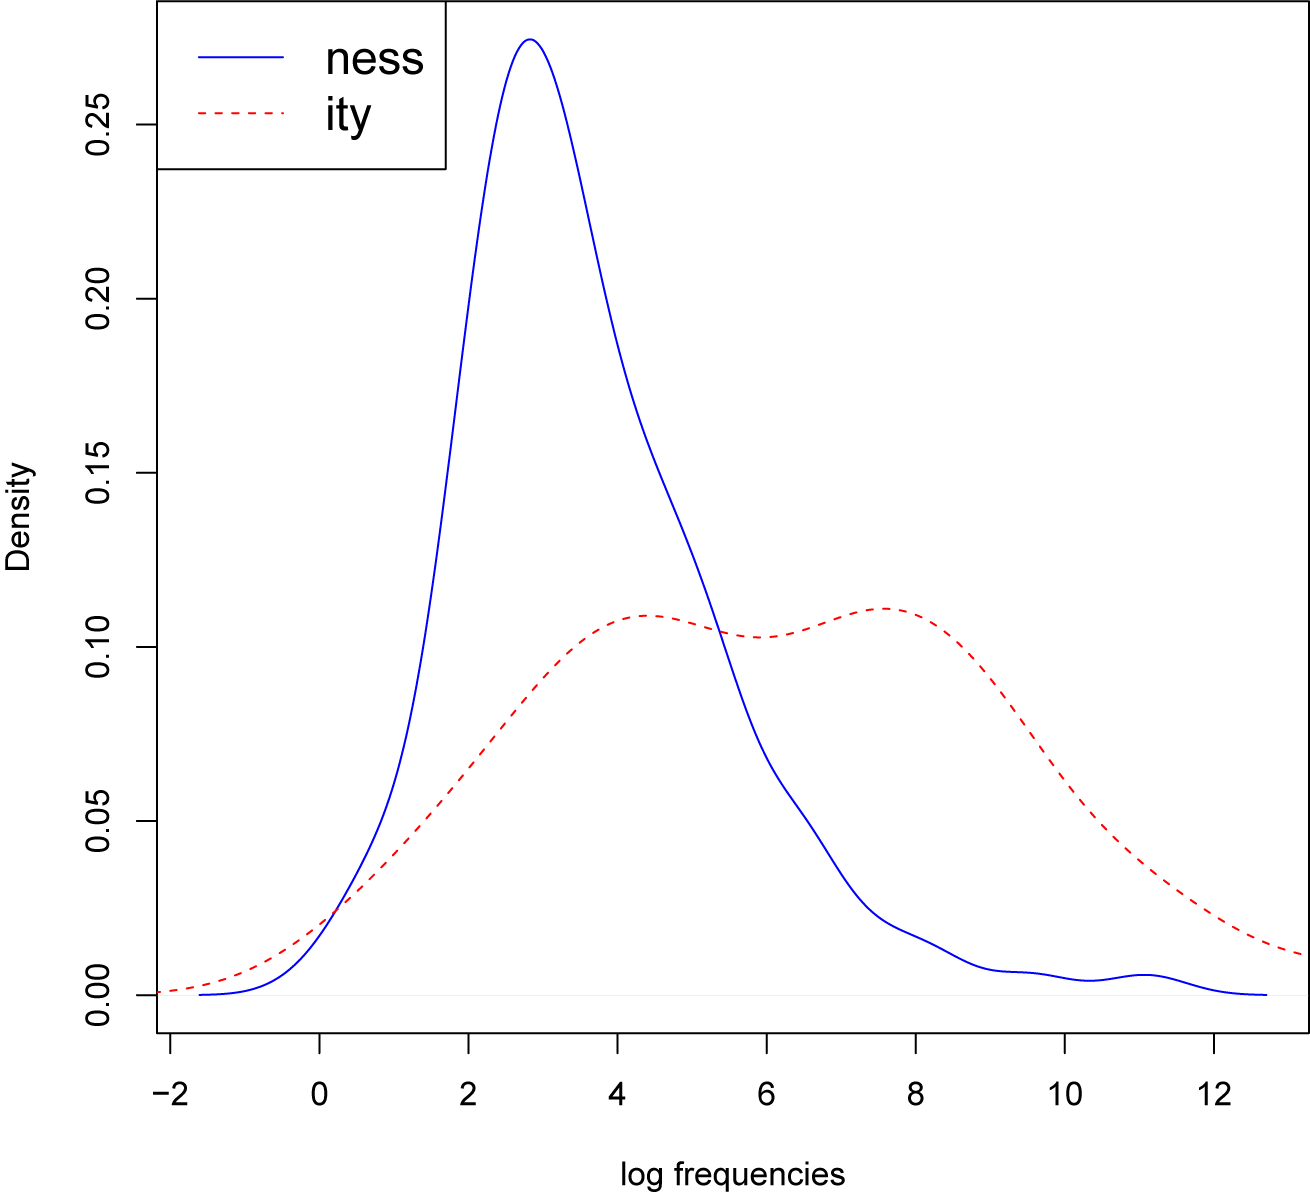
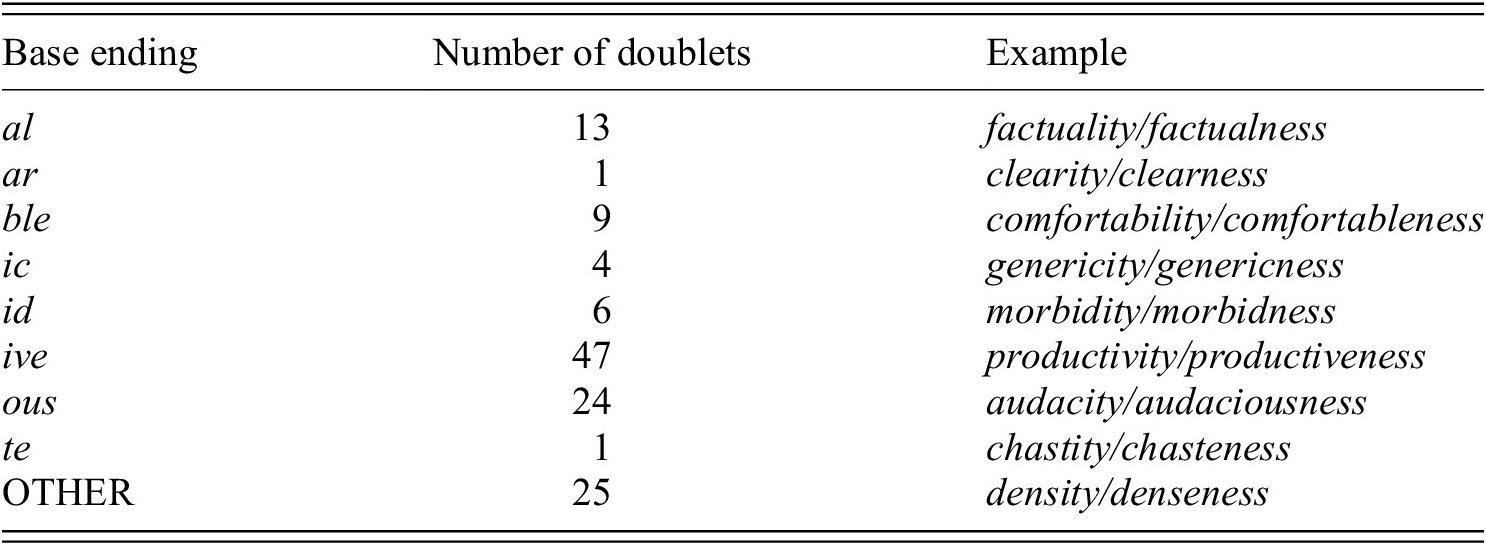

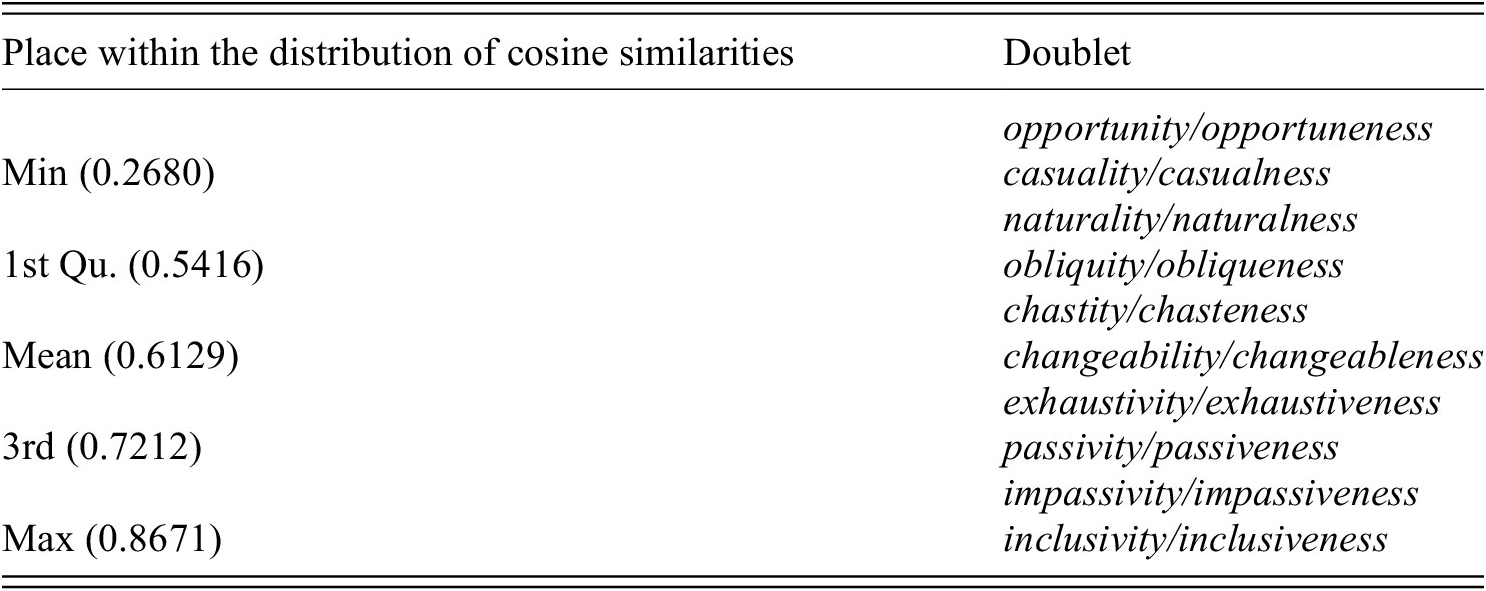
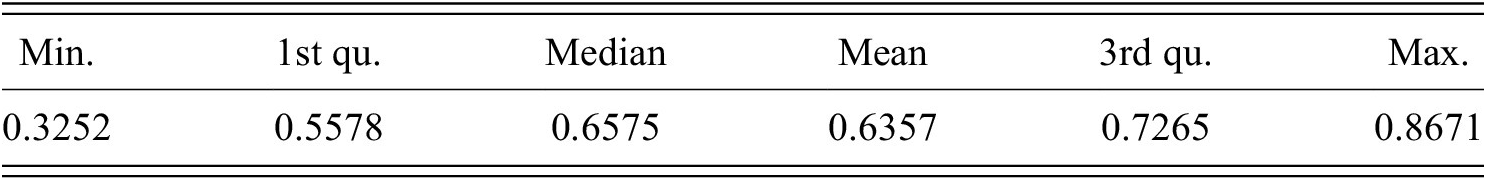
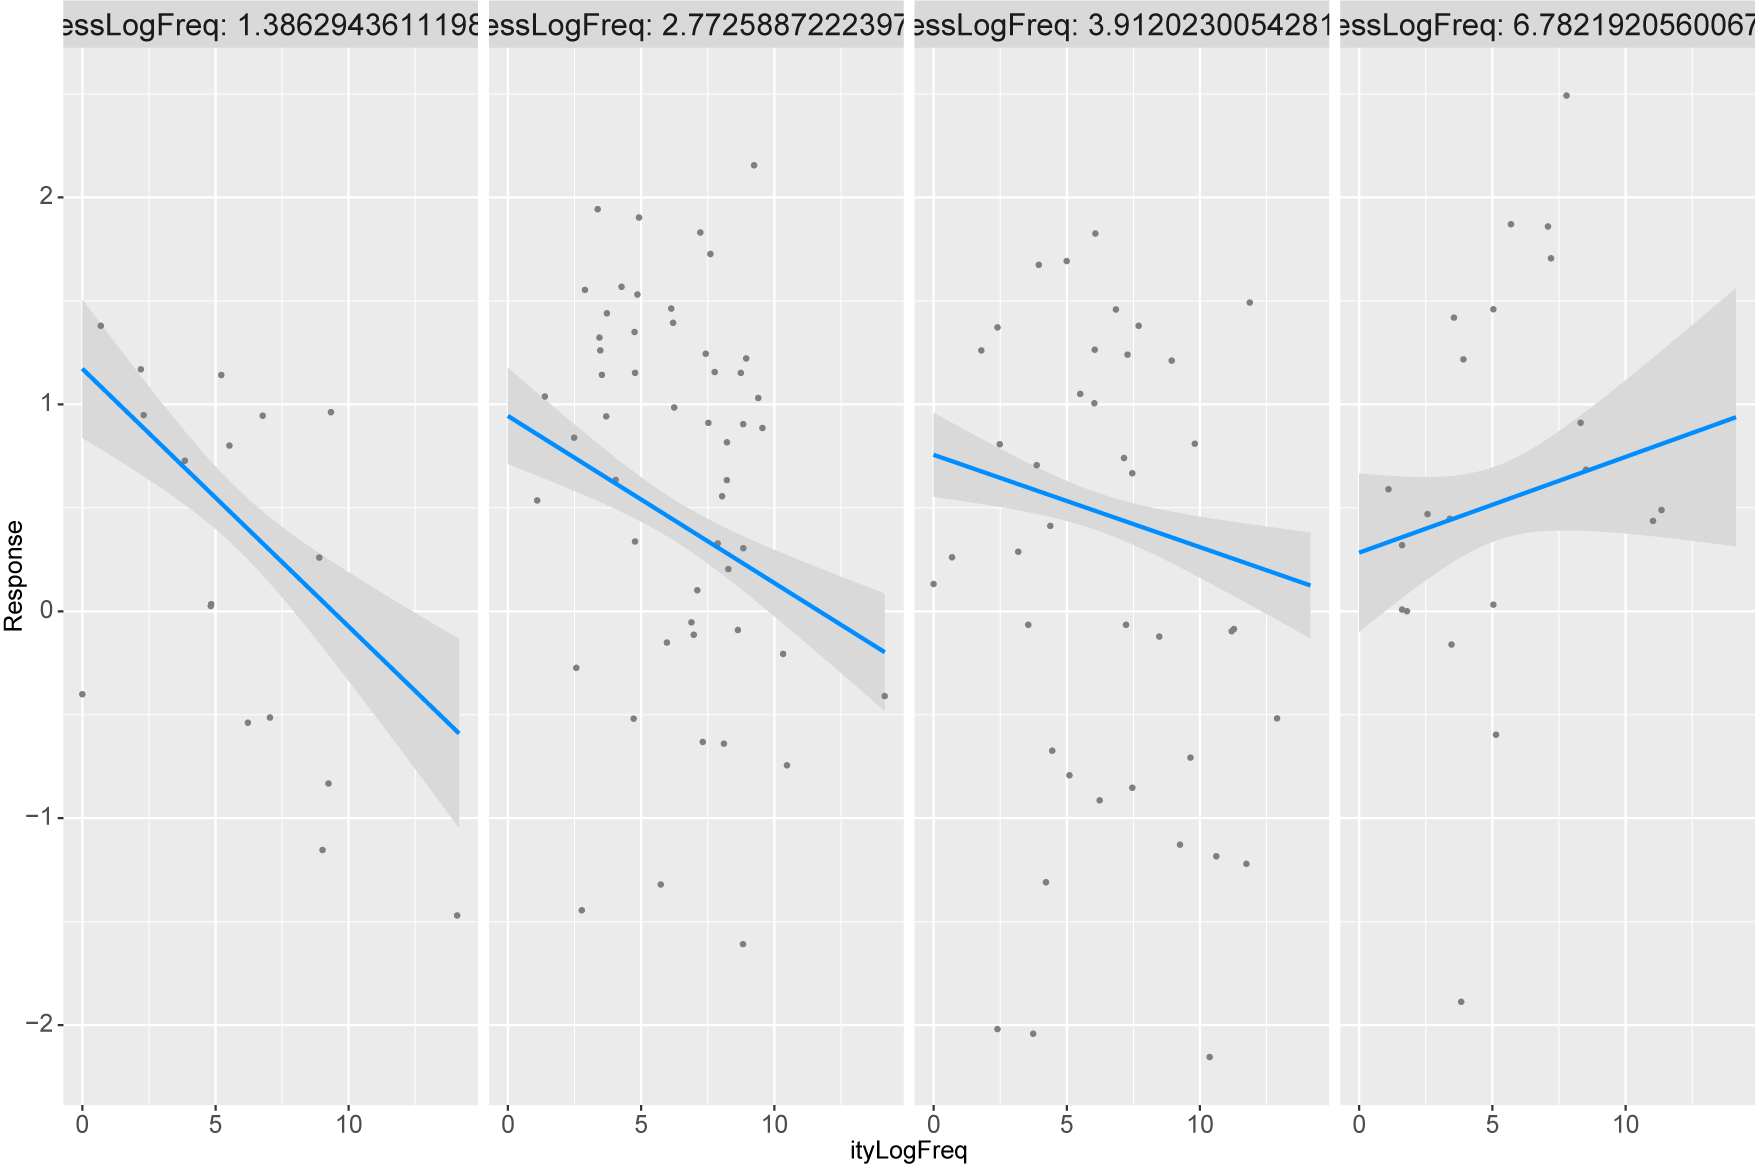
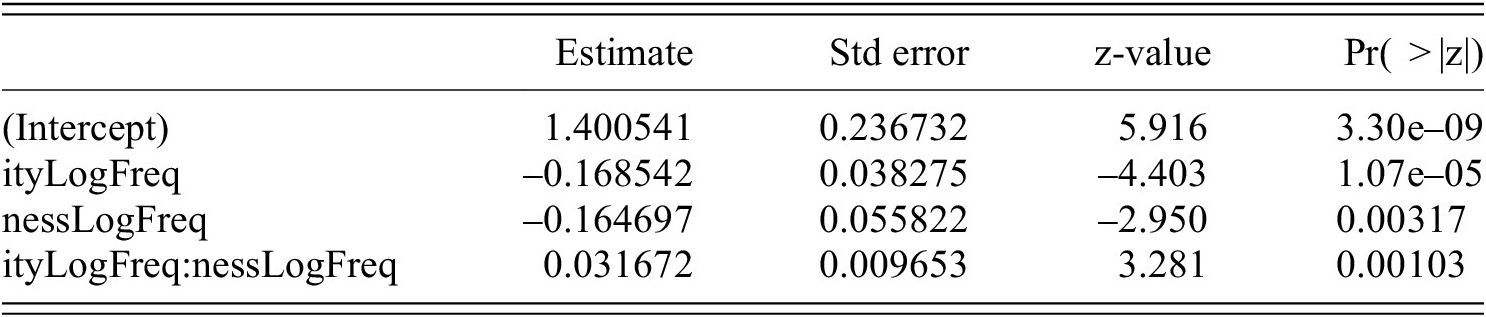
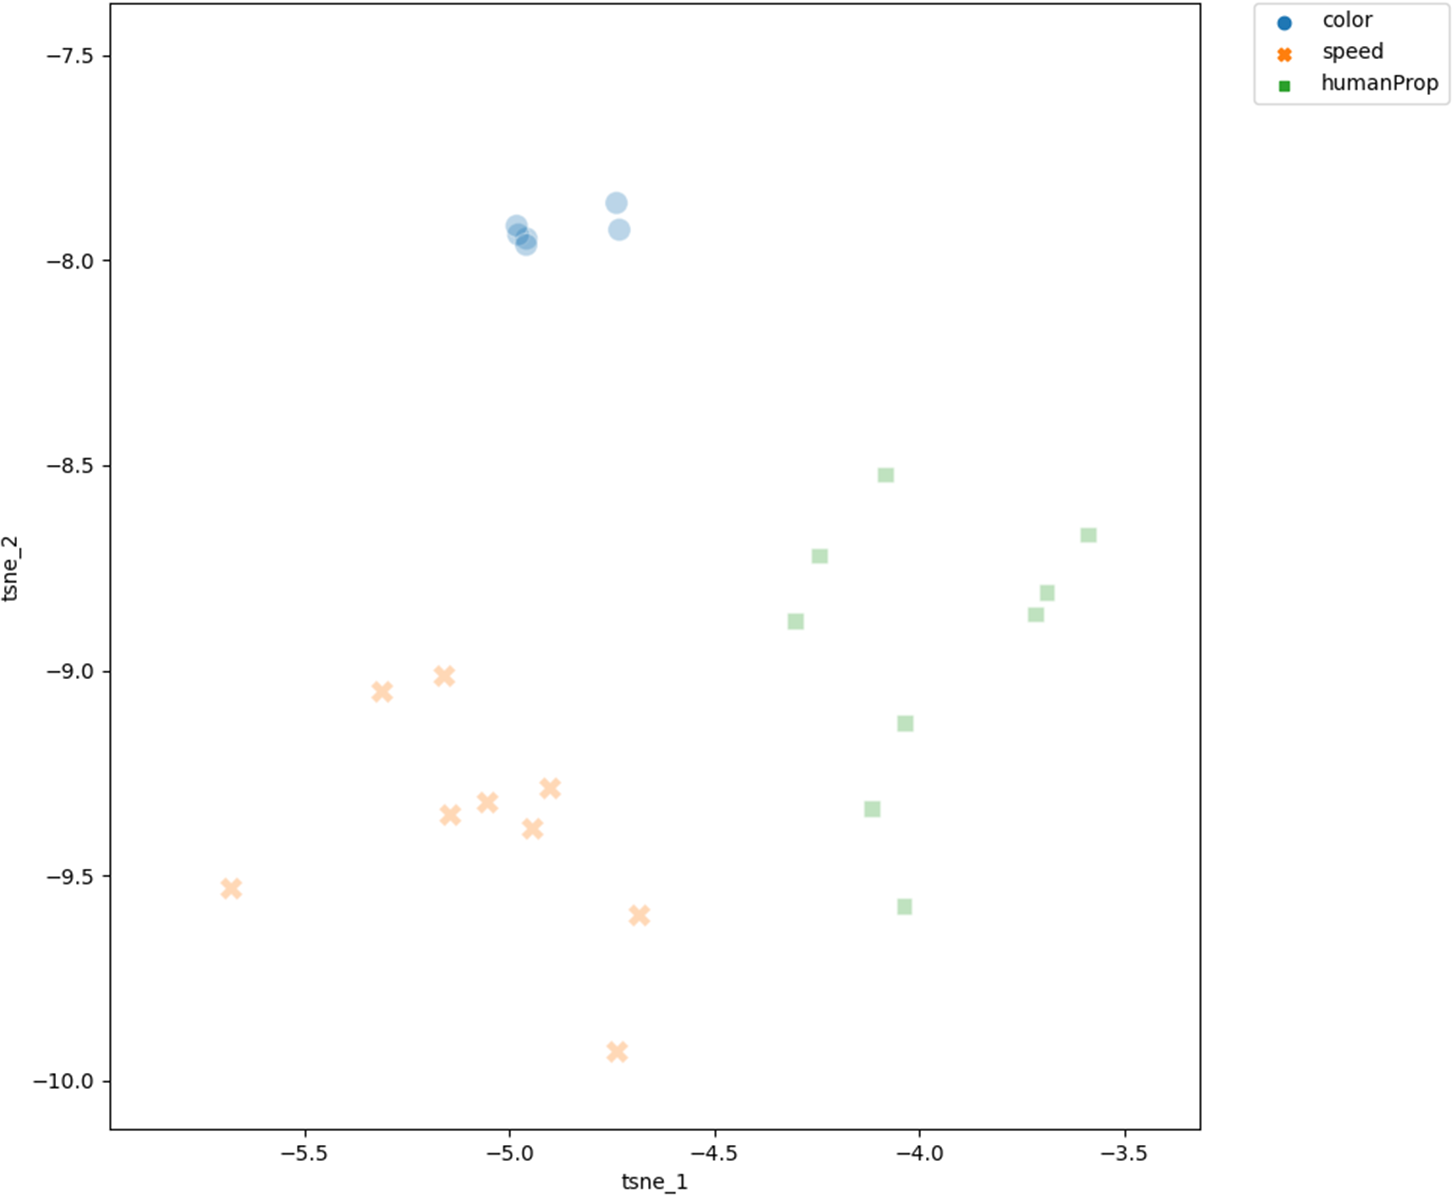


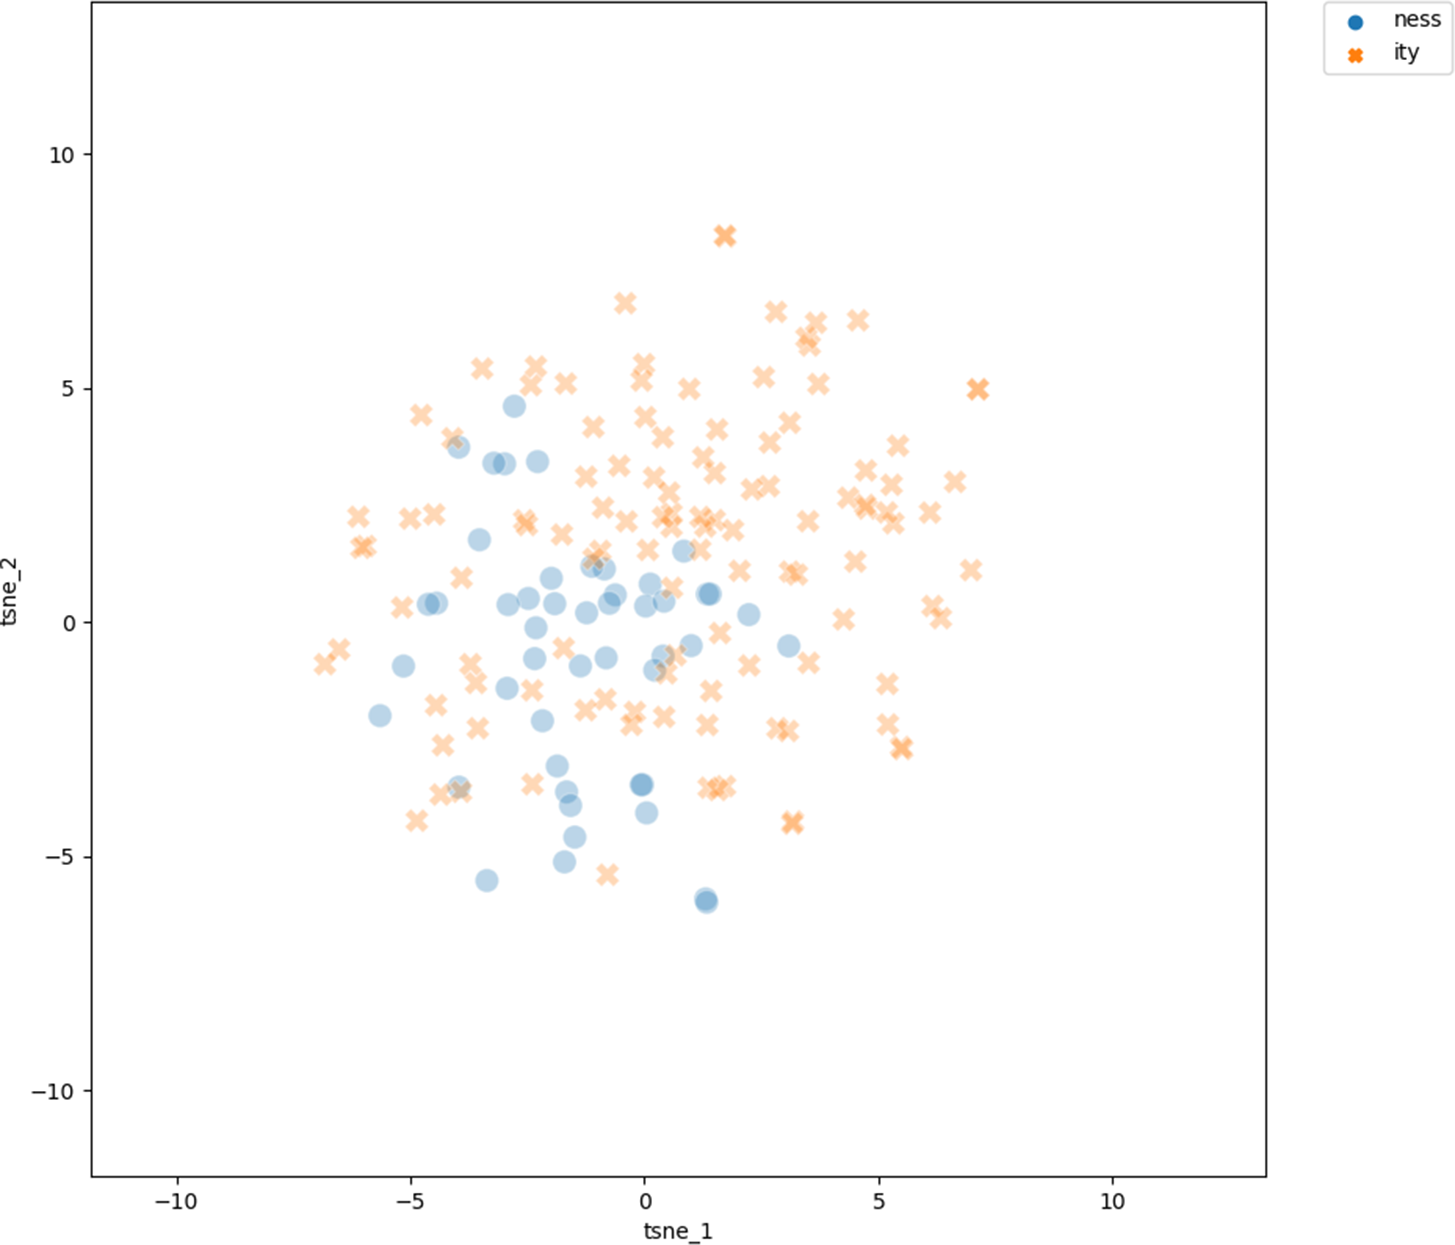
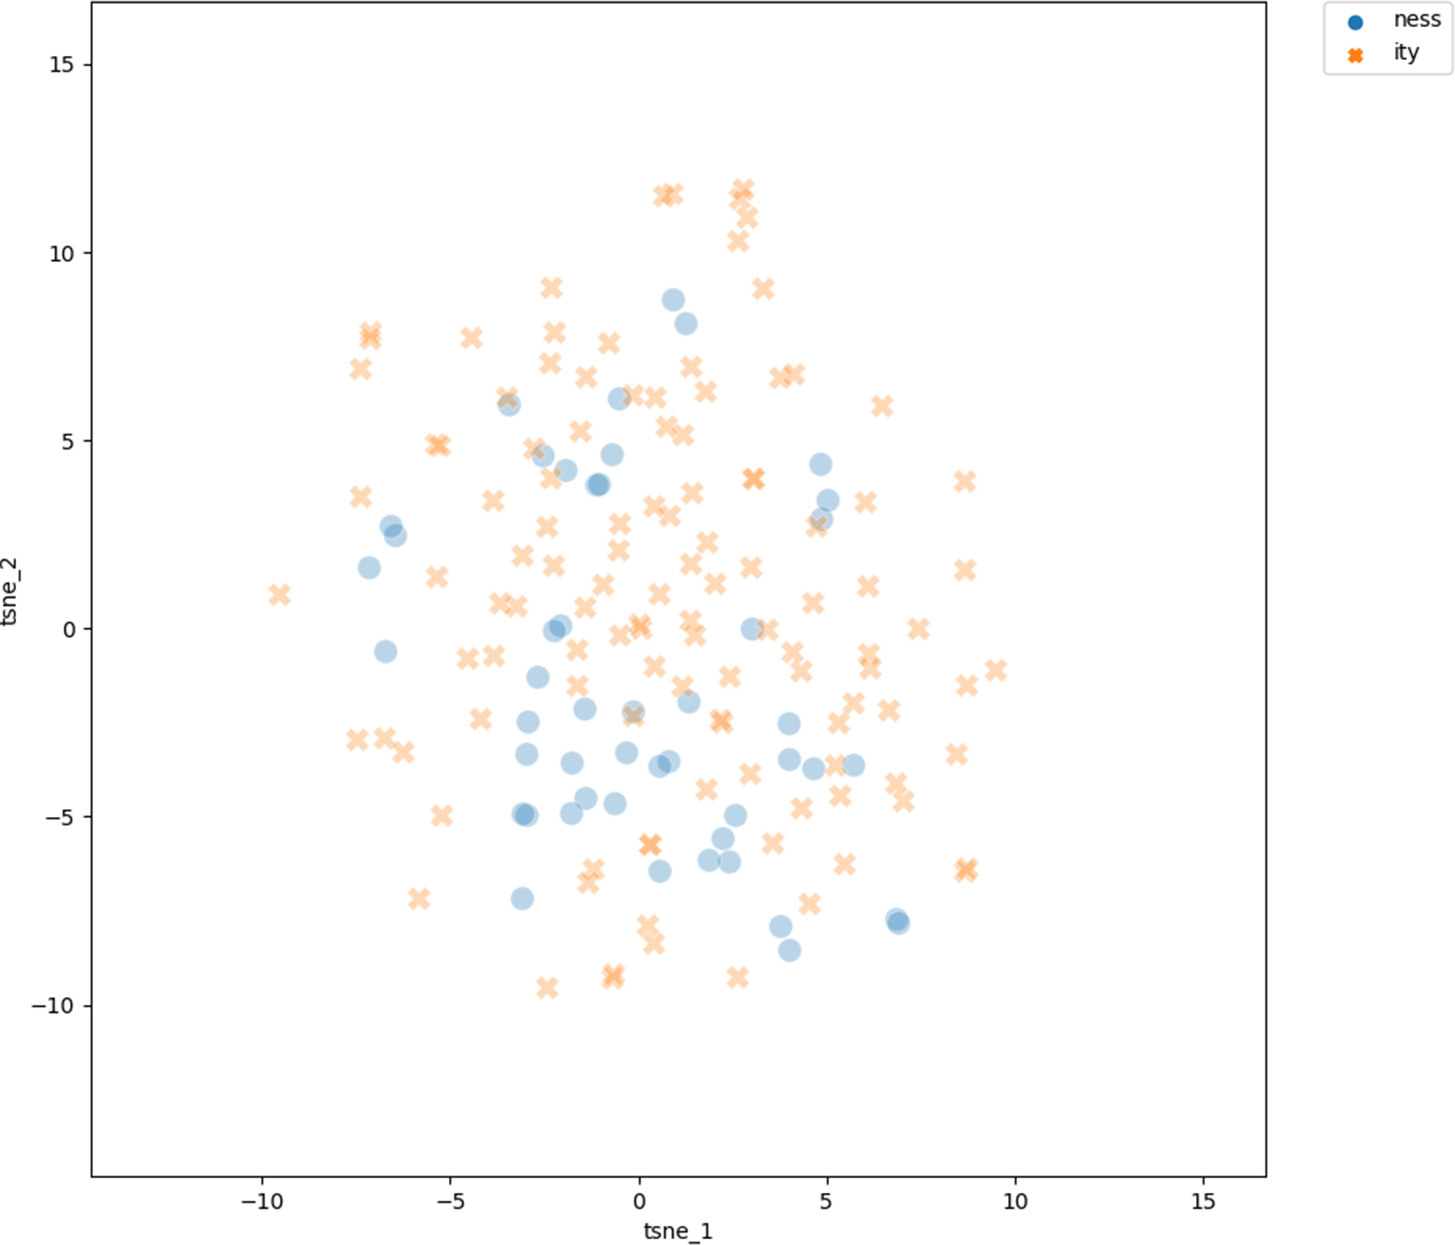
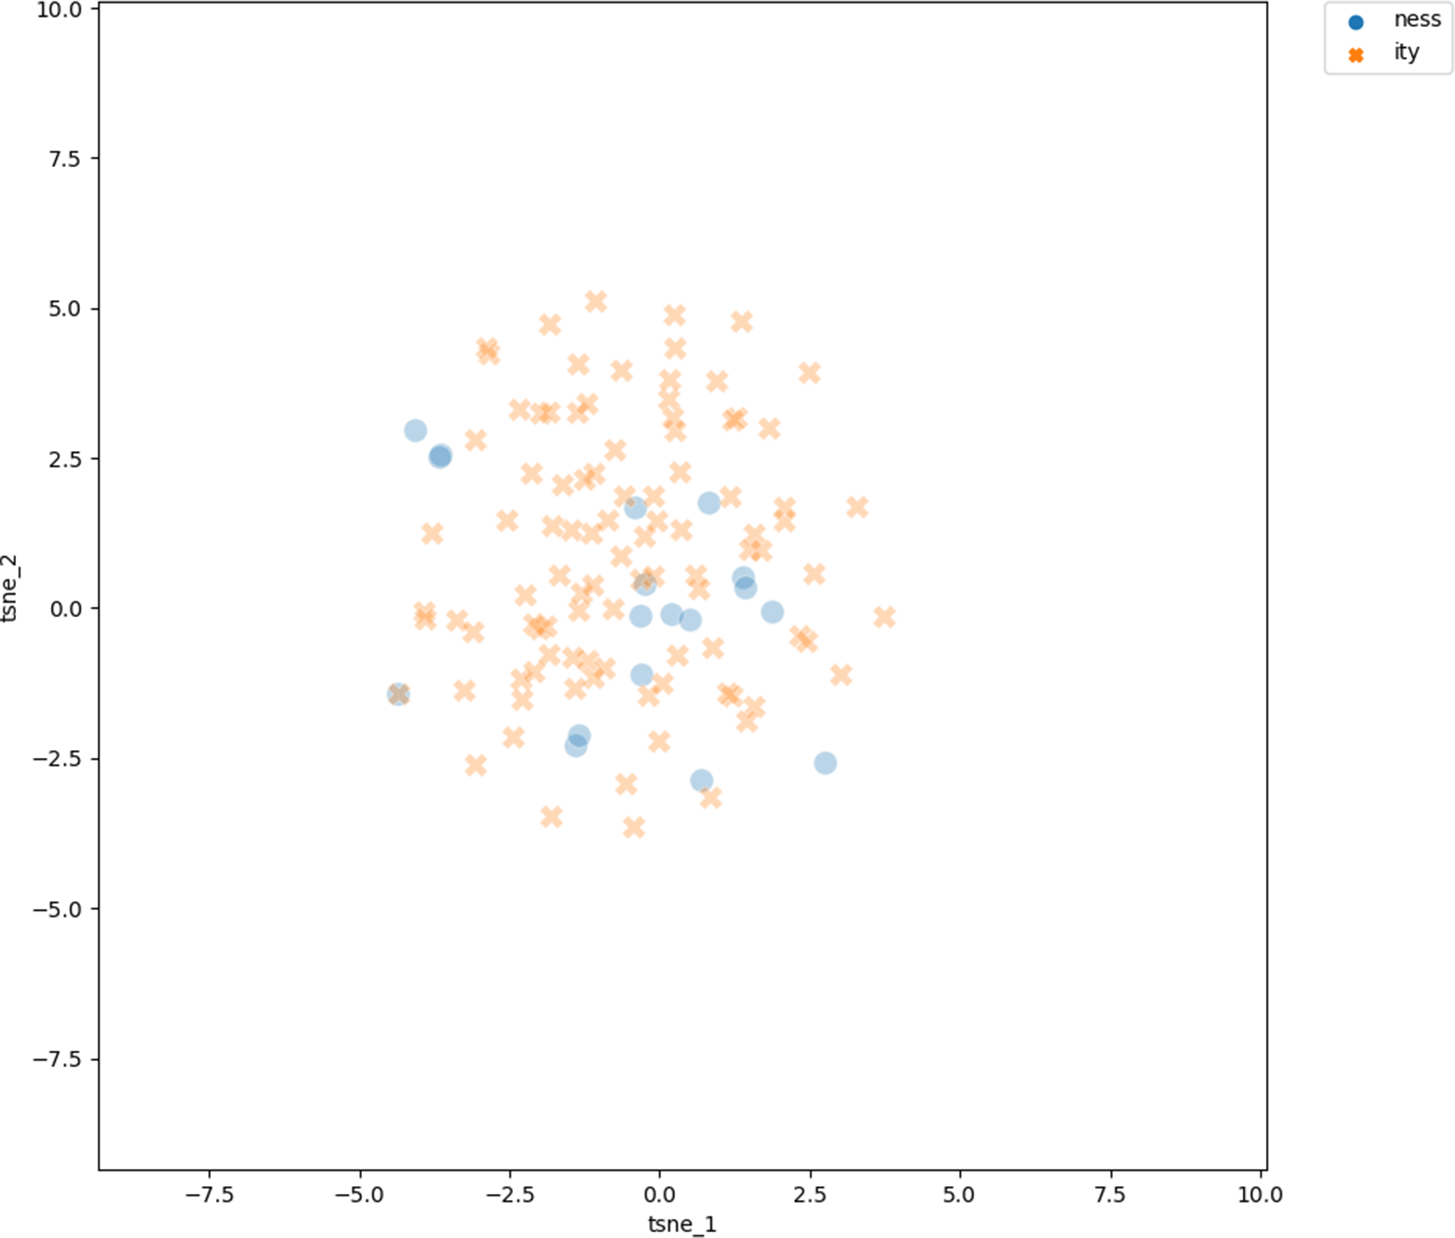
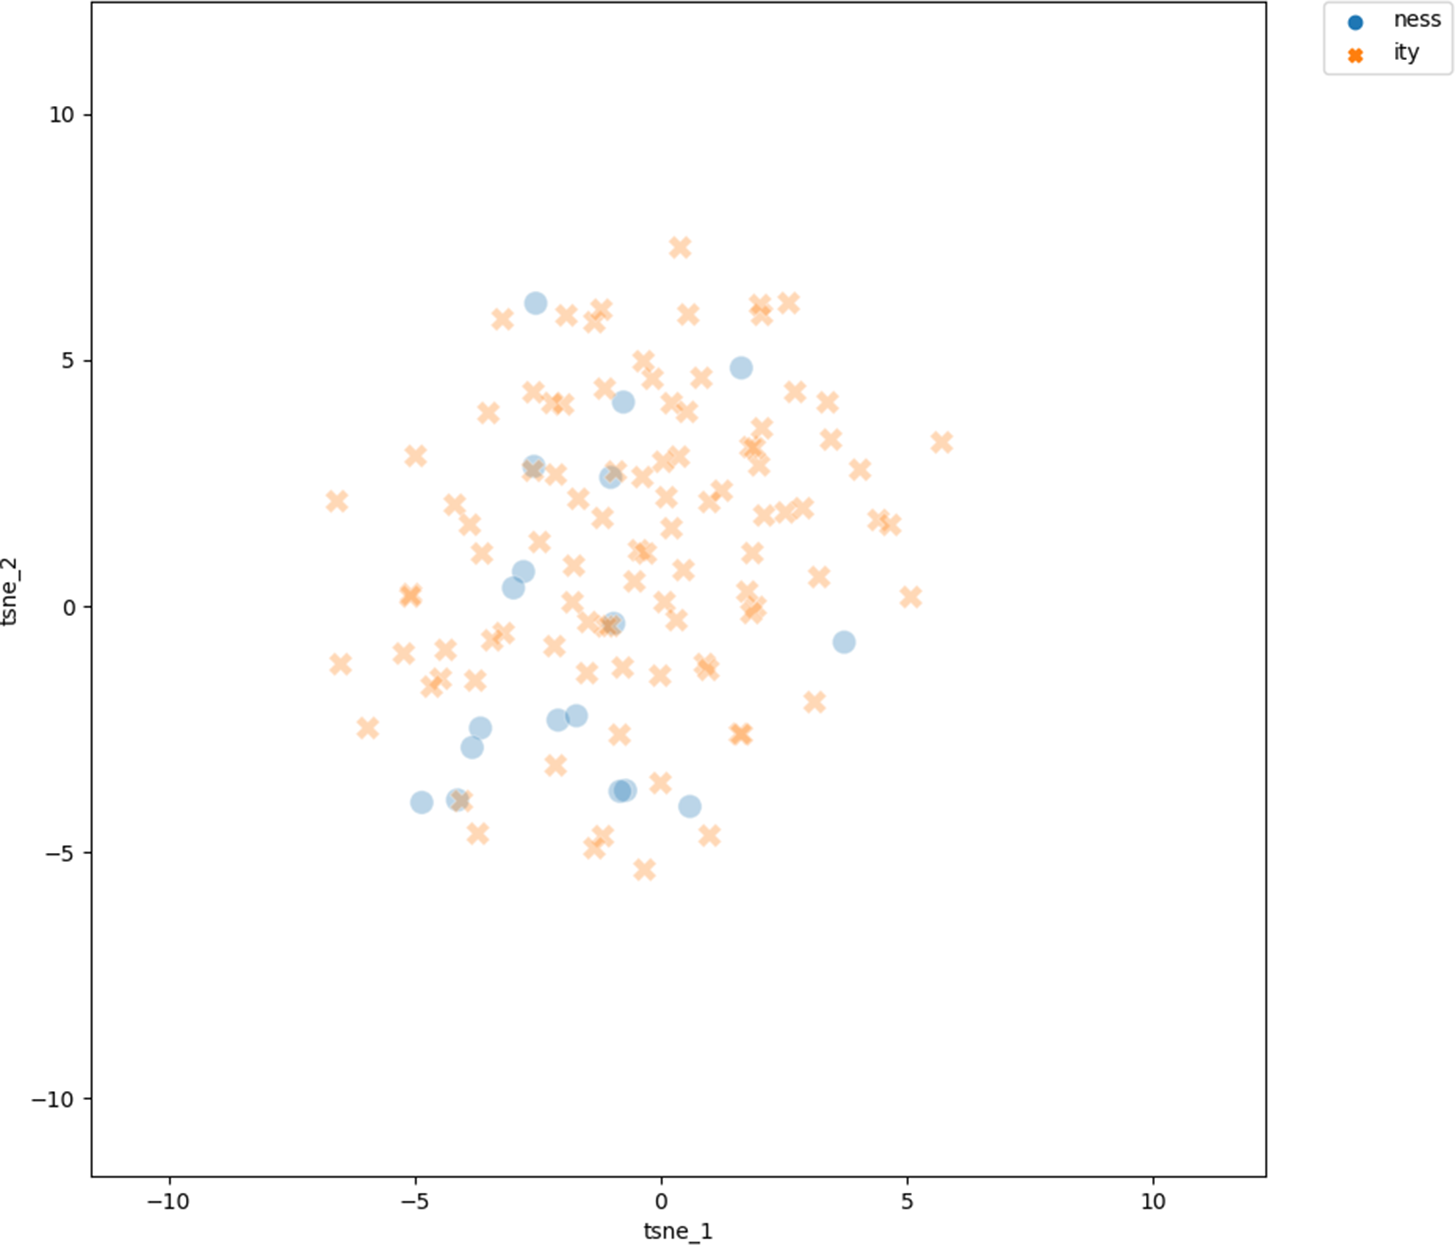

 Open access