


1. Introduction
Magnetic confinement devices with high relative plasma pressure ( $\beta = 8\pi p/$ $B^2 \simeq 1$
) are advantageous for fusion purposes. At high
$B^2 \simeq 1$
) are advantageous for fusion purposes. At high $\beta$
, the effective mirror ratio increases, which increases the energy lifetime of particles. The magnetic field is used more efficiently, and high fusion power density makes it possible to choose aneutronic fuels such as D–
$\beta$
, the effective mirror ratio increases, which increases the energy lifetime of particles. The magnetic field is used more efficiently, and high fusion power density makes it possible to choose aneutronic fuels such as D– $^3$
He and p–
$^3$
He and p– $^{11}$
B. Recent experiments at axially symmetric mirror machines (Ivanov et al. Reference Ivanov, Burdakov, Bagryansky and Beklemishev2016; Ivanov & Prikhodko Reference Ivanov and Prikhodko2017) showed that a high-beta plasma can be sustained by neutral beam injection and stabilised by limiter biasing (Beklemishev et al. Reference Beklemishev, Bagryansky, Chaschin and Soldatkina2010). This gas-dynamic plasma can be possibly brought even further to a new mode of operation, the so-called diamagnetic ‘bubble’, where the magnetic field is expelled from the mirror-confined plasma, forming a high-beta equilibrium (Beklemishev Reference Beklemishev2016). However, the equilibrium and stability of this configuration still awaits experimental studies.
$^{11}$
B. Recent experiments at axially symmetric mirror machines (Ivanov et al. Reference Ivanov, Burdakov, Bagryansky and Beklemishev2016; Ivanov & Prikhodko Reference Ivanov and Prikhodko2017) showed that a high-beta plasma can be sustained by neutral beam injection and stabilised by limiter biasing (Beklemishev et al. Reference Beklemishev, Bagryansky, Chaschin and Soldatkina2010). This gas-dynamic plasma can be possibly brought even further to a new mode of operation, the so-called diamagnetic ‘bubble’, where the magnetic field is expelled from the mirror-confined plasma, forming a high-beta equilibrium (Beklemishev Reference Beklemishev2016). However, the equilibrium and stability of this configuration still awaits experimental studies.
High-beta plasma can also be created in a field-reversed configuration, which is usually a prolate toroid with closed magnetic field lines inside the separatrix and open field line regions of poloidal (axial) axisymmetric magnetic field with zero or small self-generated toroidal (azimuthal) magnetic field (Tuszewski Reference Tuszewski1988; Steinhauer Reference Steinhauer2011). One of the flagships in the plasma creation with $\beta$
close to unity is the experiment at the C-2W device (Gota et al. Reference Gota2024), where the plasmoid is formed by merging two high-beta compact toroids with further neutral beam injection for ion heating and sustainment of the high-pressure plasma and with electrostatic biasing for stability. However, the start-up of the field-reversed configuration (FRC) remains technically challenging. It would be beneficial to create high-
$\beta$
close to unity is the experiment at the C-2W device (Gota et al. Reference Gota2024), where the plasmoid is formed by merging two high-beta compact toroids with further neutral beam injection for ion heating and sustainment of the high-pressure plasma and with electrostatic biasing for stability. However, the start-up of the field-reversed configuration (FRC) remains technically challenging. It would be beneficial to create high- $\beta$
plasma directly by injecting neutral beams into a plasma confined in a mirror configuration.
$\beta$
plasma directly by injecting neutral beams into a plasma confined in a mirror configuration.
The idea of field-reversal using neutral beam injection into a mirror-confined plasma has been studied theoretically, numerically and experimentally since the 1970s (see, for example, Byers Reference Byers1977; Pearlstein et al. Reference Pearlstein1979; Turner et al. Reference Turner1979; Tsidulko Reference Tsidulko2016; and references therein). Computer simulation of neutral injection into a mirror machine showed the existence of stable two-dimensional $(r, z)$
field-reversed mirror configurations (Byers Reference Byers1977). The code followed ion orbits in self-consistent magnetic fields; all electron currents were ignored. For small systems only a few gyroradii in extent, it was only necessary to focus the neutral beam off axis. Experiments at the 2XIIB mirror facility were directed towards obtaining the largest reversal of the vacuum magnetic field strength with the existing set of neutral-beam injectors with a total power of 7 MW and the streaming plasma-gas-feed stabilisation method. The diamagnetic change in field strength at the plasma centre
$(r, z)$
field-reversed mirror configurations (Byers Reference Byers1977). The code followed ion orbits in self-consistent magnetic fields; all electron currents were ignored. For small systems only a few gyroradii in extent, it was only necessary to focus the neutral beam off axis. Experiments at the 2XIIB mirror facility were directed towards obtaining the largest reversal of the vacuum magnetic field strength with the existing set of neutral-beam injectors with a total power of 7 MW and the streaming plasma-gas-feed stabilisation method. The diamagnetic change in field strength at the plasma centre $\varDelta B$
and the vacuum field strength
$\varDelta B$
and the vacuum field strength $B_{\textrm {vac}}$
defined the field-reversal parameter
$B_{\textrm {vac}}$
defined the field-reversal parameter $\zeta = \varDelta B/B_{\textrm {vac}}$
, which reached 0.9 (Turner et al. Reference Turner1979). However, complete magnetic field reversal was not achieved either because of the insufficient total beam current or plasma instabilities. Recent experiments on C-2W provided evidence of the generation of field-reversed configuration plasmas by neutral beam injection (Roche et al. Reference Roche2025). This was achieved by trapping the steady-state beams in an initial target mirror plasma without the use of theta-pinch formation sections. Magnetohydrodynamics (MHD) stability was provided by edge biasing electrodes. The magnetic field inside the plasma could not be measured directly; therefore, verification of field-reversal relied on model-based inferences.
$\zeta = \varDelta B/B_{\textrm {vac}}$
, which reached 0.9 (Turner et al. Reference Turner1979). However, complete magnetic field reversal was not achieved either because of the insufficient total beam current or plasma instabilities. Recent experiments on C-2W provided evidence of the generation of field-reversed configuration plasmas by neutral beam injection (Roche et al. Reference Roche2025). This was achieved by trapping the steady-state beams in an initial target mirror plasma without the use of theta-pinch formation sections. Magnetohydrodynamics (MHD) stability was provided by edge biasing electrodes. The magnetic field inside the plasma could not be measured directly; therefore, verification of field-reversal relied on model-based inferences.
The experiment at the CAT facility is designed to operate in a similar scenario. The fast-ion ring current will be created by perpendicular injection of two neutral beams into a warm plasma produced by a plasma gun (Bagryansky et al. Reference Bagryansky2016; Davydenko et al. Reference Davydenko, Deichuli, Ivanov and Murakhtin2019). The distinctive features of the device are the small volume of the confinement region, high beam current density in the plasma and essentialy non-paraxial or ‘fat’ configuration, i.e. with similar axial and radial sizes, both of order of the fast-ion gyroradius. Due to advances in neutral beam injectors developed at the Budker INP (Shikhovtsev et al. Reference Shikhovtsev2024), the beam current density in the plasma will be higher than that in the 2XIIB experiment. The ultimate goal is to expel the external magnetic field from the compact plasmoid by the field produced by this ring current to obtain high-beta plasma up to field reversal. Perpendicular injection of two neutral beams into a relatively short mirror cell with a mirror ratio equal to 2 filled with a warm streaming plasma was performed on GDT (Anikeev et al. Reference Anikeev, Bagryansky, Ivanov, Lizunov, Murakhtin, Prikhodko, Solomakhin and Noack2007). In these experiments, the line density during NBI increased two times, indicating an effective build-up of the anisotropic ion density. Thus, fast ion accumulation in CAT should be successful at least at the initial stage of injection.
Start-up of energetic neutral-beam trapping in a magnetic fusion confinement system typically requires production of a plasma target with an average chord-line density $\geqslant 10^{14}$
cm
$\geqslant 10^{14}$
cm $^{-2}$
. A washer-stack plasma gun (Dimov, Ivanov & Roslyakov Reference Dimov, Ivanov and Roslyakov1982; Osher Reference Osher1982) at the end of a mirror device appears the simplest means. Generation of the target plasma using plasma guns was used at many previous and present mirror machines: 2XIIB (Turner et al. Reference Turner1979), TMX (Coensgen et al. Reference Coensgen1980), TMX-U (Correll et al. Reference Correll1982), GAMMA 10 (Inutake et al. Reference Inutake1985), AMBAL-Yu (Dimov et al. Reference Dimov, Kabantsev, Kuz’min, Sokolov and Taskaev1993), AMBAL-M (Akhmetov et al. Reference Akhmetov1997), GDT (Ivanov et al. Reference Ivanov1994), KMAX (Yi et al. Reference Yi, Liu, Shi, Yang, Zhu, Lu and Sun2018), etc. The target plasma is made sufficiently dense to provide ionisation and charge-exchange of the injected neutral beams to provide optimal absorption of the NBI power. The ion and electron temperatures in the plasma stream are usually close to each other and equal to several electronvolts due to high electron thermal conductivity along the magnetic field. The fastest collisional process that determines the lifetime of fast ions trapped by the magnetic field is their slowing down in collisions with cold electrons with a characteristic time that scales with the electron temperature as
$^{-2}$
. A washer-stack plasma gun (Dimov, Ivanov & Roslyakov Reference Dimov, Ivanov and Roslyakov1982; Osher Reference Osher1982) at the end of a mirror device appears the simplest means. Generation of the target plasma using plasma guns was used at many previous and present mirror machines: 2XIIB (Turner et al. Reference Turner1979), TMX (Coensgen et al. Reference Coensgen1980), TMX-U (Correll et al. Reference Correll1982), GAMMA 10 (Inutake et al. Reference Inutake1985), AMBAL-Yu (Dimov et al. Reference Dimov, Kabantsev, Kuz’min, Sokolov and Taskaev1993), AMBAL-M (Akhmetov et al. Reference Akhmetov1997), GDT (Ivanov et al. Reference Ivanov1994), KMAX (Yi et al. Reference Yi, Liu, Shi, Yang, Zhu, Lu and Sun2018), etc. The target plasma is made sufficiently dense to provide ionisation and charge-exchange of the injected neutral beams to provide optimal absorption of the NBI power. The ion and electron temperatures in the plasma stream are usually close to each other and equal to several electronvolts due to high electron thermal conductivity along the magnetic field. The fastest collisional process that determines the lifetime of fast ions trapped by the magnetic field is their slowing down in collisions with cold electrons with a characteristic time that scales with the electron temperature as $T_{\textrm {e}}^{3/2}$
. Then, collisions of the slowed ions with other ions become dominant and cause their rapid pitch angle scattering (or diffusion in velocity space) until they end up in the loss cone and leave the confinement region. Thus, to avoid the prohibitive fast ion losses and to use NBI power efficiently, the electron temperature should be sufficiently high. This can be achieved by creating a so-called thermal barrier (Dimov et al. Reference Dimov, Kabantsev, Kuz’min, Sokolov and Taskaev1993) between the plasma gun and the main confinement region. The thermal barrier had been successfully formed in the AMBAL machines (Dimov et al. Reference Dimov, Ivanov and Roslyakov1982; Akhmetov et al. Reference Akhmetov1997) using a washer-stack plasma gun with a ring configuration of the discharge channel and radial separation of the electrodes. Due to the development of the Kelvin–Helmholtz instability (Kabantsev & Taskaev Reference Kabantsev and Taskaev1990) accompanied by transverse ion heating, it was possible to obtain electron temperatures higher than 50 eV.
$T_{\textrm {e}}^{3/2}$
. Then, collisions of the slowed ions with other ions become dominant and cause their rapid pitch angle scattering (or diffusion in velocity space) until they end up in the loss cone and leave the confinement region. Thus, to avoid the prohibitive fast ion losses and to use NBI power efficiently, the electron temperature should be sufficiently high. This can be achieved by creating a so-called thermal barrier (Dimov et al. Reference Dimov, Kabantsev, Kuz’min, Sokolov and Taskaev1993) between the plasma gun and the main confinement region. The thermal barrier had been successfully formed in the AMBAL machines (Dimov et al. Reference Dimov, Ivanov and Roslyakov1982; Akhmetov et al. Reference Akhmetov1997) using a washer-stack plasma gun with a ring configuration of the discharge channel and radial separation of the electrodes. Due to the development of the Kelvin–Helmholtz instability (Kabantsev & Taskaev Reference Kabantsev and Taskaev1990) accompanied by transverse ion heating, it was possible to obtain electron temperatures higher than 50 eV.
Magnetohydrodynamic stability of the axisymmetric mirrors was considered in detail by Ryutov et al. (Reference Ryutov, Berk, Cohen, Molvik and Simonen2011). Suppression of MHD instabilities accompanied by improved radial confinement can be achieved by positive dc biasing of a limiter at the boundary of the plasma. This technique was successfully applied in the HIEI tandem mirror (Sakai, Yasaka & Itatani Reference Sakai, Yasaka and Itatani1993), where a high enough limiter bias triggered plasma density rise in the bulk and steepening of the density gradient. Significant radial rotational shear was observed when the edge turbulence was suppressed by the biasing. Similar confinement improvement was obtained later on the GDT mirror device (Beklemishev et al. Reference Beklemishev, Bagryansky, Chaschin and Soldatkina2010) by limiter biasing with gas puffing at the edge of the plasma column. On the C-2, C-2U and C-2W devices with field-reversed configuration (Tuszewski et al. Reference Tuszewski2012; Gota et al. Reference Gota2017, Reference Gota2024), the inward radial electric field in the scrape-off layer of the FRC was produced by the plasma guns and/or by end-plate biasing. This field countered the usual FRC spin-up and mitigated the rotational instability, thus improving the FRC lifetime by factors of 2–4.
Neutral beam injection into a target plasma of a compact axially symmetric mirror cell was numerically simulated using a particle-in-cell code (Tsidulko & Chernoshtanov Reference Tsidulko and Chernoshtanov2016). It was shown that efficient build-up of a fast ion ring may result in field reversal at the axis of the main mirror cell of CAT for electron temperature greater than 30 eV and density greater than $10^{13}$
cm
$10^{13}$
cm $^{-3}$
. Based on these experimental results, the washer-stack plasma gun with the ring discharge channel was chosen to create the target plasma in the CAT device. This paper describes the production of the target plasma and the first experiments on neutral beam injection into this plasma.
$^{-3}$
. Based on these experimental results, the washer-stack plasma gun with the ring discharge channel was chosen to create the target plasma in the CAT device. This paper describes the production of the target plasma and the first experiments on neutral beam injection into this plasma.
2. Compact axisymmetric toroid device
The CAT device is a compact, axially symmetric mirror configuration designed to confine a hot-ion plasma obtained by neutral beam injection into a warm target plasma. The hydrogen atoms injected tangentially with an impact parameter of 10 cm into the target plasma are ionised, thus producing a hot-ion population that should significantly expel or even reverse the magnetic field.
The plasma stream generated by a plasma gun travels to the central cell, where it serves as a target for neutral beam injection. Figures 1 and 2 show the configuration of the set-up. One of the main features of this device is the relatively small length-to-diameter ratio of the hot-ion plasmoid. The volume of the trapped plasmoid is estimated to be several litres, which should allow high energy density at moderate heating power. The current experiments are performed with a single neutral beam injector.
Sketch of target plasma and neutral beam injection in the CAT device.

Layout of neutral beam injection and diagnostics at the midplane.

The confinement region for hot ions is formed by two coils installed inside the vacuum vessel at a distance of 60 cm from each other at $z = -0.30$
m and
$z = -0.30$
m and $z = +0.30$
m. This main mirror cell with the magnetic field
$z = +0.30$
m. This main mirror cell with the magnetic field $B_{\textrm {min}} = 0.2$
T (upgradable to 0.3 T) in the centre and mirror ratio at the axis
$B_{\textrm {min}} = 0.2$
T (upgradable to 0.3 T) in the centre and mirror ratio at the axis $B_{\textrm {max}}/B_{\textrm {min}} = 2.0$
is filled by the streaming plasma from the gun. The plasma from the gun follows the magnetic field lines shown in figure 1, where the plasma boundary corresponds to the gun cathode due to magnetic flux conservation
$B_{\textrm {max}}/B_{\textrm {min}} = 2.0$
is filled by the streaming plasma from the gun. The plasma from the gun follows the magnetic field lines shown in figure 1, where the plasma boundary corresponds to the gun cathode due to magnetic flux conservation $r(z) = R_{\textrm {c}}\sqrt {B_{\textrm {g}}/B(z)}$
, where
$r(z) = R_{\textrm {c}}\sqrt {B_{\textrm {g}}/B(z)}$
, where $R_{\textrm {c}} = 6.5$
cm is the outer radius of the ring cathode and
$R_{\textrm {c}} = 6.5$
cm is the outer radius of the ring cathode and $B_{\textrm {g}}$
is the magnetic field in the gun, which is typically set at 0.27 T. The plasma flows through a transport section with an almost uniform field of 0.2 T, passes through a ‘thermal barrier’ (this term is explained in § 2.1) with the field that can be elevated to 1.1 T and enters the main mirror cell, where it serves as a target for neutral beam injection. Finally, the plasma escapes from the main cell through the mirror and expands in an axially decreasing magnetic field towards a plasma absorber consisting of separate conducting end plates, which can be individually biased with respect to the ground to control the radial electric field in the plasma. In the current experiments, the end plates were floating.
$B_{\textrm {g}}$
is the magnetic field in the gun, which is typically set at 0.27 T. The plasma flows through a transport section with an almost uniform field of 0.2 T, passes through a ‘thermal barrier’ (this term is explained in § 2.1) with the field that can be elevated to 1.1 T and enters the main mirror cell, where it serves as a target for neutral beam injection. Finally, the plasma escapes from the main cell through the mirror and expands in an axially decreasing magnetic field towards a plasma absorber consisting of separate conducting end plates, which can be individually biased with respect to the ground to control the radial electric field in the plasma. In the current experiments, the end plates were floating.
The vacuum level of $10^{-4}$
Pa is provided by two turbo pumps, each with a hydrogen pumping rate of 790 l s−1. In addition, titanium arc evaporators inside the central and absorber chambers are used to cover the inner surfaces with a titanium film with high hydrogen pumping capability. A helium pump located behind the plasma absorber will also be operated in the future. This pumping system provides the residual gas pressure below
$10^{-4}$
Pa is provided by two turbo pumps, each with a hydrogen pumping rate of 790 l s−1. In addition, titanium arc evaporators inside the central and absorber chambers are used to cover the inner surfaces with a titanium film with high hydrogen pumping capability. A helium pump located behind the plasma absorber will also be operated in the future. This pumping system provides the residual gas pressure below $10^{-5}$
Pa. Typical pumping speed is
$10^{-5}$
Pa. Typical pumping speed is $100$
m
$100$
m $^3$
s−1.
$^3$
s−1.
Two beams of atomic hydrogen, each with an energy of 15 keV and a power of 2 MW will be injected into the main mirror plasma for 5 ms perpendicular to the machine axis at 6 cm from the midplane with the impact parameter of 0.1 m to produce a hot ion ring current around the midplane. The beam injection angle can be varied within a few degrees in any desirable direction. The beam energy is consistent with the vacuum magnetic field at the midplane, so that most ions have almost circular trajectories around the machine axis. The advancement in the field of high-power ion beams has enabled the attainment of a total equivalent current density at the plasma boundary of 4 A cm $^{-2}$
. For comparison, the NBI current density at the 2XIIB facility (Turner et al. Reference Turner1979) did not exceed 3.5 A cm
$^{-2}$
. For comparison, the NBI current density at the 2XIIB facility (Turner et al. Reference Turner1979) did not exceed 3.5 A cm $^{-2}$
at a total current of 500 A and an energy of 14 keV. The main plasma and NBI parameters are listed in table 1.
$^{-2}$
at a total current of 500 A and an energy of 14 keV. The main plasma and NBI parameters are listed in table 1.
Parameters of plasma and neutral beam injection in the main mirror cell.

2.1. Plasma gun
To create the target plasma, a washer-stack plasma gun with a ring-shaped discharge channel is used; this type of plasma gun has been extensively studied at the AMBAL facilities (Dimov et al. Reference Dimov, Ivanov and Roslyakov1982, Reference Dimov, Kabantsev, Kuz’min, Sokolov and Taskaev1993; Akhmetov et al. Reference Akhmetov1997) and at an axisymmetric mirror stand (Kabantsev & Taskaev Reference Kabantsev and Taskaev1990). The configuration of the generator is illustrated in figure 3. The cathode is an aluminium ring with an inner diameter of 110 mm and a width of 10 mm with an azimuthal groove increasing the cathode area. The discharge channel consists of 23 pairs of floating stainless steel rings. The gun operates with hydrogen as the working gas. Two valves provide independent gas injection into the near-cathode and near-anode regions. The opening and closing times are set for each individual valve. The hydrogen flow rate is varied by changing the pressures at the valve inlets, which are also set independently. The annular discharge volume is embedded in a uniform magnetic field of 0.1–0.5 T produced by a gun solenoid. In the earlier experiments, the molybdenum anode had an inner radius 1 mm greater than the outer radius of the cathode, and the discharge channel was a cylindrical ring. The discharge voltage observed in various operational modes of the plasma gun ranged from 100 to 400 V. At the maximum charging voltage of the forming line of 3.0 kV, the discharge current reached 20 kA.
Washer-stack axially symmetric plasma gun including molybdenum anode, two gas valves and pulsed solenoid. Stainless steel housing of the gun is not shown.

Radial separation of the gun electrodes produces the inward radial electric field leading to $E\times B$
plasma rotation, which is almost rigid in the plasma core, but is strongly sheared near the projection of the discharge channel. Previous experiments with a plasma gun of the same design showed that this sheared rotation drives the Kelvin–Helmholtz instability (Kabantsev & Taskaev Reference Kabantsev and Taskaev1990) and small-scale fluctuating electric fields, which increase primarily transverse ion energy. The ion energy in the plasma produced by this gun is close to or higher than the electron temperature. As the ions with the anisotropic velocity distribution move almost without collisions along the increasing magnetic field towards the mirror, they experience partial reflection. Hence, the ion density decreases towards the mirror, resulting in the formation of an electrostatic potential well, which effectively suppresses the energy exchange between cold 5–10 eV electrons near the plasma gun and warm 30–50 eV electrons in the confinement region. This so-called ‘thermal barrier’ allows the generation of the target plasma with an electron temperature of approximately 50 eV in the confinement mirror cell (Dimov et al. Reference Dimov, Kabantsev, Kuz’min, Sokolov and Taskaev1993; Akhmetov et al. Reference Akhmetov1997). The elevated electron temperature in the confinement region is crucial for increasing the lifetime of hot ions.
$E\times B$
plasma rotation, which is almost rigid in the plasma core, but is strongly sheared near the projection of the discharge channel. Previous experiments with a plasma gun of the same design showed that this sheared rotation drives the Kelvin–Helmholtz instability (Kabantsev & Taskaev Reference Kabantsev and Taskaev1990) and small-scale fluctuating electric fields, which increase primarily transverse ion energy. The ion energy in the plasma produced by this gun is close to or higher than the electron temperature. As the ions with the anisotropic velocity distribution move almost without collisions along the increasing magnetic field towards the mirror, they experience partial reflection. Hence, the ion density decreases towards the mirror, resulting in the formation of an electrostatic potential well, which effectively suppresses the energy exchange between cold 5–10 eV electrons near the plasma gun and warm 30–50 eV electrons in the confinement region. This so-called ‘thermal barrier’ allows the generation of the target plasma with an electron temperature of approximately 50 eV in the confinement mirror cell (Dimov et al. Reference Dimov, Kabantsev, Kuz’min, Sokolov and Taskaev1993; Akhmetov et al. Reference Akhmetov1997). The elevated electron temperature in the confinement region is crucial for increasing the lifetime of hot ions.
Despite the previous favourable outcomes of this configuration of the gun, its arc discharge with a cold duralumin cathode is characterised by electrode sputtering and gradual melting of the edges of the stainless steel washers of the discharge channel with subsequent metal deposition on insulating ceramics between these washers. One of the reasons for this behaviour was hypothesised to be the finite time required for the magnetic field of the gun solenoid to diffuse through a stainless steel housing into the discharge region. An electromagnetic simulation that accounted for the primary metal components of the gun showed that the magnetic field in the discharge channel reached steady state approximately 6 ms after the onset of the solenoid current pulse. Thus, the solenoid power supply was upgraded to extend the duration of the current pulse from the forming line and operate the discharge in a steady-state, uniform magnetic field.
The inner radius of the anode was increased to be 10 mm greater than the outer radius of the cathode. To reduce the thermal load on the outer floating washers in the annular discharge channel, their inner radii were increased to form an imaginary conical surface connecting the outer cathode edge with the anode. This technique allows increasing the lifetime of the ceramic insulators of the gun due to effective anode insulation. The experiments described in this paper used this design of the discharge channel.
2.2. Neutral beam injection
The neutral beam injection system for the CAT device was described in detail by Davydenko et al. (Reference Davydenko, Deichuli, Ivanov and Murakhtin2019). Each of two identical injectors consists of a plasma source, an ion extractor/accelerator and a neutraliser. The maximum hydrogen ion beam current, which is limited by breakdown of the accelerating gap, reaches 130 A at an energy of 15 keV (Deichuli et al. Reference Deichuli, Davydenko, Ivanov, Korepanov, Mishagin, Smirnov, Sorokin and Stupishin2015). The equilibrium yield of neutral hydrogen atoms from the neutraliser is approximately 85 %; thus, the injection power in neutrals is 1.7 MW rather than 2.0 MW. The pulse length of 5 ms does not require active cooling of the grids. The beam extractor/accelerator features multi-slit triode ion optics with spherically shaped grids that provide ballistic beam focusing. In the grids, the slits cover a circular area 34 cm in diameter. To achieve maximum power density and minimum beam size, individual beamlets are aimed at a common point 250 cm from the grids. Also inferred from the profile measurements are the beam divergence half-angles across and along the slits, 37 and 10 mrad, respectively. The current experiments with neutral beam injection have been started with one injector. The current density of a neutral beam in the focal plane has a Gaussian distribution, so the lines of constant current density are ellipses. The slits in the electrodes of the ion extractor/accelerator are oriented perpendicular to the device axis, so that the half-axis of an ellipse at a $1/\mathrm{e}$
level of the current density at the beam axis is 2.7 cm in the radial direction of the device and 8.7 cm along the device axis.
$1/\mathrm{e}$
level of the current density at the beam axis is 2.7 cm in the radial direction of the device and 8.7 cm along the device axis.
The current density distribution of the beam is measured in two directions using secondary emission detector (SED) arrays. The arrays are placed at a distance of 4.0 m from the NBI grids. Each detector is a 4 mm diameter stainless steel plate. The current density distribution in the radial direction of the device is measured by seven detectors separated from each other by a distance of 4.5 cm. The current distribution in the axial direction is measured by 13 detectors with 5 cm separation.
The beam current trapped in the plasma $I_{\textrm {t}} = I_{\textrm {b}} (1 - \exp (-\int \sigma _{\textrm {tot}}n\,\text{d}l)) \equiv \eta I_{\textrm {b}}$
, where
$I_{\textrm {t}} = I_{\textrm {b}} (1 - \exp (-\int \sigma _{\textrm {tot}}n\,\text{d}l)) \equiv \eta I_{\textrm {b}}$
, where $I_{\textrm {b}}$
is the current of neutral beam,
$I_{\textrm {b}}$
is the current of neutral beam, $n$
is the density of the target plasma,
$n$
is the density of the target plasma, $\sigma _{\textrm {tot}} = \sigma _{\textrm {cx}} + \langle \sigma _{\textrm {ie}} v_{\textrm {e}} \rangle /v_{\textrm {b}} + \sigma _{\textrm {ii}}$
is the effective sum of the charge exchange, electron impact and proton impact ionisation cross-sections, where the electron impact cross-section is averaged over the Maxwellian electron distribution function,
$\sigma _{\textrm {tot}} = \sigma _{\textrm {cx}} + \langle \sigma _{\textrm {ie}} v_{\textrm {e}} \rangle /v_{\textrm {b}} + \sigma _{\textrm {ii}}$
is the effective sum of the charge exchange, electron impact and proton impact ionisation cross-sections, where the electron impact cross-section is averaged over the Maxwellian electron distribution function, $v_{\textrm {b}}$
is the speed of the beam atoms,
$v_{\textrm {b}}$
is the speed of the beam atoms, $\eta$
is the trapping efficiency, and the integral is taken along the straight beam trajectory. For the energy of beam atoms
$\eta$
is the trapping efficiency, and the integral is taken along the straight beam trajectory. For the energy of beam atoms $\varepsilon _{\textrm {b}} = 15$
keV and the electron temperature of the target plasma
$\varepsilon _{\textrm {b}} = 15$
keV and the electron temperature of the target plasma $T_{\textrm {e}} = 30$
eV, collisional cross-section data (Janev et al. Reference Janev, Langer, Post and Evans1987; Janev & Smith Reference Janev and Smith1993) give
$T_{\textrm {e}} = 30$
eV, collisional cross-section data (Janev et al. Reference Janev, Langer, Post and Evans1987; Janev & Smith Reference Janev and Smith1993) give $\sigma _{\textrm {cx}}\approx 6{\times }10^{-16}$
cm
$\sigma _{\textrm {cx}}\approx 6{\times }10^{-16}$
cm $^2$
,
$^2$
, $\langle \sigma _{\textrm {ie}} v_{\textrm {e}} \rangle /v_{\textrm {b}} \approx 1.2{\times }10^{-16}$
cm
$\langle \sigma _{\textrm {ie}} v_{\textrm {e}} \rangle /v_{\textrm {b}} \approx 1.2{\times }10^{-16}$
cm $^2$
and
$^2$
and $\sigma _{\textrm {ii}} \approx 0.4{\times }10^{-16}$
cm
$\sigma _{\textrm {ii}} \approx 0.4{\times }10^{-16}$
cm $^2$
; hence,
$^2$
; hence, $\sigma _{\textrm {tot}} \approx 7.6{\times }10^{-16}$
cm
$\sigma _{\textrm {tot}} \approx 7.6{\times }10^{-16}$
cm $^2$
. The line density along the beam axis is determined by the plasma density at radii exceeding the impact parameter
$^2$
. The line density along the beam axis is determined by the plasma density at radii exceeding the impact parameter $a$
of injection; hence, the details of the density distribution in the plasma core,
$a$
of injection; hence, the details of the density distribution in the plasma core, $r \lt a$
, are unimportant. Taking a Gaussian profile
$r \lt a$
, are unimportant. Taking a Gaussian profile $n(r) = n_0 \exp (-r^2/r_0^2)$
with
$n(r) = n_0 \exp (-r^2/r_0^2)$
with $r_0 = a$
as an approximation of the measured density profile at
$r_0 = a$
as an approximation of the measured density profile at $r \gt a$
, one obtains
$r \gt a$
, one obtains $\int n\,\text{d}l \approx 0.65 n_0 a$
. For 7.6 MW gun discharge power with standard gas flow rate,
$\int n\,\text{d}l \approx 0.65 n_0 a$
. For 7.6 MW gun discharge power with standard gas flow rate, $n_0 \sim 2{\times }10^{13}$
cm
$n_0 \sim 2{\times }10^{13}$
cm $^{-3}$
, and the target plasma provides the trapping efficiency of
$^{-3}$
, and the target plasma provides the trapping efficiency of $\eta \simeq \sigma _{\textrm {tot}} \langle nl \rangle \simeq 0.1$
for a beam injected at
$\eta \simeq \sigma _{\textrm {tot}} \langle nl \rangle \simeq 0.1$
for a beam injected at $a = 10$
cm from the device axis. Efficient beam trapping implies
$a = 10$
cm from the device axis. Efficient beam trapping implies $\sigma _{\textrm {tot}} \langle nl \rangle \sim 0.5$
; thus, the density of the target plasma should be increased.
$\sigma _{\textrm {tot}} \langle nl \rangle \sim 0.5$
; thus, the density of the target plasma should be increased.
An intense ion ring formed by NBI in the target plasma is charge neutralised, but must not be current neutralised. It consists of ions of charge $e$
, mass
$e$
, mass $m_{\textrm {i}}$
and kinetic energy
$m_{\textrm {i}}$
and kinetic energy $\varepsilon _{\textrm {b}}$
circulating about an axis in an external magnetic field
$\varepsilon _{\textrm {b}}$
circulating about an axis in an external magnetic field $B_0$
. In the CGS system of units, the ion ring with a radius
$B_0$
. In the CGS system of units, the ion ring with a radius $R$
and current
$R$
and current $I_{\textrm {f}}$
produces a magnetic field at the axis
$I_{\textrm {f}}$
produces a magnetic field at the axis $\varDelta B = \gamma 2\pi I_{\textrm {f}}/cR$
, where
$\varDelta B = \gamma 2\pi I_{\textrm {f}}/cR$
, where $\gamma$
is a geometric factor of order unity, depending on the ring shape. If fast-ion losses during the injection time
$\gamma$
is a geometric factor of order unity, depending on the ring shape. If fast-ion losses during the injection time $\tau _{\textrm {inj}}$
can be neglected, the accumulated fast-ion electric charge is
$\tau _{\textrm {inj}}$
can be neglected, the accumulated fast-ion electric charge is $\eta I_{\textrm {b}}\tau _{\textrm {inj}}$
and it makes the full turn around the axis in time
$\eta I_{\textrm {b}}\tau _{\textrm {inj}}$
and it makes the full turn around the axis in time $2\pi /\omega _{\textrm {ci}}$
, where
$2\pi /\omega _{\textrm {ci}}$
, where $\omega _{\textrm {ci}} = e B_0/m_{\textrm {i}}c$
is the ion gyrofrequency. Thus, the ring current is
$\omega _{\textrm {ci}} = e B_0/m_{\textrm {i}}c$
is the ion gyrofrequency. Thus, the ring current is $I_{\textrm {f}} = \eta I_{\textrm {b}}\tau _{\textrm {inj}}\omega _{\textrm {ci}}/2\pi$
and the field-reversal parameter
$I_{\textrm {f}} = \eta I_{\textrm {b}}\tau _{\textrm {inj}}\omega _{\textrm {ci}}/2\pi$
and the field-reversal parameter
 \begin{equation} \zeta = \frac {\varDelta B}{B_0} = \frac {\gamma \eta e I_{\textrm {b}}\tau _{\textrm {inj}}}{m_{\textrm {i}} R c^2}, \end{equation}
so, to achieve field reversal, i. e. $\zeta = 1$
, the condition
$\zeta = 1$
, the condition $\tau _{\textrm {inj}} \gtrsim m_{\textrm {i}} Rc^2/\gamma \eta e I_{\textrm {b}}$
must be satisfied. For a hydrogen beam with
$\tau _{\textrm {inj}} \gtrsim m_{\textrm {i}} Rc^2/\gamma \eta e I_{\textrm {b}}$
must be satisfied. For a hydrogen beam with $I_{\textrm {b}} = 220$
A,
$I_{\textrm {b}} = 220$
A, $\eta = 0.5$
,
$\eta = 0.5$
, $\gamma = 1$
,
$\gamma = 1$
, $B_0 = 0.2$
T and
$B_0 = 0.2$
T and $R = a = 10$
cm, this estimate gives
$R = a = 10$
cm, this estimate gives $\tau _{\textrm {inj}} \gtrsim 0.1$
ms. In practice, the fast-ion current is determined by the balance between the beam trapping and ion loss; thus, only a part of the ionised beam atoms efficiently contributes to the ring current, so the time required to achieve a high-
$\tau _{\textrm {inj}} \gtrsim 0.1$
ms. In practice, the fast-ion current is determined by the balance between the beam trapping and ion loss; thus, only a part of the ionised beam atoms efficiently contributes to the ring current, so the time required to achieve a high- $\beta$
state will be greater.
$\beta$
state will be greater.
In the absence of instabilities, which can prevent fast-ion accumulation, the fast-ion loss rate is determined by the electron drag and by charge exchange collisions with the residual gas, $\tau _{\textrm {loss}}^{-1} = \tau _{\textrm {dr}}^{-1} + \tau _{\textrm {cx}}^{-1}$
. For
$\tau _{\textrm {loss}}^{-1} = \tau _{\textrm {dr}}^{-1} + \tau _{\textrm {cx}}^{-1}$
. For $\varepsilon _{\textrm {b}} = 15$
keV and
$\varepsilon _{\textrm {b}} = 15$
keV and $T_{\textrm {e}} \approx 30$
eV, the ratio
$T_{\textrm {e}} \approx 30$
eV, the ratio $m_{\textrm {e}} \varepsilon _{\textrm {b}}/m_{\textrm {i}} T_{\textrm {e}}\approx 0.27 \ll 1$
, where
$m_{\textrm {e}} \varepsilon _{\textrm {b}}/m_{\textrm {i}} T_{\textrm {e}}\approx 0.27 \ll 1$
, where $m_{\textrm {e}}$
is the electron mass. Thus, in later estimates, the beam ions can be considered slow relative to the plasma electrons. In this limiting case, the fast ion slowing down time is determined by the electron temperature (Trubnikov Reference Trubnikov and Leontovich1965; Huba Reference Huba2016):
$m_{\textrm {e}}$
is the electron mass. Thus, in later estimates, the beam ions can be considered slow relative to the plasma electrons. In this limiting case, the fast ion slowing down time is determined by the electron temperature (Trubnikov Reference Trubnikov and Leontovich1965; Huba Reference Huba2016): $\tau _{\textrm {dr}} \approx 5{\times }10^7 \,T_{\textrm {e}}^{3/2}/n$
, where
$\tau _{\textrm {dr}} \approx 5{\times }10^7 \,T_{\textrm {e}}^{3/2}/n$
, where $\tau _{\textrm {dr}}$
is in seconds, the electron temperature
$\tau _{\textrm {dr}}$
is in seconds, the electron temperature $T_{\textrm {e}}$
is in eV and the plasma density
$T_{\textrm {e}}$
is in eV and the plasma density $n$
is in cm
$n$
is in cm $^{-3}$
. In the target plasma with
$^{-3}$
. In the target plasma with $n \sim 2{\times }10^{13}$
cm
$n \sim 2{\times }10^{13}$
cm $^{-3}$
, the fast ions are slowed down in
$^{-3}$
, the fast ions are slowed down in $\tau _{\textrm {dr}} \simeq 0.4$
ms, which is followed by angle scattering and escape into the loss cone. An ion mean free path relative to charge exchange collisions is determined by the neutral density, which can be expressed in terms of neutral pressure
$\tau _{\textrm {dr}} \simeq 0.4$
ms, which is followed by angle scattering and escape into the loss cone. An ion mean free path relative to charge exchange collisions is determined by the neutral density, which can be expressed in terms of neutral pressure $p_{\textrm {n}}\,[\textrm {Pa}]$
assuming that neutrals are at room temperature,
$p_{\textrm {n}}\,[\textrm {Pa}]$
assuming that neutrals are at room temperature, $\lambda _{\textrm {cx}}\,[\textrm {cm}] = 1/n_{\textrm {n}}\sigma _{\textrm {cx}} \approx 6.2/p_{\textrm {n}}$
. Fast-ion build-up is effective, when slowing down is faster than charge exchange,
$\lambda _{\textrm {cx}}\,[\textrm {cm}] = 1/n_{\textrm {n}}\sigma _{\textrm {cx}} \approx 6.2/p_{\textrm {n}}$
. Fast-ion build-up is effective, when slowing down is faster than charge exchange, $\tau _{\textrm {dr}} \lesssim \tau _{\textrm {cx}} = \lambda _{\textrm {cx}}/v_{\textrm {b}}$
, which gives the upper limit for the neutral pressure,
$\tau _{\textrm {dr}} \lesssim \tau _{\textrm {cx}} = \lambda _{\textrm {cx}}/v_{\textrm {b}}$
, which gives the upper limit for the neutral pressure, $p_{\textrm {n}} \lesssim 6.2/v_{\textrm {b}}\tau _{\textrm {dr}} \simeq 10^{-4}$
Pa. This pressure is provided by the pumping system of the CAT device. However, it should be taken into account that with increasing density (in the first approximation),
$p_{\textrm {n}} \lesssim 6.2/v_{\textrm {b}}\tau _{\textrm {dr}} \simeq 10^{-4}$
Pa. This pressure is provided by the pumping system of the CAT device. However, it should be taken into account that with increasing density (in the first approximation), $\eta$
grows linearly, compensating for decreasing time
$\eta$
grows linearly, compensating for decreasing time $\tau _{\textrm {dr}}$
. It is not the value of stationary
$\tau _{\textrm {dr}}$
. It is not the value of stationary $\zeta$
that will depend on the density, but the time for which it will be reached. Thus, for a successful field reversal experiment, it is necessary to create a target plasma with relatively high electron temperature, and a low gas pressure must be maintained in the vacuum chamber.
$\zeta$
that will depend on the density, but the time for which it will be reached. Thus, for a successful field reversal experiment, it is necessary to create a target plasma with relatively high electron temperature, and a low gas pressure must be maintained in the vacuum chamber.
2.3. Diagnostics
Parameters of the target plasma produced by the gun were simultaneously measured at three axial locations using radially movable triple probes (Chen & Sekiguchi Reference Chen and Sekiguchi1965). The first probe measured the ion saturation current, the electron temperature and the probe floating potential before the main mirror cell at $z = -0.71$
m, the second one was located at the midplane of the mirror cell (
$z = -0.71$
m, the second one was located at the midplane of the mirror cell ( $z = 0$
), and the third one was located at
$z = 0$
), and the third one was located at $z = 0.76$
m in the expanding magnetic field between the exit mirror and the plasma absorber end plates. The probe positions are shown in figure 1. In previous experiments, an additional probe was placed in the transport section at
$z = 0.76$
m in the expanding magnetic field between the exit mirror and the plasma absorber end plates. The probe positions are shown in figure 1. In previous experiments, an additional probe was placed in the transport section at $z = -1.30$
m. However, it operated very unstably due to the high plasma density and large amplitude of potential fluctuations. The triple probe consists of three molybdenum wires
$z = -1.30$
m. However, it operated very unstably due to the high plasma density and large amplitude of potential fluctuations. The triple probe consists of three molybdenum wires $D = 0.4\,$
mm in diameter each housed in a quartz tube with a
$D = 0.4\,$
mm in diameter each housed in a quartz tube with a $l = 2.0$
mm protrusion of an electrode tip. Quartz has to be used because of the large heat flux from the plasma to the probe. In earlier experiments, a cylindrical alumina insulator with three axial holes was used, but the ceramic repeatedly failed due to cracking under local overheating. No such issues were encountered with the quartz insulator. The probes could be moved radially from 20 cm to the device axis.
$l = 2.0$
mm protrusion of an electrode tip. Quartz has to be used because of the large heat flux from the plasma to the probe. In earlier experiments, a cylindrical alumina insulator with three axial holes was used, but the ceramic repeatedly failed due to cracking under local overheating. No such issues were encountered with the quartz insulator. The probes could be moved radially from 20 cm to the device axis.
For the ion temperature $T_{\textrm {i}} \sim 20$
eV and
$T_{\textrm {i}} \sim 20$
eV and $B = 0.2$
T, the ratio of the ion gyroradius to the probe diameter
$B = 0.2$
T, the ratio of the ion gyroradius to the probe diameter $r_i/D \simeq 6$
, so ion current collection by the probe is unaffected by magnetic field. Unlike ions, electrons are strongly magnetised,
$r_i/D \simeq 6$
, so ion current collection by the probe is unaffected by magnetic field. Unlike ions, electrons are strongly magnetised, $r_e \ll D$
, and can be collected only from the magnetic flux tube which connects to the probe; therefore, the electron current decreases. However, plasma parameters can still be satisfactorily evaluated from probe measurements (Chen Reference Chen1965). Measurement of the electron temperature and density requires a voltage of
$r_e \ll D$
, and can be collected only from the magnetic flux tube which connects to the probe; therefore, the electron current decreases. However, plasma parameters can still be satisfactorily evaluated from probe measurements (Chen Reference Chen1965). Measurement of the electron temperature and density requires a voltage of $\gtrsim 3 T_{\mathrm{e}}/e$
between two electrodes, while maintaining one of the probe tips at the floating potential
$\gtrsim 3 T_{\mathrm{e}}/e$
between two electrodes, while maintaining one of the probe tips at the floating potential $U_{\mathrm{f}}$
. The voltage between the positively biased and the floating electrodes gives the electron temperature. The plasma density is determined from the ion saturation current
$U_{\mathrm{f}}$
. The voltage between the positively biased and the floating electrodes gives the electron temperature. The plasma density is determined from the ion saturation current $I_{\mathrm{sat}}$
between the negatively and positively biased electrodes, and the plasma potential
$I_{\mathrm{sat}}$
between the negatively and positively biased electrodes, and the plasma potential $U_{\mathrm{p}}$
is calculated with an error of
$U_{\mathrm{p}}$
is calculated with an error of $\simeq \pm 0.5 T_{\mathrm{e}}/e$
caused by the effects of magnetic field and particular geometry
$\simeq \pm 0.5 T_{\mathrm{e}}/e$
caused by the effects of magnetic field and particular geometry
 \begin{equation} T_{\textrm {e}} = \frac {e(U_+ - U_{\textrm {f}})}{\ln 2}, \quad I_{\textrm {sat}} = \alpha n e A \sqrt {\frac {T_{\textrm {e}}}{m_{\textrm {i}}}}, \quad U_{\textrm {p}} \approx U_{\textrm {f}} + 3.3 \frac {T_{\textrm {e}}}{e}\, , \end{equation}
where $U_+$
is the potential of the positively biased probe,
$U_+$
is the potential of the positively biased probe, $A\approx \pi D l$
is the ion collecting area of a thin cylindrical probe, and the dimensionless factor
$A\approx \pi D l$
is the ion collecting area of a thin cylindrical probe, and the dimensionless factor $\alpha$
of order unity depends on geometry, finite ion temperature and magnetic field effects. To determine absolute plasma parameters from probe measurements, it is usually necessary to calibrate probes with other diagnostic techniques. The parameter
$\alpha$
of order unity depends on geometry, finite ion temperature and magnetic field effects. To determine absolute plasma parameters from probe measurements, it is usually necessary to calibrate probes with other diagnostic techniques. The parameter $\alpha$
, allowing exctraction of the plasma density from the ion saturation current using (2.2), was determined from the comparison of the probe data with the line density obtained by a microwave interferometer (see § 3.1).
$\alpha$
, allowing exctraction of the plasma density from the ion saturation current using (2.2), was determined from the comparison of the probe data with the line density obtained by a microwave interferometer (see § 3.1).
Gas pressure in the chamber during the shot is measured by two fast vacuum gauges with 0.3 ms time resolution. They are used to monitor the dynamics of the spreading of neutral gas in the chamber.
The diagnostic suite will be significantly extended in the upcoming experiments on the confinement of a high-beta plasma. Diamagnetic loops will provide an average value of the stored plasma energy in the confinement zone. Perturbations of the radial magnetic field will be analysed using two azimuthal arrays, each consisting of 12 Mirnov coils. Spatially resolved magnetic field measurement based on the motional Stark effect was used earlier in the gas-dynamic trap experiment (Lizunov et al. Reference Lizunov, Den Hartog, Donin, Ivanov and Prikhodko2011). The radial profile of the magnetic field in CAT will be measured using the motional Stark effect with laser induced fluorescence diagnostic (MSE-LIF) that has several advantages over MSE using collisionally induced fluorescence (Foley & Levinton Reference Foley and Levinton2013). This diagnostic will allow measurement of fields less than 0.05 T in the midplane of the confinement volume with a spatial resolution of a few centimetres.
A parallel plate electrostatic analyser of charge-exchange neutrals with 45 $^{\circ }$
angle of entrance to the electric field will measure the fast-ion energy spectrum in the midplane of the confinement cell. Another ion diagnostic is an end-loss analyser installed in the expander behind the end plates to measure the current and the axial energy distribution of ions escaping along magnetic field lines. It is an electrostatic retarding-potential gridded analyser similar to the one developed for experiments at 2XIIB and TMX (Molvik Reference Molvik1981). Its collector, located behind several mesh electrodes, measures the ion current as a function of the swept repelling potential.
$^{\circ }$
angle of entrance to the electric field will measure the fast-ion energy spectrum in the midplane of the confinement cell. Another ion diagnostic is an end-loss analyser installed in the expander behind the end plates to measure the current and the axial energy distribution of ions escaping along magnetic field lines. It is an electrostatic retarding-potential gridded analyser similar to the one developed for experiments at 2XIIB and TMX (Molvik Reference Molvik1981). Its collector, located behind several mesh electrodes, measures the ion current as a function of the swept repelling potential.
Parameters of the NBI system are determined by several diagnostics, including an array of SEDs that measure the distribution of the beam current density (see § 2.2), and wire calorimeters that measure the beam power and profile. All these diagnostics will soon be put into operation, allowing the study of a high- $\beta$
plasma. Table 2 summarises these diagnostics and their availability status.
$\beta$
plasma. Table 2 summarises these diagnostics and their availability status.
CAT diagnostic suite.

2.4. Experiment scenario
Figure 4 illustrates current traces in a typical experiment with the target plasma production. The main magnetic field coils are turned on 15 ms before the ‘0’ setting, which allows the magnetic field inside the vacuum chamber to reach steady state by the time the discharge in the plasma gun is initiated. The current in the gun solenoid is turned on at $-5$
ms, and thus ensures a nearly constant magnetic field throughout the entire discharge.
$-5$
ms, and thus ensures a nearly constant magnetic field throughout the entire discharge.
Scenario of experiment at the CAT device. All currents are given in arbitrary units.

Two gas valves of the plasma gun are opened 3 ms before the ignition of the arc discharge to let hydrogen fill the discharge channel. At time 0 ms, the voltage is applied to the gun electrodes, the ancillary high-voltage ignition electrodes initiate gas breakdown and the main arc discharge proceeds for 5 ms, while the gas flow rate remains constant.
The time evolution of the discharge voltage measured using a frequency-compensated divider is shown in figure 5(a). The discharge voltage $U_{\textrm {d}}$
reaches its maximum at the beginning and slowly decreases towards the end of the discharge. The discharge current
$U_{\textrm {d}}$
reaches its maximum at the beginning and slowly decreases towards the end of the discharge. The discharge current $I_{\textrm {d}}$
was measured by a flexible Rogowski coil with a 100 kHz integrator. Its characteristic time trace is shown in figure 5(b). The current grows for 0.5 ms, then remains almost constant for 3 ms and finally decreases.
$I_{\textrm {d}}$
was measured by a flexible Rogowski coil with a 100 kHz integrator. Its characteristic time trace is shown in figure 5(b). The current grows for 0.5 ms, then remains almost constant for 3 ms and finally decreases.
Typical time traces of arc discharge in plasma gun: (a) voltage and (b) current.

The plasma parameters were optimised by varying the discharge power (by altering the charging voltage on the pulse forming network that creates the arc discharge), the hydrogen feed rate (by changing the pressure at the valve inlet) and the current in the external coil, which could possibly create a thermal barrier. During the plasma parameter optimisation process, the magnetic field in the central cell was set to 0.3 T as the optimal value and all presented results correspond to this configuration.
3. Experimental results
3.1. Plasma density and electron temperature
Plasma density measured by the probes was compared with the line density $\langle n l\rangle _{\textrm {MW}} = \int n\,\text{d}l$
along the plasma diameter obtained by a quadrature microwave interferometer operating at 76.2 GHz. Strong fluctuations of the plasma density typical for this gun limited the comparison to a relatively low-density range (
$\langle n l\rangle _{\textrm {MW}} = \int n\,\text{d}l$
along the plasma diameter obtained by a quadrature microwave interferometer operating at 76.2 GHz. Strong fluctuations of the plasma density typical for this gun limited the comparison to a relatively low-density range ( $n\lesssim 10^{13}\,\textrm {cm}^{-3}$
), which is shown in figure 6. It should be noted that the interferometer readings were confused during the first millisecond because the plasma density was too high, but throughout the rest of the shot, the radiation passed through the plasma and allowed the line density to be determined. The triple probe measurements were carried out in parallel with the microwave interferometer measurements. Importantly, the interferometer readings did not depend on the probe position within the plasma, indicating that the presence and movement of the probe did not perturb the global line-averaged density measurement. The correction factor
$n\lesssim 10^{13}\,\textrm {cm}^{-3}$
), which is shown in figure 6. It should be noted that the interferometer readings were confused during the first millisecond because the plasma density was too high, but throughout the rest of the shot, the radiation passed through the plasma and allowed the line density to be determined. The triple probe measurements were carried out in parallel with the microwave interferometer measurements. Importantly, the interferometer readings did not depend on the probe position within the plasma, indicating that the presence and movement of the probe did not perturb the global line-averaged density measurement. The correction factor $\alpha$
in (2.2) for plasma density calculation from the ion saturation current was found by minimisation of
$\alpha$
in (2.2) for plasma density calculation from the ion saturation current was found by minimisation of $(\int n_{\textrm {probe}}\,\text{d}l - \langle n l\rangle _{\textrm {MW}})^2$
. The best agreement of the probe data with the interferometer data is achieved with
$(\int n_{\textrm {probe}}\,\text{d}l - \langle n l\rangle _{\textrm {MW}})^2$
. The best agreement of the probe data with the interferometer data is achieved with $\alpha =0.6$
. This value is quite close to
$\alpha =0.6$
. This value is quite close to $\exp (-1/2)$
, corresponding to the model of an unmagnetised plasma with cold ions.
$\exp (-1/2)$
, corresponding to the model of an unmagnetised plasma with cold ions.
Line density measured by microwave interferometer and calculated from radial profile of plasma density measured by a triple probe with proper calibration.

Figure 7 shows the time evolution of the electron temperature (panel a) and plasma density (panel c) in the midplane for different modes of gun operation. These signals were smoothed using a passive low-pass filter with a time constant $RC = 0.1$
ms. Short spikes observed in the signals are attributed to electrical breakdowns occurring between the wires of the triple probe. In two of them, the total gas flow rate
$RC = 0.1$
ms. Short spikes observed in the signals are attributed to electrical breakdowns occurring between the wires of the triple probe. In two of them, the total gas flow rate $q_{\textrm {tot}} = 40$
Pa m
$q_{\textrm {tot}} = 40$
Pa m $^3$
s−1 through the anode and cathode valves at an average discharge power of 4.8 and 7.6 MW, and a curve is given for the total flow rate
$^3$
s−1 through the anode and cathode valves at an average discharge power of 4.8 and 7.6 MW, and a curve is given for the total flow rate $q_{\textrm {tot}} = 25$
Pa m
$q_{\textrm {tot}} = 25$
Pa m $^3$
s−1 and average discharge power
$^3$
s−1 and average discharge power $P_{\textrm {d}} = 4.8$
MW. The mode in which the probe was calibrated, with
$P_{\textrm {d}} = 4.8$
MW. The mode in which the probe was calibrated, with $q_{\textrm {tot}} = 15$
Pa m
$q_{\textrm {tot}} = 15$
Pa m $^3$
s−1 and
$^3$
s−1 and $P_{\textrm {d}} = 2$
MW, is also plotted. The power is averaged over the time interval from 0 to 5 ms. Measurements were made near the projection of the arc channel. The flow rates of the cathode and anode valves were the same.
$P_{\textrm {d}} = 2$
MW, is also plotted. The power is averaged over the time interval from 0 to 5 ms. Measurements were made near the projection of the arc channel. The flow rates of the cathode and anode valves were the same.
Time traces and radial profiles of (a, b) electron temperature and (c, d) plasma density in the midplane of the confinement mirror cell. Time traces are taken at $R=6.0$
cm. Radial profiles are obtained by averaging signals from 1.0 to 2.0 ms. Legend shows corresponding plasma gun discharge power. Gas flow rates: standard, 40 Pa m
$R=6.0$
cm. Radial profiles are obtained by averaging signals from 1.0 to 2.0 ms. Legend shows corresponding plasma gun discharge power. Gas flow rates: standard, 40 Pa m $^3$
s−1; reduced, 25 Pa m
$^3$
s−1; reduced, 25 Pa m $^3$
s−1 (
$^3$
s−1 ( $\ast$
); low-density mode for probe calibration, 15 Pa m
$\ast$
); low-density mode for probe calibration, 15 Pa m $^3$
s−1 (
$^3$
s−1 ( $\ast \ast$
). Shaded area indicates projection of gun discharge channel to the midplane.
$\ast \ast$
). Shaded area indicates projection of gun discharge channel to the midplane.

Neutral gas pressure near the wall at (a) $z = 0$
and (b)
$z = 0$
and (b) $z = -0.71$
m. Legend shows corresponding plasma gun discharge power. Gas flow rates: standard, 40 Pa m
$z = -0.71$
m. Legend shows corresponding plasma gun discharge power. Gas flow rates: standard, 40 Pa m $^3$
s−1; reduced, 25 Pa m
$^3$
s−1; reduced, 25 Pa m $^3$
s−1 (
$^3$
s−1 ( $\ast$
); low-density mode for probe calibration, 15 Pa m
$\ast$
); low-density mode for probe calibration, 15 Pa m $^3$
s−1 (
$^3$
s−1 ( $\ast \ast$
).
$\ast \ast$
).

Target plasma production by the gun can be divided into several stages. During the first millisecond of the shot, the plasma density grows rapidly compared with the electron temperature. This stage is characterised by high plasma density associated with the desorption of gas from the walls and an earlier activation of the hydrogen influx. During the second stage, which lasts approximately from 1 to 2 ms, the temperature and density remain almost constant indicating a steady-state operation of the plasma gun, when hydrogen supplied through its valves is completely consumed. However, after 2 ms, the plasma density starts rising. This is probably due to an increase in the density of the neutral gas surrounding plasma.
The time traces in figure 7 indicate that the electron temperature reaches its maximum faster when the discharge power is increased and the gas flow rate is reduced. This effect is likely observed because, at higher discharge power or lower gas flow, the pre-injected gas in the vacuum chamber and the discharge volume is ionised more efficiently. However, the mechanism leading to this enhanced ionisation remains unclear.
Figure 8 shows the neutral gas pressure near the wall at $z = 0$
m and at
$z = 0$
m and at $z = -0.71$
m. In the central mirror cell, the gas pressure throughout the entire discharge does not exceed
$z = -0.71$
m. In the central mirror cell, the gas pressure throughout the entire discharge does not exceed $10^{-2}$
Pa. At a pressure of
$10^{-2}$
Pa. At a pressure of $10^{-2}$
Pa, the gas flow through a lateral plasma surface with a radius of 20 cm and a length of 400 cm is equal to the gas flow in the plasma gun through the valves,
$10^{-2}$
Pa, the gas flow through a lateral plasma surface with a radius of 20 cm and a length of 400 cm is equal to the gas flow in the plasma gun through the valves, $q_{\textrm {tot}}$
= 40 Pa m
$q_{\textrm {tot}}$
= 40 Pa m $^3$
s−1. In the thermal barrier region, however, the pressure begins to rise almost linearly immediately after the start of the pulse, with a marked increase in the rate of rise after the gun is turned off between 4 and 5 ms. In addition, it is noteworthy that the equilibrium gas pressure measured after turning on of the gun (at 20–25 ms) corresponds to an amount of gas an order of magnitude greater than that released during the gun operation. Thus, the observed increase in plasma density during the shot can be attributed to the accumulation of desorbed wall gas in the transport and thermal barrier sections, which causes the chamber itself to act as a gas box.
$^3$
s−1. In the thermal barrier region, however, the pressure begins to rise almost linearly immediately after the start of the pulse, with a marked increase in the rate of rise after the gun is turned off between 4 and 5 ms. In addition, it is noteworthy that the equilibrium gas pressure measured after turning on of the gun (at 20–25 ms) corresponds to an amount of gas an order of magnitude greater than that released during the gun operation. Thus, the observed increase in plasma density during the shot can be attributed to the accumulation of desorbed wall gas in the transport and thermal barrier sections, which causes the chamber itself to act as a gas box.
The radial profiles of the electron temperature and plasma density are shown in figures 7(b) and 7(d), respectively. Each data point was obtained as a mean value of three shots, where the signal in each shot was in turn averaged over the time window from 1 to 2 ms. Although $T_{\textrm {e}}(r)$
and
$T_{\textrm {e}}(r)$
and $n(r)$
in the confinement region are still peaked around the projection of the annular discharge channel of the gun, they are much broader than this channel, implying substantial cross-field diffusion. The electron temperature has a maximum of 30 eV near the channel projection, which is evidence of the effective heating by the discharge. However, the electron temperature and plasma density near the axis are noticeably lower than the maximum value. The reason might be both the low heating power concentration near the arc channel projection and the small distance between the plasma gun and the central cell, which does not allow the plasma to mix sufficiently.
$n(r)$
in the confinement region are still peaked around the projection of the annular discharge channel of the gun, they are much broader than this channel, implying substantial cross-field diffusion. The electron temperature has a maximum of 30 eV near the channel projection, which is evidence of the effective heating by the discharge. However, the electron temperature and plasma density near the axis are noticeably lower than the maximum value. The reason might be both the low heating power concentration near the arc channel projection and the small distance between the plasma gun and the central cell, which does not allow the plasma to mix sufficiently.
Although an optimal regime providing relatively high density of the target plasma has been found in these experiments, the captured power does not exceed 20 % due to shine-through losses, which is still low for effective hot-ion accumulation (see § 3.2). The plasma density can be increased by enhancing the hydrogen feed rate, but this would also increase the neutral density near the wall, leading to increased charge-exchange losses of fast ions. The density of the target plasma in the main confinement cell is relatively low because the plasma streaming from the gun has to pass the thermal barrier region with a strong magnetic field. To increase the plasma density, the transport region can be extended by reducing the thermal barrier field. Taking into account that in the current experiments, the formation of the thermal barrier (i.e. substantial increase of the electron temperature in the main cell) was not detected, such a step should increase the plasma density without changing the electron temperature. Another way to increase the target plasma density is plasma fuelling by gas injection downstream from the thermal barrier. Changing the gun design also has a huge impact on the parameters of the plasma. For example, reducing the size of the gun should lead to better filling of the near-axis region. Some of these changes will be implemented in the near future.
3.2. Neutral beam trapping
If the beam neutrals are trapped mainly at the warm target plasma, the fast-ion density $n_{\textrm {f}}$
in the volume
$n_{\textrm {f}}$
in the volume $V$
is evaluated from the particle balance,
$V$
is evaluated from the particle balance,
 \begin{equation} \frac {\text{d} n_{\textrm {f}} V}{\text{d}t} = \frac {I_{\textrm {t}}}{e} - \frac {n_{\textrm {f}} V}{\tau _{\textrm {loss}}} = \frac {I_{\textrm {b}}}{e}\left (1 - \exp \left (-\int \sigma _{\textrm {tot}}n\,\text{d}l\right )\right ) - \frac {n_{\textrm {f}} V}{\tau _{\textrm {loss}}} \,. \end{equation}
This equation implies that for relatively small neutral beam trapping, $\sigma _{\textrm {tot}}nl \ll 1$
, in the steady state
$\sigma _{\textrm {tot}}nl \ll 1$
, in the steady state $n_{\textrm {f}}/n \propto I_{\textrm {b}}\tau _{\textrm {loss}}$
. Therefore, increasing the fast-ion lifetime by increasing the electron temperature and by reducing the neutral pressure in the main vacuum vessel plays a fundamental role in the successful fast ion build-up and plasma
$n_{\textrm {f}}/n \propto I_{\textrm {b}}\tau _{\textrm {loss}}$
. Therefore, increasing the fast-ion lifetime by increasing the electron temperature and by reducing the neutral pressure in the main vacuum vessel plays a fundamental role in the successful fast ion build-up and plasma $\beta$
growth in CAT. This dependence of the fast-ion density on the beam current would indicate that the central-cell plasma pressure is not limited by an instability, but is otherwise determined by the particle balance. The experimental results on fast-ion accumulation will be compared with this simple balance model and with PIC simulations (Tsidulko & Chernoshtanov Reference Tsidulko and Chernoshtanov2016).
$\beta$
growth in CAT. This dependence of the fast-ion density on the beam current would indicate that the central-cell plasma pressure is not limited by an instability, but is otherwise determined by the particle balance. The experimental results on fast-ion accumulation will be compared with this simple balance model and with PIC simulations (Tsidulko & Chernoshtanov Reference Tsidulko and Chernoshtanov2016).
Current density profiles of neutral beam at a distance of 4.0 m from the injector grids (1.5 m past the device axis) measured by the SED arrays. SED signals are averaged from 0.5 to 0.6 ms. Gaussian fits for cases with and without plasma are shown by solid and dashed lines, respectively. $x = 0$
corresponds to NBI aimed at the radius
$x = 0$
corresponds to NBI aimed at the radius $r = 10$
cm. The
$r = 10$
cm. The $z = 0$
plane is shifted axially by 6 cm from the main mirror midplane.
$z = 0$
plane is shifted axially by 6 cm from the main mirror midplane.

The target plasma must have sufficient density to provide effective beam capture and relatively high electron temperature to reduce fast ion slowing down. This optimisation was carried out by varying the discharge power and gas injection rate. High gas injection rate decreases the electron temperature, whereas low gas injection rate is not practical due to the low density of the resulting plasma. Several cases are shown in figure 7. It is evident that the plasma temperature increases with power and with reduced gas injection. At the same time, the density of the target plasma is relatively unaffected by the discharge power alone.
In addition, the initial hypothesis that a thermal barrier should develop between the central cell and the plasma gun was also tested by varying the magnetic field of the intermediate coil. However, the electron temperature, as well as the plasma density, practically does not depend on the local field in the thermal barrier. This field cannot be too small, otherwise, the plasma touches the vacuum chamber wall, breakdowns occur and the temperature drops. At high discharge currents, the threshold value of the magnetic field providing the correct operation of the system increases. The mode with a stronger field in the thermal barrier is preferred because it allows operation at a higher current. Thus, an optimum regime of target plasma production was found. This regime is characterised by the discharge power of the plasma gun $P_{\textrm {d}} = 7.6$
MW and inlet gas flow rate
$P_{\textrm {d}} = 7.6$
MW and inlet gas flow rate $q_{\textrm {tot}} = 40$
Pa m
$q_{\textrm {tot}} = 40$
Pa m $^3$
s−1. In this mode, the beam power capture coefficient was measured.
$^3$
s−1. In this mode, the beam power capture coefficient was measured.
Figure 9 shows the beam current density profiles along and across the device axis, measured by the SEDs. These profiles are described well by Gaussian functions. Therefore, with the power density distribution represented as the product of two Gaussian functions, the total power absorbed by the plasma is determined by integrating this power density over the entire beam cross-sectional area. The captured power is determined from the normalised difference in the signals with and without the target plasma $\eta = (J_{\text{w/o plasma}} - J_{\text{w/ plasma}}) / J_{\text{w/o plasma}}$
. The capture coefficient changes from 10 % to 20 % during the shot (figure 10). The rest of the beam power shines through. The growth of the captured power over time, as previously discussed in this section, indicates that the absorbed gas is being released from the walls. This additional influx of particles increases the density of the target plasma. Large amplitude oscillations of the SED signals are related to the strong density fluctuations in the rotating plasma. Alternatively, the captured power can be estimated from the density profiles measured by the triple probes. The probe measurements were performed in a separate series of experiments without NBI. For relatively low plasma densities, the NBI capture coefficient simplifies to
$\eta = (J_{\text{w/o plasma}} - J_{\text{w/ plasma}}) / J_{\text{w/o plasma}}$
. The capture coefficient changes from 10 % to 20 % during the shot (figure 10). The rest of the beam power shines through. The growth of the captured power over time, as previously discussed in this section, indicates that the absorbed gas is being released from the walls. This additional influx of particles increases the density of the target plasma. Large amplitude oscillations of the SED signals are related to the strong density fluctuations in the rotating plasma. Alternatively, the captured power can be estimated from the density profiles measured by the triple probes. The probe measurements were performed in a separate series of experiments without NBI. For relatively low plasma densities, the NBI capture coefficient simplifies to $\eta \approx \sigma _{\textrm {tot}}\int n(\sqrt {l^2 + a^2})\,\text{d}l$
, where the line integral is taken along the chord with an impact parameter of
$\eta \approx \sigma _{\textrm {tot}}\int n(\sqrt {l^2 + a^2})\,\text{d}l$
, where the line integral is taken along the chord with an impact parameter of $a = 10$
cm, where the beam axis is aimed. The agreement between the triple probe estimate and the NB trapping measurements also indicates that the calibration factor
$a = 10$
cm, where the beam axis is aimed. The agreement between the triple probe estimate and the NB trapping measurements also indicates that the calibration factor $\alpha$
for the probes has been determined correctly.
$\alpha$
for the probes has been determined correctly.
Time-dependent beam power capture: measured by secondary electron emission detectors in the beam dump (blue dashed line) and calculated from density profile measured by triple probe (orange solid line).

4. Summary
The first experimental results with target plasma and neutral beam injection in the CAT device have been obtained, establishing important milestones for future research.
The target plasma generation using a washer-stack plasma gun was successfully optimised by varying the magnetic field configuration along the device axis, hydrogen gas feed rates and discharge parameters. In the confinement region at 0.3 T magnetic field, the plasma achieved the density of $2{\times }10^{13}\,\mathrm{cm}^{-3}$
with an electron temperature up to 30 eV. The probe measurements were validated through comparison with the microwave interferometer data. The neutral beam injection experiments with a single 1.7 MW beam demonstrated a beam capture efficiency reaching 20 %.
$2{\times }10^{13}\,\mathrm{cm}^{-3}$
with an electron temperature up to 30 eV. The probe measurements were validated through comparison with the microwave interferometer data. The neutral beam injection experiments with a single 1.7 MW beam demonstrated a beam capture efficiency reaching 20 %.
Future research directions include optimisation of the magnetic configuration to increase the density of the target plasma, increasing the NBI power to the full design value of 4 MW (two 2 MW beams), and implementation of new diagnostics (MSE-LIF, neutral particle analysers and magnetic probes) to study fast-ion accumulation and potential field reversal effects.
Acknowledgements
The authors wish to thank P. A. Bagryansky, V. I. Davydenko and I. S. Chernoshtanov for valuable discussions.
Editor Cary Forest thanks the referees for their advice in evaluating this article.
Funding
This work was supported by the Ministry of Science and Higher Education of the Russian Federation (Grant FWGM-2025-0061).
Declaration of interests
The authors report no conflict of interest.


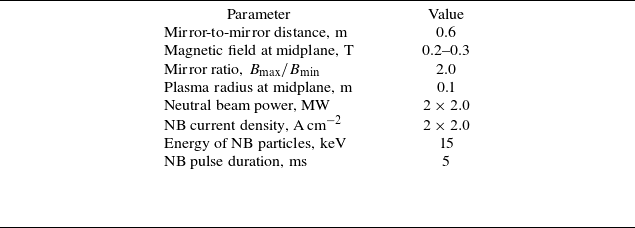
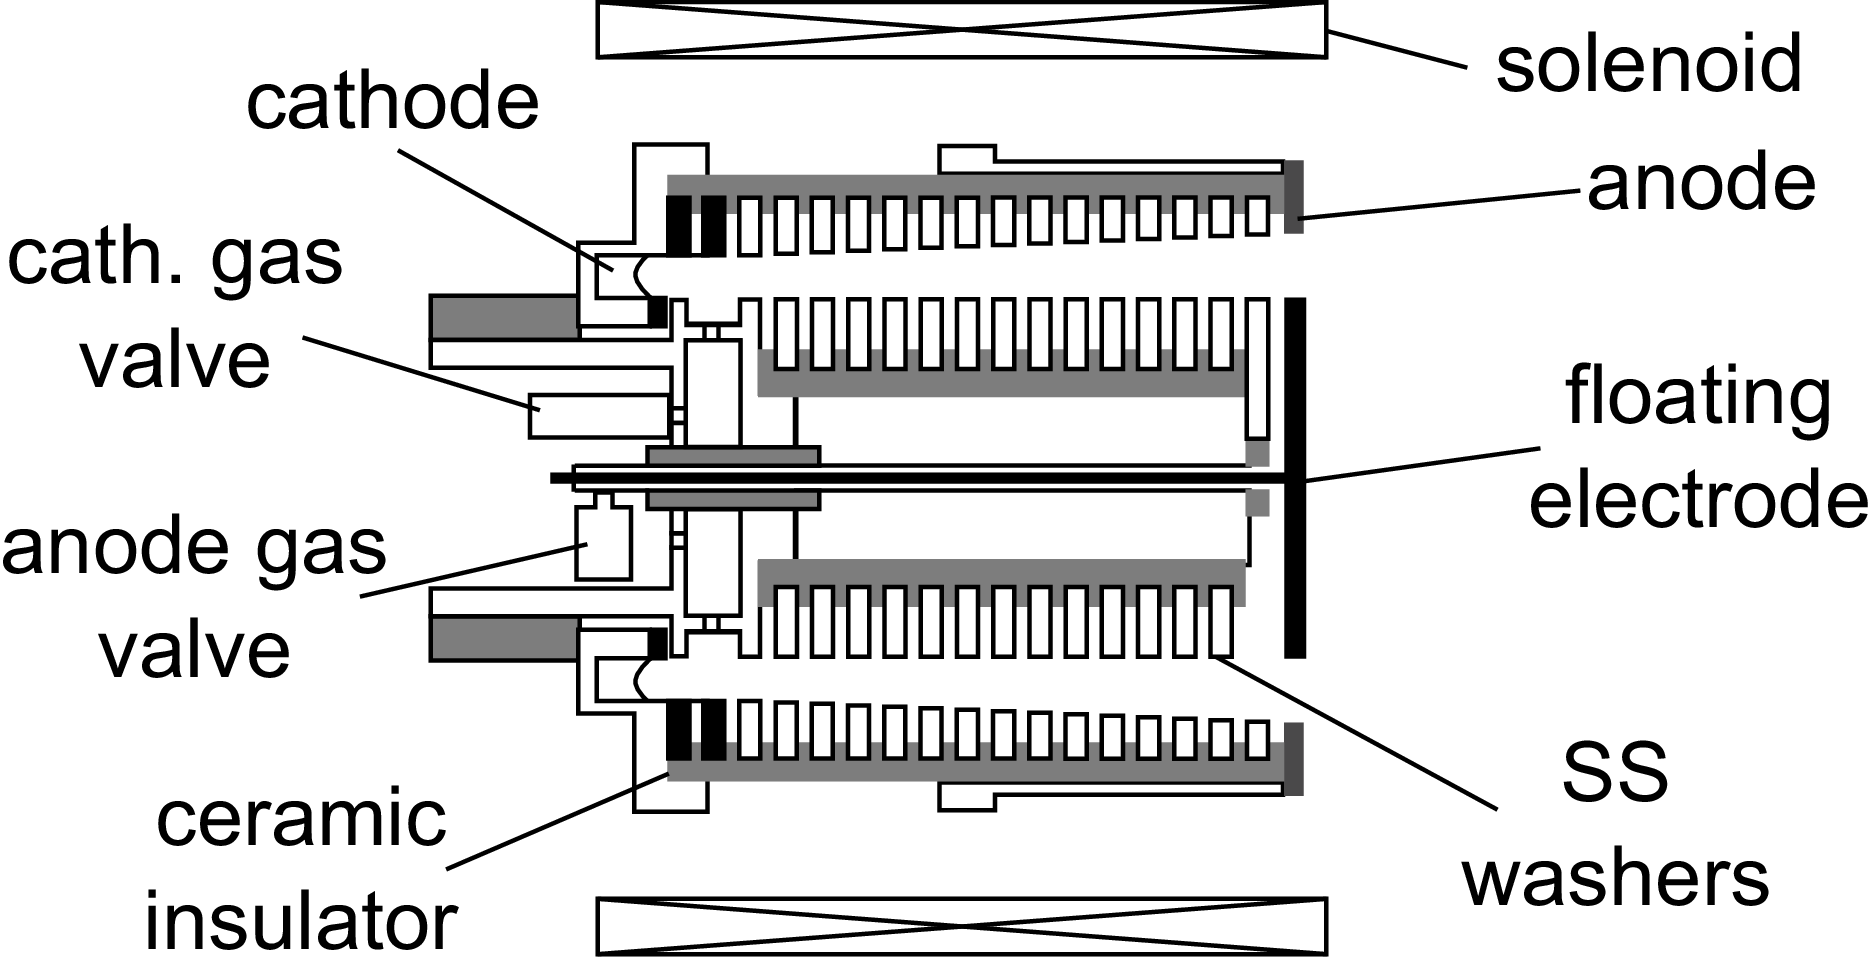
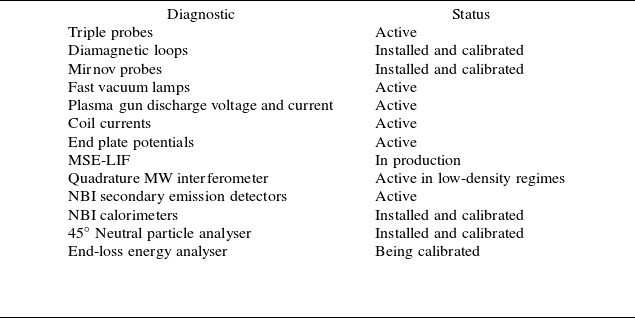
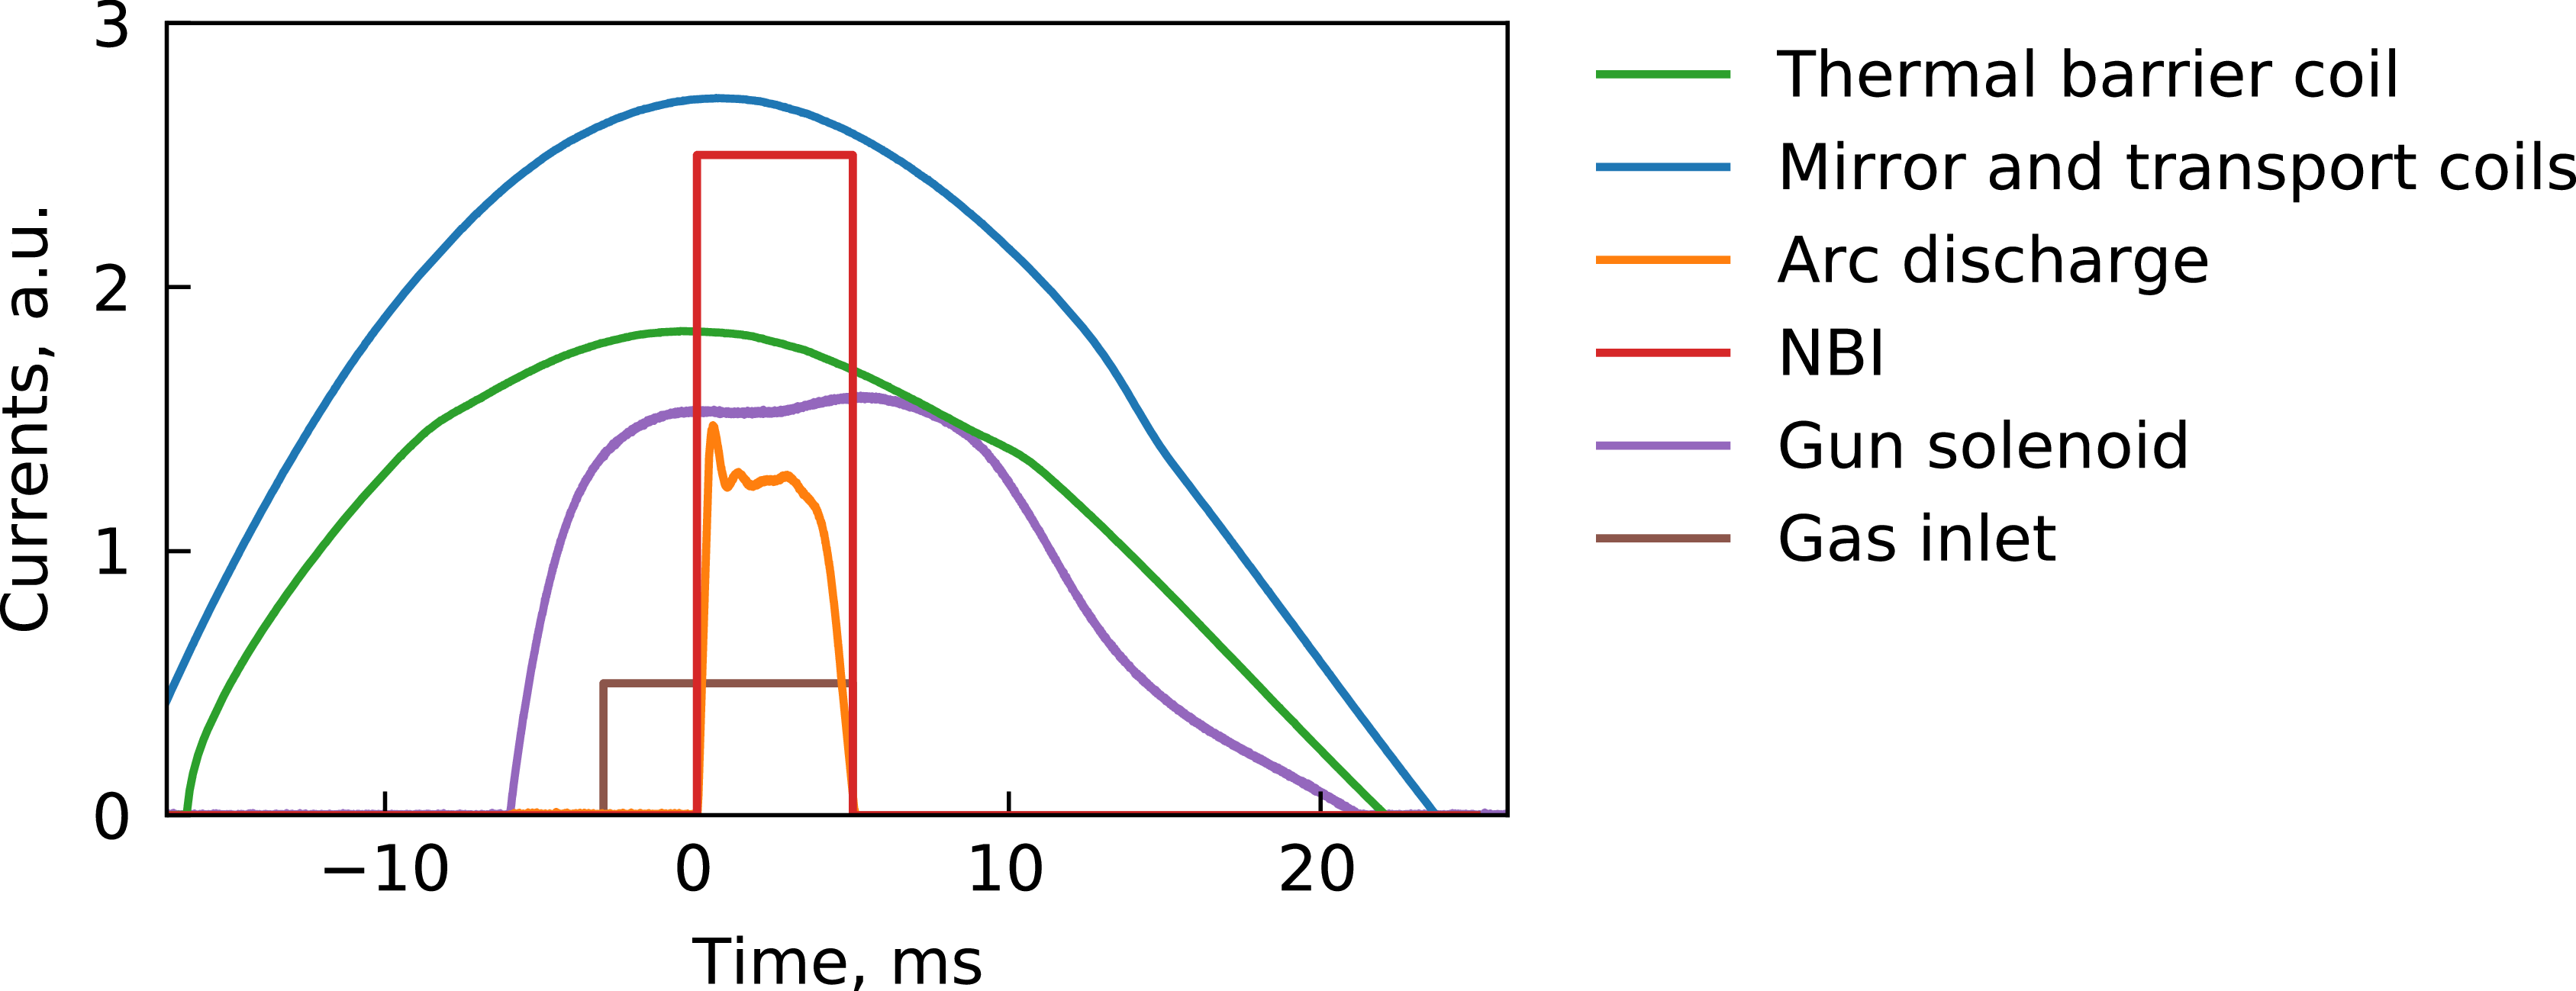
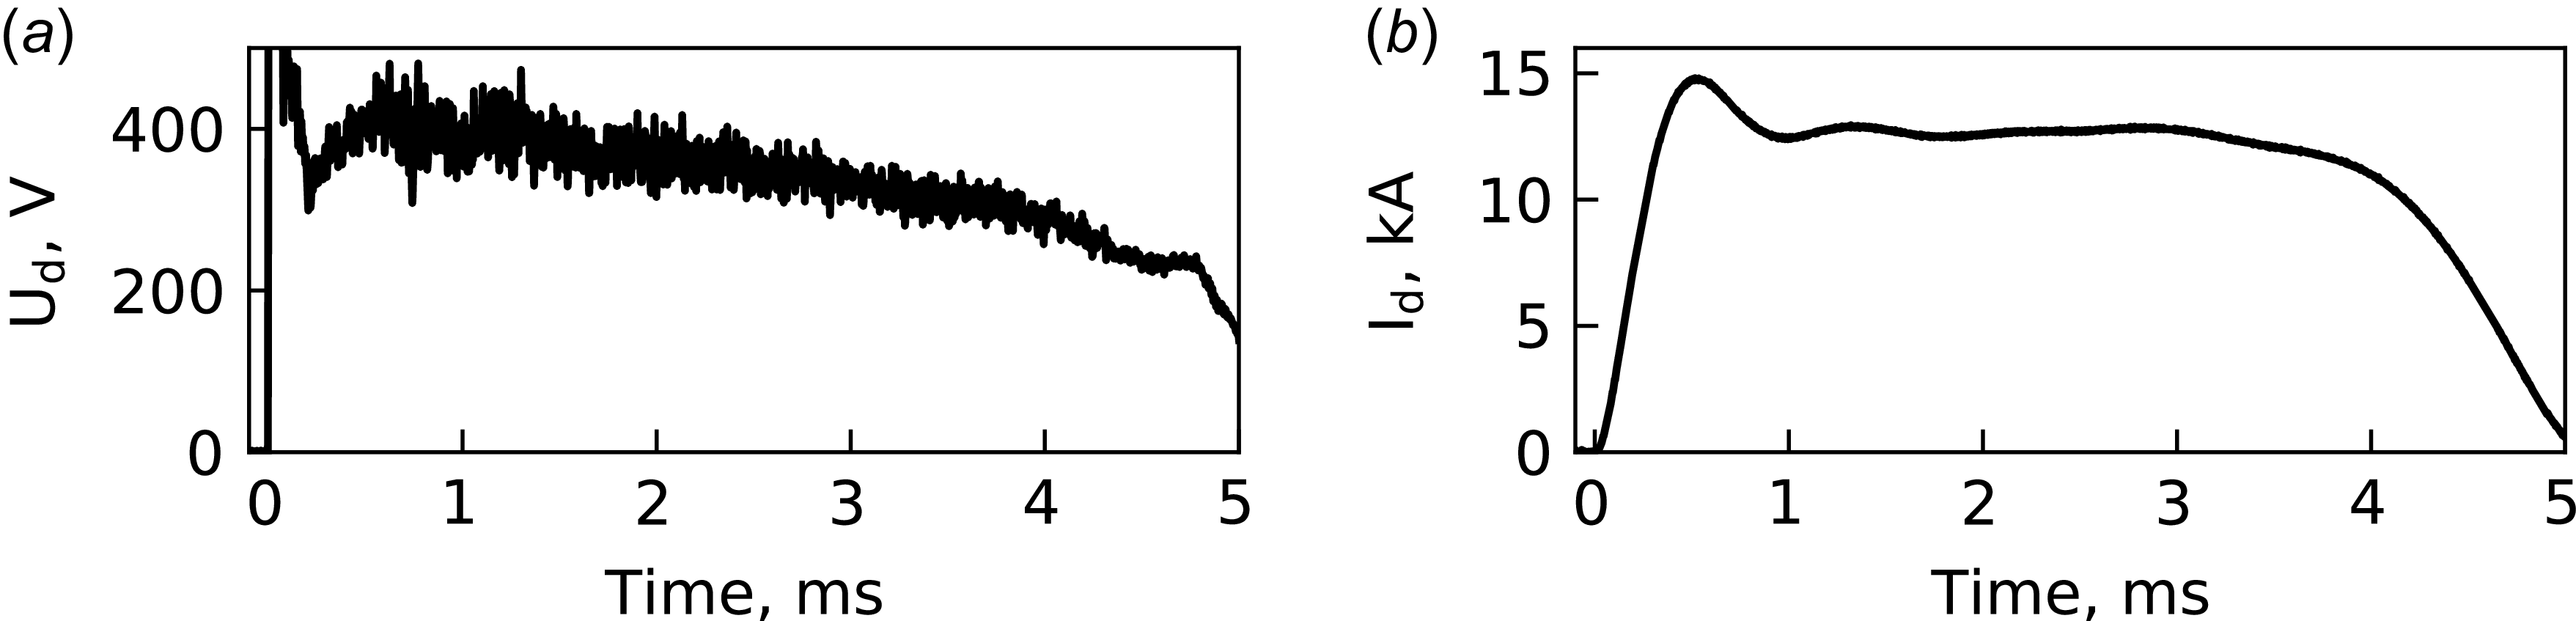
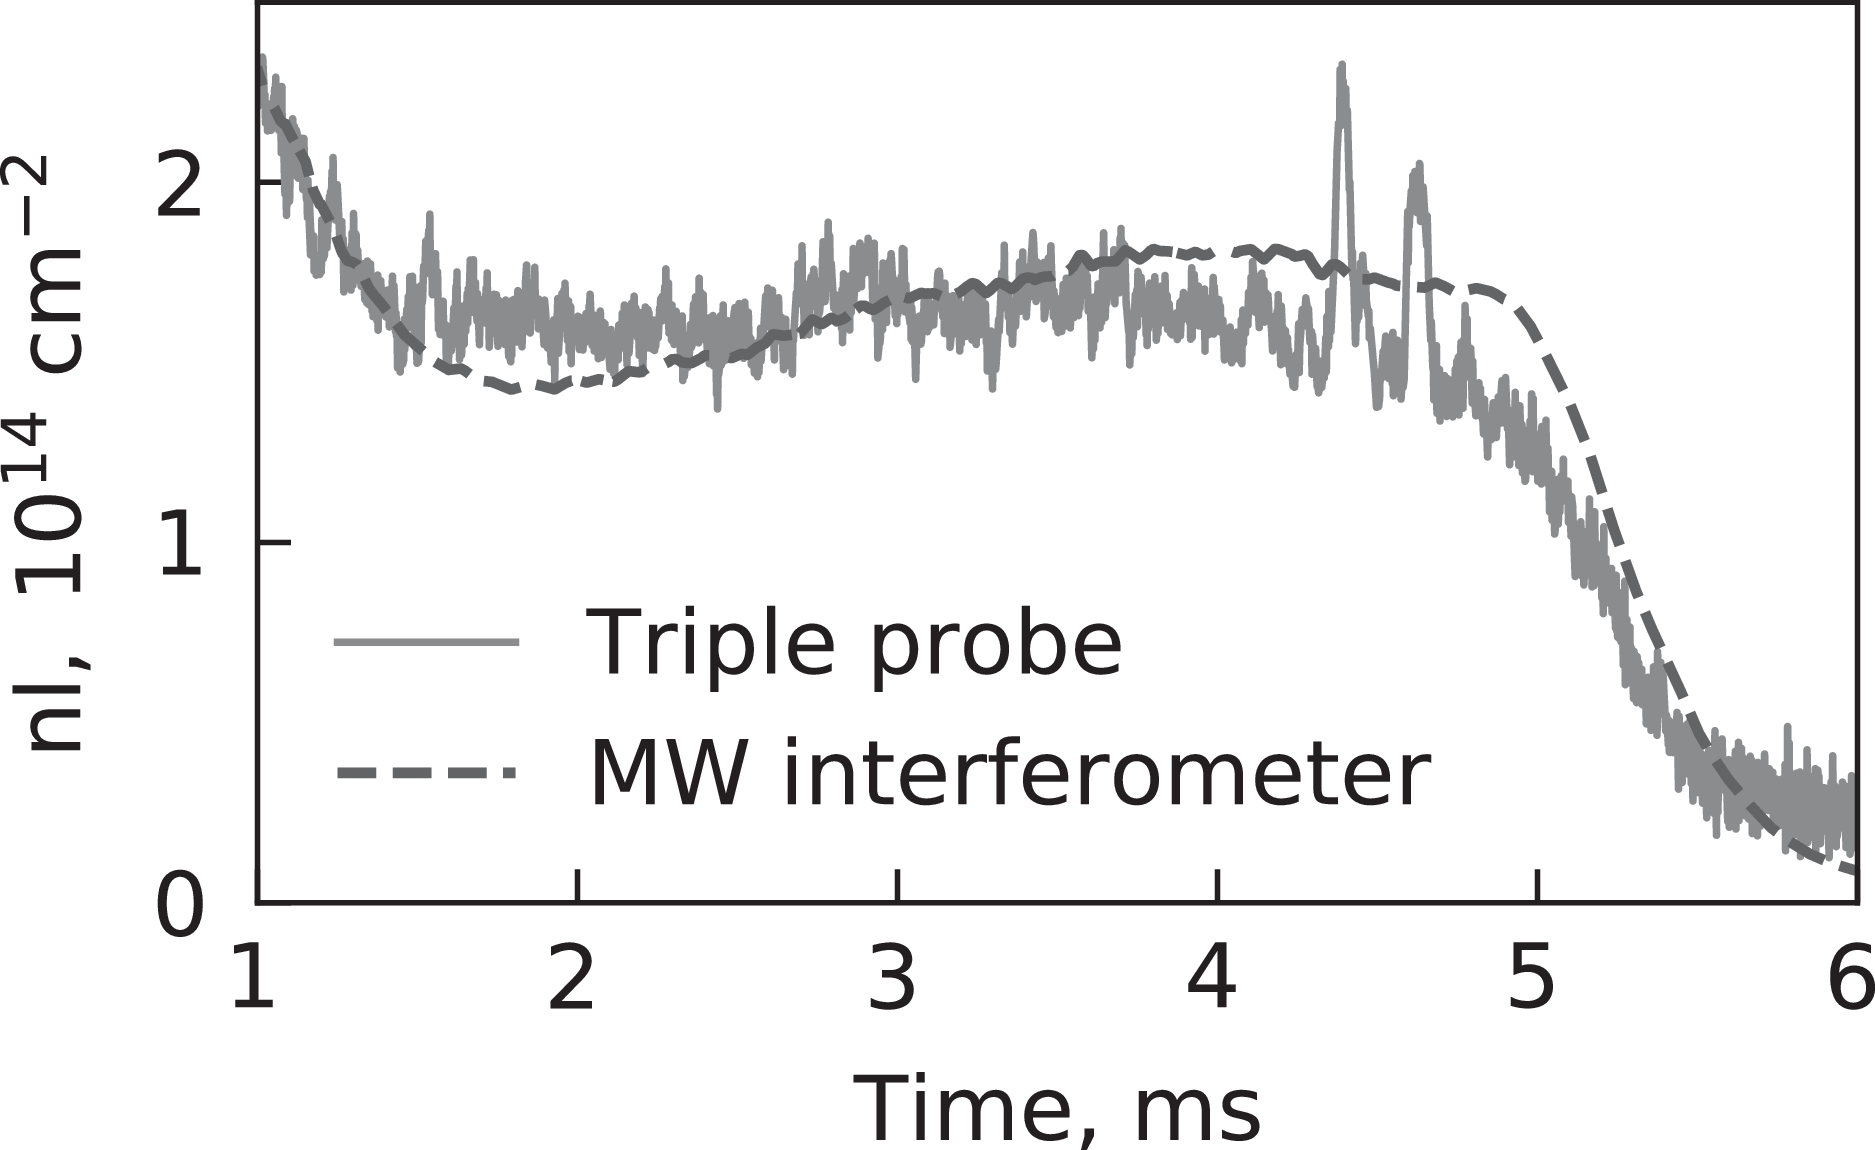


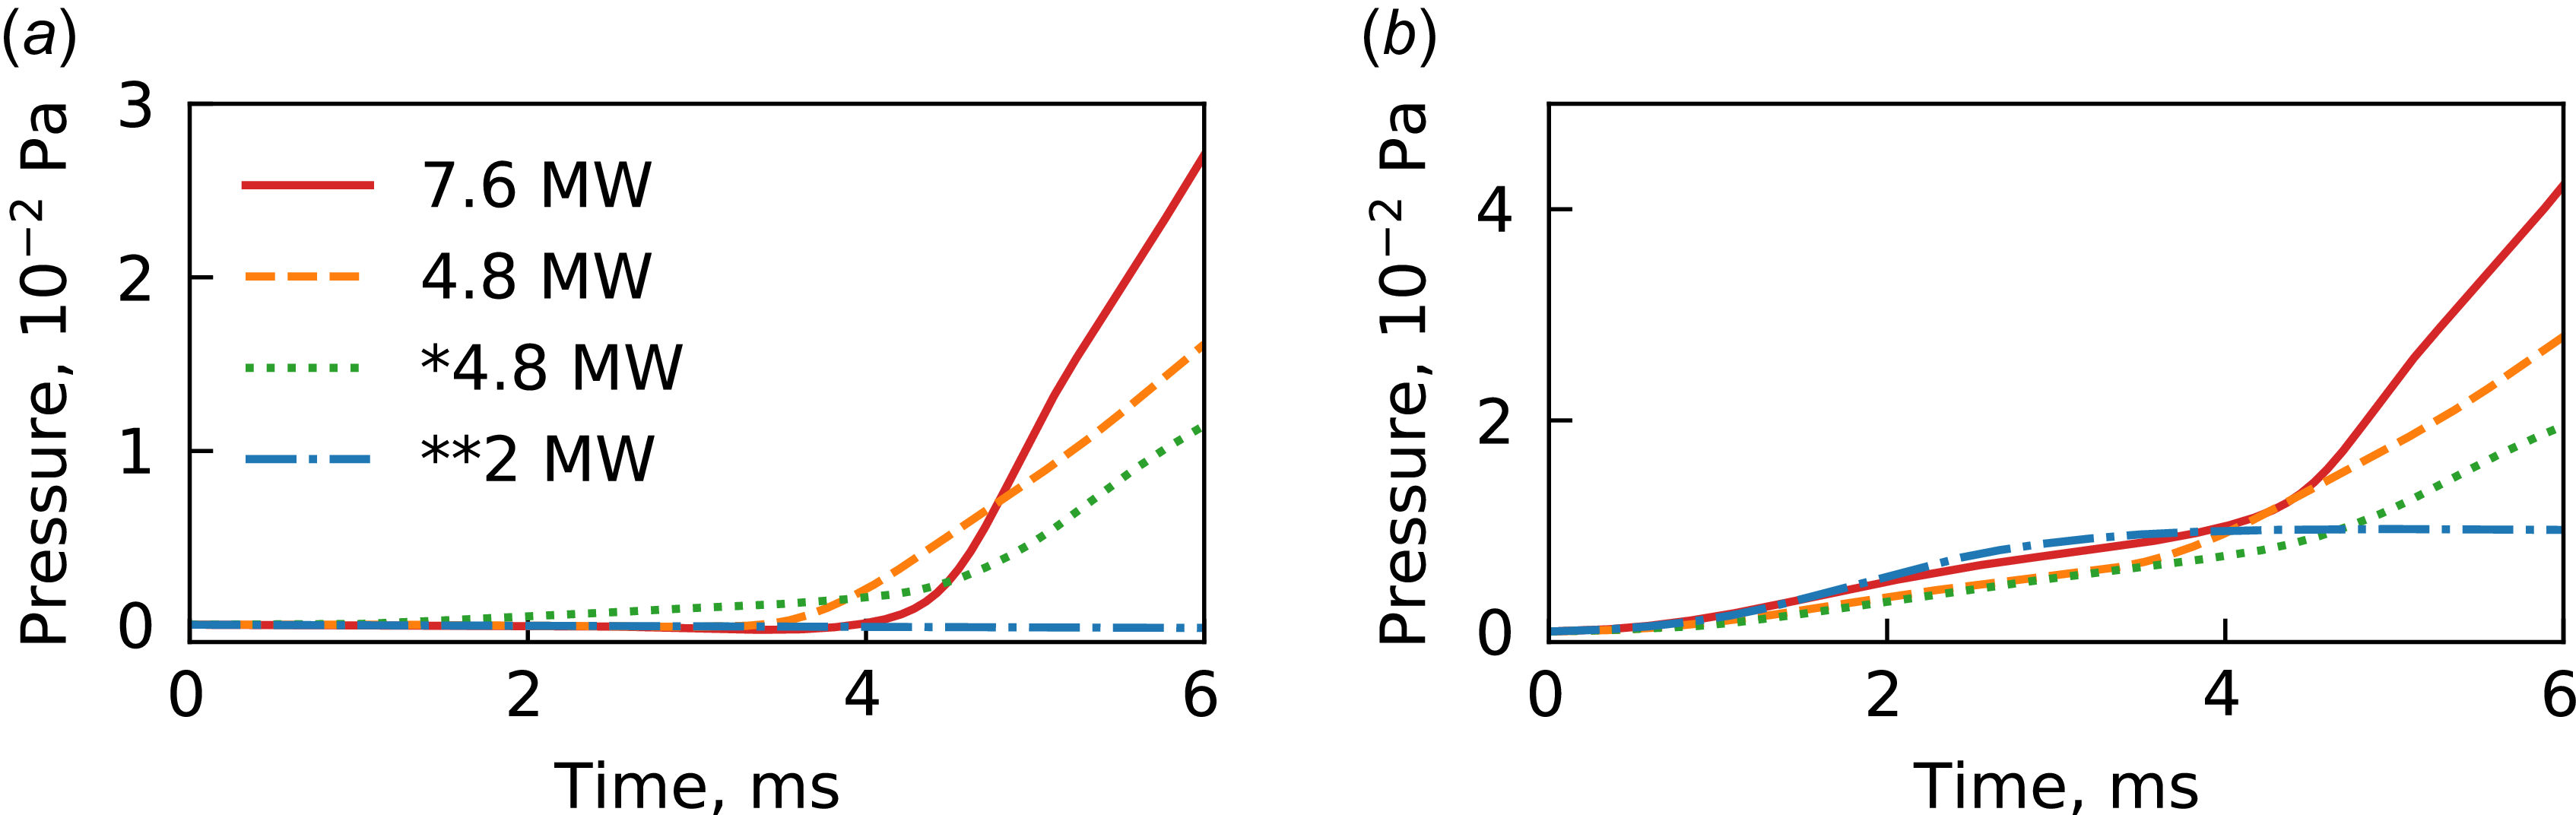


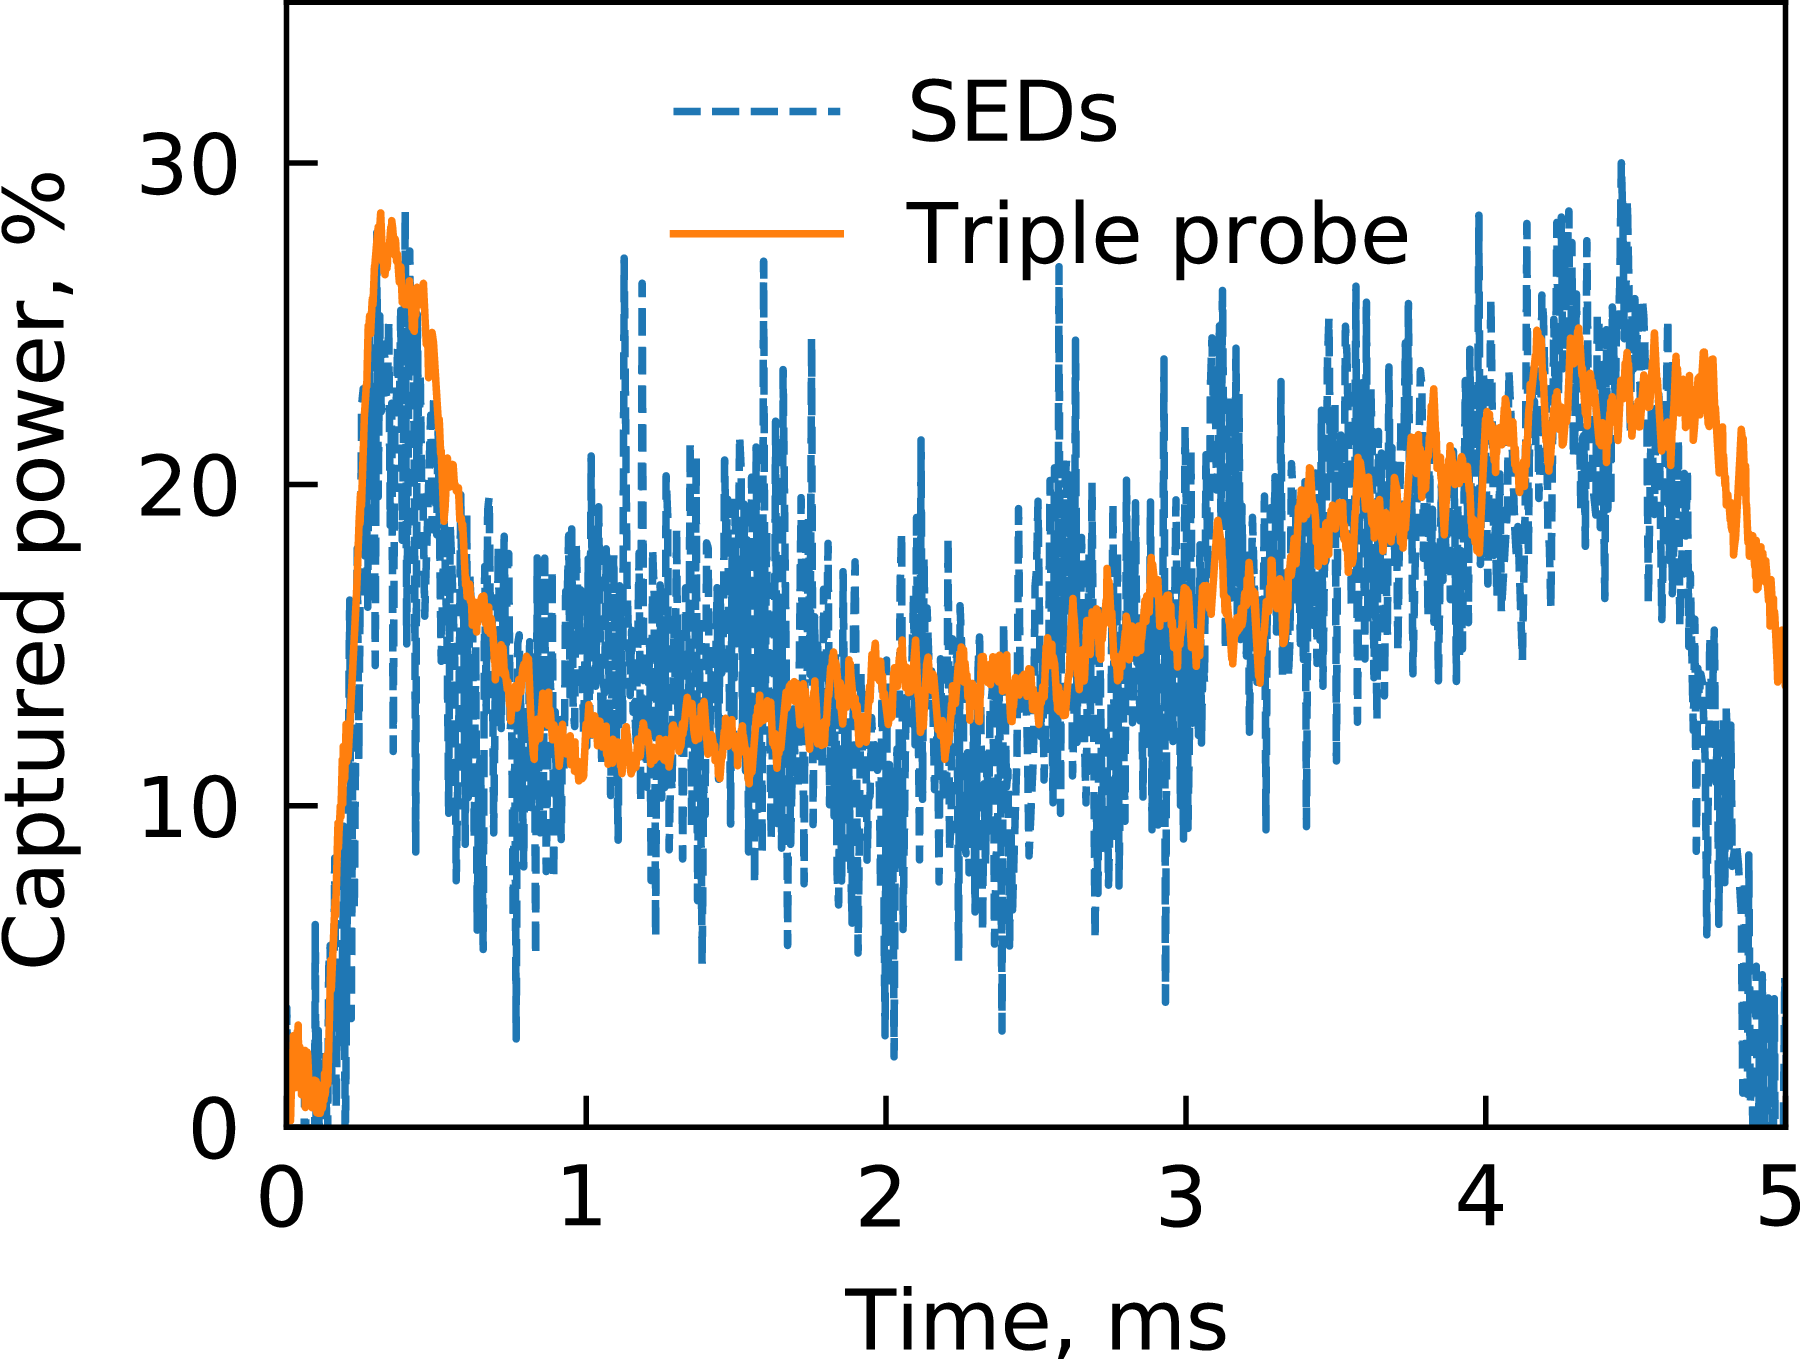

 Open access