





The double burden of malnutrition (DBM), characterised by the coexistence of undernutrition and overnutrition, remains a major challenge to global public health(Reference Shrimpton and Rokx1,Reference Swinburn, Kraak and Allender2) . It affects countries at all stages of development, with varying patterns across contexts, and has a particularly profound impact during childhood and adolescence, with consequences that often persist into adulthood(Reference Shrimpton and Rokx1–Reference Popkin, Corvalan and Grummer-Strawn4). Early and accurate assessment of weight status during these critical periods is essential for timely interventions that can prevent these conditions into adulthood(Reference Shrimpton and Rokx1).
BMI has traditionally been used to assess weight status in populations, classifying individuals as underweight, normal weight (NW), overweight or obese(Reference De Oliveira, Pereira and Melo5). However, BMI alone may not fully capture the complexity of individual growth trajectories over time(Reference Javed, Jumean and Murad6,Reference Silva, Rinaldi and Vasconcelos7) . To better understand how individuals develop relative to expected patterns, it is important to consider the concept of canalisation, which originates from developmental biology(Reference Waddington8). First proposed in 1942 by Waddington(Reference Waddington8,Reference Waddington9) , canalisation describes the tendency of biological systems to follow stable developmental pathways despite environmental and genetic variation. This concept was later applied to human growth, where it refers to the tendency of children and adolescents to follow relatively stable growth trajectories over time, particularly from early childhood until puberty(Reference Hermanussen, Largo and Molinari10,Reference Sorva, Tolppanen and Lankinen11) . Within this framework, growth is generally considered stable, and deviations are traditionally interpreted as reflecting underlying health or environmental influences(Reference Hermanussen, Largo and Molinari10–Reference Eveleth and Tanner13).
However, early empirical studies of canalisation(Reference Hermanussen, Largo and Molinari10,Reference Ekelund, Ong and Linné14,Reference Ventura, Loken and Birch15) were often based on intra-individual variability defined using sample-based means and sd rather than standardised growth references(Reference De Oliveira, Araujo and Severo16–Reference Kuczmarski, Ogden and Guo21). These approaches may be sensitive to periods of rapid developmental change – such as infancy and puberty – when growth velocity increases substantially, potentially leading to apparent deviations from expected trajectories, which may explain why earlier studies suggested greater stability in growth tracking only between approximately age three and the onset of puberty(Reference Eveleth and Tanner13).
More recently, the development of growth references based on the LMS method(Reference Cole22) has enabled the construction of age- and sex-specific BMI z-scores that account for changes in the distribution of growth across development(Reference De Oliveira, Araujo and Severo16–Reference Kuczmarski, Ogden and Guo21). By incorporating skewness (L), median (M) and CV (S), the LMS method provides a more accurate standardisation of individual measurements relative to population-level expectations(Reference Cole22). Within this framework, deviations from expected trajectories can be more robustly interpreted, as they are less influenced by normal developmental processes such as puberty.
In this context, BMI growth channels (BMI-GC) can be conceptualised as the range within which a child’s BMI z-scores consistently track over time, helping to identify atypical growth patterns that may signal future health risks(Reference De Oliveira, Araujo and Severo23). Evidence from studies using growth reference–based methods suggests that upward deviations in growth trajectories – whether defined by increases in z-scores or crossing percentile lines – are associated with an increased risk/odds of overweight and obesity later in life(Reference Ventura, Loken and Birch15,Reference De Oliveira, Araujo and Severo23–Reference Oluwagbemigun, Buyken and Alexy26) . For example, children who cross upward by two or more major weight-for-height percentiles within the first 24 months have higher odds of obesity in later childhood(Reference Taveras, Rifas-Shiman and Sherry25). Similarly, upward percentile crossing has been associated with an increased risk of metabolic diseases by adolescence(Reference Ventura, Loken and Birch15). Importantly, these risks are not limited to children already classified as overweight; prior evidence shows that increases of ≥ 0·67 and < 0·86 BMI z-scores among NW children during childhood are associated with a higher likelihood of overweight in early adolescence(Reference De Oliveira, Araujo and Severo23).
Despite these advances, most studies(Reference Ventura, Loken and Birch15,Reference De Oliveira, Araujo and Severo23–Reference Taveras, Rifas-Shiman and Sherry25) have focused on early infancy to childhood and have relied on percentile crossing or z-score differences between two time points, rather than modelling trajectories across multiple repeated measurements, thereby limiting the ability to capture the persistence, timing and directionality of growth deviations over time.
Moreover, these studies(Reference Ventura, Loken and Birch15,Reference Hawkins, Rifas-Shiman and Gillman24,Reference Taveras, Rifas-Shiman and Sherry25) have mostly used data from high-income countries and have concentrated only on overweight and obesity outcomes, with limited attention to the combined outcomes of DBM, particularly in low- and middle-income settings where underweight remains prevalent(Reference Popkin, Corvalan and Grummer-Strawn4). A longitudinal approach that evaluates BMI-GC across multiple time points allows for a more comprehensive assessment of whether individuals remain within or deviate from their expected growth channel over time, thereby distinguishing transient fluctuations from sustained deviations in growth trajectories. Therefore, using longitudinal data from low- to middle-income and high-income countries, this study aims to examine whether crossing BMI-GC – defined by a width of 0·75 z-scores – during childhood and adolescence is associated with the odds of underweight or overweight in young adulthood.
Methods
Study population
This study used secondary data from two prospective cohort studies including the older cohort of Young Lives – An International Study of Childhood Poverty (YL)(Reference Boyden27–Reference Barnett, Ariana and Petrou29) and the National Longitudinal Survey of Youth 1997 (NLSY97)(Reference Michael and Pergamit30,31) , reflecting low- to middle-income and high-income countries, respectively. Initiated in 2001, the YL older cohort recruited 3722 participants from Peru, Vietnam, India and Ethiopia, when they were 6- to 8 years old, using a multi-stage sampling strategy(Reference Barnett, Ariana and Petrou29). Although not nationally representative, this method captured the ethnic, geographic and religious diversity of the populations studied(Reference Barnett, Ariana and Petrou29). YL gathered data on health, education and well-being, including anthropometric measurements such as height and weight, which were collected by trained professionals(Reference Boyden27–Reference Barnett, Ariana and Petrou29). Ethical approval was obtained from the University of Oxford’s Central University Research Ethics Committee as well as from the national ethics committees in each participating country: the Instituto de Investigación Nutricional in Peru, the Hanoi School of Public Health Research in Vietnam, the Centre for Economic and Social Studies in India and the College of Health at Addis Ababa University in Ethiopia(Reference Barnett, Ariana and Petrou29).
The NLSY97 is an ongoing US-based study with a nationally representative sample of individuals born between 1980 and 1984(Reference Michael and Pergamit30). The initial cohort consisted of 8984 respondents, aged 12–16 years as of 31 December 1996(Reference Michael and Pergamit30). Participants were selected through a multi-stage stratified sampling design to ensure representativeness across various demographic groups(Reference Michael and Pergamit30). The survey has been conducted annually, collecting self-reported data on education, employment, family formation and health-related topics, including anthropometric measures such as height and weight(Reference Michael and Pergamit30,31) . The NLSY97 received ethical approval from the Institutional Review Boards of both the University of Chicago and the Ohio State University(Reference Michael and Pergamit30,31) .
Data processing and study eligibility
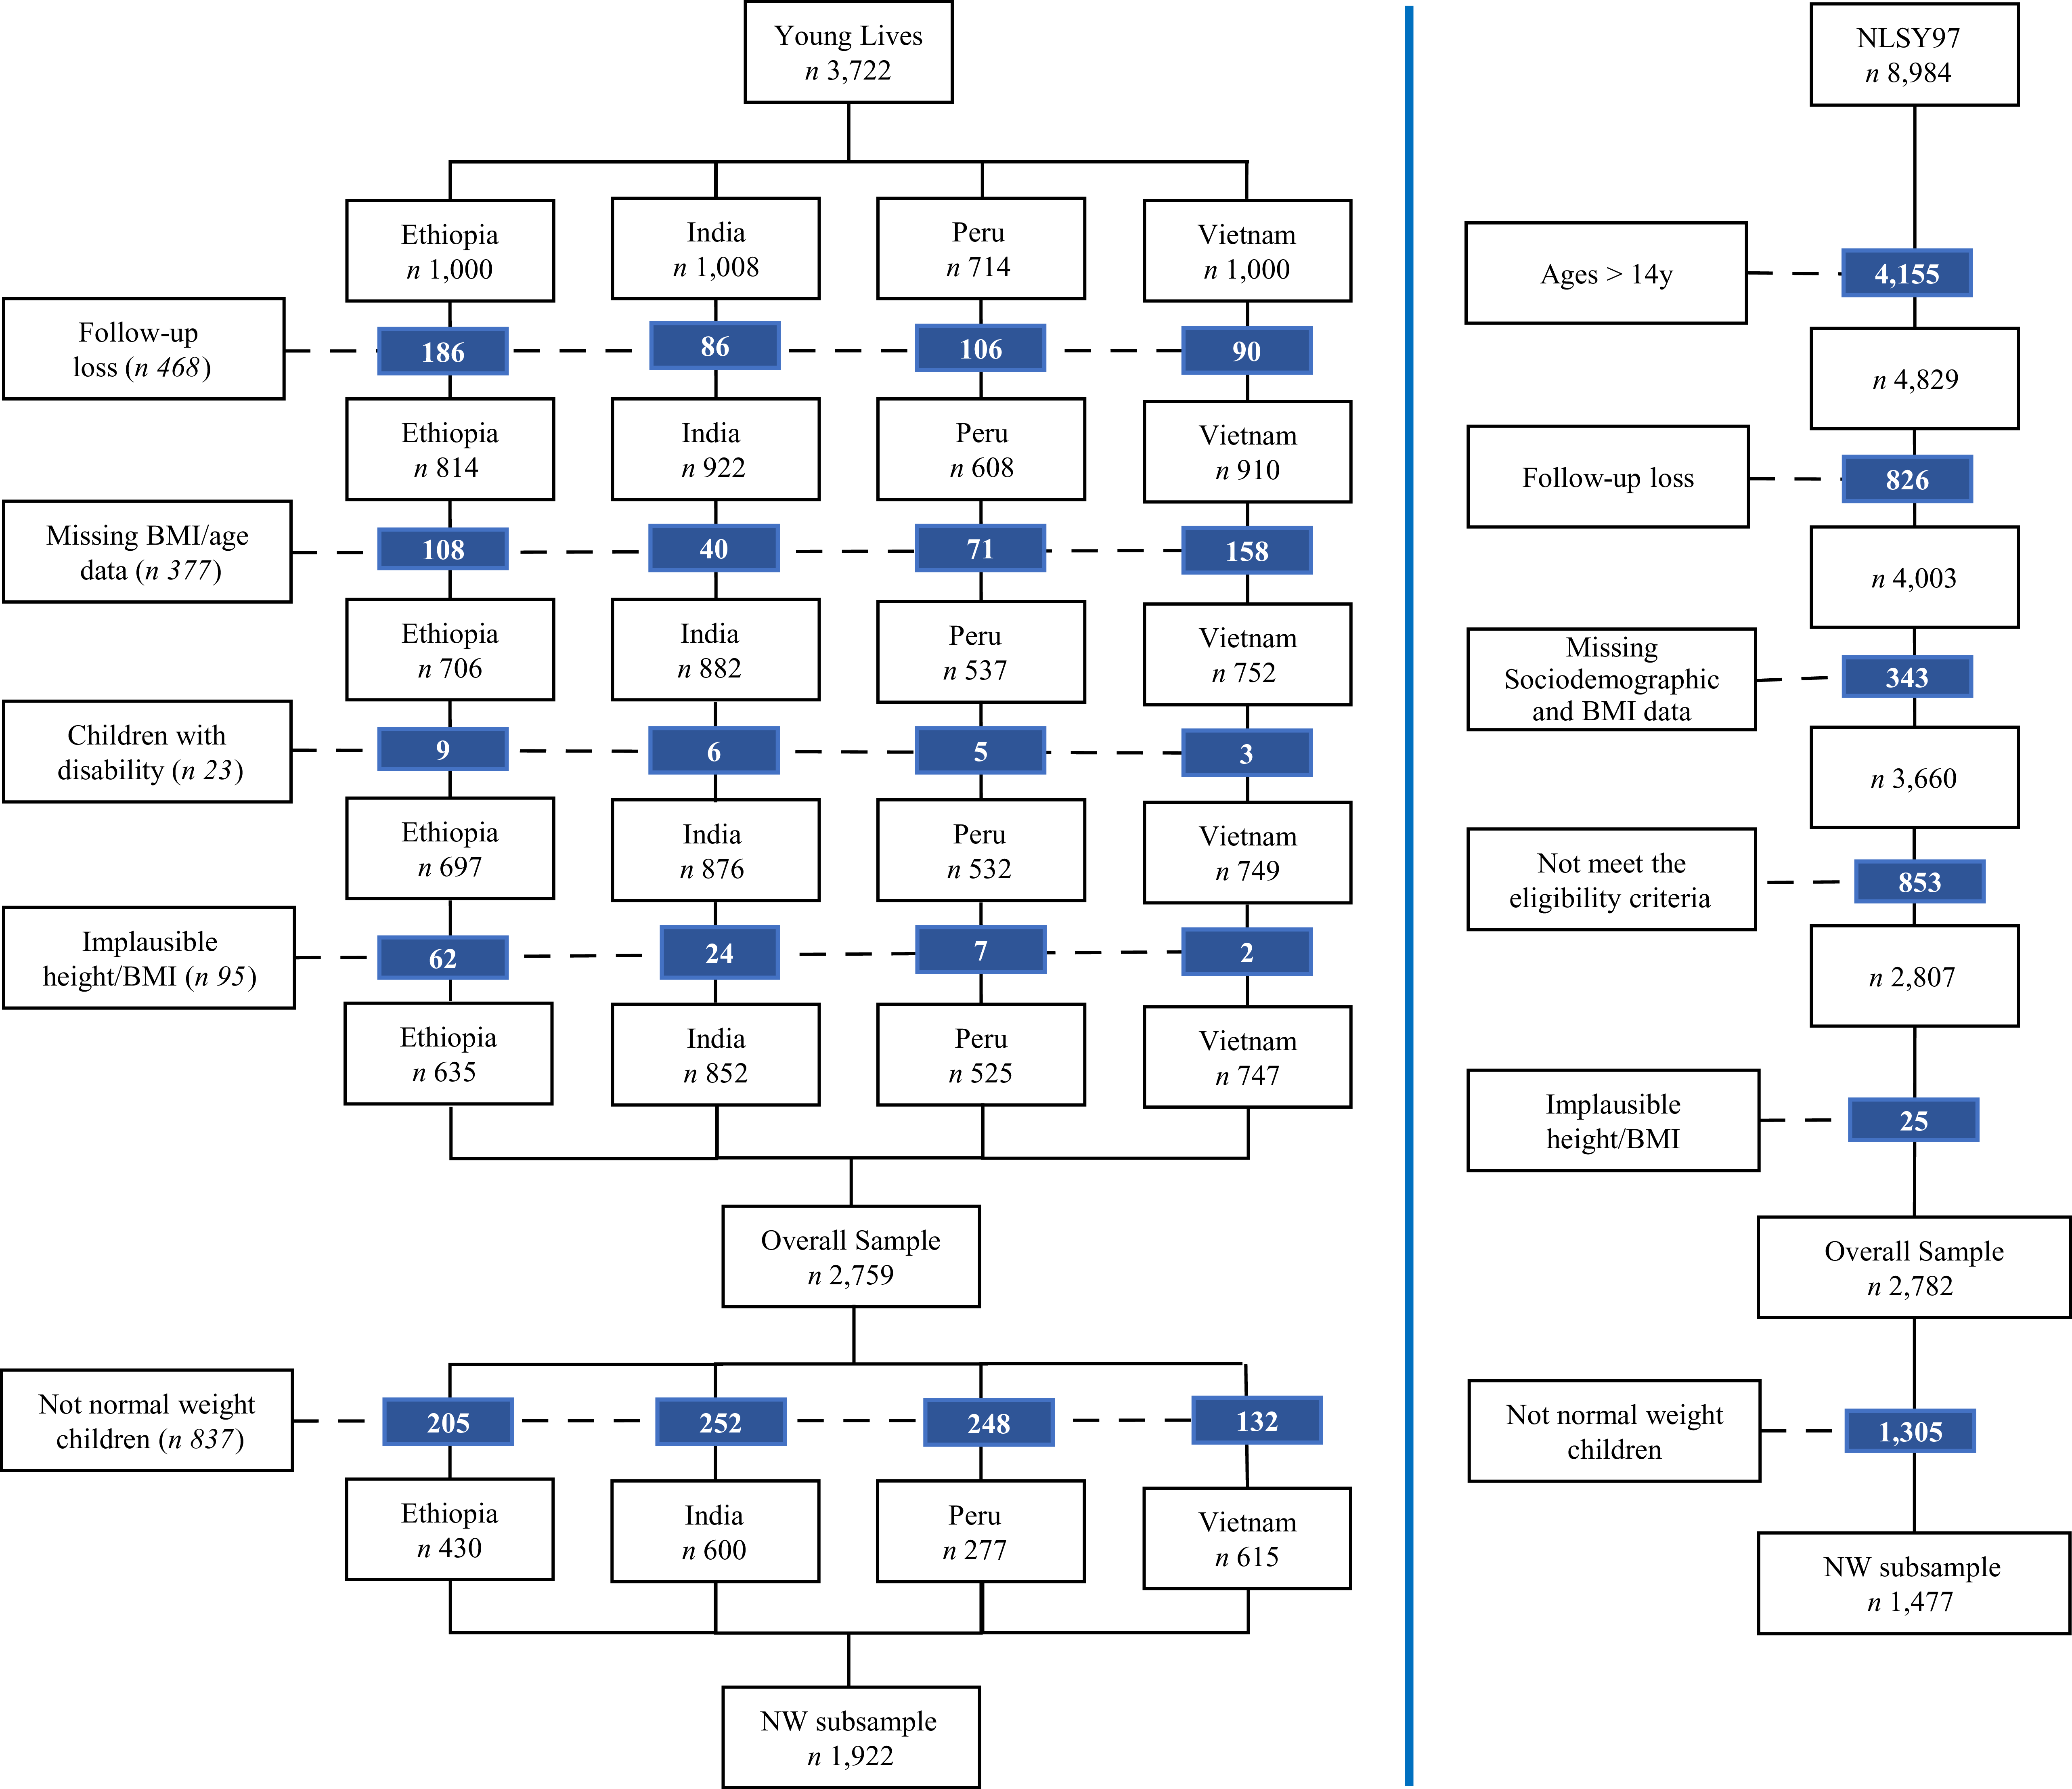
For YL, we used data from five rounds of measurement, when participants were on average 8, 12, 15, 19 and 22 years old(Reference Boyden27–Reference Barnett, Ariana and Petrou29). Participants were required to have anthropometric measurements for all five rounds to be eligible for inclusion in this study (n 2877)(Reference Boyden27,Reference Sanchez, Woldehanna and Duc28) . For NLSY97, we used all available anthropometric measures up to age 17, along with an additional measurement at age 22(Reference Michael and Pergamit30,31) . Eligible NLSY97 participants included those with at least four anthropometric measurements, including a baseline measurement specifically at ages 12–14, one during intermediate adolescence (ages 13–16), one at 16–17 years and one at 22 years (n 2807)(Reference Michael and Pergamit30,31) . Additional exclusions for both studies were made based on the following: children with disabilities (n 23) and implausible values (defined as height-for-age z-scores below –6 sd or above +6 sd and BMI-for-age z-scores below –5 sd or above +5 sd, based on WHO reference values; n 120)(Reference De Onis, Onyango and Borghi17,18,32) . After exclusions, the final sample consisted of 2759 participants and 13 795 data points for YL and 2782 participants and 13 831 data points for NLSY97. The selection process for each cohort, along with detailed information on missing data and follow-up loss, is presented in Figure 1, which outlines participant exclusions across waves. As in most longitudinal studies, some loss to follow-up occurred, as well as exclusions due to missing data or not meeting eligibility criteria.
Flow chart of participant selection. YL, Young Lives; NLSY97, National Longitudinal Survey of Youth, Cohort of 1997; n, number of participants. Implausible values: z-score of height-for-age < −6 or > +6 or z-score of BMI-for-age < −5 or > +5. NW subsample: only participants who were of normal weight during childhood-adolescence.

Figure 1. Long description
The flow chart illustrates the participant selection process for the Young Lives and National Longitudinal Survey of Youth, Cohort of 1997 studies. It begins with 3,722 participants in Young Lives and 8,984 participants in NLSY97. The chart details follow-up losses, missing data, and eligibility criteria across different countries and age groups. For Young Lives, it shows the breakdown by Ethiopia, India, Peru, and Vietnam, with specific numbers for each stage of attrition and exclusion. Similarly, for NLSY97, it details the selection process for participants aged over 14 years. The chart concludes with the final sample sizes for both studies, highlighting the number of participants who met the criteria for the normal weight subsample.
Anthropometric (height, weight and BMI) and sociodemographic variables, including age, sex, socio-economic status (SES) and race/ethnicity, were selected. In both cohorts, BMI was categorised into underweight, NW, overweight or obesity according to the MULT growth reference (2023), and sex was recorded as male or female based on the designation at birth(Reference De Oliveira, Araujo and Severo16,Reference Barnett, Ariana and Petrou29,Reference Michael and Pergamit30) . SES was assessed differently across cohorts(Reference Barnett, Ariana and Petrou29,Reference Michael and Pergamit30) . In YL, SES was assessed at each timepoint using the average Wealth Index – based on housing quality, consumer durables and access to services – and classified into quartiles(Reference Boyden27–Reference Barnett, Ariana and Petrou29). In NLSY97, SES was measured using the US average poverty ratio index during adolescence and classified into four categories: poor/low, middle, upper middle and high income(Reference Michael and Pergamit30,31) . Race/ethnicity classifications also differed: in YL, participants were grouped as White, Black, Mestizo, Asian, Indian or Other, while in NLSY97, they were classified as White, Black, Hispanic or mixed race(Reference Boyden27–31).
Statistical analyses
All statistical analyses were conducted using R software, version 4.4.1 for Windows(33). Descriptive statistics summarised the demographic, socio-economic and BMI characteristics across developmental stages for both cohorts.
Using the lme4 package in R, a linear mixed-effects model with a fixed intercept and random intercepts by participant was fitted, with the slope constrained to zero in order to estimate each child’s average BMI z-score across repeated measurements over time(Reference Bates, Mächler and Bolker34). This specification was chosen because the primary objective was not to model individual growth trajectories per se, but rather to define a stable central tendency around which each participant’s BMI z-scores varied across childhood and adolescence, consistent with the concept of BMI-GC.
By focusing on the individual-specific intercept, this approach captures the expected level of BMI relative to population standards, while allowing repeated observations to be used to assess whether individuals remain within or deviate from their expected range over time. In this context, the model does not aim to characterise trajectory shape (e.g. acceleration or deceleration), but rather to establish a reference level for evaluating longitudinal variation.
To identify individual BMI-GC during childhood and adolescence, we followed prior literature and tested the channel width of 0·75 BMI z-scores(Reference Gallo35). This threshold lies within the range commonly used in studies of growth channelling (e.g. 0·67–0·86 sd), which correspond to meaningful shifts across major percentile bands in growth charts(Reference De Oliveira, Araujo and Severo23,Reference Gallo35) .
For each participant, the predicted BMI z-score per age served as the centre of the growth channel, and the lower and upper bounds were defined by subtracting and adding half the channel width (±0·375)(Reference Lüdecke36). The selected width represents a balance between sensitivity and specificity in identifying deviations from expected growth patterns, avoiding the classification of minor fluctuations as meaningful changes while still capturing sustained departures from the expected trajectory. Based on this method, we classified participants into one of four distinct patterns of BMI-GC across childhood and adolescence including (1) Stable, for participants who remained within the bounds of their BMI-GC throughout; (2) Crossing Upwards, for those who exceeded only the upper limit of their channel at any point; (3) Crossing Downwards, for those who only fell below the lower limit; and (4) Fluctuating, for those who crossed both upwards and downwards over time.
To examine the association between BMI-GC patterns during childhood and adolescence and the odds of being underweight (only in YL) or overweight including obesity (YL and NLSY97) in young adulthood, separate logistic regression models were fitted for each cohort(Reference Sperandei37). Odds of underweight were only examined in YL because the small number of underweight participants in NLSY97 prohibited this analysis. In each model, the exposure variable was the BMI-GC group – Stable, Crossing Upwards, Crossing Downwards or Fluctuating – based on whether participants tracked within or moved across the specified BMI z-score boundaries over time. OR and 95 % CI were calculated by exponentiating the model coefficients(33,Reference Sperandei37) . Models were run adjusted for sex (male as reference), country or race/ethnicity (India as the reference for YL and White as the reference for NLSY97) and SES (4th wealthiest quartile for YL and high income for NLSY97 as reference).
Additionally, a small number of sensitivity analyses were conducted for both cohorts. First, analyses were limited to participants who were of NW during childhood and adolescence – ages 6–19 years for YL and ages 12–17 years for NLSY97. Specifically, NW subsamples were selected, comprising 1922 participants from YL and 1477 participants from NLSY97. In addition, stratified analyses by sex were performed for both the overall samples and the NW subsamples to assess whether similar results were observed for males and females.
Results
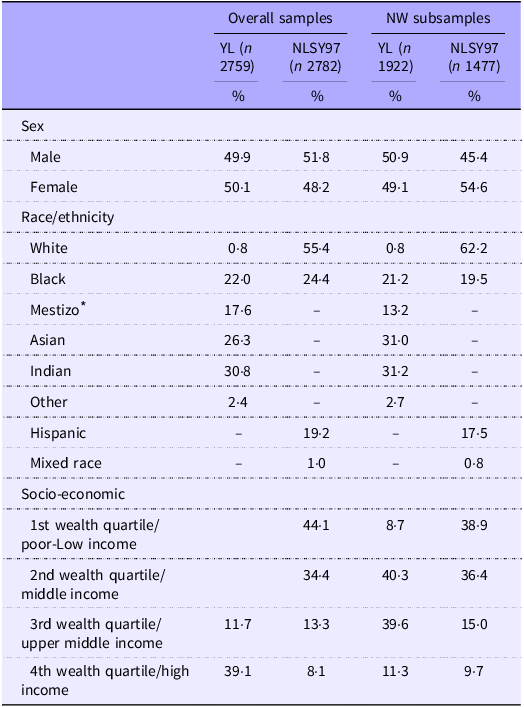
Sociodemographic characteristics are presented in Table 1. Regarding racial/ethnic composition, YL participants were predominantly Indian (30·8 %), Asian (26·3 %), Black (22·0 %) and Mestizo (17·6 %; Peru only), with very few identifying as White (0.8 %). In contrast, participants in the NLSY97 cohort were predominantly White (55·4 %), followed by Black (24·4 %), Hispanic (19·2 %) and mixed race (1·0 %).
Distribution of sociodemographic characteristics in the YL and NLSY97 cohorts

Table 1. Long description
The table presents a comparison of sociodemographic characteristics between the YL and NLSY97 cohorts, focusing on sex, race/ethnicity, and socio-economic status. It includes data for overall samples and NW subsamples. The table has four main categories: sex, race/ethnicity, socio-economic status, and wealth quartiles. For sex, the YL cohort is nearly evenly split between male (forty-nine point nine percent) and female (fifty point one percent), while the NLSY97 cohort has fifty-one point eight percent male and forty-eight point two percent female. In terms of race/ethnicity, the YL cohort is predominantly Indian (thirty point eight percent), Asian (twenty-six point three percent), Black (twenty-two percent), and Mestizo (seventeen point six percent), with very few identifying as White (zero point eight percent). The NLSY97 cohort is predominantly White (fifty-five point four percent), followed by Black (twenty-four point four percent), Hispanic (nineteen point two percent), and mixed race (one percent). Socio-economic data shows that in the YL cohort, forty-four point one percent are in the first wealth quartile/poor-low income, thirty-four point four percent in the second wealth quartile/middle income, eleven point seven percent in the third wealth quartile/upper middle income, and thirty-nine point one percent in the fourth wealth quartile/high income. The NLSY97 cohort has eight point seven percent in the first wealth quartile, forty point three percent in the second, thirteen point three percent in the third, and eight point one percent in the fourth.
NW subsample, only participants who were normal weight during childhood-adolescence; YL, Young Lives; NLSY97, National Longitudinal Survey of Youth, Cohort of 1997; n, number of participants.
* Only in Peru.
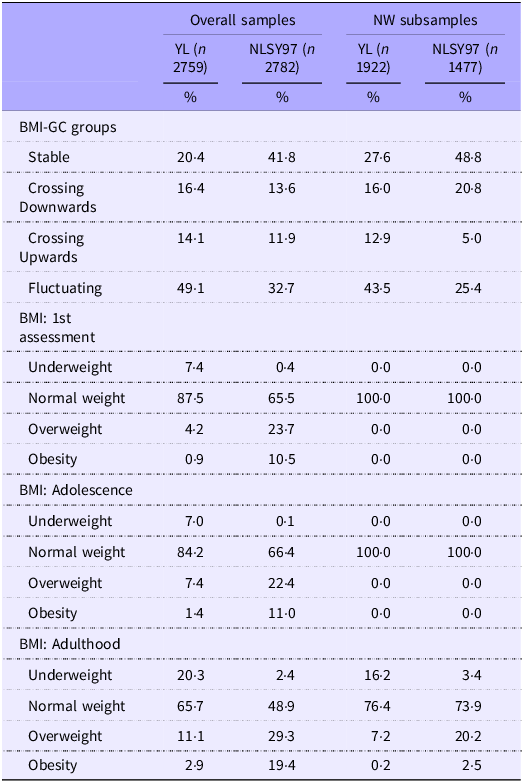
The distribution of BMI-GC groups differed between the YL and NLSY97 cohorts (Table 2). Stable BMI trajectories were more common in the NLSY97 cohort, with 41·8 % of participants classified in the Stable group, compared with only 20·4 % in YL. Conversely, fluctuating trajectories were notably more prevalent in the YL cohort (49·1 %) than in NLSY97 (32·7 %). In terms of weight status (Table 2), the majority of YL participants were classified as NW during childhood (87·5 %) and adolescence (84·2 %). In NLSY97, 65·5– 66·4 % of participants were classified as NW during adolescence. In young adulthood, these proportions declined to 65·7 % for YL and to 48·9 % for NLSY97.
BMI-GC groups and weight status across life stages

Table 2. Long description
The table compares BMI-GC groups and weight status across life stages for YL and NLSY97 cohorts. It includes data for overall samples and NW subsamples, with percentages for stable, crossing downwards, crossing upwards, and fluctuating BMI trajectories. For the YL cohort, 20.4% have stable trajectories, 16.4% crossing downwards, 14.1% crossing upwards, and 49.1% fluctuating. In the NLSY97 cohort, 41.8% have stable trajectories, 13.6% crossing downwards, 11.9% crossing upwards, and 32.7% fluctuating. The NW subsamples show 27.6% stable, 16.0% crossing downwards, 12.9% crossing upwards, and 43.5% fluctuating for YL, and 48.8% stable, 20.8% crossing downwards, 5.0% crossing upwards, and 25.4% fluctuating for NLSY97. Weight status classifications during childhood, adolescence, and young adulthood are also compared, with notable declines in normal weight percentages and increases in overweight and obesity percentages from adolescence to young adulthood in both cohorts.
NW subsample, only participants who were normal weight during childhood-adolescence; YL, Young Lives; NLSY97, National Longitudinal Survey of Youth, Cohort of 1997; n, number of participants; BMI-GC, BMI growth channel.
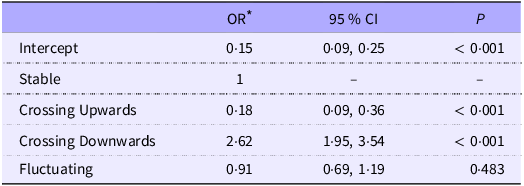
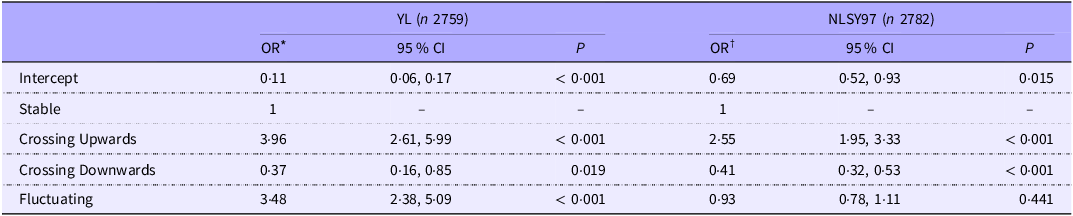
Adjusted associations between BMI-GC patterns and the odds of underweight and overweight in young adulthood were observed in the YL cohort (Table 3). Participants in the Crossing Downwards group exhibited higher odds of being underweight compared with those in the Stable group (OR 2·62; 95 % CI 1·95, 3·54; P < 0·001). Similarly, adjusted associations between BMI-GC patterns and the odds of overweight in young adulthood were observed in both cohorts (Table 4). Participants classified as Crossing Upwards consistently showed higher odds of being overweight compared with those in the Stable group – OR 3·96 (95 % CI 2·61, 5·99; P < 0·001) in YL and OR 2·55 (95 % CI 1·95, 3·33; P < 0·001) in NLSY97. Moreover, fluctuating trajectories were associated with an increased likelihood of overweight in the YL cohort (OR 3·48; 95 % CI 2·38, 5·09; P < 0·001).
Odds of underweight in young adulthood according to BMI growth channel transitions during childhood-adolescence in the Young Lives cohort (n 2759)

Table 3. Long description
The table presents data on the adjusted associations between BMI growth channel (BMI-GC) patterns and the odds of underweight and overweight in young adulthood. It includes five rows and four columns. The columns are labeled OR, 95% CI, and P. The rows are labeled Intercept, Stable, Crossing Upwards, Crossing Downwards, and Fluctuating. The Intercept row shows an OR of 0.15 with a 95% CI of 0.09 to 0.25 and a P value of less than 0.001. The Stable row has an OR of 1. The Crossing Upwards row shows an OR of 0.18 with a 95% CI of 0.09 to 0.36 and a P value of less than 0.001. The Crossing Downwards row shows an OR of 2.62 with a 95% CI of 1.95 to 3.54 and a P value of less than 0.001. The Fluctuating row shows an OR of 0.91 with a 95% CI of 0.69 to 1.19 and a P value of 0.483. The table indicates that participants in the Crossing Downwards group have higher odds of being underweight compared to those in the Stable group. Similarly, participants in the Crossing Upwards group have higher odds of being overweight compared to those in the Stable group in both cohorts. Fluctuating trajectories are also associated with an increased likelihood of overweight in the YL cohort.
n, number of participants.
* Logistic regression adjusted for sex, country and socio-economic status.
Odds of overweight in young adulthood according to BMI growth channel transitions during childhood-adolescence

Table 4. Long description
The table presents data on the odds ratios of overweight in young adulthood based on BMI growth channel transitions during childhood and adolescence. It includes two cohorts, YL and NLSY97, with 2759 and 2782 participants respectively. The table has five rows and six columns, with columns labeled Intercept, Stable, Crossing Upwards, Crossing Downwards, and Fluctuating. Each row provides the odds ratio (OR), 95 percentage confidence interval (CI), and P-value for each BMI growth channel transition. Notable trends include higher odds of overweight for those in the Crossing Upwards and Fluctuating groups compared to the Stable group in both cohorts. The Crossing Upwards group shows OR values of 3.96 in YL and 2.55 in NLSY97, both with P-values less than 0.0001. The Fluctuating group in YL has an OR of 3.48 with a P-value less than 0.0001.
YL, Young Lives; NLSY97, National Longitudinal Survey of Youth, Cohort of 1997; n, number of participants.
* Logistic regression adjusted for sex, country and socio-economic status.
† Logistic regression adjusted for sex, race/ethnicity and socio-economic status.
The NW subsamples (used for sensitivity analyses) exhibited similar demographic characteristics to the overall samples in both cohorts (Table 1). Within these NW subsamples, the distribution of BMI-GC groups showed patterns comparable to those observed in the overall samples: stable BMI trajectories remained more common in the NLSY97 cohort (48·8 %) than in YL (27·6 %), while fluctuating trajectories were again more frequent in YL (43·5 %) than in NLSY97 (25·4 %). Associations between BMI-GC and odds of underweight and overweight in the NW subsamples largely mirrored those found in the overall samples (online Supplementary Tables S1 and S2), although the effects were somewhat attenuated. In YL, participants classified in the Crossing Downwards group continued to show higher odds of underweight (OR 1·75; 95 % CI 1·23, 2·48; P = 0·002). Furthermore, participants in the Crossing Upwards group exhibited increased odds of overweight in both cohorts – OR 1·95 (95 % CI 1·14, 3·34; P = 0·015) in YL and OR 1·67 (95 % CI 1·00, 2·78; P = 0·048) in NLSY97. Fluctuating trajectories were also associated with increased odds of overweight in YL (OR 1·90; 95 % CI 1·20, 3·00; P = 0·006).
Sex-stratified analyses (online Supplementary Tables S3 and S4 ) showed similar directions of association, with Crossing Downwards linked to underweight and Crossing Upwards linked to overweight.
Discussion
We introduce an innovative approach that leverages multiple BMI measurements across developmental stages to characterise individualised BMI-GC and explore how deviations from these channels may increase the odds of DBM – both underweight and overweight – in young adulthood. Using data from two cohorts representing low- and middle-income and a high-income setting, we found that downward crossing of BMI-GC during childhood and adolescence is associated with increased odds of underweight in young adulthood in the low- and middle-income cohort, whereas upward crossing of BMI-GC is linked with increased odds of overweight across both contexts.
These effects were maintained in a subsample of participants who were NW throughout childhood and adolescence, indicating that effects cannot be attributed to weight status alone prior to adulthood. Overall, findings illustrate that assessing weight status based solely on isolated BMI classifications at specific time points may overlook long-term growth patterns, underlining the importance of tracking children’s growth trajectories over time to ensure they remain within a growth channel.
Our findings are consistent with, yet extend, prior research by providing stronger evidence that BMI-GC transitions are associated with overweight risk(Reference Ekelund, Ong and Linné14,Reference De Oliveira, Araujo and Severo23) . By utilising multiple BMI measurements over time, our study provides a more nuanced understanding of how subtle changes in growth patterns can indicate long-term nutritional risks. Previous studies have primarily focused on excessive weight, highlighting extreme growth patterns such as high birth weight or persistent overweight as predictors of later cardiometabolic outcomes(Reference Oluwagbemigun, Buyken and Alexy26,Reference Lin, Rankin and Mcdonald38,Reference Robinson, Dam and Hassan39) . In contrast, our study addresses a critical gap by demonstrating that downward BMI-GC transitions are associated with increased odds of underweight and that children and adolescents with NW can also face elevated odds of overweight or underweight if they experience upward or downward BMI-GC transitions over time. These findings suggest that deviations from expected growth channels may reflect distinct underlying processes. Specifically, upward transitions may reflect sustained positive energy balance and changes in dietary and physical activity patterns, whereas downward transitions may reflect nutritional deprivation, illness or broader socio-economic constraints.
Participants classified in the Fluctuating group – those crossing both upward and downward boundaries – may reflect greater instability in growth patterns over time. This pattern could be influenced by factors such as changes in nutritional environment, intermittent food insecurity, illness or behavioural and lifestyle variability, which may disrupt the maintenance of a stable growth channel. Such instability may represent a distinct risk profile that warrants further investigation, consistent with the importance of early recognition of growth deviations in paediatric populations(Reference Haymond, Kappelgaard and Czernichow40).
In a broader public health context, early identification of BMI-GC transitions is relevant in light of the growing global concern over the DBM(Reference Popkin, Corvalan and Grummer-Strawn4). However, the expression of DBM differs across contexts. In our study, this dual burden was primarily observed in the low- and middle-income countries included (Ethiopia, India, Peru and Vietnam), where populations experience both underweight and overweight simultaneously. In contrast, in the US cohort, the burden was predominantly driven by overweight. While overweight and obesity in adulthood are strongly associated with an increased risk of non-communicable diseases such as diabetes, hypertension and cardiovascular conditions, underweight also poses significant health risks, including weakened immune function, delayed development and adverse pregnancy outcomes such as maternal mortality, delivery complications, preterm birth and intrauterine growth restriction(Reference Kotsis, Jordan and Micic41–44).
These findings have significant clinical implications. For paediatricians and healthcare professionals, they suggest the need to focus more on growth trajectories over time, rather than simply on weight status at single time points. Even small upward or downward shifts in BMI-GC, within the NW range, may signal early nutritional risks(Reference De Oliveira, Araujo and Severo23). Crucially, our analysis of the normal weight subsample demonstrates that these transitions serve as early biomarkers of risk even before a child reaches clinical thresholds for overweight or underweight. Integrating longitudinal growth monitoring into routine paediatric care would enable clinicians to identify children at risk and intervene with target guidance on nutrition, physical activity and psychosocial support before these patterns solidify into long-term health outcomes(Reference Norris, Frongillo and Black45). The proactive identification of BMI-GC transitions – rather than waiting for a change in BMI category – offers a critical window for primary prevention.
This study has numerous strengths that contribute to a deeper understanding of how BMI-GC transitions during childhood and adolescence are associated with the DBM in young adulthood. First, it assessed both upward and downward BMI-GC transitions, capturing the full spectrum of growth deviations rather than focusing solely on excess weight gain. Second, the study leveraged two large, high-quality datasets from diverse socio-economic settings – including low- to middle-income countries (Ethiopia, India, Peru and Vietnam) and a high-income country (the USA) – characterised by robust data quality, racial and ethnic diversity, carefully designed sampling strategies and minimal implausible values(Reference Barnett, Ariana and Petrou29,Reference Michael and Pergamit30) . Third, BMI-GC were operationalised using multiple BMI data points collected across key developmental periods, providing a dynamic, longitudinal view of growth rather than relying on single timepoint measures. This approach allowed the identification of subtle shifts in BMI trajectories, thus offering new insights into early predictors of long-term nutritional risk.
Despite these strengths, this study also presents some limitations that should be considered. First, like many longitudinal studies, it was affected by missing data and loss to follow-up(Reference Laird46,Reference Hughes, Heron and Sterne47) . We did not impute missing BMI values at the final assessment, as this was our primary outcome and imputing outcome variables is generally discouraged due to the risk of bias and reduced validity(Reference Hughes, Heron and Sterne47). Additionally, we chose not to impute missing exposure data because our analysis focused on BMI-GC transitions – non-linear and individualised trajectories that are not adequately captured through imputation, which would estimate expected values and potentially mask deviations(Reference Hughes, Heron and Sterne47).
Another limitation relates to the use of self-reported anthropometric data in the NLSY97 cohort. Although widely used in large-scale epidemiological studies, self-reported measures can be prone to reporting bias, particularly underreporting of weight or overreporting of height(Reference Van Dyke, Drinkwater and Rachele48). Such bias may lead to underestimation of BMI, potentially influencing BMI-GC classification and the estimation of overweight outcomes in young adulthood. However, as this misclassification is likely to be non-differential with respect to BMI-GC patterns, it would be expected to attenuate observed associations rather than inflate them. These factors may introduce some degree of measurement error, which should be considered when interpreting the results.
In summary, this study highlights the importance of BMI-GC in weight status assessments, providing a deeper understanding of growth trajectories and emphasising the need to look beyond BMI categories to evaluate long-term nutritional risks. These findings also underscore that the relevance of the DBM framework varies across contexts and should be interpreted in light of differing epidemiological profiles, reflecting the uneven distribution of malnutrition globally – where underweight remains more common in low- and middle-income countries(Reference Popkin, Corvalan and Grummer-Strawn4). Future research should continue exploring the implications of BMI-GC transitions in diverse populations, and policies aimed at early prevention should consider not only static weight categories but also the dynamic nature of individual BMI-GC trajectories.
Supplementary material
For supplementary material/s referred to in this article, please visit https://doi.org/10.1017/S0007114526107521.
Acknowledgements
The authors are grateful to all participants and research teams involved in the Young Lives study, coordinated by the University of Oxford in partnership with national research institutions in Ethiopia, India, Peru and Vietnam, and in the National Longitudinal Survey of Youth 1997 (NLSY97), conducted by the US Bureau of Labor Statistics. They acknowledge their efforts in data collection, management and ethical oversight, which made this research possible.
No funding was secured for this study.
M. H. D. O.: Conceptualisation, Methodology, Formal analysis, Investigation, Data curation, Writing – original draft, Writing – review and editing, Visualisation. I. K. S. d. S.: Writing – original draft, Writing – review and editing. C. M. d. S. M.: Writing – original draft, Writing – review and editing. R. F. d. C.: Writing – review and editing. W. L. C.: Methodology, Formal analysis, Writing – review and editing. K. D.: Conceptualisation, Methodology, Formal analysis, Writing – review and editing, Supervision, Project administration.
The authors report no conflicts of interest.


 Open access

