

The need for a ‘real life’ experimental test of front-of-pack nutrition label performance
A considerable body of research on front-of-pack (FOP) nutritional labelling has appeared in Public Health Nutrition over the last five years( Reference Campos, Doxey and Hammond 1 – Reference Lachat and Tseng 8 ). In the editorial of a recent issue (volume 16, issue 3) devoted to this topic, Lachat and Tseng noted that the majority of extant research on FOP label systems consisted of reviews and empirical research exercises that were primarily developmental in nature( Reference Lachat and Tseng 8 ). They noted that research that actually tested whether any of the developed and established FOP formats had any significant impact on consumer choice was much rarer, and what little research of this type there was did not present conclusive evidence that any of these systems actually worked. In light of moves towards making these established systems universal (compulsory), these authors argued that direct measurement of their performance before this occurred was becoming an urgent requirement( Reference Lachat and Tseng 8 ).
Discussion relating to the compulsory introduction of FOP systems in the UK, USA and Australasia has lent real urgency to this requirement for performance testing( Reference Lachat and Tseng 8 ), as the imposition of an untested and potentially ineffective FOP nutritional system would be undesirable for three major reasons:
-
1. positive health outcomes for the general population would not occur, and negative outcomes might be possible, if a system had an unintended endorsement effect on products that carried it;
-
2. considerable costs would be imposed on the food industry and the population at large in return for no identifiable benefit; and
-
3. an ineffective, but incumbent system would represent a considerable obstacle to the deployment of any effective system that might be developed and tested subsequently.
Since Lachat and Tseng’s call for performance testing of FOP nutritional labels, three relevant articles have appeared. The first is a comprehensive review of the FOP nutritional label research literature by Van Kleef and Dagevos( Reference Van and Dagevos 9 ) who place all of the major FOP nutritional label types upon a single continuum based on the nature of the information presented. At one extreme of this continuum the label presents pure factual information, with no opinion/recommendation, while at the other extreme, the label presents pure opinion/recommendation with no factual information whatsoever (Fig. 1). The authors point out that this wide continuum of label types requires an equally wide range of different evaluation responses from the consumer, ranging from highly detailed examination and highly structured reasoning at one extreme to cursory examination and non-cognitive trust-based heuristics at the other. No firm conclusions were drawn as to whether these FOP labels have any consistent and significant impact on consumer evaluation and choice.
(colour online) The fact–recommendation continuum in front-of-pack nutrition label formats

The second article is a review by Andrews et al. of the research literature on FOP labelling with the specific purpose of establishing research priorities in order to inform policy development by the US Food and Drug Administration( Reference Andrews, Chung-Tung and Levy 10 ). The article concludes with six priorities for research that could usefully inform the Food and Drug Administration’s policy. Of these six, the first four and the sixth require controlled field testing of FOP cues.
The third article, by Newman et al., is an empirical test of the impact of FOP nutritional labels on consumer behaviour( Reference Newman, Howlett and Burton 11 ). These authors also note the degree of functional variation within the FOP label formats. Unlike Van Kleef and Dagevos, they identify this variation as a dichotomy, not a continuum, describing information-based nutritional labels as ‘reductive’ and recommendation-based nutritional labels as ‘evaluative’. This dichotomous system is also used by Andrews et al., who describe traffic light labels as reductive, even though the interpretation of colour as a proxy for nutritional status can be considered to be an evaluative process with the potential for differing evaluations of the same cue by different consumers. Newman et al. did not consider the possibility of hybrid types, which may well reflect the relative dominance of the reductive ‘recommended/percentage daily intake’ (RDI/PDI) formats in North America, as opposed to the hybrid ‘traffic light label’ (TLL) formats which have a significant presence in Europe.
When the ‘European’ continuum described by Van Kleef and Dagevos is anchored at each end with the ‘American’ dichotomy described by Newman et al., the result is a consolidated scale that can be used to reliably position all the significant existing FOP label types relative to one another on the basis of how they require consumers to process the information that they contain (Fig. 1). The authors propose that the use of this single ‘global’ scale/typology would at the very least relieve some of the current confusion by providing a common context for any absolute and relative performance tests of FOP labels.
The research undertaken by Newman et al. was not conclusive with regard to the effectiveness of the FOP labels that they investigated. The situation with regard to the ‘real life’ controlled testing of FOP labels’ performance thus remains largely as Lachat and Tseng described it – with their recommendations as yet unaddressed.
Conducting a ‘real life’ experimental test of front-of-pack nutrition label performance
All the sources above conclude that there is an urgent need for ‘real life’ experimental intervention testing of these label types. It would appear that these authors understand ‘real life’ to involve using real consumers in real stores as the experimental population, various levels/treatments of the established FOP nutritional label types as the independent variable and the number of real unit purchases of the products carrying the FOP label treatments over a specified time period as the dependent variable. Likewise their use of the term ‘experimental intervention’ indicates that these results must be generated under at least partially controlled conditions, thus differentiating them from the results of ‘real life’ but uncontrolled scanner-based research observations that they cite in their reviews. The distinction here is not between experimentation and observation, but between observations in a fully controlled but artificial environment, observations in an uncontrolled but ‘real’ environment (both of which are already available albeit in restricted amounts) and observations in a ‘real’ but partially controlled environment – of which no examples exist in the literature at present.
These authors also conclude that such studies present major challenges in their administration. However, as there is but one ‘real life’ dependent variable (unit sales) to be considered, the simpler approaches that characterised early research on food consumer behaviour can be effectively redeployed in this specific role( Reference Hamlin 12 ). A great deal of this early research involved the application of classical agricultural experimental techniques to direct controlled manipulations in ‘real life’ environments and the use of actual purchases as the single dependent variable in the field( Reference Brunk and Federer 13 , Reference Banks 14 ).
In order to meet the requirements of a ‘real life’ test, an experimental design would have to measure the effects on sales of various treatments of the FOP nutritional labels, while controlling for the effects of unavoidable variations in consumers, purchase environments and products that carried the FOP labels. It would also have to be highly efficient in order to minimise costs, environmental disruption, environmental/consumer variations and history effects. Moreover it would have to be unobtrusive, as purchase awareness of the manipulations could lead to behavioural bias. A good, if elderly, example of work of this type ‘real life’ experimental research is given by Cox’s article on consumer response to shelving manipulations in supermarkets( Reference Cox 15 ).
Figure 2 shows an experimental design that meets all of these criteria in order to effectively test the impact of three nutritional FOP label types (informational, evaluative and hybrid) on actual consumer purchases of breakfast cereals over a one-month period. This design is a fractionally replicated Latin square after Youden and Hunter( Reference Hamlin 12 , Reference Youden and Hunter 16 ). This design requires that the variations in the store environments and products are kept to the lowest level that is possible, as they are, then this will yield a ‘real life experimental’ measurement of the impact of these FOP nutritional cues on actual unit sales of the products concerned.
Field experimental set-up to measure the impact of three front-of-pack (FOP) nutritional label types (TLL, traffic light label; PDI, percentage daily intake) on consumer purchase of cornflakes (cold breakfast cereal). *Fractional replication treatments are shown in bold: one each of each treatment, row and column. Dependent variable for each cell=percentage of unit sales in store over one-month period (represented by total unit sales in row)

The results will have internal validity for any main effects if the Youden and Hunter test for non-additivity shows no significant result for interaction. The two extraneous variables (retail environment and product) must also be kept as homogeneous as possible in order to ensure that interactions between the independent and two extraneous variables do not occur. With unit sales per cell as the dependent variable, the design produces a result in the form of the deviation of the cell averages of the rows (stores), columns (products) and each of the four treatments (FOP labels) from the overall average for all cells. The statistical analysis of the data to check for the reliability of these deviations is exceedingly simple. It involves an adjusted ANOVA after Youden and Hunter, followed by a comparison of multiple means test by Scheffé( Reference Allbright 17 ), and can be easily set up in a Microsoft® Excel spreadsheet.
The technical obstacles to running a ‘real life experimental intervention’ are thus not insurmountable. However, two formidable practical obstacles still remain. The first of these is industry cooperation. Running this experiment would require at least the permission of the owners of the four branded products concerned, and might also require them to undertake expensive short product manufacturing runs to produce the four versions of each product required. Retailer permission for each of the five sites would be required, and might also involve temporary reorganisation of the category concerned to create a consistent product shelving ‘planagram’ so that the products are placed consistently relative to one another at each site. Point-of-sale promotions in the category during the course of the experiment would also have to be suppressed unless they occurred simultaneously at all sites. Retailer cooperation would also be required for the collection and release of the necessary sales data.
The second obstacle is expense. The incremental costs of short-run printing and packing, specific product stacking and compensation for category planagram changes and promotion suppression are likely to generate costs that run into the tens of thousands of dollars for each experimental ‘run’. A full experimental exercise involving several replications would thus involve a hefty six-figure investment. Such sums are usually only available via major independent research grant awarding bodies or directly from government agencies.
Piloting a real-life experimental test of front-of-pack nutrition label performance
It is highly unlikely that the necessary levels of either cooperation or funding would be forthcoming in response to a proposal to apply this methodology at ‘full scale’ from the outset. However, piloting the methodology on a small scale using purchase intent rather than unit sales as a dependent variable, and then progressively ‘stepping up’ to the full scale version as the capacity of the methodology to produce reliable and useful results was demonstrated, would be a route to eventually achieving this. The remainder of the present paper describes an initial pilot exercise/demonstration of this methodology and its outcomes.
Methods
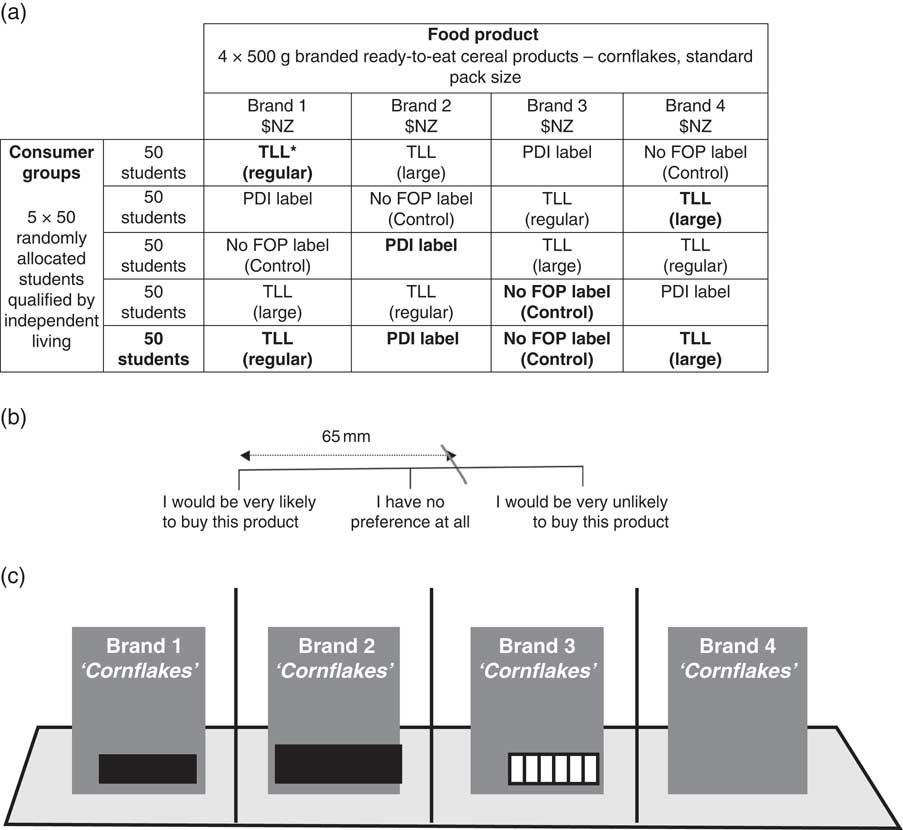
The design used for the current pilot studyFootnote * is a 4×5 partially replicated Latin square with FOP nutritional labels, cereal products and consumer groups as the independent variables (Fig. 3). It is structurally identical to that of the full-scale exercise shown in Fig. 2. The four treatments of the FOP nutritional label were also similar to the full-scale exercise. They were: (i) a PDI system currently used in New Zealand by Nestlé sized at 1·7 % of the prime face; (ii) a generic TLL system of the same size; (iii) a larger version of the generic TLL sized at 3·0 % of the prime face; and (iv) a control condition without any nutritional label on the front of the packFootnote † (Fig. 4). As there is no equivalent of the fully evaluative ‘smart choice’ FOP nutritional label type in New Zealand, this was replaced by the larger TLL label.
Pilot experimental methodology. (a) Experimental design (FOP, front-of-pack; TLL, traffic light label; PDI, percentage of daily intake). *Fractional replication treatments are shown in bold: one each of each treatment, row and column. (b) Dependent variable: one 1–100 mm strikethrough scale for each product/label combination evaluated. Response coded by distance in millimetres from the left. (c) Pictorial representation of experiment as seen by a respondent in consumer group 1 (nutritional labels not to scale)
(colour online) Levels of the cue treatment (actual size) showing panels for a nutritionally ‘poor’ (top row) and a nutritionally ‘good’ (bottom row) cereal product. Sucrose content is the primary discriminating factor

The four food products used were all boxed ready-to-eat adult breakfast cereals of similar size, type and format. This type of breakfast cereals was selected as it is a regularly purchased item and the products were large enough to incorporate the cues at the maximum commonly used size. All four were established brands that sold in significant volumes in the New Zealand market.
As real branded food products were used in this research, the FOP nutritional labels that were applied to them had to accurately reflect the nutritional value of the contents. Very large manipulations of the FOP labels were therefore not possible, but this does reflect the reality in most food categories containing broadly similar food products. Breakfast cereals were selected as they are a commonly consumed product that has a wide variation of one dietary input (sucrose) within the category. There is also a high consumer awareness of this variation( Reference Harris, Schwartz and Ustjanauskas 18 ). The four cereal products were selected so that they were similar in nature and target market. Two were nutritionally ‘good’ and two were nutritionally ‘poor’ with regard to their sugar (sucrose) content. The FOP nutritional labels on each product were adjusted to match the nutritional status of the product on which they appeared either by direct entry of the relevant nutritional values into the label (PDI system) or in accordance with international guidelines (TLL system) to conform to the status of each product (Fig. 4)( 19 ). The purchase price of each product was displayed on each product in the dominant local retailer’s standard format.
The customers who would have purchased at the five supermarket sites were replaced by five groups of fifty students recruited by intercept, prequalified for independent living and then randomly allocated to one of five groups. This student sample was not chosen for its convenience, but for its consistency and tight demographic profile, which could not be matched by supermarket exit intercept. The sample was 62 % female, 95 % were within the ages of 18 and 25 years, and 100 % were in resident in New Zealand and participating in tertiary education. The intention was to use this tight group as an initial sample and to then attempt to replicate/upscale the research using multiple replications of this exercise based on samples that were field intercepted at supermarkets.
The dependent variable of the full-scale experiment (actual sales from each site over one month) was replaced by a self-reported measure of each consumer’s intention to purchase each of the four products that he/she was exposed to. No other data or comment was directly collected from them. The acquisition of this metric can best be understood by considering row 1 of the layout shown in Fig. 3(a), the example of the consumer response instrument shown in Fig. 3(b) and the pictorial representation of the experimental set-up itself, shown in Fig. 3(c).
A member of consumer group 1 would be given a one-sheet response form containing four of the 0–100 mm strikethrough scales shown in Fig. 3(b), labelled 1–4, and he/she would be briefed in its use. He/she would then be shown to a table on which were placed the four product/nutritional label combinations shown in row 1. These were also numbered 1–4 and each was separated from the next by a partition. These product/label combinations were all commercial-grade mock-ups of the four cue vehicle packages displaying one of the four levels of the label treatment as specified in the layout of row 1. All carried a price tag showing the price for that product as charged at the local supermarket the previous day. The participant would then be asked to evaluate his/her likelihood of purchase for all four products using one strikethrough scale for each product. Each participant took between 20 and 40 s to complete all four evaluations. The research was conducted over a single 5 h session by intercept on the university campus.
The respondents were not told of the purpose of the research, and they could not deduce it either due to the multiple levels of several cues presented by the products. This is a technique of open concealment known as confounding. This confounding meant that the presence of any prompted consumer response to the FOP label treatments could be discounted. The presentation of the nutritional labels on products as an integrated object of evaluation meant that the consumer evaluations acquired were of the product with the label systems in place, rather than of the nutritional labels in isolation, and were thus a direct measure of their influence on purchase intent performance.
Results
The results of the research are summarised in Table 1 and Fig. 5. The initial ANOVA of the 5×4 partially replicated Latin square data set indicated that there was no significant interaction between any of the independent variables (Table 1). The ANOVA was then re-run and the treatment averages calculated on the 4×4 data set with an acceptable degree of confidence that the results would not be distorted by any interaction. This analysis showed significance for the four products at P<0·01 and for the nutritional labels at P<0·05. There were no significant differences between the five consumer groups.
Results: treatment means and confidence limits for deviation in purchase intention from the overall experimental population for the FOP nutritional label treatments (![]() ) and cereal products (
) and cereal products (![]() ).
). ![]() represents the common confidence limit for differences between means at the 5 % level, P 0·05=3·11; P 0·01=3·83. FOP, front-of-pack; PDI, percentage daily intake; TLL, traffic light label; Control, no FOP label
represents the common confidence limit for differences between means at the 5 % level, P 0·05=3·11; P 0·01=3·83. FOP, front-of-pack; PDI, percentage daily intake; TLL, traffic light label; Control, no FOP label

Results: ANOVA table of the 5×4 partially replicated Latin square data set

*Significant at the 5 % level (F=5·42); **significant at the 1 % level (F=3·29).
All three nutritional label formats showed a main effect in the form of a substantial and positive deviation in purchase intent from the control (no label) condition (Fig. 5). This indicates that the nutritional labels, when present, were seen and processed by the consumer groups as part of their evaluation of the products. All three FOP nutritional label formats show remarkably consistent positive deviations in purchase intent from the control condition, and no significant deviations from each other, indicating that the presentation format (TLL v. PDI) and size of the labels (3·0 % TLL v. 1·7 % TLL) made no significant difference to a consumer purchase intentions towards the products when a nutritional label was present.
Discussion
If the FOP nutritional labels were not being used at all by consumers as part of their product evaluation, then one would expect to observe no main or interaction effects for them when they were manipulated. If the FOP nutritional labels, and the information that they presented, were being used by consumers to differentiate between the products in the cognitive manner expected by their backers, then one would expect to see a significant interaction effect between the cereal products and the FOP nutritional labels when the latter were manipulated and consequently no significant main effects for the FOP nutritional label.
The presence of large consistent main effects for the FOP nutritional labels and the lack of any interaction between products and nutritional labels represent a significant departure from either of these theoretical expectations. The expected product×FOP label interaction effect resulting from a successful deployment of the labels would be caused by the consumers attending to the labels, cognitively processing the varying nutritional states expressed by them and then responding differentially to the individual product/FOP nutritional label combinations. This would have the effect of stimulating purchase intent for the two ‘good’ products and suppressing it for the two nutritionally ‘poor’ products when the FOP labels were present relative to when they were absent. This interaction effect would, at the very least, completely mask the main effects of the nutritional labels in the ANOVA table. It could, however, be plotted graphically and analysed visually.
The observed result indicates that this consumer sample reacted consistently and positively to all the types and sizes of FOP nutritional information label used, but that this strong positive reaction was not significantly moderated by the actual nutritional status of the product as communicated by these FOP labels. This result is not consistent with the nutritional labels that were tested either not having an impact at all, or with them having an impact on the basis of cognitive evaluation of the product according to the nutritional information presented by the FOP label.
As the experiment was conducted under controlled conditions, it is possible to assert with a very high degree of confidence, for this sample at least, that the FOP nutritional labels of both the TLL and PDI types did have a statistically significant and positive main effect on consumer purchase intent on cereal products. It is thus possible to deduce that the consumer sample, without prompting, consistently paid attention to the labels and subsequently used them as part of their product evaluation processes. However, the results clearly show that the sample used the FOP labels as a uniformly positive indicator of product desirability. Therefore, the actual nutritional status of the product as expressed by these labels did not have any impact at all upon the sample’s evaluation processes.
As the achievement of significant consumer product discrimination on the basis of the products’ nutritional status expressed by them forms the primary purpose of these FOP labels, this result represents a complete functional failure of these FOP nutritional label systems under these specific controlled conditions.
Communication and education campaigns may cause consumers’ behaviours towards these two label systems to change, but the effort and expense may be enormous and the eventual outcomes of it in terms public cost/benefits are uncertain. It must also be borne in mind that such efforts would have to be undertaken within a retail environment that is characterised by very large commercial marketing budgets. These budgets are wholly dedicated to supporting and promoting numerous commercial brand cues (e.g. Kellogg’s) that are without exception wholly evaluative in nature (Fig. 1). The non-cognitive consumer behaviours that are associated with these evaluative cues and that are also strongly and skilfully promoted by their supporting communications differ profoundly from the cognitive processes that are necessary to support the reductive and hybrid FOP nutritional labels tested here. The retail food environment could thus be described as ‘passively hostile’ at best with regard to any efforts that might be made to promote them.
However, if the TLL and PDI formats do fail in further research tests, then all is not lost. FOP nutrition labels that do conform to established evaluative commercial communication practices and their related non-cognitive consumer response processes are available. The term ‘Organic’ and the ‘Heart Foundation Tick’ and ‘Smart Choices’ logo are all examples of fully evaluative cue systems that are currently used to express the nutritional status of the food products that carry them without the need for further cognitive consumer evaluation. These marks, as long as they are calibrated to accurately reflect the nutritional status of the product to which they are affixed, may well offer a viable alternative avenue of development.
Limitations and further research
While the current research represents one of the most direct and aggressive tests of these two dominant FOP nutritional label types to appear in the literature up to this point, it was conceived as a pilot study and as an initial step of a process of research development that would eventually deliver more decisive outcomes based on ‘real life’ sales. As a result, it does have several limitations that will be addressed by further development.
-
1. This research involved a single student sample. One obvious next move will be to replicate it. Direct replication exercises (three replications) based on comparable student samples have been organised and funded in New Zealand and Ireland and will take place in 2014/2015. One change from the research described here is that the technical issues associated with the incorporation of a fully evaluative FOP nutritional label (e.g. Smart Choices) into this design have now been resolved, and a mark of this type would be included in all further research exercises instead of the larger (3 %) TLL label treatment.
-
2. While students can act as a perfectly adequate basis for fundamental consumer decision work of this nature, there is no doubt that research based on consumer samples drawn from retail sites will carry more weight in any debate around the efficacy of these labels. For this reason, a second set of five direct replication exercises involving samples recruited on exit from local supermarkets has now been funded by a grant from the University of Otago and will be conducted in late 2014. As these samples will not only be closer to the market, but also considerably more demographically diverse than their student equivalents, one of the major objectives is to test the robustness and stability of the research results within such conditions. At least one matching set of replications from a second country would also be highly desirable and is being negotiated for one location.
-
3. If these replications deliver a stable result, then the next development would be to test the method’s robustness to samples recruited from multiple retail sites. Such work would still retain the attitudinal measure as the dependent variable, but the use of multiple retail sites would mean that the research would in all other aspects be equivalent to the ‘real life’ sales-based research shown in Fig. 2. Multiple replications of this work would be required and preferably would be conducted in several countries. If a stable result could be achieved at that point, then acquiring the third-party funds and industry cooperation necessary to achieve a final upgrade of the research to the decisive sales-based format shown in Fig. 2 would be a feasible proposition.
-
4. This research could deliver a definitive result for one food category (breakfast cereals) by this stage. At that point research into other food categories could be developed along similar lines.
The authors would be pleased to correspond with researchers in any location who would be willing to participate in all stages of this development programme.
Conclusions
Of the two FOP nutritional labelling formats tested here, one was a fully reductive type and one was a hybrid type (Fig. 1). An evaluative type was not included as one was not available in New Zealand, and there were also technical issues associated with its incorporation into the design at the time. Both the types tested require a consumer response to them that is based upon a significant level of cognitive processing in order to be effective. These research results suggest that in this instance at least, higher-level processing does not occur. The outcome is a failure born of a highly destructive mismatch between the complex mechanics of the label systems themselves and the simple non-cognitive mechanisms via which they are actually processed by the consumers with whom they are supposed to be communicating.
It would thus appear that the misgivings with regard to the performance of these two FOP nutritional label formats expressed by Hawley et al.( Reference Hawley, Bragg and Liu 2 ), Lachat and Tseng( Reference Lachat and Tseng 8 ) and others may be well founded. Their recommendation that further research is needed to test the performance of these labels in their current form, and that of potentially more effective alternatives to them, before any move to compulsory introduction is made is also supported.
Acknowledgements
Acknowledgements: The researchers would like to thank the University of Otago Ethics Committee and the anonymous reviewers whose comments contributed greatly to the development of this manuscript. Financial support: This research received no specific grant from any funding agency in the public, commercial or not-for-profit sectors. Conflict of interest: None. Authorship: R.P.H. provided the methodology for the research and contributed to writing the article. L.S.M. contributed to writing the article, undertook background research and assisted in the administration of the research. All authors contributed to the formulation of the research propositions. V.M. undertook background research and assisted with research administration. Ethics of human subject participation: This study was conducted according to the guidelines laid down in the Declaration of Helsinki and all procedures relating to human subjects were approved by the University of Otago under the ‘Category B’ ethical approval regulations. Verbal consent was witnessed and recorded.


