

Introduction
Glaciers are an important indicator of global climate change, and additionally have important roles in various feedbacks and amplifications associated with climate change (Reference Cheng and ChengCheng, 1996; Reference Allison, Barry and GoodisonAllison and others, 2001; Reference Parry, Canziani, Palutikof, Van der Linden and HansonParry and others, 2007). According to the Fourth Assessment Report (AR4) of the Intergovernmental Panel on Climate Change (Reference Parry, Canziani, Palutikof, Van der Linden and HansonParry and others, 2007), over the past 100 years (1906–2005) global average surface temperature has increased by 0.74°C. Against the background of global warming, sea-level rise, water security problems, other natural disaster risks, permafrost carbon emissions and other environmental problems caused by the retreat of the cryosphere have had a serious impact on socio-economic development, arousing worldwide concern (Reference Haeberli and BenistonHaeberli and Beniston, 1998; Reference Richardson and ReynoldsRichardson and Reynolds, 2000).
The Himalaya possess a huge snow and ice resource that constitutes an important freshwater source for countries in this region. This water resource has a high impact on the water balance and agricultural irrigation in the arid and semi-arid areas of China (Reference Walter, O’Neel, McNamara, Pfeffer, Bassis and FrickerWalter and others, 2010; Reference YaoYao and others, 2012). Previous studies have shown that the Himalayan glaciers are retreating and thinning (Reference Jin, Xin, Che, Wu and MoolJin and others, 2005; Reference Ren, Jing, Pu and QinRen and others, 2006; Reference KulkarniKulkarni and others, 2007; Reference Bajracharya and MoolBajracharya and Mool, 2009; Reference Nie, Zhang, Liu and ZhangNie and others, 2010; Reference Bolch, Pieczonka and BennBolch and others, 2011, Reference Bolch2012; Reference Fujita and NuimuraFujita and Naimura, 2011). Due to the remote location and wide spatial distribution of these glaciers, monitoring their changes has been difficult (Reference Frey, Paul and StrozziFrey and others, 2012; Reference YaoYao and others, 2012).
The lack of sufficient numbers of in situ measurements has led to recent controversy about future Himalayan glacier change in AR4 (Reference Parry, Canziani, Palutikof, Van der Linden and HansonParry and others, 2007). An additional problem is that mass balances of glacier resources in the Himalaya derived from in situ observation and from the Gravity Recovery and Climate Experiment (GRACE) are inconsistent or even conflicting (Reference Fujita and NuimuraFujita and Naimura, 2011; Reference Kargel, Cogley, Leonard, Haritashya and ByersKargel and others, 2011; Reference Jacob, Wahr, Pfeffer and SwensonJacob and others, 2012; Reference Jacob, Wahr, Pfeffer and SwensonYao and others, 2012). Errors also arise from the fact that researchers use different measurements and techniques to estimate glacier mass loss (Jacob and others, 2012; Reference GardnerGardner and others, 2013). Consequently, glacier change is perhaps more uncertain in the Himalaya than elsewhere in the world.
Many Himalayan glaciers have extensive supraglacial debris covers in their ablation zones, which impact upon both rates and spatial patterns of melting. Debris-covered areas show considerable lowering rates that vary significantly over short spatial scales and that depend on local slope and the existence of glacial lakes (Reference Nuimura, Fujita, Yamaguchi and SharmaNuimura and others, 2012). Reference Scherler, Bookhagen and StreckerScherler and others (2011) believe that supraglacial debris cover affects the terminus dynamics and modifies glacier response to climate change. The mass loss of supraglacial debris cover occurs by melting of clean ice, glacier fragmentation, backwasting and downwasting of surface debris and calving into deep proglacial lakes (Reference Han, Ding and LiuHan and others, 2006, Reference Han, Wang, Wei and Liu2010; Reference SchomackerSchomacker, 2008; Reference BennBenn and others, 2012). However, a study of debris-covered glaciers in the Hindu Kush showed that thinning of debris-covered ice is not statistically different from that of clean ice (Reference Kääb, Berthier, Nuth, Gardelle and ArnaudKääb and others, 2012). Glacier variation in the Himalaya will increase the risk of glacier lake outburst floods and contributes to sea-level rise (Reference Bajracharya and MoolBajracharya and Mool, 2009; Reference BennBenn and others, 2012).
In this work, we use topographic maps and satellite imagery from Landsat Multispectral Scanner/Thematic Mapper/Enhanced Thematic Mapper Plus (MSS/TM/ETM+) to investigate glacier changes and document the similarities and differences between the north and south sides of Himalayan regions of the Koshi River area during 1976, 2000 and 2009/10.
Study Site
Koshi River is located in southern Tibet, central Himalaya, at 268470-298120 N, 858220-888210 E. It originates in the Himalayan region of China (north side of the Himalaya (NSH)) and flows into Nepal and India (south side of the Himalaya (SSH)). Its drainage area is ~71500 km2. Of this area, 28 500 km2 is located in Tibet, 31,600 km2 is located in Nepal, and 11400 km2 is located in India. Glaciers are distributed in those parts of the river basin located in China and Nepal (Fig. 1), where there are three major tributaries: Sunkosi River, Arum River (Pumqu River in China) and Tamor River. The basin areas of Sunkosi River and Arum River are 36 000 and 19 000 km2, respectively. Several peaks above 8000 ma.s.l. (e.g. Qomolangma (Mount Everest; 8844 m), Cho Oyu (8201 m) and Lhotse (8501 m)) are in the catchment of the Koshi River. Large glaciers and also glacial lakes are found in the study area.
Glacier distribution in the Koshi River basin (background derived from global digital elevation model (GDEM)).
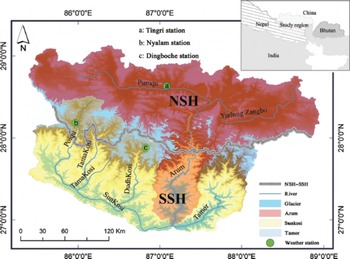
The Himalaya separate the regional climate into two distinct categories located on the north and south sides. The south side is subject to the Indian Ocean monsoon and the Pacific Ocean southeast monsoon and is thus characterized by a pronounced summer rainfall maximum and has a maritime climate. The north side is mainly affected by the Himalaya and has a typical plateau, i.e. continental, climate.
Records from two weather stations, Tingri station (28.63330 N, 87.08330 E) and Nyalam station (28.18330 N, 85.96670 E), show that mean temperature and precipitation at these locations from 1976 to 2006 were 3.0°C and 286.3 mm, and 3.8°C and 658.8 mm, respectively (Fig. 1). Records from Dingboche station (27.890 N, 86.830 E; 4355ma.s.l.) on SSH show an annual average temperature of-0.3°C and an annual average precipitation of ~500 mm during the 1988-2008 period (Reference RajchalRajchal, 2006; Reference Salerno, Buraschi, Bruccoleri, Tartari and SmiragliaSalerno and others, 2008; Reference WangWang, 2013). The elevation difference leads to decreasing precipitation as altitude increases. For example, the annual average precipitation at Namche Bazar station (27.830N, 86.720E; 3450ma.s.l.) on SSH is -1000 mm, which is more than at Dingboche station. The precipitation on SSH is more than on NSH, leading to a lower snowline on SSH (5500 m) than on NSH (6000 m).
Data and Methods
Topographic maps and remote-sensing images
Our study uses 39 topographic maps at scales of 1 :50000 and 1 : 100 000. These maps were derived from aerial photographs acquired between 1971 and 1980 by the Chinese military geodetic service. They were scanned, georeferenced and rectified with a kilometer grid. The map coordinates were expressed using the Albers conic equal-area projection. Glacier outlines, digitized using ArcMap software, formed the basic reference data for changes in the Koshi River glaciers. Glaciers in Nepal are documented in the Nepal glacier inventory (Reference Mool, Bajracharya and JoshiMool and others, 2001), derived from topographic maps of India and Nepal between the 1960s and 1980s. However, the period covered by the topographic maps is almost 20 years, rather than the short period of a few years that would allow glacier reference data of nearly the same time to be produced; in addition, the topographic maps information was missed. Our study also uses four Landsat MSS images acquired in 1976 and 1977 which cover a period of <1 month (Table 1), to generate a reference inventory of glaciers in Nepal that fall within the Koshi River basin by manual delineation.
Overview of the satellite image data sources applied
We also use six Landsat ETM+ scenes with 1 5m resolution acquired in 2000, and Landsat TM data with 30 m resolution acquired in 2009/10, to monitor glacier extent in 2000 and 2009/10. Unfortunately, it was difficult to select available images in 2009/10 due to the snow cover in Koshi River, especially on SSH. Therefore, our study uses several Landsat ETM+ scan-line corrector off (SLC OFF) data with 15 m resolution, acquired in 2009 (Table 1), as supplementary data to check the glacier extent covered by snow in 2009. This work will help reduce the glacier extent errors caused by snow. Landsat images are provided by the US Geological Survey (USGS; http://glovis.usgs.gov" and the Global Land Cover Facility. The image data were orthorectified or rectified using the Universal Transverse Mercator (UTM) coordinate system referenced to the World Geodetic System 1984 ellipsoidal elevation (WGS84). All images were subsequently reprojected in the Albers conic equal-area projection to be consistent with the topographic maps described previously.
Currently, different criteria can be used to extract glacier boundaries from satellite images, such as those based on spectral ratio (band4/band5, band3/band5, normalized-difference snow index (NDSI)), supervised classification and unsupervised classification (Reference Li, Sun and ZengLi and others, 1998; Reference PaulPaul and others, 2000, Reference Paul, Kääb, Maisch, Kellenberger and Haeberli2002; Reference Zhang, Su, T. Li and ZhongZhang and others, 2001). Furthermore, Advanced Spaceborne Thermal Emission and Reflection Radiometer (ASTER) imagery combined with digital elevation model (DEM) and thermal infrared ASTER imagery can be used to delineate glacier debris-cover extent semi-automatically (Reference Paul, Huggel and KääbPaul and others, 2004; Reference Shukla, Arora and GuptaShukla and others, 2010). Although the delineation methods were applied as accurately as possible, it is still difficult to detect glacier outlines correctly due to debris cover and snow cover. Consequently, manual digitizing of glacier extents was used for the multispectral images (MSS in 1976, Landsat ETM in 2000 and Landsat5 TM/Landsat7 ETM) in 2009/10.
Meteorological data
Meteorological data in China are obtained from the China Meteorological Data Sharing Service System http://cdc.cma.gov.cn/home.do Two weather stations (Tingri and Nyalam) were used to analyze climate changes during 1972–2010. Meteorological data in Nepal are provided by the International Centre for Integrated Mountain Development (ICIMOD; Reference RajchalRajchal, 2006). They span the period 1988–2008; some years have data missing.
Precision evaluation
Our study uses different spatial and temporal resolution data sources (Table 1). Hence, it is necessary to assess the uncertainty of the results to ascertain the accuracy. Numerous factors affect the certainty of glacier delineation in mountain regions (e.g. clouds and snow cover; the sensor’s spatial resolution; spectral characteristics; mountain shadows; mixed-pixel problems; image-processing problems; and disagreements between manually and automatically derived outlines). Glacier mapping uncertainty depends mainly on the spatial and radiometric resolution of the image sources and the conditions at the time of acquisition (Reference Bhambri, Bolch, Kawishwar, Dobhal, Srivastrava and PratapBhambri and others, 2013); less than half-pixel accuracy is usually achieved (Reference BolchBolch and others, 2010).
The analyst’s misinterpretation of glacier imagery also leads to inaccuracy, though guidelines were developed within the framework of the Global Land Ice Measurements from Space (GLIMS) initiative (Reference Raup and KhalsaRaup and Khalsa, 2007). For example, lateral moraine and end moraine should not be included as part of the glacier, while debris-covered ice should be included, but neither of these conventions is followed (Reference Nie, Zhang, Liu and ZhangNie and others, 2010). However, assessment of the uncertainty is difficult because images are not usually acquired at the same time or with the same spatial resolution (Paul and others, 2013).
Previous experience suggests that debris cover and spatial resolution are two key causes of uncertainty (Reference Williams, Hall and ChienWilliams and others, 1997; Reference Silverio and JaquetSilverio and Jaquet, 2005; Reference PaulPaul and others, 2013). The uncertainty associated with resolution concentrates on the edge of the glacier and the region of intersection between rock and glacier, so it is evaluated by analyzing the glacier’s edge pixels (Reference WangWang, 2013). We used a buffer area with half the sensor resolution to calculate the uncertainty in the software package ArcMap. The results show that the higher the sensor resolutions, the smaller the uncertainty. The glacier outlines derived from Landsat ETM+ in 2000 thus have a smaller uncertainty than those derived from Landsat MSS in 1976 and Landsat TM in 2009. Furthermore, the larger the glacier, the smaller the uncertainty. Glaciers less than 1 km2 typically have an uncertainty larger than 8.2%; the maximum uncertainty is 33%, derived from Landsat MSS. The uncertainty associated with our analysis is shown in Table 2.
Uncertainty of glacier area according to glacier area classification
Standard uncertainty propagation was used to calculate the overall uncertainty during 1976–2009:
where S is the overall uncertainty in this study and S i is the uncertainty component at different times
The uncertainties estimated for the time periods 1976-2000, 2000-09 and 1976-2009 are 5.1%, 3.1% and 5.6%, respectively. The overall uncertainty in 1976, 2000 and 2009 is 5.8%.
Results
Inventory of glaciers in the Koshi River catchment
Our analysis shows that there were 2061 glaciers with a total area of 3225 ±90.3 km2 in the Koshi River catchment area in 2009 (Fig. 1). About 1282 of these glaciers (55.1% of the total number) are <0.5 km2 in area, and these small glaciers make up 6.2% of the total glacier area. About 442 glaciers (20.1% of the total number) are in the area range 1-5 km2, and these make up 23.3% of the total glacier area. There are 29 glaciers (1.6% of the total number) in the >20km2 area class and these make up 40.6% of the total glacier area. Thus, although small glaciers are more numerous than large glaciers, a high proportion of the glacier area is constituted by the few large glaciers.
Figure 2 depicts the distribution of glacier population and area in different area-size classes normalized to the total number and area in the study region. The glacier number and area are larger on NSH than on SSH. There are 1290 glaciers on NSH, accounting for 61.7% of the total number of glaciers in the Koshi River catchment, with an area of 1961.0 ±54.90 km2, accounting for 60.4% of the total glacier area; and 771 glaciers on SSH, accounting for 38.3% of the total number of glaciers, with an area of 1264.1 ± 35.4 km2, accounting for 39.6% of the total glacier area. The mean glacier sizes on NSH and SSH are 1.52 and 1.64 km2, respectively.
The normalized frequency distribution of glaciers and the normalized distribution of their areas in the seven glacier area-size classes on SSH and NSH.

Glacier area change
Comparison of the total area of all glaciers in the Koshi River basin in 1976 with their total area in 2000 and 2009 (Table 3) reveals a reduction by -775.4 ±224.0 km2, or 19.4 ± 5.6% (0.59 ± 0.17% a–1). The number of glaciers also decreased, by 145, during the period 1976-2009. The mean size of glaciers in the study area decreased from 1.81 km2 to 1.56 km2. During the sub-period 1976-2000, total glacier area reduced by about 641.7 ±204.0 km2, or 16.0±5.1%, with a mean rate of glacier area loss of 0.67 ±0.21% a–1. During 2000-09, the glacier area decreased about 133.7 ±107.5 km2, or 4.0 ±3.2%, with a mean rate of 0.44 ±0.36% a–1. This suggests that the rate of glacier shrinkage has slowed.
Glacier changes in Koshi during 1976–2009
Comparison of glacier changes on SSH and NSH shows that their total glacier areas shrank by about 321.3 ±88.8 km2 and 454.2 ± 135.3 km2, respectively, or 20.3 ± 5 . 6% (0.62±0.17%a–1 ) and 18.8±5.6% (0.57±0.17% a–1), respectively, during 1976-2009. During 1976-2000, glaciers on SSH and NSH shrank about 238.1 ±80.9 km2 and 403.6 ± 123.2 km2, or 15.0 ±5.1% (0.62 ±0.21% a–1) and 16.7 ±5.1% (0.70 ±0.21% a–1), respectively. There are some differences in glacier change rate during 2000-09. Over this period, glacier area on SSH decreased by 6.2 ±3.2% (0.68±0.36%a–1) while glacier area on NSH decreased by 2.5 ±3.2% (0.27±0.36% a–1). Consequently, glaciers on SSH retreated faster than those on NSH. The number of glaciers on SSH increased by about 8, but the number of glaciers on NSH decreased by 27.
Since glaciers with size <1 km2 have a smaller total area and larger uncertainty in area (Table 2), we performed the glacier-area change analysis again, with their changes excluded. We found that the maximum contribution to glacier area loss comes from those glaciers within the area range 1-5 km2, which contributed 32.0% of total area loss between 1976 and 2009; the second largest contribution comes from glaciers larger than 20 km2 which contributed 18.6%. The glacier area loss between 2000 and 2009 accounts for 52% and 24% of the total area loss during the period 1976-2009 on SSH and NSH, respectively. Glaciers larger than 5 km2 account for 27.0% of the area loss on SSH. We observed that most debris-covered glacier tongues larger than 10 km2 on SSH do not retreat as much as other glaciers because the debris keeps them stagnant or limits their recession. Nevertheless, glaciers on SSH retreat at a higher rate (0.68 ±0.36% a–1) from 2000 to 2009 because mass loss is focused in the clean ice or middle parts of glacier ablation zones.
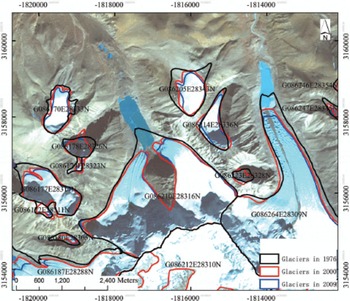
One glacier (No. G086210E28316N), with an area of 7.44 km2 in 1976, was divided into two glaciers in 2000, which had areas of 3.26 and 2.80 km2 respectively, a total area loss of 18.5%. Both glaciers continued to shrink, yielding a decrease in area of 0.1 km2, or 1.7%, between 2000 and 2009. The glacier with an area of 3.26 km2 was almost instable. Another glacier (G086264E28309N) which was close to glacier No. G086210E28316N also underwent shrinkage. While both glaciers G086210E28316N and G086264E28309N retreated from 1976 to 2009, the glacier moraine lakes expanded where they were parts of both glaciers in 1976 (Fig. 3).
Changes of example glaciers during 1976–2009 (background: Landsat ETM+ acquired in 2000, path 141, row 40). Black line: glacier outlines in 1976; red line: glacier outlines in 2000; blue line: glacier outlines in 2009.
Discussion and Conclusion
Glacier changes in surrounding areas
Glacier retreat has been reported for many parts of the Hindu Kush-Himalaya against the background of worldwide warming (Reference Fujita and NuimuraFujita and Naimura, 2011; Reference BolchBolch and others, 2012; Reference Frey, Paul and StrozziFrey and others, 2012). However, these previous studies did not consider a whole basin nor did they offer a comparison between SSH and NSH. Our results establish that the loss of glacier area in the Koshi River catchment (0.59 ± 0.17% a–1) is one of the fastest reported in the Himalaya during 1976-2009. For example, existing studies derived from 466 glaciers in Chenab, Parbati and Baspa basins, East Himalaya, show that glacier area reduced from 2077 km2 in 1962 to 1628 km2 in 2004, accounting for 21% of total glacier area (Reference KulkarniKulkarni and others, 2007). Glacier changes in West Himalaya were reported to be ~.4% shrinkage (0.33% a–1) from 1976 to 2003 (Reference Ye, Yao, Kang, Chen and WangYe and others, 2006). Reference Mool, Bajracharya and JoshiMool and others (2001) found that the area of 153 glaciers in the Poiqu River basin decreased ~2.28 km2 from 1988 to 2000, accounting for 5% (0.41%a–1) of the total area. A total of 999 glaciers in the Pumqu basin with an area of 1461.84 km2 decreased 10% (0.30% a–1) in area and 9% and others’ and Jin and others’ results reflected only part of the glacier change in the Koshi River basin. Similar work was done in the Qomolangma region, where the glacier recession was 0.30% a–1 during 1974-2008, with slower glacier retreat since 2000 (Reference Ye, Zhong, Kang, Stein, Wei and LiuYe and others, 2009). Reference Nie, Zhang, Liu and ZhangNie and others (2010) surveyed glacier changes in the Qomolangma nature reserve where glacier area decreased 502 ±0.04 km2, or 15.6%, during 1976-2006. However, this result cannot be compared with our glacier change estimates for the Koshi basin, since these authors excluded potentially debris-covered regions from their glacier mapping.
Bedrock outcrop
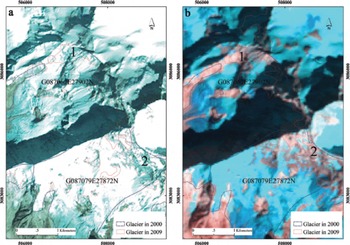
Glacier recession usually occurs in the glacier tongue and glacier lateral where the end moraine and lateral moraine are formed. We also noted that glacier shrinkage occurs in a few parts of the accumulation region on SSH (Fig. 4). Due to steep terrain, conditions for ice development here are poor. These regions were sometimes snow-covered or had a small ice depth. However, the ice dies easily away and there is bedrock outcrop. This is part of the glacier accumulation region and bears the ice redistribution. In this work, we also consider the bedrock outcrop as glacier shrinkage. This is one reason why the glacier change is larger on SSH than on NSH from 2000 to 2009.
An example of bedrock outcrop: (a) background: Landsat ETM+ acquired in 2000 (path 140, row 41); (b) background: Landsat TM acquired in 2009 (path 140, row 41). Both positions are bedrock outcrop covered by snow/ice in 2000.
Reasons for glacier variation
Glacier variation is a complex response to climate change mediated by a time lag which is affected by several factors (e.g. glacier size, glacier bed slope, glacier type). The quantitative relationship between glacier shrinkage and climate change is difficult to pin down. Tingri station, located on the highest-elevation site on NSH and close to the region where glaciers are distributed, provides a relevant climatic record for our study area. A warming trend in this station’s temperature record during 1972–2011 can be seen in Figure 5. Temperature has risen by 1.5°C in the past 39 years, with a sharp rise around 1997. Winter temperature has increased significantly (Reference Yang, Zhang, Qin, Kang and QinYang and others, 2011).
Changes in mean air temperature and precipitation during 1972–2011 recorded at Tingri station.
The Tingri station precipitation record showed a slight increase during 1972–2011. There were dry years between 1980 and 1998 (Fig. 5). A separate record derived from ice cores located in the region indicates that precipitation decreased rapidly from the 1950s to the 1960s, then kept relatively steady, and decreased between 1980 and 1997 (Reference Ren, Qin, Kang, Hou, Pu and JingRen and others, 2004). Precipitation has increased again since 1997. Temperature increase generally increases glacier ablation rates, and reduced precipitation before 1997 led to less net ice accumulation in this period. The warming trend on SSH is consistent with NSH (Reference WangWang, 2013). Thus, we believe that glacier retreat during 1976–2000 can be attributed primarily to air-temperature increase and precipitation decrease. We further suggest that glacier retreat during 2000–09 was controlled by temperature increase, even though precipitation increased at the same time; the increased accumulation could not offset ice losses to surface melting driven by higher temperature.
In this study, we have presented a new glacier inventory for the whole Koshi River basin derived from data sources including multispectral satellite imagery. The new inventory indicates that there were 2061 glaciers with an area of 3225.1 ±90.3 km2 in 2009. Comparison with serial glacier mapping derived from different data sources reveals that the glacier area in Koshi River basin shrank by 19.4±5.6% (0.59±0.17%a–1) during 1976-2009. The number of glaciers has decreased from 2206 to 2061. Several glaciers (<1 km2) have vanished and a couple of glaciers were dismembered and divided into two or more individual glaciers during 1976-2009 (e.g G086210E28316N and G086264E28309N in Fig. 3). Glacier reduction was slightly faster on SSH (20.3 ±5.6%) than on NSH (18.8 ±5.6%) from 1976 to 2009, and especially from 2000 to 2009.
Acknowledgements
We thank Felix Ng and Doug MacAyeal for careful reviews and helpful suggestions. This work was supported by the external Cooperation Program of the Chinese Academy of Sciences (grant GJHZ0954), the National Natural Science Foundation of China (grants 41030527 and 41071047), and the Ministry of Science and Technology of the People’s Republic of China (grant 2010CB951401). It was also funded by the China Scholarship Council and State Key Laboratory of Cryospheric Sciences (SKLCS-ZZ-2012-00-02). ASTER GDEM is a product of METI (Ministry of Economy, Trade and Industry, Japan) and NASA. Landsat images come from USGS (http://glovis.usgs.gov and the Global Land Cover Facility.


