

Ultra-processed foods have come to dominate the global food supply( Reference Monteiro, Moubarac and Cannon 1 ). In Canada, the contribution of ultra-processed products to household food purchases was 54·9 % in 2001( Reference Moubarac, Batal and Martins 2 ) and examination of the most recent Canadian Community Health Survey revealed these foods made up 48 % of energy consumed by Canadians( Reference Moubarac, Batal and Louzada 3 ). Similar trends have been observed in other high-income countries and minimally processed, staple foods are increasingly being displaced by ultra-processed products in low- and middle-income settings as well( Reference Monteiro, Levy and Claro 4 – Reference Moodie, Stuckler and Monteiro 6 ). While a study of household purchasing patterns in the USA between 2002 and 2012 suggested that trends in the purchase of highly processed foods and beverages have stabilized in that country, and this may be true in Canada as well, highly processed products comprised 61 % of energy purchased by US households in 2012( Reference Poti, Mendez and Ng 7 ). The high consumption of extensively processed foods is a matter of public health concern because of the nutrition profile of these products. Despite differences in the criteria applied by different research groups to identify processed foods, studies have consistently documented higher concentrations of sugar, sodium and saturated fats among products deemed most processed( Reference Monteiro, Levy and Claro 4 , Reference Poti, Mendez and Ng 7 – Reference Eicher-Miller, Fulgoni and Keast 10 ). Diets high in ultra-processed products have been found to increase risk of weight gain( Reference Canella, Levy and Martins 11 ) and the metabolic syndrome( Reference Tavares, Fonseca and Rosa 12 ), and some authors have argued that the increased reliance on these foods has contributed to a parallel rise in the burden of chronic, diet-related disease( Reference Moubarac, Batal and Martins 2 , Reference Stuckler, McKee and Ebrahim 5 ).
It has been proposed that the dominance of ultra-processed foods and beverages in the diet relates to their aggressive and strategic on-package marketing( Reference Monteiro, Moubarac and Cannon 1 , Reference Moubarac 13 , Reference Mallarino, Gómez and González-Zapata 14 ), but there has been no systematic examination of the relationship between the level of food processing and nutrition labelling practices. In Canada, as in the USA and many other countries, the only mandatory nutrition information appearing on packaged foods and beverages is a nutrition facts table, typically displayed on the back of the package. The use of front-of-package (FOP) nutrient content and disease-risk reduction claims is regulated via compositional criteria and prescribed wording in Canada( 15 ). Specifically, nutrient content claims exist for nutrients with established recommended daily intakes or reference standards, and their use is permitted on products containing prescribed amounts of these nutrients per serving( 15 ). Disease-risk reduction claims, similarly, are permitted on foods that contain set levels of energy and/or nutrients per serving based on scientific evidence that has established a relationship between certain elements of healthy diets and the reduction of the risk of developing chronic diseases( 15 ). These claims are intended to provide readily accessible information to help guide consumers towards healthier food choices, while also creating incentives for manufacturers to reformulate products to improve their healthfulness( 16 ). The decision of whether or not to display regulated claims rests with the manufacturer, however, and manufacturers are free to display other unregulated text, symbols and rating systems. A myriad of such claims, symbols and systems has been introduced by food manufacturers (e.g. Kellogg’s ‘Get the Facts’) and third parties (e.g. the Whole Grain Council); their use requires no compliance with the compositional criteria governing regulated claims.
A recent survey of packaged foods in Canada found discretionary nutrition labelling, including nutrient content and disease-risk reduction claims and summary systems, on nearly half of products( Reference Schermel, Emrich and Arcand 17 ). Manufacturer- and third-party-endorsed summary indicator systems and symbols were found on one-fifth of products and appeared in 158 unique formats( Reference Schermel, Emrich and Arcand 17 ). While most research has not differentiated regulated and unregulated FOP references, studies of specific food categories have found 30–60 % of products bearing unregulated text( Reference Sacco, Sumanac and Tarasuk 18 , Reference Metcalfe and Elliott 19 ). The high density of FOP nutrition references observed on breakfast cereals, mixed dishes, novel beverages and meal replacements( Reference Schermel, Emrich and Arcand 17 , Reference Colby, Johnson and Scheett 20 , Reference Dachner, Mendelson and Sacco 21 ) suggests that discretionary on-package references to nutrition may be more common on products characterized by a high level of processing. It is well documented that FOP nutrition references are not necessarily indicative of nutritionally superior products( Reference Emrich, Qi and Cohen 22 – Reference Van Camp, de Souza Monteiro and Hooker 24 ), but there is also considerable evidence that the presence of such references influence consumer purchasing( Reference Volkova and Mhurchu 25 , Reference Nestle and Ludwig 26 ), raising questions about the extent to which processed food manufacturers’ use of FOP nutrition references functions to reinforce the presence of these foods in the diet.
Drawing on data from a survey of packaged foods sold in Canadian supermarkets, the purpose of the present study was to assess the relationship between the extent and nature of FOP nutrition references on products and the level of food processing. Our analysis of FOP text and graphics differentiated manufacturers’ use of regulated and unregulated text, while at the same time assessing the frequency of FOP references to nutrients and ingredients that are widely regarded as important to minimize, and those seen as important to maximize, in food selections for optimal health( 27 – 31 ). In the absence of a single, standardized classification system to grade foods in the North American food supply by level of processing, we employed three distinct frameworks to define food processing( Reference Poti, Mendez and Ng 7 , Reference Monteiro, Cannon and Levy 32 , 33 ) to allow for consideration of salient differences in the conceptualization of processing in this context.
Methods
Data collection
A comprehensive survey of all labelling found on the front of all packaged foods and beverages sold in major Toronto grocery stores was conducted between July 2010 and August 2011( Reference Sacco, Sumanac and Tarasuk 18 , Reference Sumanac, Mendelson and Tarasuk 34 ). A single store was selected, by convenience sampling, from each of the top three food retailers in Canada (Loblaw’s, Metro and Sobeys), representing 71 % of the total Canadian retail market share( 35 ). Data collectors systematically recorded all descriptive text on the front of packaged foods, including product identifiers (i.e. brand and product name, variety and product size), nutrient content claims, quantitative statements, generic and product-specific health claims, third-party- (e.g. The Heart and Stroke Foundation of Canada’s ‘Health Check’) and manufacturer- (e.g. Kraft’s ‘Sensible Solutions’) developed symbols and summary systems which display or score nutrient content using thresholds or proprietary algorithms( 36 ), as well as any other descriptive or implied references emphasizing the presence or absence of a specific nutrient or constituent. Fresh produce, meat, poultry, fish, and dried herbs and spices were excluded from the sample because they were unlikely to bear nutrition labelling. Products found in the pharmacy and infant food sections were also excluded because these products are designed for specific population subgroups and special dietary usage.
After removing duplicate products (i.e. identical products found in more than one store), 20 520 unique packaged items were captured in the database. Products were considered unique if they differed from similar products on the basis of any product identifier.
Data analysis
Each product was coded for the presence of any reference to nutrition (e.g. summary systems and symbols, quantifying statements, nutrient content and health claims). Nutrition references were further classified as ‘negative’ if they conveyed the reduction or absence of a nutrient or food constituent to discourage (e.g. ‘low sodium’, ‘trans fat free’, ‘no added sugar’) and ‘positive’ if they highlighted the presence or addition of a nutrient to encourage (e.g. ‘good source of calcium’, ‘high in fibre’). Positive and negative nutrition references were further differentiated in terms of the use of regulated and unregulated text. Regulated nutrition references (i.e. nutrient content and disease-risk reduction claims) were identified by the prescribed wording and permitted wording variations outlined in the Canadian Food and Drug Regulations( 37 ) and the Canadian Food Inspection Agency’s Guide to Food Labelling and Advertising( 38 ). Regulated references which indicated reformulation through the reduction of a particular negative constituent (e.g. ‘reduced sodium’) were also identified. Unregulated nutrition references included all quantifying statements, summary systems and symbols issued by the manufacturer or a third party as well any other text inconsistent with current prescribed wording for regulated claims. Finally, the total number of nutrition references appearing on a product was coded for each product. Verification of the data entry and coding was conducted on a sub-sample of products and discrepancies resolved by two members of the research team who were not involved in the data collection.
All products were classified by level of food processing, applying three distinct classification systems which have all been applied to the North American food supply( Reference Moubarac, Batal and Martins 2 , Reference Moubarac, Batal and Louzada 3 , Reference Poti, Mendez and Ng 7 – Reference Eicher-Miller, Fulgoni and Keast 10 , Reference Poti, Mendez and Ng 39 , Reference Eicher-Miller, Fulgoni and Keast 40 ) but differ slightly in their determination of high levels of processing. The International Food Information Council’s (IFIC) classification system( 33 ) was developed by IFIC in the Understanding our Foods Communication Toolkit and designed for use in high-income countries; its intended purpose was to define processed foods for consumers and clear ‘misinformation about modern food production’( 33 ). It grades products based on the relative complexity of processing and the physical, chemical and sensory changes in foods resulting from processing, while also differentiating convenience products. IFIC’s classification of processed foods has been applied to consumption data from the USA( Reference Eicher-Miller, Fulgoni and Keast 10 , Reference Eicher-Miller, Fulgoni and Keast 40 ). The NOVA system, developed by Monteiro and colleagues at the University of São Paulo, defines food processing as the physical, biological or chemical processes after their separation from nature and prior to ‘culinary preparation’ and differentiates foods by nature, extent and purpose of food processing( Reference Moubarac, Batal and Louzada 3 , Reference Monteiro, Cannon and Levy 32 ). NOVA was developed to assess the role of food processing on the nature of diets and related states of health and well-being( Reference Monteiro, Cannon and Levy 32 ), and has been applied to food purchasing and consumption data from a number of countries including Brazil, the UK and Canada( Reference Moubarac, Parra and Cannon 41 ). The classification system developed by Poti and colleagues, while guided by the NOVA system and also focused on the degree of industrial processing, reflects the complexity of food processing inherent to the US food supply( Reference Poti, Mendez and Ng 7 ). It has also been used in studies of food purchasing and consumption from the USA( Reference Poti, Mendez and Ng 7 , Reference Poti, Mendez and Ng 39 ). A summary of key differences and similarities in the determination of the highest level of food processing in each classification system is presented in Table 1. A fuller description of the classification criteria specific to each level of processing in these three systems is presented in the online supplementary material, Supplemental Table 1.
Description of highest food processing categories and their distinguishing and common features, across three classification systems
Binary logistic regression models were used to assess the relationship between the presence and nature (i.e. ‘negative’ or ‘positive’) of nutrition references and the level of product processing. Similar models were used to examine the relationship between references classified as unregulated and regulated and level of processing. The association between the extent (i.e. total number) of nutrition references on a product and level of processing was assessed using negative binomial regression models, appropriate for count outcome variables of this nature (e.g. values of 0, 1, 2, 3, …)( Reference Gardner, Mulvey and Shaw 42 ).
All analyses were conducted using the statistical software package SAS version 9.4. A P value less than 0·05 was deemed statistically significant.
Results
Presence and nature of front-of-package references
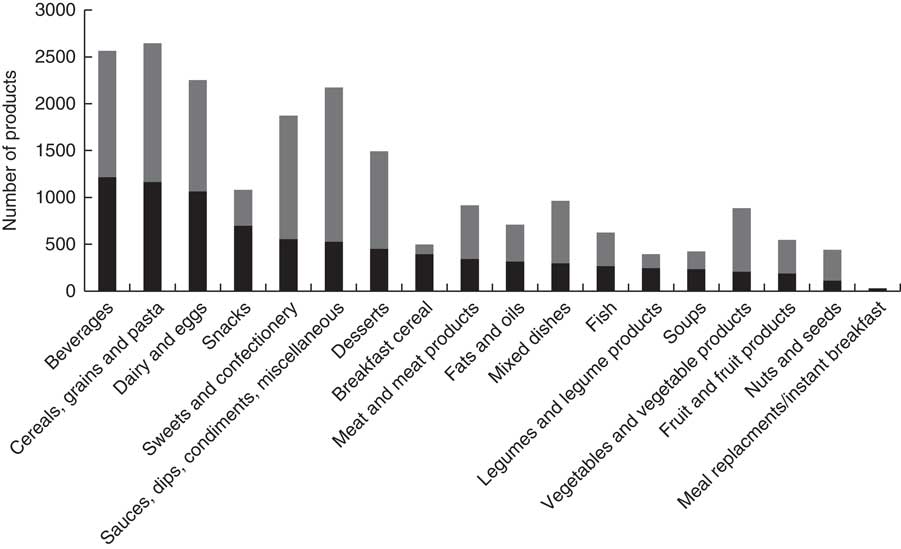
Forty-one per cent (n 8324) of all products surveyed bore some form of FOP nutrition reference, but there were marked differences in the proportion of products bearing FOP nutrition references within individual food groups (Fig. 1). Of the products bearing FOP nutrition references, 38 % referenced the absence or reduction of a negative nutrient, 29 % the presence or addition of a nutrient to encourage, and 23 % referenced both negative and positive nutrients. Ten per cent of FOP nutritionally referenced products did not make specific reference to a single nutrient but included general health and wellness claims, manufacturer and third-party issued FOP summary systems and symbols. Twenty-two per cent (n 4538) of products bore a regulated reference which was negative and 15 % (n 2985) one which was positive. Negative unregulated references appeared on 10 % (n2110) of products and positive unregulated references on 8 % (n1689). Regulated references which indicated reformulation were observed on 2 % (n492) of all products. In total, 24 % (n4925) of products bore an unregulated FOP nutrition reference.
Number of products with any front-of-package (FOP) nutrition reference (![]() , any FOP nutrition reference;
, any FOP nutrition reference; ![]() , no FOP nutrition reference), by food category, among packaged foods (n 20 520) from three large Toronto supermarkets, Canada, July 2010–August 2011
, no FOP nutrition reference), by food category, among packaged foods (n 20 520) from three large Toronto supermarkets, Canada, July 2010–August 2011
Relationship between front-of-package references and level of processing
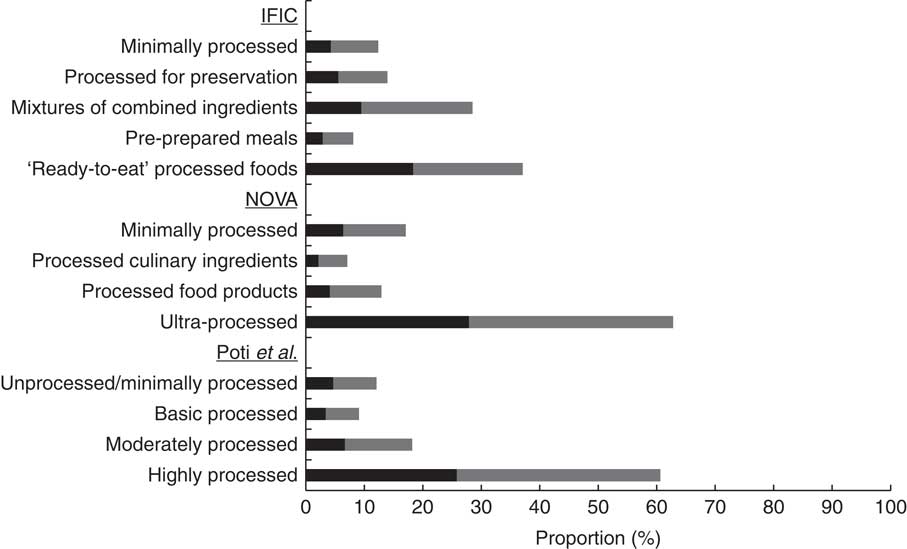
Irrespective of the classification system considered, the most processed category comprised the greatest proportion of products in our database and nearly half of these foods bore FOP nutrition references (Fig. 2). The nature of FOP references found on products, by level of processing, is presented in Table 2. Almost one-third of foods in the most processed category of each classification system bore FOP references to the negative nutrients, but the proportion with references to positive nutrients ranged from 19·3 to 24·5 % (Table 2).
Proportion of front-of-package (FOP) nutrition references (![]() , any FOP nutrition reference;
, any FOP nutrition reference; ![]() , no FOP nutrition reference), by level of processing, across three classification systems, on packaged foods (n 20 520) from three large Toronto supermarkets, Canada, July 2010–August 2011 (IFIC, International Food Information Council classification system(
33
); NOVA, system developed by Monteiro and colleagues(
Reference Monteiro, Cannon and Levy
32
); Poti et al., classification system developed by Poti and colleagues(
Reference Poti, Mendez and Ng
7
))
, no FOP nutrition reference), by level of processing, across three classification systems, on packaged foods (n 20 520) from three large Toronto supermarkets, Canada, July 2010–August 2011 (IFIC, International Food Information Council classification system(
33
); NOVA, system developed by Monteiro and colleagues(
Reference Monteiro, Cannon and Levy
32
); Poti et al., classification system developed by Poti and colleagues(
Reference Poti, Mendez and Ng
7
))
Frequency of front-of-package (FOP) nutrition references, by level of processing, across three classification systems, on packaged foods (n 20 520) from three large Toronto supermarkets, Canada, July 2010–August 2011
IFIC, International Food Information Council.
The most processed products were significantly more likely to have a nutrition reference than products in lesser-processed categories (Table 3), but they were also more likely to make FOP references to multiple nutrients. Results from the negative binomial model showed that across classification systems, foods deemed most processed bore, on average, significantly more nutrition references than did products in lesser-processed categories (Table 4).
Odds of front-of-package (FOP) nutrition references, by level of processing, across three classification systems, on packaged foods (n 20 520) from three large Toronto supermarkets, Canada, July 2010–August 2011
IFIC, International Food Information Council.
* Indicates highest processing level for each classification system and reference category.
Results of negative binomial regression models on total number of front-of-package references, by level of processing, across three classification systems, on packaged foods (n 20 520) from three large Toronto supermarkets, Canada, July 2010–August 2011
IFIC, International Food Information Council.
* Indicates highest processing level for each classification system and reference category.
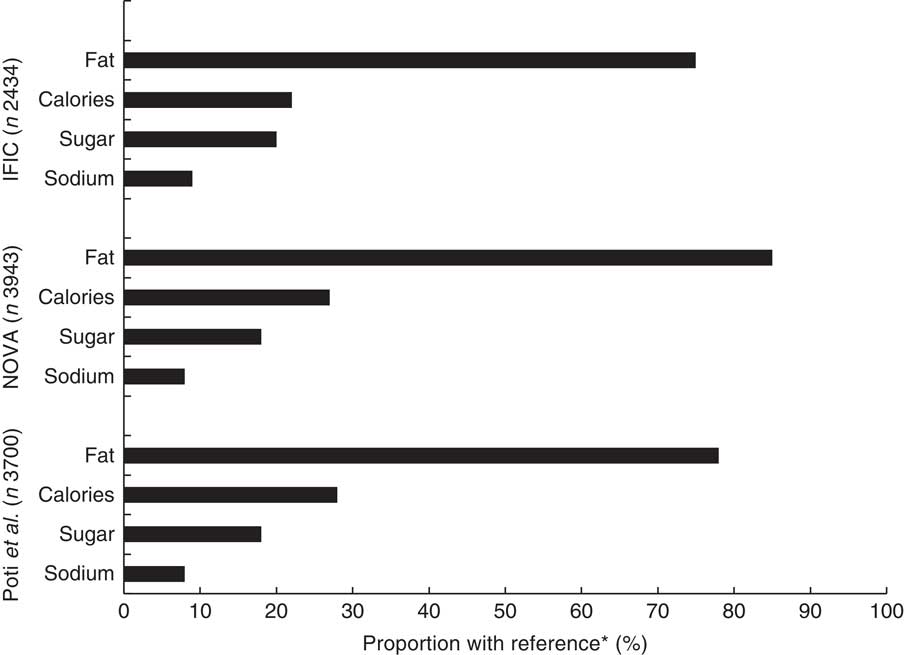
Products in the most processed category of each classification system were significantly more likely than less processed products to bear a negative nutrition reference (Table 3). Both regulated and unregulated negative references were significantly more likely to appear on foods classified as most processed than on lesser-processed foods (Table 3). A closer examination of the negative references on products deemed most processed indicated that most referred to the fat content of the product (including references to total fat, saturated fat and trans fat); least common were references to sodium (Fig. 3). Irrespective of the classification scheme used, less than 3 % of products deemed most processed bore regulated claims indicative of product reformulation to lower negative nutrients (data not shown).
Proportion of fat, energy (calorie), sugar and sodium references among ‘negative’ referenced products in the highest level of processing, by classification system, on packaged foods (n 20 520) from three large Toronto supermarkets, Canada, July 2010–August 2011. *‘Negative’ references were coded to include a variety of text under a single term; e.g. references that referred to the fat content of a product included trans fat, saturated fat and total fat content (IFIC, International Food Information Council classification system( 33 ); NOVA, system developed by Monteiro and colleagues( Reference Monteiro, Cannon and Levy 32 ); Poti et al., classification system developed by Poti and colleagues( Reference Poti, Mendez and Ng 7 ))
While most positive nutrition references were found on products characteristic of the highest degree of processing (Table 2), when compared with lesser-processed products, they were less likely to bear this type of reference when the Poti et al. classification system was applied, but results were inconsistent across the other two classification systems (Table 3). The presence of an unregulated positive nutrition reference was more likely to appear on ‘ready-to-eat’ processed foods than on lesser-processed products when the IFIC classification system was applied, but results were inconsistent with the other two coding schemes (Table 3). No statistically significant differences were observed in the odds of ultra-processed products bearing unregulated positive references when they were compared with processed culinary ingredients, as coded by the NOVA system (Table 3). Similarly, the odds of unregulated positive references on highly processed products were not statistically significant when compared with basic and moderately processed foods, as coded by the Poti et al. system (Table 3).
When processing was coded using the NOVA system, ultra-processed foods were significantly more likely than lesser-processed foods to bear a symbol or summary system, but no clear pattern was observed when assessing the presence of a symbol or summary system across levels of processing using the other two classification systems (Table 3).
Discussion
Our study represents the first systematic examination of the relationship between FOP references and the level of food processing. We found that, compared with less processed foods, those classified as most processed were more likely to bear FOP references and more likely to bear multiple references, regardless of the classification system used to define levels of food processing. In addition, products with the highest level of processing were more likely to bear FOP references to negative nutrients, including both regulated and unregulated references.
The prominence of ‘negative’ nutrition messaging on foods with the highest levels of processing is consistent with the reportedly high density of nutrients of public health concern among these food products( Reference Moubarac, Batal and Martins 2 , Reference Moubarac, Batal and Louzada 3 , Reference Poti, Mendez and Ng 7 – Reference Eicher-Miller, Fulgoni and Keast 10 ). The ubiquity of negative nutrition references on products in the highest category of processing must in part reflect the competitive nature of product marketing in this sector, but it may also reflect manufacturers’ attempts to respond to public health messaging and allay consumers’ concerns regarding excessive exposure to potentially harmful ingredients such as trans fat, added sugars and sodium. The use of negative references may also signal reformulation efforts to reduce the concentrations of these particular ingredients in products. However, to the extent that we could identity product reformulation through manufacturers’ use of regulated claims indicating lower amounts of energy, fat, sugar or sodium, we found little evidence of this practice, with fewer than 3 % of the most processed products bearing such claims.
Nearly 24 % of all products in our data set bore nutrition references which were unregulated, and unregulated references to negative nutrients were particularly prevalent on foods deemed most processed. While most work examining FOP references on pre-packaged foods has not differentiated regulated and unregulated nutrition information, research conducted on some specific product groups suggests that the presence of an unregulated nutrition reference may indicate a product that is nutritionally inferior to those bearing a regulated claim( Reference Sacco, Sumanac and Tarasuk 18 , Reference Metcalfe and Elliott 19 ). Insofar as public health authorities see the development of regulated FOP references as both a tool to provide nutritional guidance to consumers and an incentive for manufacturers to reformulate products to achieve better nutrient profiles( 16 ), manufacturers’ use of unregulated text merits further study. It is important to recognize that consumers are unlikely to be capable of differentiating between FOP references that are regulated and ones that are not. Future research is needed to better understand manufacturers’ motivations for using unregulated references and the implication of these labels for product sales.
We employed three distinct classification systems in our study as a means to better understand the relationship between product processing and the presence of FOP nutrition references. All three systems yielded similar results with respect to the greater presence of FOP nutrition labels in general and negative nutrition references, in particular, on products considered to be in the highest category of processing. However, several discrepancies surfaced when we considered manufacturers’ use of positive nutrition references because different research groups classify some processed foods with particular nutritional properties differently. Closer examination of the discrepancies highlighted the effects of the differential classification of some specific food products across these three systems on our findings. For example, the highly significant lower odds of regulated positive nutrition references on highly processed foods than on less processed food categories, as defined by Poti et al., reflect the exclusion of some products made with whole grains (e.g. wholegrain breads and cereals) and commonly labelled with regulated fibre claims from the most highly processed category in this system( Reference Poti, Mendez and Ng 7 , Reference Monteiro, Cannon and Levy 32 , 33 ). This exclusion lessened the potential for positive nutrition references in this category relative to the most processed food category in the other two classification systems. Inconsistent results were also observed across systems when examining the presence of unregulated positive references. Foods classified as most processed under the IFIC system (i.e. ‘ready-to-eat processed’ foods) were more likely than others to bear positive unregulated references, but the pattern was less clear when examining this relationship using the other two systems. The explanation for this discrepancy appears to lie in the different classifications of convenience foods across the three systems. Convenience products, with a lower density of unregulated positive references, were classified in the highest degree of processing under NOVA and Poti et al., but not in the highest category of IFIC( Reference Moubarac, Parra and Cannon 41 ). Although subtle, the differences in food classification across systems may have important implications for research results, as demonstrated in our current analyses. Researchers should be cognizant of these differences when choosing a classification system to define food processing; the three systems applied here are clearly not interchangeable.
Although the work presented here represents a robust assessment of FOP nutrition references on processed foods, some limitations should be considered in the interpretation of our results. First, the data were collected over a one-year period in 2010–2011 and therefore may not be reflective of the current food marketplace. References to sodium, for instance, might be more prevalent on foods now than when our data were collected, given the heightened public awareness of sodium levels in the Canadian food supply following the release of Canada’s Sodium Reduction Strategy( 43 , 44 ). Similarly, the more recent liberalization of fortification polices in Canada, which affords manufacturers expanded opportunities for micronutrient additions to processed food products( 45 ), may now also translate into a greater frequency of positive nutrition references than observed on heavily processed products in the present study. More research is required to determine how dynamic manufacturers’ use of discretionary FOP nutrition references is in the face of shifting public health priorities and new opportunities for product innovation.
Our study was also limited by our lack of nutritional content information and data on product sales. Although there is considerable evidence to suggest that FOP nutrition references do not necessarily signify nutritionally superior products( Reference Emrich, Qi and Cohen 22 – Reference Van Camp, de Souza Monteiro and Hooker 24 ), there is limited research on the effects of these references on food selection and purchasing behaviours. Future work would benefit from an examination of how the use of FOP references by manufacturers impacts consumer behaviour and the nutritional quality of their diets.
Our examination of FOP nutrition references on packaged foods sold in Canadian supermarkets reflects manufacturers’ practices at one point in time, in a regulatory environment where the use of some specific nutrient content claims is regulated but the display of both regulated and unregulated nutrition references is at the discretion of the manufacturer. Our finding that FOP nutrition references and references to ‘negative’ ingredients, in particular, were significantly more likely to appear on heavily processed foods raises questions about the adequacy of this form of nutrition guidance to direct consumers towards healthier food choices. The evolving discourse on FOP labelling in North America has so far focused on the nutrient requirements for a standardized, but still discretionary, FOP label that provides a more global assessment of the nutritional value of a product( 36 ). Our findings add to this discussion by highlighting the markedly different FOP labelling practices on foods with different levels of processing. Implementation of a mandatory, standardized system is necessary to ensure that the nutritional value of all foods available for sale is communicated to consumers( 46 ). Failing this, regulators should perhaps consider calls for the abolition of the practice of FOP nutrition referencing, as put forward by others( Reference Nestle and Ludwig 26 , Reference Scrinis 47 ).
Acknowledgements
Acknowledgements: The authors gratefully acknowledge Dr Jocelyn Sacco for her initial support in the development of the database. Financial support: This study was funded by an operating grant from the Canadian Institutes of Health Research (grant number MOP – 102655). The Canadian Institutes of Health Research had no role in the design, analysis or writing of this article. Conflict of interest: The authors have no competing interests to declare. Authorship: V.T., R.M. and N.D. designed the overall study and secured the funding. A.C. and V.T. designed and conducted the analyses and drafted the manuscript. All authors participated in the interpretation of the findings, critically reviewed the manuscript and approved the final version. Ethics of human subject participation: Not applicable.
Supplementary material
To view supplementary material for this article, please visit https://doi.org/10.1017/S1368980017001057


