


Introduction
Surveys of nesting beaches are often the only feasible and low-cost approach for assessing and monitoring sea turtle populations over long time frames (Schroeder & Murphy, Reference Schroeder, Murphy, Eckert, Bjorndal, Abreu-Grobois and Donnelly1999). Four species of sea turtles are known to nest within the Western Indian Ocean region: the green turtle Chelonia mydas, the hawksbill turtle Eretmochelys imbricata, the olive ridley turtle Lepidochelys olivacea and the loggerhead turtle Caretta caretta (Frazier, Reference Frazier1975; Bourjea et al., Reference Bourjea, Nel, Jiddawi, Koonjul and Bianchi2008). All are on the IUCN Red list (IUCN, 2015): the hawksbill is categorized as Critically Endangered, the green turtle as Endangered, and the loggerhead and olive ridley turtles as Vulnerable. Sea turtle populations in Kenya are generally perceived to be declining (Wamukota & Okemwa, Reference Wamukota, Okemwa, Hoorweg and Muthiga2009) because of poaching, loss of nesting habitats, and bycatch in fishing gears (Frazier, Reference Frazier and Bjorndal1980; Okemwa et al., Reference Okemwa, Nzuki and Mueni2004; Wamukota & Okemwa, Reference Wamukota, Okemwa, Hoorweg and Muthiga2009). Other factors include pollution from marine debris, predation, and disease (Frazier, Reference Frazier1975; Wamukoya et al., Reference Wamukoya, Kaloki and Mbendo1997; Church & Palin, Reference Church and Palin2003).
The Lamu archipelago provides the most significant nesting beaches for sea turtles along the Kenyan coast (Frazier, Reference Frazier and Bjorndal1980; Wamukoya et al., Reference Wamukoya, Kaloki and Mbendo1997; Church & Palin, Reference Church and Palin2003), and is estimated to support > 60% of reported nests (Okemwa et al., Reference Okemwa, Nzuki and Mueni2004). In 1997 WWF initiated a community-based sea turtle monitoring and conservation programme in the Lamu archipelago in partnership with the Kenya Wildlife Service and local communities. Conservation strategies implemented include monitoring of nesting activity and strandings on index beaches, nest relocation, and flipper tagging, which was introduced in 2000.
Long-term monitoring is crucial to provide insights into sea turtle population dynamics and to evaluate the effectiveness of conservation activities (Wallace et al., Reference Wallace, DiMatteo, Bolten, Chaloupka, Hutchinson and Abreu-Grobois2011). The use of volunteers in monitoring is an essential aspect of community-based sea turtle conservation (Frazier, Reference Frazier, Eckert, Bjorndal, Abreu-Grobois and Donnelly1999), and has been successfully adapted in the Western Indian Ocean region (Garnier et al., Reference Garnier, Hill, Guissamulo, Silva, Witt and Godley2012; Humber et al., Reference Humber, Godley, Nicolas, Raynaud, Pichon and Broderick2017). There are a number of published studies describing long-term trends in sea turtle nesting within the region (e.g. Bourjea et al., Reference Bourjea, Frappier, Quillard, Ciccione, Roos, Hughes and Grizel2007, Reference Bourjea, Dalleau, Derville, Beudard, Marmoex and M'Soili2015; Lauret-Stepler et al., Reference Lauret-Stepler, Bourjea, Roos, Pelletier, Ryan, Ciccione and Grizel2007; Allen et al., Reference Allen, Shah, Grant, Derand and Bell2010; Mortimer et al., Reference Mortimer, von Brandis, Liljevik, Chapman and Collie2011; Garnier et al., Reference Garnier, Hill, Guissamulo, Silva, Witt and Godley2012; Nel et al., Reference Nel, Punt and Hughes2013; Derville et al., Reference Derville, Jean, Dalleau, Le Gall, Ciccione and Bourjea2015) but to our knowledge this is the first published assessment of long-term spatial and temporal trends in sea turtle nesting activity along the East African coast. We evaluate trends in the spatial distribution of nesting, clutch size and body size, incubation duration, and hatching success across five beach locations to provide insights into the status of the nesting population in the Lamu archipelago, Kenya.
Study area
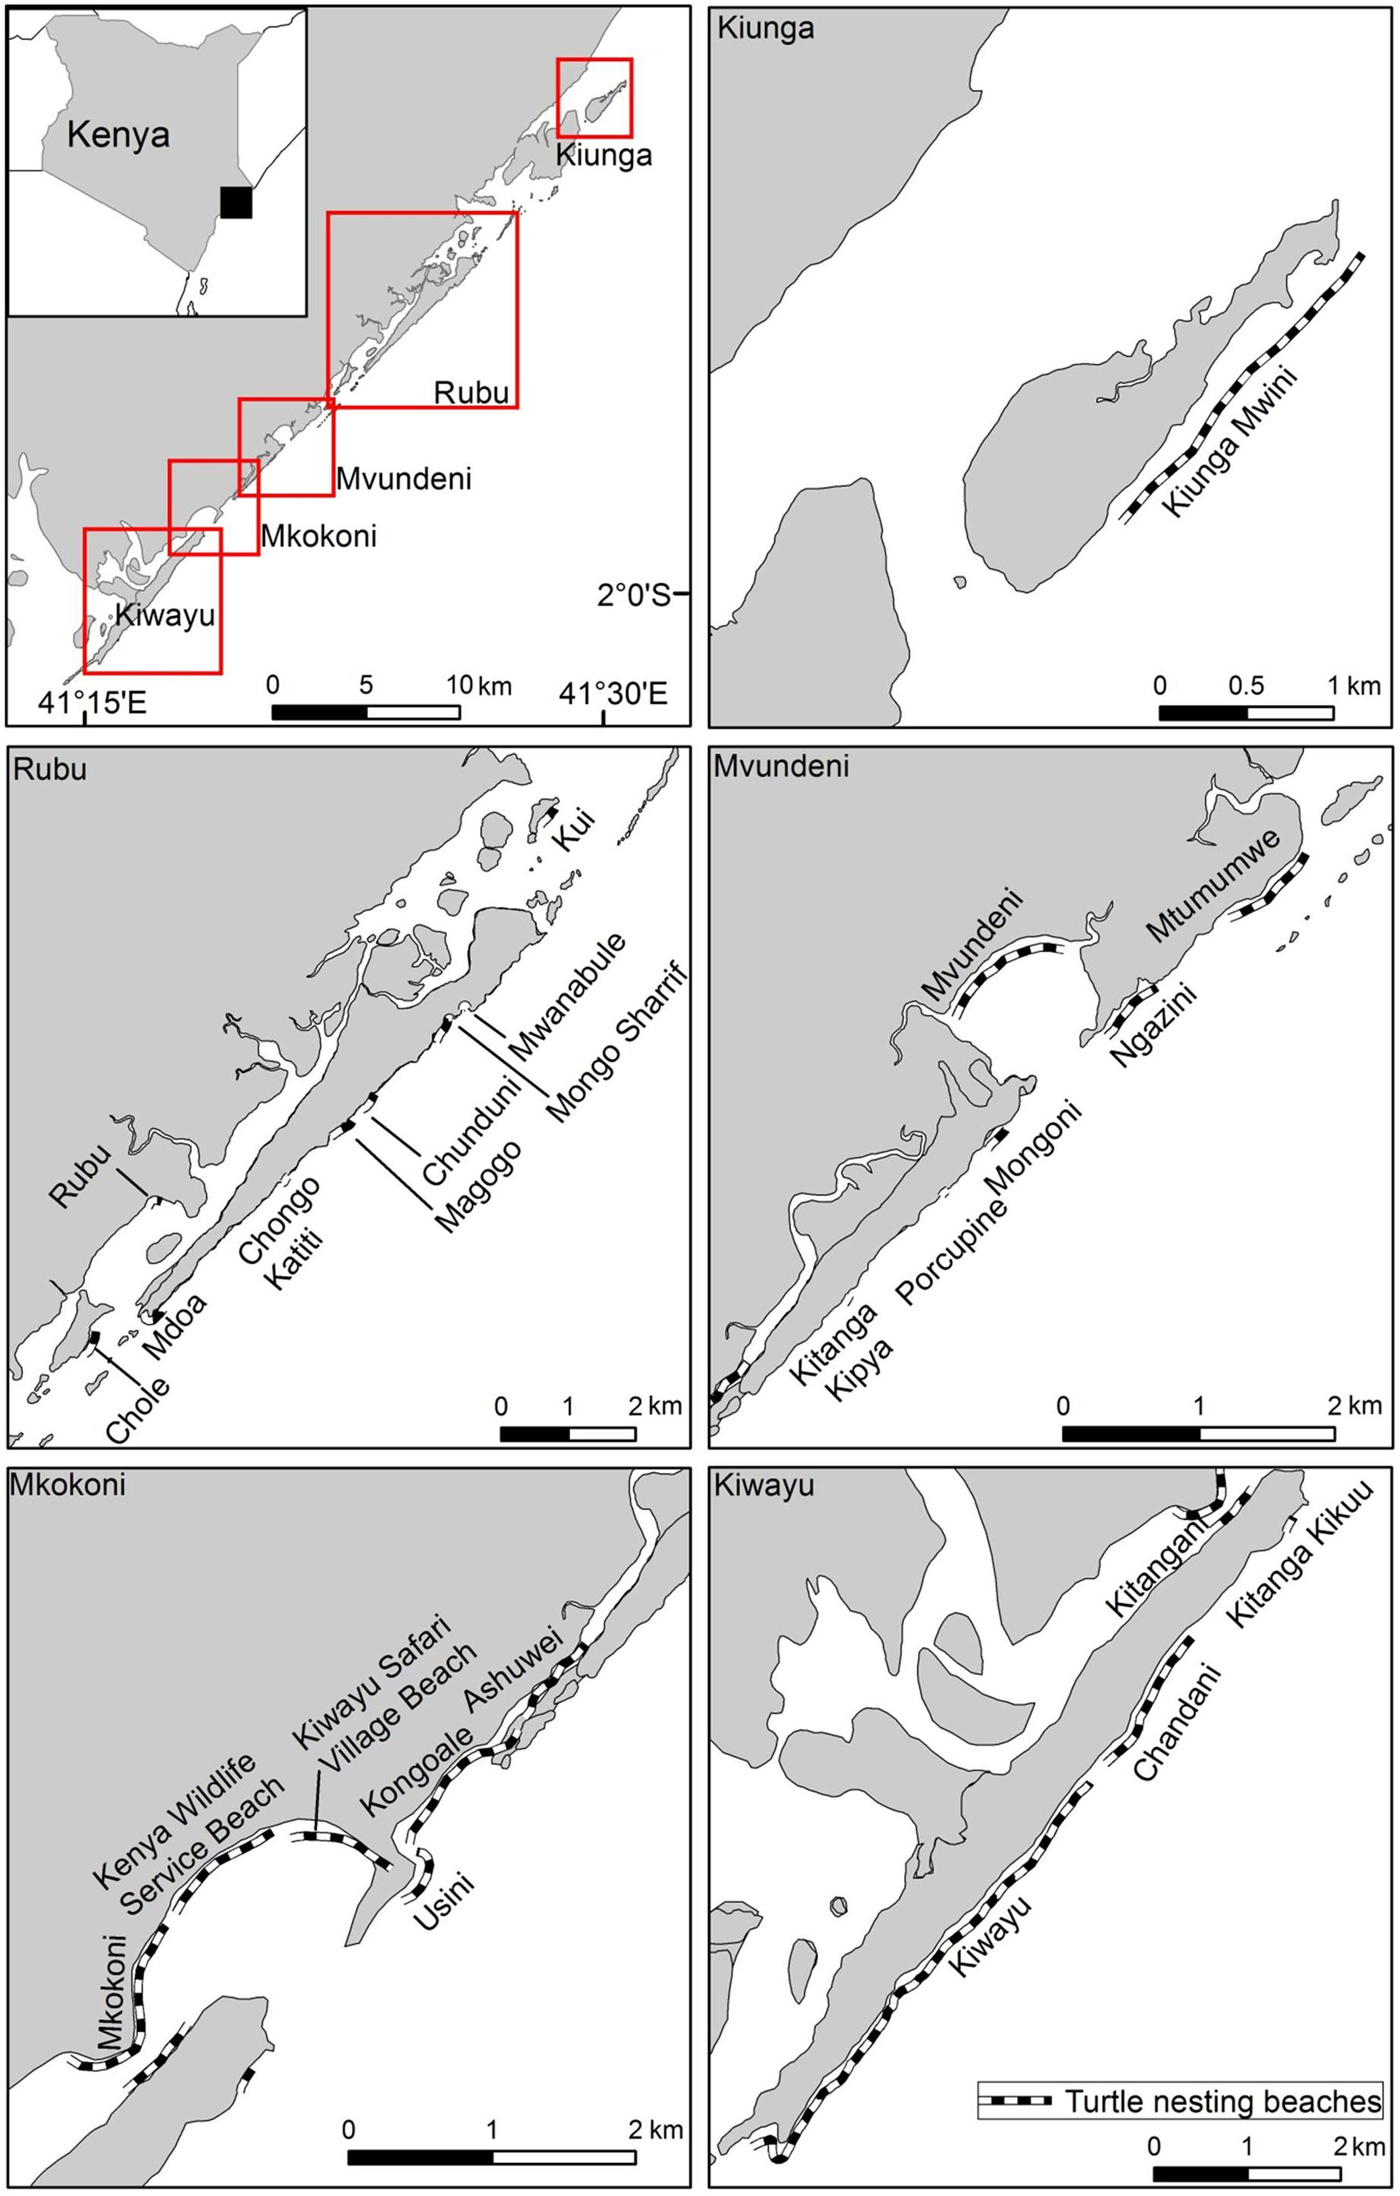
The Lamu archipelago is located on the northernmost Kenyan coast along the Indian Ocean, adjacent to the border with Somalia, and is characterized by a linear series of > 65 barrier islands (Fig. 1). The islands are inhabited by > 100,000 people, who are largely dependent on fishing as a source of livelihood and food security (Rodden, Reference Rodden2014). The archipelago is considered to be semi-pristine and contains extensive mangrove stands sheltering lagoons, large areas of seagrass beds on rocky substrates, shallow outer fringing reefs, and a submerged barrier reef c. 3–4 km offshore (Obura, Reference Obura, Linden, Souter, Wilhelmsson and Obura2003). Although the area is considered to be semi-pristine, there are a number of infrastructural projects being implemented, including the development of a new commercial port and a crude-oil pipeline (Government of Kenya, 2016).
Location of sea turtle nesting beaches that were monitored during 1997–2013 at five locations (Kiunga, Rubu, Mvundeni, Mkokoni and Kiwayu) in the Lamu archipelago, Kenya.
The Lamu archipelago is influenced by two distinct monsoon seasons, typical to the East African coast. The wet south-east monsoon season, during March–October, is characterized by very strong winds and currents, whereas the relatively dry north-east monsoon season, during November–March, is characterized by mild currents, calm seas and warm temperatures (McClanahan, Reference McClanahan1988; Schott & McCreary, Reference Schott and McCreary2001). The northern area of the archipelago, towards Kiunga (Fig. 1), experiences mild upwelling events and eutrophic conditions resulting in nutrient blooms, which provide relatively high productivity during the north-east monsoon season (Duineveld et al., Reference Duineveld, De Wilde, Berghuis, Kok, Tahey and Kromkamp1997; Spencer et al., Reference Spencer, Laughton and Flemming2005).
Methods
Data collection and processing An ongoing collaborative sea turtle monitoring programme was initiated in 1997 to conduct surveillance patrols on 26 nesting beaches (c. 20 km in total), clustered into five major locations for this study: Kiunga (2 beaches), Rubu (9 beaches), Mvundeni (6), Mkokoni (6), and Kiwayu (3) (Fig. 1; Supplementary Table S1). The patrols were carried out by a team of 15 community data collectors drawn from the surrounding or adjacent villages. The data collectors were trained in the use of standardized nesting beach monitoring protocols, including nest identification, relocation and excavation, and sea turtle nesting behaviour. The beach surveys were conducted daily at dawn in the peak nesting season during February–July by 2–3 individuals, and scaled down to every 2 days or once per week during the other months. Encountered turtle tracks were examined to locate sea turtle nests, which were then marked discretely, given a unique identification number and monitored for signs of hatchling emergence. Encountered sea turtles were examined for the presence of flipper tags after oviposition, and tag details were recorded if present. The curved carapace length was measured with a flexible tape along the midline of the carapace from notch to tip (± 0.1 cm), and curved carapace width at the widest point of the carapace (Bolten, Reference Bolten, Eckert, Bjorndal, Abreu-Grobois and Donnelly1999). Tagging was opportunistic, as saturation tagging was not possible because of the vastness of the area. Clutches laid below the high-water mark were relocated to other suitable locations, and protected from poaching and predation using a standardized monitoring protocol whereby each nest is relocated within 48 hours to reduce disturbance to the egg incubation process. Hatchling emergence was monitored, and the nests were excavated 3–5 days after cessation of emergence. Nest contents were then examined for empty eggshells, unhatched eggs and dead hatchlings. Temperature and rainfall data were obtained from the Meteorological Department of Kenya.
Data analysis Assessment of variations in nest densities (number of nests per km) between years focused on green turtles only, and was limited to data collected during 1999–2013 in the peak nesting months (March–July), although monitoring is ongoing. The annual trend was examined using a locally weighted scatterplot smoother (Cleveland et al., Reference Cleveland, Cleveland, McRae and Terpenning1990), which was fitted to the time series data to detect the underlying temporal pattern. The smoother was applied for each location separately, and then on the data pooled across years, to obtain a general trend. The influence of sea surface temperature and rainfall on nest abundance and incubation duration was examined using Spearman's rank correlation (r s). Nest parameters assessed included clutch size, hatching success, and incubation duration. The clutch size, defined as the number of eggs laid, was estimated for non-predated nests only by counting the number of eggs for which > 50% of the eggshell was intact, to avoid double counting or overestimation, plus the unhatched eggs; and hatching success was calculated as a percentage of the total number of eggs that hatched successfully and the clutch size (Miller, Reference Miller, Eckert, Bjorndal, Abreu-Grobois and Donnelly1999). Incubation duration was derived from a sample of nests with a known laying date, and calculated as the number of days elapsed from egg laying until the first emergence of hatchlings. The data reported by the community during the initial phase (1997–2000) were not included in the analysis of clutch size because there was a high likelihood of underreporting because of poaching. All nest parameters are presented as mean values (± SE). A one-way analysis of variance (ANOVA) or the non-parametric equivalent (Kruskal–Wallis test) was used to check for significant differences in the nest parameters among locations and between seasons (Zar, Reference Zar2010). Differences in the nest parameters between the five locations were further compared using a post-hoc multiple comparison pairwise test. All statistical analyses were carried out using STATISTICA v. 8.0 (StatSoft, Inc., Tulsa, USA).
Results
Spatial and temporal nesting patterns
Over the 17-year study period 2,021 nests were reported: 1,971 (97.5%) green turtle nests, 31 (1.5%) hawksbill nests, 8 (0.4%) olive ridley nests, and 11 (0.5%) nests from unidentified sea turtle species (Table 1). On average 119 ± SE 9 nests were recorded annually, ranging from 31 nests in 1997 to 165 nests in 2006. The mean nest density during the peak nesting months was 4.6 km−1 (Table 1). The nest density was highest in Mvundeni (mean 14.9 km−1, range 0.9–30.4 km−1) and lowest on Kiwayu (2.3 km−1, range 0.9–5.4 km−1).
The total length of beaches monitored for sea turtle nesting, total numbers of nests recorded, by species and overall, mean annual nest density (number of nests per km) during peak nesting months (March–July), and mean hatching success among in situ and relocated nests at five beach locations in the Lamu archipelago, Kenya (Fig. 1), during 1997–2013.

There were annual variations in nesting activity across the locations (Fig. 2). Green turtles nested at all five study locations (Table 1), with the highest number of nests recorded on Rubu (40% of the total number of green turtle nests) and the lowest in Kiunga (7%). Nineteen percent of green turtle nests were laid in Mvundeni, and Kiwayu and Mkokoni each accounted for 17%. Nesting by hawksbill and olive ridley turtles was reported in all locations except Mvundeni (Table 1). The highest number of hawksbill turtle nests was recorded on Kiwayu, followed by Rubu, whereas only two olive ridley turtle nests were recorded in each of these two locations.
Annual total number of sea turtle nests reported during 1997–2013 at five monitored locations (Kiunga, Rubu, Mvundeni, Mkokoni and Kiwayu) in the Lamu archipelago, Kenya (Fig. 1).

The annual mean density of green turtle nests ranged from 3 km−1 in 2000 to a peak of 6.3 km−1 in 2006 (Fig. 3). Interpolation of the underlying annual trend showed a stable pattern among all locations, with a distinct general cycle of 2–3 years. Although nesting occurred year round, 74% of nests were recorded during March–July, with the highest number (21%) recorded in May (Fig. 4). Mean monthly sea surface temperature was 25.4–28.9°C, with a mean of 27.6°C during the peak nesting months of March–July. Mean monthly rainfall was 0–298 mm, with a mean of 143 mm during the peak nesting months (Fig. 4). Both factors were positively correlated with the monthly patterns of nest abundance (r s = 0.430 and 0.240, respectively).
Annual trends in sea turtle nest densities in the Lamu archipelago, Kenya (Fig. 1) during peak nesting months (March–July) during 1999–2013. Dashed lines represent the underlying fitted trend using a locally weighted scatterplot smoothing procedure.

Monthly trends in (a) total number of sea turtle nests, (b) incubation duration, and (c) mean rainfall and sea surface temperature (SST) in the Lamu archipelago, Kenya (Fig. 1) during 1997–2013. NEM, north-east monsoon; SEM, south-east monsoon.

Incubation duration
Incubation duration for green turtle clutches was 40–67 days. The mean annual incubation duration was 55.5 ± SE 0.05 days (range 55.1–55.6 days; n = 1,644). Supplementary Table S2 details the variation in mean incubation duration for green turtle, hawksbill and olive ridley turtle nests among the nesting locations. The longest incubation duration (mean = 58 days) occurred in July and the shortest (mean = 55 days) occurred during January–May (Fig. 4). Overall, the mean incubation duration varied significantly among locations (F = 2.23, P = 0.035), because of a significant difference between Mkokoni and Rubu as confirmed by pair-wise comparison tests (P = 0.027). There was an inverse correlation between incubation duration for green turtle clutches and sea surface temperature (r s = −0.66). Incubation duration for hawksbill clutches was 49–60 days, with an annual mean of 54.9 ± SE 0.7 days (n = 25), and the incubation duration for olive ridley turtle clutches was 50–60 days, with a mean of 56.4 ± SE 1.1 days (n = 8). However, incubation duration did not differ significantly across locations for hawksbill (F = 0.66, P = 0.507) or olive ridley turtle nests (F = 3.720, P = 0.187).
Variation in clutch and body size
The mean clutch size for green turtle nests was 117.7 ± SE 1 eggs (N = 1,789, range 20–189 eggs per clutch). Hawksbill turtles laid a mean of 103 ± SE 6 eggs per clutch (N = 29, range 37–150 eggs per clutch), and olive ridley turtles laid a mean of 103 ± SE 6 eggs per clutch (N = 7, range 80–133 eggs per clutch). Supplementary Table S3 provides a summary of the tagging effort and recaptures during the study period. Overall, 165 nesting green turtles were tagged. The overall tag recovery rate was low (7%); however, tag recaptures for green turtles occurred on the same beach where tagging took place, which is indicative of site fidelity. Five tag recaptures occurred during the same year, indicative of re-nesting events, and six were recorded during different years, indicative of nesting re-migration. The tagged green turtles had a mean curved carapace length of 99.9 ± SE 0.7 cm (range 65–125 cm) (Fig. 5). The largest mean size (109 ± SE 1.4 cm, n = 12) was reported in 2006, and the smallest (92 ± SE 0.9 cm, n = 5) was reported in 2000 (Fig. 6). A curved carapace length of 72 cm was reported for a tagged nesting hawksbill turtle.
The size distribution of nesting green turtles Chelonia mydas in the Lamu archipelago during 2000–2013.
The annual variation in mean body size (curved carapace length) of tagged nesting green turtles Chelonia mydas in the Lamu archipelago during 2000–2013.

Hatching success
During the study period, 214,926 eggs were recorded, producing 173,333 (81%) viable hatchlings. Relocated nests produced 145,414 viable hatchlings, 84% of the total number. Hatching success did not differ significantly between the three species (Kruskal–Wallis, H = 5.40, P = 0.14), and therefore further analysis of trends was not separated to species. Mean hatching success was significantly higher for in situ nests (81.0 ± SE 1.5%) compared to relocated nests (77.8 ± SE 1.4%) (N = 1,830, H = 12.77, P = 0.001) (Table 1). However, there was high annual variation. Hatching success was below the overall mean (81%) during the first decade of monitoring (1997–2007; Fig. 7). The mean hatching success among in situ nests also differed significantly between months (H = 60.84, P < 0.05) and seasons (H = 25.96, P < 0.05), being higher during the south-east monsoon season (82.2 ± SE 0.5%, n = 1,368) compared to the north-east monsoon season (76.1 ± SE 1.1%, n = 462).
Annual variation in mean hatching success (%) for in situ and relocated nests during 1997–2013 in the Lamu archipelago, Kenya (Fig. 1). The horizontal line indicates the overall mean hatching success.
A significant difference in mean hatching success between locations among in situ (H = 16.80, P < 0.05) and relocated nests (H = 16.20, P < 0.05) was also observed (Table 1). Pair-wise comparisons among sites further revealed that in situ nests at Mvundeni had a significantly lower hatching success than in situ nests at Rubu (P = 0.003). Relocated nests at Mkokoni had a significantly lower hatching success than relocated nests at Kiwayu (P = 0.001), Rubu (P = 0.017) and Kiunga (P = 0.035), and relocated nests at Mvundeni had a significantly lower hatching success than relocated nests at Kiwayu (P = 0.013).
Discussion
This study provides valuable information on the nesting ecology of sea turtles on the East African coast. Of all turtle nests recorded in the Lamu archipelago, those of green turtles were most abundant (97.5% of the total). The dominance of green turtles is typical of the Western Indian Ocean region (Frazier, Reference Frazier1975; Ciccione & Bourjea, Reference Ciccione and Bourjea2006; Bourjea et al., Reference Bourjea, Frappier, Quillard, Ciccione, Roos, Hughes and Grizel2007; Lauret-Stepler et al., Reference Lauret-Stepler, Bourjea, Roos, Pelletier, Ryan, Ciccione and Grizel2007; Garnier et al., Reference Garnier, Hill, Guissamulo, Silva, Witt and Godley2012; Humber et al., Reference Humber, Godley, Nicolas, Raynaud, Pichon and Broderick2017). Hawksbill turtles and olive ridley turtles are generally not abundant in the region, although exceptionally high numbers of nesting hawksbill turtles are reported in the Seychelles (Mortimer, Reference Mortimer1984; Allen et al., Reference Allen, Shah, Grant, Derand and Bell2010).
Interpolation of the nest density data indicated a relatively stable trend at all the study locations. However, there was variability in nest densities between the locations, with Rubu and Kiwayus having the highest densities. Some recaptures of tagged nesting green turtles occurred on the same beach where the tagging took place, providing evidence of site fidelity. Green turtles generally exhibit high nest site fidelity, especially within a nesting season (Mortimer & Portier, Reference Mortimer and Portier1989; Xavier et al., Reference Xavier, Barata, Cortez, Queiroz and Cuevas2006). However, the degree of site fidelity among nesting green turtles in the Lamu archipelago remains uncertain because of the low recapture rate. Nonetheless, there is a high likelihood that nesting migrations occur between beaches in the archipelago, similar to those reported by Allen et al. (Reference Allen, Shah, Grant, Derand and Bell2010) for the Seychelles.
Green turtle nesting occurred year round, peaking during the wet season months, and was strongly correlated with mean monthly rainfall and sea surface temperature. This observation concurs with studies elsewhere in the Western Indian Ocean region, including the Comoros (Bourjea et al., Reference Bourjea, Dalleau, Derville, Beudard, Marmoex and M'Soili2015), Madagascar (Bourjea et al., Reference Bourjea, Ciccione and Rantsimbazafy2006; Lauret-Stepler et al., Reference Lauret-Stepler, Bourjea, Roos, Pelletier, Ryan, Ciccione and Grizel2007; Derville et al., Reference Derville, Jean, Dalleau, Le Gall, Ciccione and Bourjea2015), Mozambique (Garnier et al., Reference Garnier, Hill, Guissamulo, Silva, Witt and Godley2012; Anastácio et al., Reference Anastácio, Santos, Lopes, Moreira, Souto and Ferrão2014), Reunion Island (Ciccione & Bourjea, Reference Ciccione and Bourjea2006) and the Seychelles (Mortimer, Reference Mortimer2012). Dalleau et al. (Reference Dalleau, Ciccione, Mortimer, Garnier, Benhamou and Bourjea2012) also reported sea surface temperature as a major driver influencing the seasonal nesting patterns for green turtles within the South-West Indian Ocean region. The distinct 2–3 year nesting cycle observed is typical for green turtles (e.g. Mortimer & Carr, Reference Mortimer and Carr1987; Hughes, Reference Hughes and Bjorndal1995; Broderick et al., Reference Broderick, Godley and Hays2001; Chaloupka, Reference Chaloupka2001; Weishampel et al., Reference Weishampel, Bagley, Ehrhart and Rodenbeck2003).
The observed mean incubation duration for green turtles in the Lamu archipelago is within reported ranges, for example, for Mozambique (63.1 ± SE 9.3 days, Garnier et al., Reference Garnier, Hill, Guissamulo, Silva, Witt and Godley2012) and Cyprus (51.1 days, Broderick & Godley, Reference Broderick and Godley1996). Various studies have highlighted the importance of sand temperature in influencing incubation duration (Mrosovsky & Yntema, Reference Mrosovsky and Yntema1980; Ackerman, Reference Ackerman, Lutz and Musick1997; Broderick et al., Reference Broderick, Godley, Reece and Downie2000). Although we did not measure sand temperature, we observed an inverse correlation between sea surface temperature, a proxy for sand temperature, and incubation duration. Garnier et al. (Reference Garnier, Hill, Guissamulo, Silva, Witt and Godley2012) reported similar findings in Querimbas Islands, Mozambique.
Studies have also revealed that body size influences clutch size in sea turtles (van Buskirk & Crowder, Reference van Buskirk and Crowder1994; Broderick et al., Reference Broderick, Glen, Godley and Hays2003), and can fluctuate annually over time (Bourjea et al., Reference Bourjea, Frappier, Quillard, Ciccione, Roos, Hughes and Grizel2007; Piacenza et al., Reference Piacenza, Balazs, Hargrove, Richards and Heppell2016) as was observed in this study, or even decline (Anastácio et al., Reference Anastácio, Santos, Lopes, Moreira, Souto and Ferrão2014). The minimum curved carapace length of 65 cm for nesting green turtles in the Lamu archipelago is comparably smaller than reported minimum sizes elsewhere in the Western Indian Ocean region; for example, 85 cm in Mozambique (Anastácio et al., Reference Anastácio, Santos, Lopes, Moreira, Souto and Ferrão2014), 94 cm in Madagascar (Humber et al., Reference Humber, Godley, Nicolas, Raynaud, Pichon and Broderick2017), and 102.5 cm in Mayotte and Moheli (Hirth, Reference Hirth1997). Despite the skew towards smaller sizes, the mean clutch size (117.7 eggs) is within ranges reported for the region (Innocenzi et al., Reference Innocenzi, Maury, M'Soili and Ciccione2010; Garnier et al., Reference Garnier, Hill, Guissamulo, Silva, Witt and Godley2012; Anastácio et al., Reference Anastácio, Santos, Lopes, Moreira, Souto and Ferrão2014), and elsewhere (Bjorndal & Carr, Reference Bjorndal and Carr1989; Broderick & Godley, Reference Broderick and Godley1996; Broderick et al, Reference Broderick, Glen, Godley and Hays2003; Antworth et al., Reference Antworth, Pike and Stiner2006; Ekanayake et al., Reference Ekanayake, Rajakaruna, Kapurusinghe, Saman, Rathnakumara, Samaraweera and Ranawana2010; Almeida et al., Reference Almeida, Moreira, Bruno, Thomé, Martins, Bolten and Bjorndal2011). On the other hand, the mean clutch size for hawksbill turtles (103 eggs) is lower than estimates from elsewhere in the Western Indian Ocean region (e.g. the Seychelles; Wood, Reference Wood1986) and other areas (e.g. Mexico, Xavier et al., Reference Xavier, Barata, Cortez, Queiroz and Cuevas2006; and the Hawaiian Islands, Seitz et al., Reference Seitz, Kagimoto, Luehrs and Katahira2012). Witzell (Reference Witzell1983) reported minimum sizes for nesting hawksbill turtles in the region ranging from 53.3 cm (in Sudan) to 83.0 cm (in the Seychelles).
Further research is needed to establish why smaller individuals are nesting in the study area. Maturation could be occurring at smaller sizes, which could be influenced by pre-maturity growth rates and the timing of resource allocation from growth to reproductive output (Bjorndal et al., Reference Bjorndal, Parsons, Mustin and Bolten2013). Environmental variables influencing growth rates in sea turtles include changes in sea temperature, food quality and food availability (Hays, Reference Hays2000; Broderick et al., Reference Broderick, Godley and Hays2001; Bjorndal et al., Reference Bjorndal, Parsons, Mustin and Bolten2013). Additionally, retardation of growth can occur when turtles ingest marine debris, resulting in reduced nutrition (McCauley & Bjorndal, Reference McCauley and Bjorndal1999), or as a result of infections such as fibropapillomatosis (Aguirre & Lutz, Reference Aguirre and Lutz2004).
The number of doomed nests relocated and protected was exceptionally high. A higher hatching success among in situ nests was observed, in comparison to relocated nests. The results are consistent with findings from studies elsewhere (e.g. Garcia et al., Reference Garcia, Ceballos and Adaya2003; Pintus et al., Reference Pintus, Godley, McGowan and Broderick2009; Revuelta et al., Reference Revuelta, León, Broderick, Feliz, Godley and Balbuena2015). Some studies have reported no significant differences between the two treatments (e.g. Thomas, Reference Thomas2006; Tuttle & Rostal, Reference Tuttle and Rostal2010), whereas others (e.g. Zárate et al., Reference Zárate, Bjorndal, Parra, Dutton, Seminoff and Bolten2013) have reported lower hatching success among in situ nests. Hatching success is influenced by a complex interaction of environmental and physical processes (Ditmer & Stapleton, Reference Ditmer and Stapleton2012). The nest relocation process can result in reduced hatching success (Boulon, Reference Boulon, Eckert, Bjorndal, Abreu-Grobois and Donnelly1999) through introduction of microbial pathogens such as fungi and bacteria during reburial (Eckert and Eckert, Reference Eckert and Eckert1990). Other environmental factors not assessed in this study that affect hatching success include changes in nest temperature, moisture content and salinity (Bustard & Greenham, Reference Bustard and Greenham1968; Ackerman, Reference Ackerman1980; Wood & Bjorndal, Reference Wood and Bjorndal2000), sand texture and beach slope (Mrosovsky & Yntema, Reference Mrosovsky and Yntema1980; Mortimer, Reference Mortimer1990; Yalçin-Özdilek et al., Reference Yalçin-Özdilek, Özdilek and Ozaner2007), presence of vegetation (Ditmer & Stapleton, Reference Ditmer and Stapleton2012) and predation (Zárate et al., Reference Zárate, Bjorndal, Parra, Dutton, Seminoff and Bolten2013).
In addition, our study has shown a strong influence of seasonality on hatching success. Mean hatching success was lower during the dry north-east monsoon season, when elevated nest temperatures are likely to occur. A number of studies have shown that the optimum nest temperatures for sea turtles are 25–34°C, above which the effects are lethal (Bustard & Greenham, Reference Bustard and Greenham1968; Yntema & Mrosovsky, Reference Yntema and Mrosovsky1980; Segura & Cajade, Reference Segura and Cajade2010). The increasing temperatures and shoreline inundation associated with climate change continue to be a major threat to turtle nesting beaches in the long term (Glen & Mrosovsky, Reference Glen and Mrosovsky2004; Fuentes et al., Reference Fuentes, Fish and Maynard2012). Further studies are warranted to investigate the influence of environmental factors on hatching success in the Lamu archipelago.
In conclusion, this study demonstrates the significant contribution of local communities to sustaining long-term beach monitoring for enhancing the recovery of sea turtle populations in Kenya and the Western Indian Ocean region. Nonetheless, we recommend strengthening some aspects of the monitoring programme, such as increasing the intensity of tagging effort to provide robust data for estimating the annual number of sea turtles nesting, and monitoring changes in the nest environment and beach profile in view of the increasing threat of climate change and infrastructural developments associated with the development of a new port.
Acknowledgements
This work was supported by WWF-Netherlands, WWF-US, the Keane Family Foundation Trust and players of People's Postcode Lottery through WWF-UK. We appreciate the partnership of the Kenya Wildlife Service, Lamu County Government, and the Kenya Marine and Fisheries Research Institute. Specifically, we thank Julie Church, Sam Weru, Dishon Murage and Nassir Amiyo for the valuable role they played in coordinating the monitoring programme. We also thank the local communities, volunteers and interns who participated in the beach patrols. Handling of turtles, nest contents, and hatchlings was carried out with the permission of the Kenya Wildlife Service. We thank two anonymous reviewers and the editor for their valuable critiques.
Author contributions
MIO, LKM, HBM and LDM collected the data. MS and MIO conceived the analysis, and GMO, CNM and HOO analysed the data. GMO and HOO prepared the figures and tables. GMO, CNM, MIO and LKM wrote the article, and GMO, CNM, MIO, MS, LKM, LDM and HBM reviewed drafts.
Biographical sketches
Mike Olendo’s work focuses on conservation of sea turtles, and enhancing understanding of their habitats. Gladys Okemwa’s research focuses on biodiversity conservation, population dynamics, and the impacts of fisheries on sea turtles. Cosmas Munga’s interests include understanding the impacts of artisanal fisheries and promoting co-management in advocating for sustainable exploitation. Lilian Mulupi is interested in capacity building for environmental conservation and development in local communities. Lily Mwasi is interested in promoting marine conservation and social development for coastal communities. Hassan Mohamed specializes in training local communities and disseminating conservation knowledge. Mxolisi Sibanda’s work spans the science–policy interface, covering key species (including sea turtles), human–wildlife conflict, climate change mitigation, and adaptation. Harrison Ong'anda’s work focuses on the application of geospatial tools to inform the conservation and management of marine resources.


