

Women are less likely than men to express attitudes and opinions about politics, including foreign policy and international relations (IR). This gender gap manifests in numerous ways: women are less likely to discuss politics, contact elected representatives, or seek to influence other people’s views (Atkeson and Rapoport Reference Atkeson and Rapoport2003, 496-497). Comparing men’s and women’s survey responses provides a key measure of the gender gap in political expression.Footnote 1 Previous work has shown that women more frequently say they “don’t know” an answer (e.g., Mondak and Anderson Reference Mondak and Anderson2004), and some research suggests that women may be less likely to provide extreme answers, such as “strongly agree/disagree,” rather than simply “agree/disagree” (Sarsons and Xu Reference Sarsons and Xu2015).
Traditionally, the gender gap in political expression has been attributed to gendered differences in knowledge and interest; women simply know and care less about politics than men (Delli Carpini and Keeter Reference Carpini, Michael, Keeter, Tolleson-Rinehart and Josephson2000; Kenski Reference Kenski2000; Wolak and McDevitt Reference Wolak and McDevitt2011). Recently, however, students of political participation have emphasized the role of gendered differences in self-confidence and other related factors (Coffman Reference Coffman2014; Niederle and Vesterlund Reference Niederle and Vesterlund2007; Wolak Reference Wolak2020).
An understanding of the origins of the gender gap in political expression and the relative importance of knowledge and self-confidence as explanations for the gap animates efforts to increase women’s participation in political life. If knowledge is the culprit, creating additional educational opportunities for women will narrow the gender gap in political expression. If gendered differences in self-confidence better explain variations between men and women in their willingness to express themselves on political issues, education alone will not be effective. Instead, as Wolak (Reference Wolak2020) notes, “the best strategies … may come in being mindful of how young women perceive themselves.”
Our chief goal in this paper is to begin to disentangle the effects of knowledge and confidence on political expression, specifically the propensity of women to answer “I don’t know” or give extreme responses to survey questions. If varying levels of political knowledge explain gender-based variations in political expression, female IR scholars—nearly all of whom have PhDs and extensive knowledge about IR—should be less likely than other women to say they don’t know the answer to a question and should be more confident in their answers. In short, the gap between men and women should largely disappear within the academy. If that gap persists, this would suggest that knowledge alone cannot explain women’s lower levels of political expression. Other factors, including variations in confidence levels, matter. Self-confidence is an important resource in the political realm. “For those who believe in their ability to take on challenges, political pursuits may not be perceived as particularly daunting. But for those who doubt their capacity to accomplish what is difficult or demanding, engagement in political life presents greater challenges” (Wolak Reference Wolak2020).
Previous studies of gender and political expression have focused on public opinion, but we extend our analysis to include IR scholars. To explore differences between men and women in the expression of attitudes about IR and compare the gender gap among the public and scholarly experts, we use data from a series of surveys of the public and IR faculty in the United States fielded between 2014 and 2023. During this period, the Teaching, Research, and International Policy (TRIP) Project at William & Mary’s Global Research Institute conducted nine surveys of IR scholars at U.S. colleges and universities and two surveys of the general public.
Our findings show, first, that a gender gap in political expression exists, even within the academy. Female IR scholars say they don’t know the answer to questions at higher rates than male scholars. Second, knowledge clearly matters as an explanation for the gender gap. Female scholars are less likely than other women to say they don’t know an answer. Third, however, factors other than knowledge, including confidence, matter. Women in the general public select extreme answers at lower rates than men. Despite high levels of education among female scholars, they also are more hesitant than their male counterparts to select extreme answers.Footnote 2 Female scholars also report significantly lower levels of confidence in their answers to survey questions. In fact, they are just as uncertain as women in the general public.
These findings have important implications within the academy and society. If women are as knowledgeable as but less confident than men, women’s political attitudes are less likely to be heard within the academy and the policy process. Citizen participation is at the heart of democratic theory and practice. When half the population is less willing to share their political views, they will be underrepresented in policy debates and political office. When women scholars are less willing to share their views, they will be less likely to be recognized as experts. Regardless of whether women have too little self-confidence, men have too much, or both, there is a confidence gap that disadvantages women.
One remedy is to increase women’s self-confidence; another is to increase male scholars’ humility. Men, in general, are more likely to be overconfident (Lackner and Sonnabend Reference Lackner and Sonnabend2020; Niederle and Vesterlund Reference Niederle and Vesterlund2011), and male students are less sensitive than female students to negative feedback on their performance (Cimpian, Kim, and McDermott Reference Cimpian, Kim and McDermott2020). For these reasons, as part of the professional socialization of IR scholars, graduate schools should explicitly address the gender gap in political expression and actively encourage greater self-confidence among female scholars. At the same time, a healthy dose of humility and acceptance of uncertainty seem rational given the enormity of the challenges we face in international politics today.
The remainder of this article is divided into five parts. The first section briefly reviews literature on gender and political expression and the role of knowledge and confidence in explaining that relationship. We then present our research questions, hypotheses, methods, and data. Next we summarize our findings on three related questions: Is there a significant difference between men and women—that is, a gender gap—in political expression? Do differing levels of knowledge explain the gender gap? Are women less confident than men in their responses to survey questions? We briefly examine possible sources of the confidence gap between men and women, and in the final section we explore the implications of our findings for the study and practice of IR.
Gender and Political Expression
Observers have long noted that women and men behave differently in the political arena. Other than voting, women have displayed less interest in politics and have been less politically active (Bashevkin Reference Bashevkin1985; Dalton Reference Dalton2008; Inglehart and Norris Reference Inglehart and Norris2000; Schlozman, Burns, and Verba Reference Schlozman, Burns and Verba1999). They have become more politically active over time, but there remains a gap between men and women in the nature and extent of their participation. There is a noticeable gender gap in policy preferences, for example (Huddy, Cassese, and Lizotte Reference Huddy, Cassese, Lizotte, Wolbreckt, Beckwith and Baldez2008; Shapiro and Mahajan Reference Shapiro and Mahajan1986). On foreign policy, women are more protectionist (Guisinger and Kleinberg Reference Guisinger and Kleinberg2023; Mansfield and Mutz Reference Mansfield and Mutz2009; Mansfield, Mutz, and Silver Reference Mansfield, Mutz and Silver2015) and less likely to advocate the use of force (Eichenberg Reference Eichenberg2003; Reference Eichenberg2016; Lizotte Reference Lizotte2019; Smith Reference Smith1984). Women in the United States are less likely to identify as Republican (Box-Steffensmeier Reference Box-Steffensmeier, De Boef and Lin2004; Kaufmann and Petrocik Reference Kaufmann and Petrocik1999; Norrander Reference Norrander1999; Schneider and Bos Reference Schneider and Bos2019), and even when they do, they hold more moderate views than their male counterparts (Barnes and Cassese Reference Barnes and Cassese2017).
Women also are less likely to express political opinions. In survey research, this willingness can manifest in two ways. First, women are more likely to say they don’t know the answer to a question. Numerous studies find that women know less about politics, so it should not be surprising that they are more likely to say they don’t know the answers to questions of knowledge (i.e., Delli Carpini and Keeter Reference Carpini, Michael, Keeter, Tolleson-Rinehart and Josephson2000; Fraile Reference Fraile2014; Kenski Reference Kenski2000). But women also are more likely than men to say they don’t know the answers to questions about opinions or attitudes (Atkeson and Rapoport Reference Atkeson and Rapoport2003; Krosnick and Milburn Reference Krosnick and Milburn1990; Linn et al. Reference Linn, De Benedictis, Delucchi, Harris and Stage1987; Rapoport Reference Rapoport1982), suggesting that women may be less willing to guess when they don’t know an answer (Baldiga Reference Baldiga2014).
Second, there are good reasons to expect that, if women are less likely than men to express their political opinions, they also will be less likely to express extreme opinions. Extreme response style is widely seen as a learned behavior (Peterson et al. Reference Peterson, Rhi-Perez and Albaum2014).Footnote 3 Indeed, we see significant variation across cultures in the propensity to select extreme responses. Johnson et al. (Reference Johnson, Kulesa, Cho and Shavitt2005) find that people who live in highly masculinized cultures are more likely to give extreme responses. In their cross-national study of undergraduate business students, Peterson et al. (Reference Peterson, Rhi-Perez and Albaum2014) find that men are slightly more likely to select extreme responses.Footnote 4 Of greater relevance to our study, an analysis of economists at top universities in the United States (Sarsons and Xu Reference Sarsons and Xu2015) shows that women are less likely than men to select extreme responses.
Nevertheless, the evidence for a link between gender and extreme responses remains mixed and inconclusive. Batchelor and Miao (Reference Batchelor and Miao2016) examine 174 journal articles, dissertations, theses, conference papers, and articles in press published between 1953, when the first known article on extreme response style was published, and 2016. The authors note that the research on sex differences in extreme response style is “contradictory but the magnitude of sex differences tend[s] to be small.”Footnote 5 Indeed, most research suggests that there is little or no relationship between gender and extreme response style (e.g., Batchelor and Miao Reference Batchelor and Miao2016; Greenleaf Reference Greenleaf1992). Based on their meta-analyses, however, Batchelor and Miao (Reference Batchelor and Miao2016) conclude that women are slightly more likely than men to select extreme responses to survey questions (also see Weijters, Geuens, and Schillewaert Reference Weijters, Geuens and Schillewaert2010).
We hypothesize that women are both less likely than men to offer extreme responses and more likely to say they don’t know the answer to a survey question. We also empirically test these claims. First, however, we evaluate two alternative explanations—knowledge and confidence—for gender-based differences in political expression.
Knowledge-Based Explanations
One possible reason for differences between men and women in their tendency to select “don’t know” and extreme responses is their levels of political knowledge. Numerous studies find that women know less about politics—that is, they have less factual knowledge about political policies, processes, and actors—than men. Women are more likely to incorrectly answer questions on political opinion surveys, and they more often say they don’t know the answer to a question, even after controlling for various socio-economic and demographic factors (e.g., Bennett and Bennett Reference Bennett1989; Delli Carpini and Keeter 1996; Kenski Reference Kenski2000; Mondak and Anderson Reference Mondak and Anderson2004; Verba, Burns, and Schlozman Reference Verba, Burns and Schlozman1997). In two different surveys, female respondents were more likely than their male counterparts to incorrectly identify China as the United States’ top trading partner (Guisinger Reference Guisinger2011) and 30% less likely to correctly identify the three signatories to the North American Free Trade Agreement (NAFTA) (Burgoon and Hiscox Reference Burgoon and Hiscox2008). Burgoon and Hiscox (Reference Burgoon and Hiscox2003; Reference Burgoon and Hiscox2008) also attribute the tendency of women to support trade protectionism at higher rates than men (e.g., Blonigen Reference Blonigen2011; Mansfield and Mutz Reference Mansfield and Mutz2009; Mansfield, Mutz, and Silver Reference Mansfield, Mutz and Silver2015) to women’s lower exposure to economic information in university courses. Women in the United States and other countries similarly demonstrate less knowledge of technical and scientific issues, such as environmental policy (e.g., Hayes Reference Hayes2001).
Not everyone agrees that political surveys show a gender-based knowledge gap. Some scholars (e.g., Stolle and Gidengil Reference Stolle and Gidengil2010) claim that surveys consistently underestimate women’s knowledge. Such survey tools, they suggest, use biased measures of political knowledge, and women fare better when they are asked about more practical types of political knowledge, such as government services and programs (Kraft and Dolan Reference Kraft and Dolan2023). Others agree that gendered patterns in responses to political opinion surveys can be explained by factors other than variations in knowledge. Mondak and Anderson (Reference Mondak and Anderson2003, Reference Mondak and Anderson2004) point out that most of the evidence for gender-based differences in political knowledge is associated with the greater propensity of women to choose the “don’t know” response option on surveys. The problem, they assert, is one of measurement; men simply are less likely to say they don’t know an answer. Once the “don’t know” responses are eliminated, half the gender gap vanishes (Mondak and Anderson Reference Mondak and Anderson2003).
Confidence-Based Explanations
Arguments that women are less confident than men provide an alternative to knowledge-based explanations for the gender gap in political expression. Women may lack confidence and therefore demand greater certainty before selecting an answer other than “don’t know” or an extreme response: “[W]omen answer [don’t know] more often than men even in a knowledge domain where women know as much as or more than men. It follows that the high [don’t know] rates for women truly reflect a reluctance to offer substantive answers” (Mondak and Anderson Reference Mondak and Anderson2004). In earlier work, Mondak and Davis (Reference Mondak and Davis2001) compared data from two versions of a survey that tested political knowledge. Interviewers in one treatment discouraged participants from selecting the “don’t know” response; interviewers prompted those respondents who nevertheless said they didn’t know the answer to a question to choose a substantive response. Many respondents who previously said they didn’t know an answer now offered one, suggesting that a “don’t know” response does not necessarily mean the respondent lacks political knowledge. Mondak and Davis (Reference Mondak and Davis2001) conclude that respondents’ mean level of political knowledge increased by about 15% when survey researchers did “not take ‘don’t know’ for an answer.” When we factor in men’s willingness to guess and women’s hesitation to do so, as Lizotte and Sidman (Reference Lizotte and Sidman2009) do, the knowledge gap between men and women decreases by more than one-third. Women are less likely to risk being wrong when they are not confident about their response. This is as likely to be true of questions that ask respondents to apply their knowledge to an issue and offer an opinion or prediction as it is for questions of fact.
Academic research and journalistic accounts alike demonstrate this confidence gap; women tend to be less self-assured and allow their lack of confidence to drive their occupational choices, the likelihood of contributing ideas in a group setting like a classroom or boardroom, or reluctance to negotiate on their own behalf, and their tendency to qualify their opinions (see Babcock and Laschever Reference Babcock and Lascheve2007; Coffman Reference Coffman2014; Mohr Reference Mohr2014; Niederle and Vesterlund Reference Niederle and Vesterlund2007; Rampell Reference Rampell2014; Thomas-Hunt and Phillips Reference Thomas-Hunt and Phillips2004). Lower confidence levels help explain why women tend to be less competitive than men, whether in their professional lives or in the expression of potentially controversial political views. In a laboratory experiment, Niederle and Vesterlund (Reference Niederle and Vesterlund2007) found that men selected a competitive compensation scheme twice as often as women did. Although women perform as well as men in these tasks, they are more likely to prefer a noncompetitive piece rate compensation system. “Women shy away from competition and men embrace it” (Niederle and Vesterlund Reference Niederle and Vesterlund2007, 1067).
Lower levels of confidence also may mean that women require a higher degree of certainty about their responses before selecting anything other than “don’t know” (Kopicki Reference Kopicki2014). Beatty et al. (Reference Beatty, Herrmann, Puskar and Kerwin1998) find that a person’s adequacy judgment, “whether the respondent believes that the potential answer meets the requirements of the question,” can affect his or her propensity to answer a question. In their study of economists, Sarsons and Xu (Reference Sarsons and Xu2015) make a similar argument. Even among highly educated individuals at the top of their professions, the authors find a sizable gender gap. Women are less likely to offer extreme answers, and they report having less confidence in their answers than do their male colleagues. Sarsons and Xu (Reference Sarsons and Xu2015) find that the gap disappears, however, when they consider respondents’ areas of expertise: women become more confident when asked questions within their particular areas of specialization. This builds on Coffman’s (Reference Coffman2014) discovery that both women and men are unlikely to contribute ideas in areas outside their stereotypical gendered domains. That is, men are less likely than women to offer ideas on subjects like art and literature, while women are less likely to contribute to discussions in the sciences or math. Contrary to Sarsons and Xu (Reference Sarsons and Xu2015), however, Coffman (Reference Coffman2014) finds that this confidence gap persists even when respondents know they have an expertise in the area under discussion.
There are numerous possible explanations for gender-based differences in confidence ranging from genetics to socialization. Our purpose here is not to evaluate these explanations, but to demonstrate that variation in knowledge levels alone cannot account for the gender gap in political expression. Gender-based differences in self-confidence help explain women’s greater propensity to select “don’t know” and non-extreme responses. We return in a later section to a discussion of possible explanations for lower confidence levels among women.
Hypotheses
To examine the relationship between gender and political expression, we ask three questions and propose a series of six hypotheses, which we test using TRIP survey data. First, we ask whether there is a significant difference between men and women—that is, a gender gap—in political expression. Scholars have long tested this and related claims by comparing men’s and women’s responses to survey questions, in particular closed-ended questions that offer the response option, “don’t know.” Such questions provide a good measure of respondents’ willingness to answer questions. Thus, we propose the following hypothesis:
Hypothesis 1: Women will select the “don’t know” response option more often than men.
Second, we ask whether differing levels of political knowledge explain differences in political expression. If the reason for differences in men’s and women’s likelihood of answering questions is driven by differences in political information and knowledge, we would expect to see the gender gap narrow among more highly educated respondents within the public sample. Similarly, we would expect the effect to diminish or disappear within our sample of scholars, nearly all of whom hold a PhD in IR or political science and thus are highly knowledgeable about politics. If we were to continue to observe a significant disparity in “don’t know” responses among highly educated respondents, this pattern would suggest that the reason for differences in political expression lies in gendered differences in confidence, rather than knowledge.
Hypothesis 2: As education level increases, both women and men will select the “don’t know” response option less often.
Hypothesis 3: The gender gap in selection of “don’t know” responses will be substantially smaller among IR scholars than among the general public.
Some survey questions may require specialized types of political information or knowledge. When respondents possess such specialized knowledge in the form of regional and substantive expertise in the areas asked about, we should see respondents answer questions at higher rates. In fact, Sarsons and Xu (Reference Sarsons and Xu2015) find that the gender gap in political expression among economists disappears when they control for respondents’ areas of expertise. Similarly, we hypothesize that:
Hypothesis 4: The gender gap in selection of “don’t know” responses will be smaller among IR scholars with regional or substantive expertise relevant to the specific survey questions than among those without such expertise.
At the same time, even if the gender gap diminishes considerably when respondents have substantive or regional expertise, that will not provide definitive evidence for a knowledge-based explanation. Previous studies (Lizotte and Sidman Reference Lizotte and Sidman2009; Mondak and Anderson Reference Mondak and Anderson2004; Mondak and Davis Reference Mondak and Davis2001) suggest that women who have incomplete information may be less confident in their knowledge than men in the same situation, and less willing to guess, making them more likely to say they “don’t know” in the answer to a question. In other words, a smaller gender gap among scholars than the public supports a knowledge-based explanation, but it might also support a confidence-based explanation.
Third, we ask whether lower levels of confidence among women than men explain gender-based differences in the expression of political views. Selecting “don’t know” as a response to survey questions is one way that women or members of other demographic groups may exhibit differences in their willingness or ability to express political attitudes; failure to select extreme responses along a scale or continuum is another. If women lack the knowledge to answer a question, logic dictates that they would say they don’t know the answer. If they lack confidence in their knowledge of an issue, especially if they don’t want to risk an incorrect answer, they also may say they don’t know the answer. Further, on questions with scaled response options, they may decline to choose an extreme answer like “strongly agree” or “strongly disagree” and instead play it safe by selecting “agree,” “disagree,” or “neither/neutral.” We also directly ask respondents how confident they are in their answers. Together, the two measures of confidence—respondents’ propensity to select the extreme response options and expressed confidence in their answers—allow us to test the following two hypotheses:
Hypothesis 5: Regardless of educational level, among both the general public and IR scholars women will be less likely than men to select extreme response options.
Hypothesis 6: Regardless of educational level, among both the general public and IR scholars women will report lower levels of confidence than men in their responses to survey questions.
Data and Methods
To test these hypotheses, we use survey data collected by William and Mary’s TRIP Project between March 2014 and January 2023. These data include results from two types of surveys of IR scholars and two surveys of the general public. First, we use data from the 2014, 2017, and 2022–2023 faculty surveys, in which TRIP researchers sought to identify and survey all faculty members at colleges and universities in the United States who do research in the IR subfield of political science or teach IR courses. The overwhelming majority of respondents work in departments of political science, politics, government, social science, international relations, international studies, or in professional schools associated with universities.Footnote 6 Second, TRIP implements shorter, more frequent “snap polls,” using the same sample of IR scholars. Like the TRIP Faculty Survey, snap polls survey all IR scholars in the United States. For this study, we draw from six TRIP snap polls conducted in March 2015, June 2015, September 2015, February 2016, October 2018, and April 2021.Footnote 7
Finally, TRIP researchers teamed with the Wisconsin International Policy and Public Opinion (WIPPO) Project to conduct two surveys of the broader public. TRIP public opinion snap polls of the U.S. public were conducted in parallel with TRIP snap polls of IR scholars to understand how public and expert opinion compare on international issues. We include results from two snap polls of 1,000 Americans from an existing panel provided by Qualtrics that is representative of the U.S. public in terms of age, gender, and income. The surveys were conducted in June and August 2015 and include questions from IR Scholar snap polls 6 and 7.
We focus on three types of survey questions about foreign policy and international issues.Footnote 8 First, to understand whether women are less likely than men to express their attitudes about international politics, we examine questions that include a “don’t know” response option. We asked the same 12 “don’t know” questions of both the public and IR scholars and an additional 42 questions with a “don’t know” response option of IR scholars only, makings a total of 66 different survey questions, but only 54 unique questions, asked across all surveys.
Our independent variable is gender, which we expect to impact the dependent variable, frequency of selecting the “don’t know” response option.Footnote 9 In our regressions, we use an indicator variable for gender, in which men are coded as 0 and women are coded as 1.Footnote 10 For each question, we also generate an indicator variable for our dependent variable—“don’t know” responses—to indicate whether respondents chose “don’t know” (1) or any other response option (0). All missing responses are coded as missing and excluded from the analysis.
Second, to understand whether women are less likely than men to express extreme opinions, we examine data from members of the general public and IR scholars’ answers to questions with categorical and numerical response options. These include 54 questions with response options in the form of a Likert scale. For example, we asked respondents, “How capable are international health institutions of managing the spread of pandemic disease?” Response options included “Very incapable,” “Incapable,” “Neither capable nor incapable,” “Capable,” “Very capable,” and “Don’t know.” Of the 54 questions with categorical or Likert-scale response options, we asked two questions of both the public and scholar samples, one additional question of the public only, and 51 additional questions of scholars only. Again, our independent variable in these questions is gender. To measure our dependent variable—expression of extreme responses—we combine responses into a binary variable: 1 signifies “strongly agree” or “strongly disagree” (or the equivalent phrasing for any particular question), and 0 signifies all other response options (such as “agree,” “disagree,” or “neither agree nor disagree”).
In addition to questions with categorical responses, we include 11 similar questions with numerical responses. For example, we asked, “How likely is war between the United States and North Korea over the next decade?” and we asked respondents to answer on a scale of 0 to 10 “with 10 indicating that war will definitely occur and 0 indicating that war will definitely not occur.” We asked two numerical response option questions of both samples, two questions of the public only, and three of only the IR scholars. Our independent variable is gender. To measure our dependent variable on these questions, we again combine responses into a binary variable. For questions with a 0 to 10 response scale, we categorize 0 to 2 and 8 to 10 as extreme responses. We convert responses on 0 to 100 scales to the 0 to 10 scale.Footnote 11
Finally, to explore whether women express less confidence than men in their answers to survey questions, we also directly asked respondents about their confidence levels. These questions take one of two forms. First, we embedded ten follow-up questions, two of which we asked of both the public and faculty. In each of the ten questions, we asked respondents to “indicate your level of confidence in your previous answer.” These questions had either categorical or numerical response options. Second, we asked six questions about respondents’ confidence about a particular causal relationship or the likelihood of a specific outcome. For example, we asked respondents, “How confident are you that the ‘nuclear taboo’—domestic and international norms against using nuclear weapons—constrains countries such as [Russia and China, the United Kingdom, and France] from using nuclear weapons in a first strike?” All these questions had categorical response options. In the case of the “nuclear taboo” question, for instance, response options included “Very confident,” “Somewhat confident,” “Not very confident,” “Not very confident at all,” and “Don’t know.” Our independent variable is again gender, and our dependent variable is the respondent’s self-reported level of confidence in their answer. Eight confidence questions use Likert scale response options, and eight use numerical ordered responses to measure the dependent variable. We again combine responses into a binary variable and convert all numerical responses to a 0 to 100 scale.Footnote 12
We examine the independent and moderating effects of several additional variablesFootnote 13 in our analyses of responses to these four types of survey questions:
-
• Age: Some students of the effects of gender on political expression (Rapoport Reference Rapoport1982; Reference Rapoport1985) suggest that women are socialized to be less confident or not to express opinions on political issues. If this is true, we should see differences in women’s and men’s relative willingness to select certain response options, depending on when they came of age and were socialized on political issues. We measure age using respondents’ self-reported answers.
-
• Rank: Similarly, we may see changes over time in individual scholars’ knowledge and confidence, making them more or less willing to select particular response options. For this reason, we include scholars’ rank in our analysis. Values for this variable were collected using data gathered through self-identification and web searches,Footnote 14 and the results have been aggregated into four categories: full professor, associate professor, assistant professor, and non-tenure track faculty.
-
• Education: Education provides one possible measure of knowledge, a major explanation for the gender gap in political expression. At the same time, a central part of our analysis hinges on the impact of knowledge, which can moderate the effects of gender on willingness to express political attitudes. Based on self-reported data, we created the variable—highest degree completed. For scholars, this variable takes one of two values, PhD or other. For members of the public it takes one of the following values: no schooling completed; some schooling, but did not graduate from high school; high school graduate or equivalent (GED); some college, but did not complete a bachelor’s degree; bachelor’s degree (BA/BS); master’s degree (MA/MS/MBA, etc.); or medical (MD), law (JD), or other doctorate degree (PhD).
-
• Question scope: For related reasons, we also include the scope of the survey question asked—that is, the range of knowledge required to answer the question. We code the question as narrow if it asks about a specific policy or issue or broad if it references general political themes or ideas.
-
• Question category: We include the type of question asked in our analyses, since different categories of questions require the respondent to engage in different types of analysis. All questions, regardless of category, ask for respondents’ attitudes or opinions, but different questions ask for different types of opinions. Questions are coded as analytical if they call for relatively objective, fact-based assessments—that is, they ask respondents to use their knowledge to inform their understanding of events or issues. An example of an analytical question we asked is:
The United States is negotiating a free trade agreement with twelve Pacific nations called the Trans-Pacific Partnership (or TPP). Do you support or oppose this free trade agreement?
We coded questions as normative if they ask for a more subjective, opinion-based assessment. The following is an example:
Would Greece be better off if it stopped using the Euro as its currency?
Finally, questions are coded as predictive if they require respondents to make judgments about possible future outcomes. An example is:
How likely is war between the United States and China over the next decade? Please use the 0 to 10 scale with 10 indicating that war will definitely occur and 0 indicating that war will definitely not occur.
-
• Research area of expertise: Given the primary role of knowledge levels as a potential explanation for the gender gap, we look at the effects of two particular types of knowledge or expertise. The first is IR scholars’ self-reported research area. Respondents selected their area of expertise from a list of 20 response options,Footnote 15 but we code this as a binary variable with a value of 1 if the respondent’s area is the same as that asked about in the question or 0 if it is not. Each question can address up to three research areas.
-
• Region of expertise: The second type of knowledge included is regional expertise. Respondents selected their region of study from a list of 16 options,Footnote 16 but we again code this type of knowledge as a binary variable depending on the respondent’s regional expertise and the content of the question. Each question can address up to three regions.
-
• Race: We include respondents’ race using self-reported data. Because respondents were allowed to select multiple responses to this question and because there are too few observations in most non-white categories to report the data without compromising respondents’ identity, we aggregate responses into three categories: “White” (if the respondent selected only the “White” response option), “Nonwhite” (if the respondent selected one or more responses other than “White"), and “both White and Nonwhite” (if the respondent selected “White” and at least one other response option).
Regardless of the hypothesis being tested, we begin our analysis by conducting an Ordinary Least Squares (OLS) regression to estimate the relationship between our dependent variable and gender, our primary independent variable. In all but two cases,Footnote 17 we transition to a Probit model to examine the effect of gender on a nonbinary dependent variable. When the dependent variable is binary, we run the Probit regression with only the dependent variable and the primary independent variable. For simplicity, in short, we initially focus on the main effect of gender across the whole sample. Subsequently, we allow the effect of gender to vary as a function of a number of demographic and other variables discussed earlier. This allows us to explore the potential for gender to have heterogeneous effects across different demographic groups and other factors. Finally, we estimate marginal effects for the Probit models to show how changes in the independent variable affect the probability of the binary outcome.Footnote 18 Because respondents answered multiple questions within the same survey and the majority of faculty respondents (53.01% of women and 59.16% of men) answered more than one faculty survey, the responses are not independent. For this reason, we cluster at the respondent level in both the regression and marginal effects models.
Results
We divide our analyses into two sections. In the first, we explore whether there is a gap in political expression between men and women. Does such a gap exist among the general public? Among IR scholars? And can knowledge explain the existence of the gender gap in political expression? In the second section, we ask whether the gap is better explained or also explained by gendered differences in confidence.
Is There a Knowledge Gap?
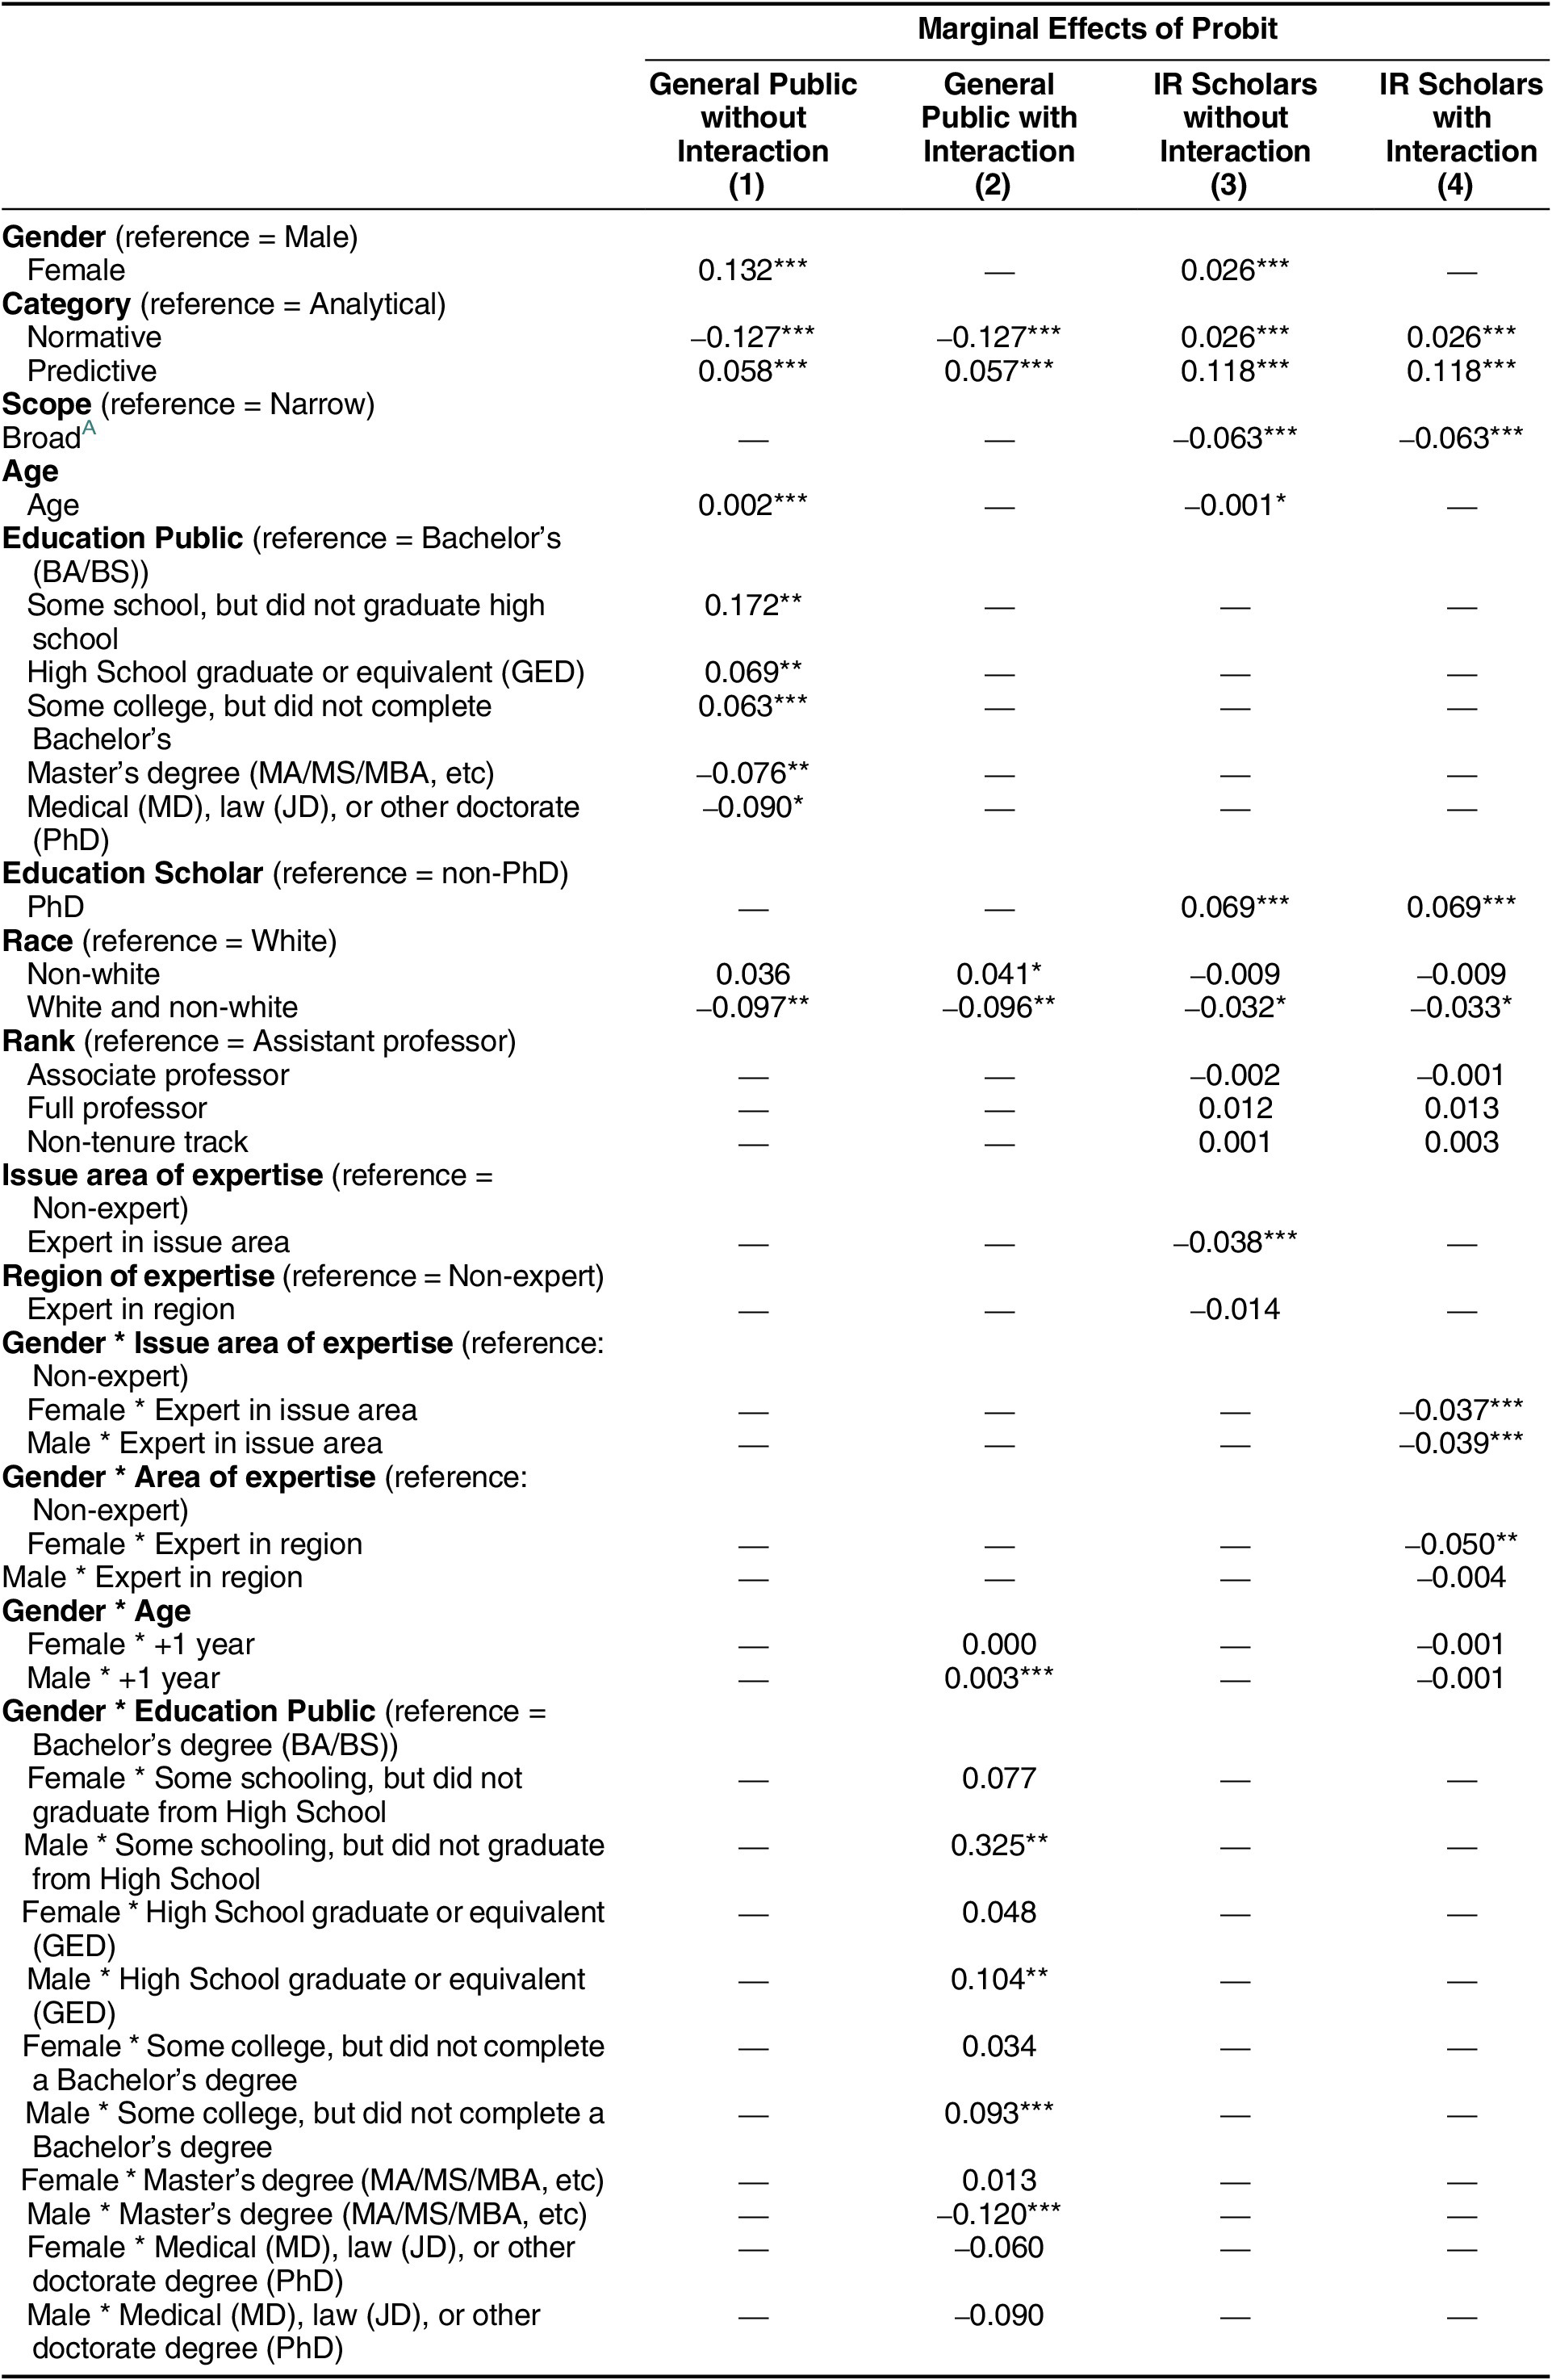
To determine whether women are less likely than men to express their political views, we compare the rates at which male and female respondents select the “don’t know” response option on survey questions. Consistent with the findings of previous studies and hypothesis H1, we find evidence of a gender gap among members of the general public. Across the two 2015 public opinion surveys, we find that female respondents chose “don’t know” 41% of the time that they were offered this option, compared to only 27% among male respondents. Even when we control for race, question category, education level, and age of respondents, as the marginal effects model reported in table 2 shows, we find a statistically significant relationship between gender and the propensity to select the “don’t know” response: women are 13.2 percentage points more likely than men to say they don’t know the answer to a question.
Summary of hypotheses
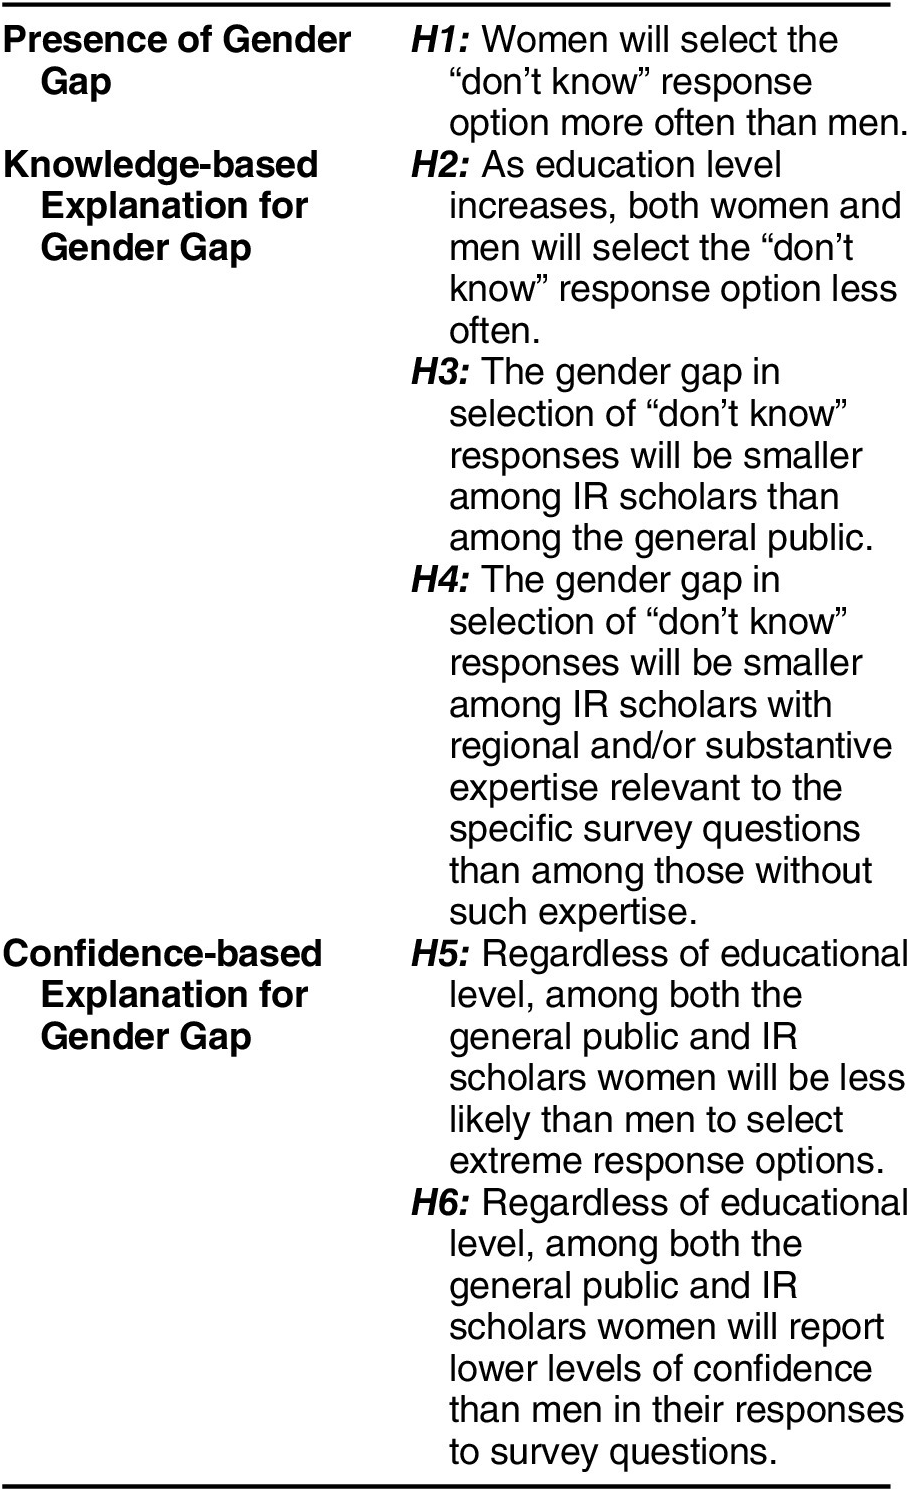
What explains this gender gap within the general public? To test whether different levels of political knowledge explain the gender gap, we ask whether the propensity to select the “don’t know” response option to survey questions varies with education, as hypothesis H2 suggests. We find that respondents who have some schooling but did not graduate from high school selected “don’t know” 49.7% of the time they were offered that option. The percentage of respondents who said they don’t know the answer declined with each increment of education; respondents with a medical, law, or other doctorate degree chose “don’t know” only 19.8% of the time.
The model of the marginal effects of gender on the propensity within the public sample to select the “don’t know” response parallels these descriptive statistics, as table 2 shows. Age has a small but statistically significant effect in the predicted direction—increasing age slightly increases the likelihood that a respondent will select “don’t know”—as does race.Footnote 19 Question category also matters: members of the public are considerably less likely to say they don’t know the answer to a normative question, and somewhat more likely to select “don’t know” on a predictive question, compared to an analytical query.
Marginal effects: Probability of selecting “I don’t know” among the general public and IR scholars
Notes:
A All questions asked of the public had the same scope—narrow.
*p < 0.1; **p < 0.05; ***p < 0.01
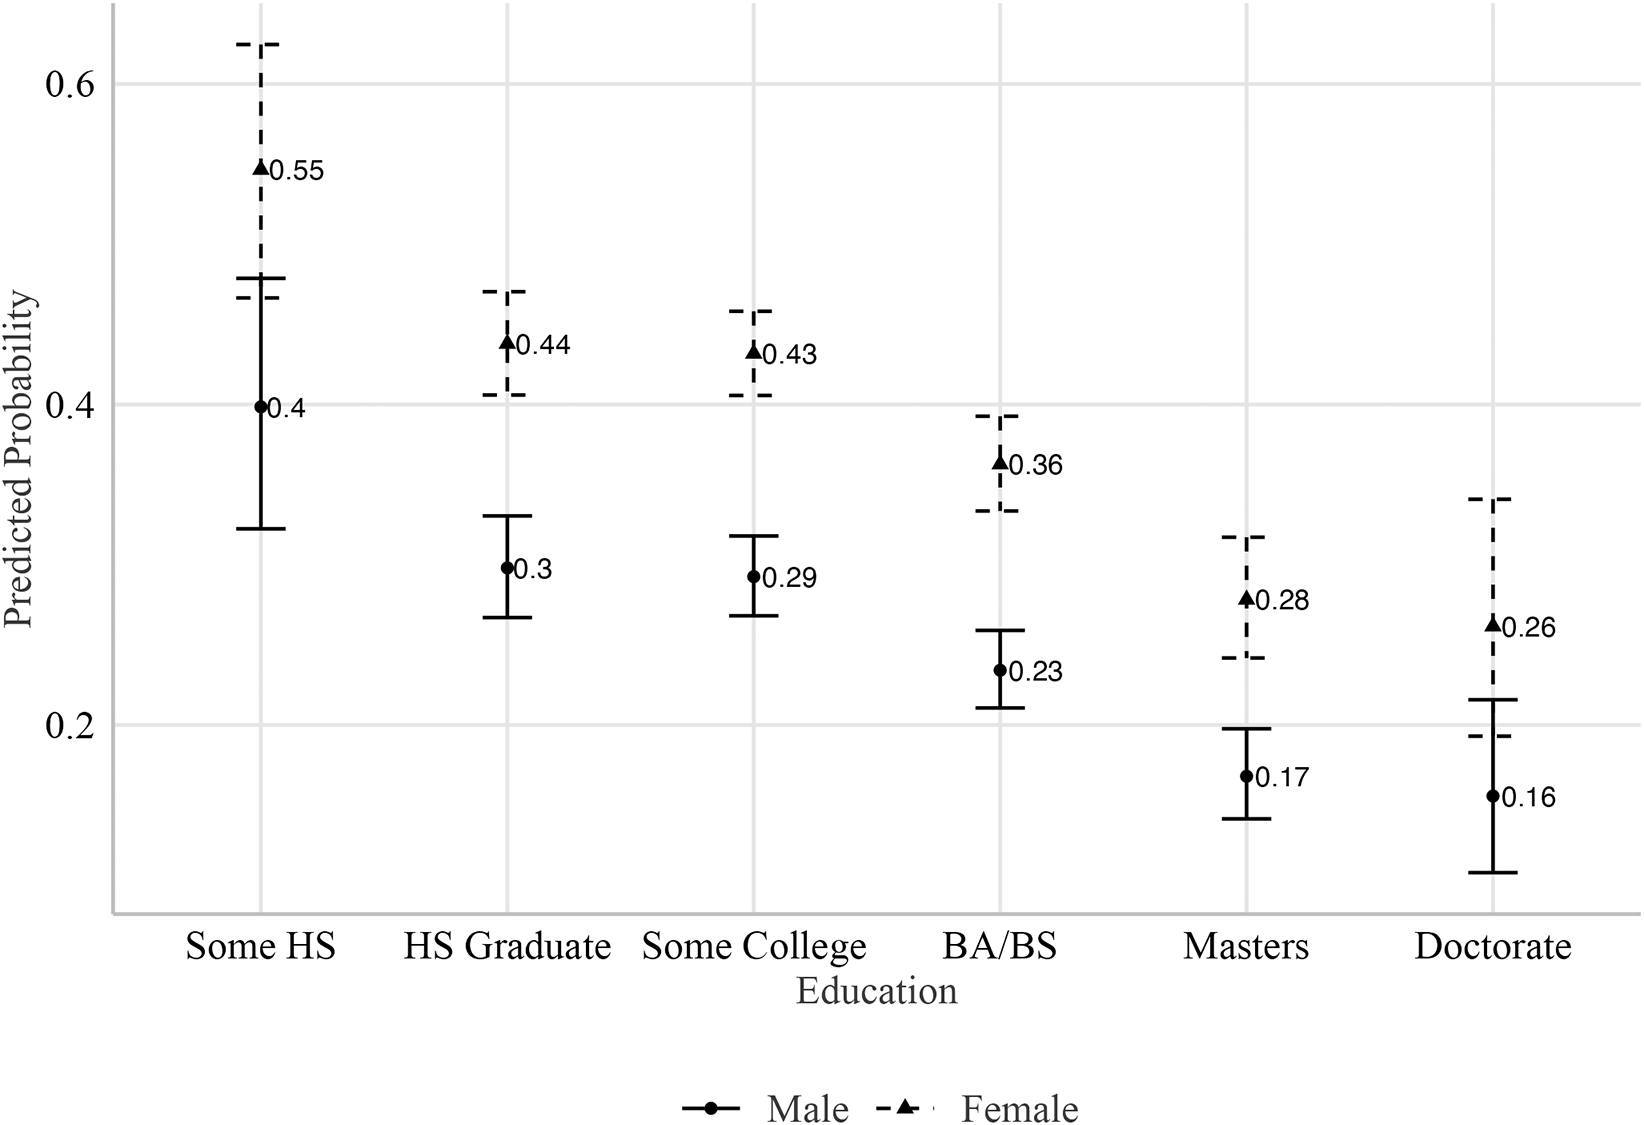
To visualize the relationship between education and don’t know responses by gender among the public, figure 1 shows the predicted probability that members of the public will answer “I don’t know.” Education lowers the probability of a respondent selecting “I don’t know,” but across all education levels women are more likely than men to respond that they don’t know the answer. In fact, women with a college degree are expected to say don’t know 36% of the time, while men with a high school degree but no college say they don’t know only 30% of the time they are asked survey questions. The difference is statistically significant.
Probability of Answering Don’t Know, Public Sample
The model from which these estimates are drawn also includes age, category, and race variables, clustered at the respondent level.
We find additional support for the proposition that knowledge and education matter when we compare the public and scholar samples. Consistent with hypothesis 3, we find a substantially larger gender gap within the general public than among IR scholars. Female scholars are 2.6 percentage points more likely than their male counterparts within the academy to say they don’t know the answer to a question, as table 2 shows, while this same gap is 13.2 percentage points within the general public. The evidence for hypothesis 3 is strong—the gender gap in selection of “don’t know” responses is smaller among IR scholars than among the general public—but a statistically significant gap remains between male and female academics. This finding holds even when we control for the effects of question category and scope, age, education, race, issue area expertise, and regional expertise.
When we combine the public and elite samples, we again see that knowledge, measured by education matters.Footnote 20 As table 3 shows, being a scholar has a significant and large negative effect on the likelihood that a respondent answers “don’t know”: IR scholars were 7.8 percentage points less likely to select this option than their counterparts within the general public. The combined sample also shows that predictive questions are more likely than analytical questions to elicit a “don’t know” response, suggesting that respondents may feel less comfortable making a guess, even an educated one, about future events. Broad questions are less likely than narrowly constructed questions to elicit a “don’t know” response in both the scholar and combined samples. Finally, we interact our independent variable—gender—with the sample variable, which represents education level. Here, we find that being a female scholar has a significant negative effect on the selection of the “don’t know” response option when compared to being a member of the public. In other words, female scholars are less likely than members of the general public to say they don’t know the answer to a survey question, even if they are more likely than their male colleagues within the academy to do so.
Marginal effects: Probability of selecting “I don’t know” in the combined sample
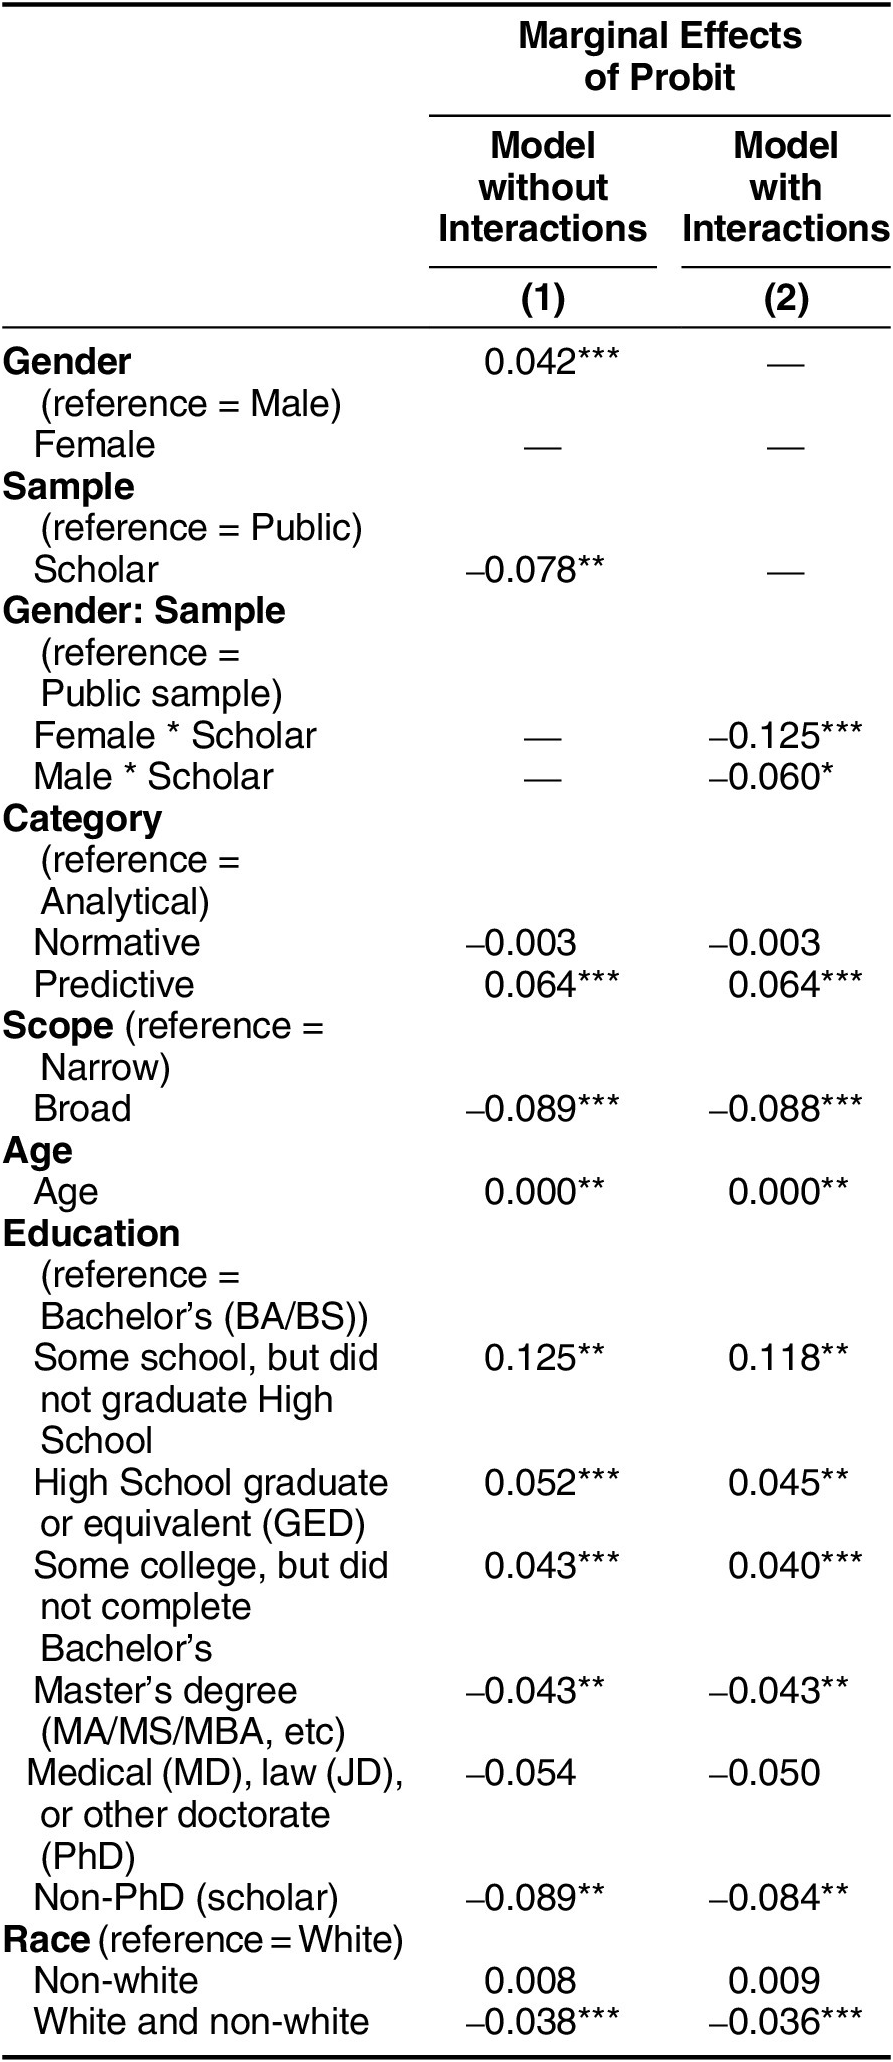
Note: *p < 0.1; **p < 0.05; ***p < 0.01
To further explore the question of whether variation in knowledge about international relations explains political expression, we consider the effects of scholars’ regional and substantive expertise on their likelihood of saying “don’t know.” As we see in table 2, even after controlling for these types of expertise women are 2.6 percentage points more likely than men to say they don’t know the answer to a survey question. The gender gap, in other words, does not diminish or disappear, as Hypothesis 4 predicted. Interestingly, and again contrary to Hypothesis 4, the gap between male and female IR scholars on the “don’t know” issue is nearly unchanged from its size (1.9 percentage points) before controlling for expertise.Footnote 21 This finding contrasts with previous work (Sarson and Xu 2015), which suggests that differences in the area of expertise account for differences in political expression among academics.
In sum, we find ample support for the presence of a gender gap in political expression and a significant but incomplete role for knowledge in explaining that gap. Consistent with Hypothesis 1, we see a relatively large difference within the general public between men and women in their propensity to say they don’t know the answer to survey questions. We also find that the gender gap among the public narrows as education increases (Hypothesis 2) and is considerably narrower among highly educated IR scholars than among the general public (Hypothesis 3). That gap persists, however, even when we consider the effects of regional and substantive expertise (Hypothesis 4). Highly knowledgeable women who share relatively equal educational levels with their male colleagues tend to select “don’t know” on surveys about international issues considerably less often than women in the general public. Even when they possess specific expertise and educational training relevant to the particular questions asked, however, they continue to say they don’t know the answer at higher rates than their male colleagues. In short, knowledge matters, but it most likely is not the only explanation for gender-based differences in political expression.
Is There a Confidence Gap?
Thus far our results provide evidence that factors other than knowledge drive differences in political expression between men and women. Gender-based differences in confidence provide a potentially important alternative explanation. To the extent that highly educated women are less likely to share their political ideas and opinions, it is possible that it is because they are less confident. We conduct two additional tests that support such an explanation. First, as Hypothesis 5 suggests, if women are less confident of their knowledge or abilities than men, they should be less likely to select extreme response options, such as “strongly agree” rather than “agree,” regardless of educational level. This gender gap, in other words, should exist within both the public and scholar samples. Second, if women’s lack of confidence helps explain their lower rates of political expression, we should see a disparity between men and women in both samples in their self-reported confidence in their answers to survey questions (Hypothesis 6).
To explore patterns in the selection of extreme responses among IR faculty, we asked questions with ordered response options (table 4) and numerical scale response options (table 5) of both the public and scholar samples, although we had no preconceived expectations of differences across the two types of questions. Again, we control for question category,Footnote 22 as well as respondents’ age, education, and race. We also control for the type of response options (four- or five-point scale with or without a “don’t know” option).
Marginal effects: Probability of selecting an extreme answer among the general public and IR scholars (ordinal response questions only)
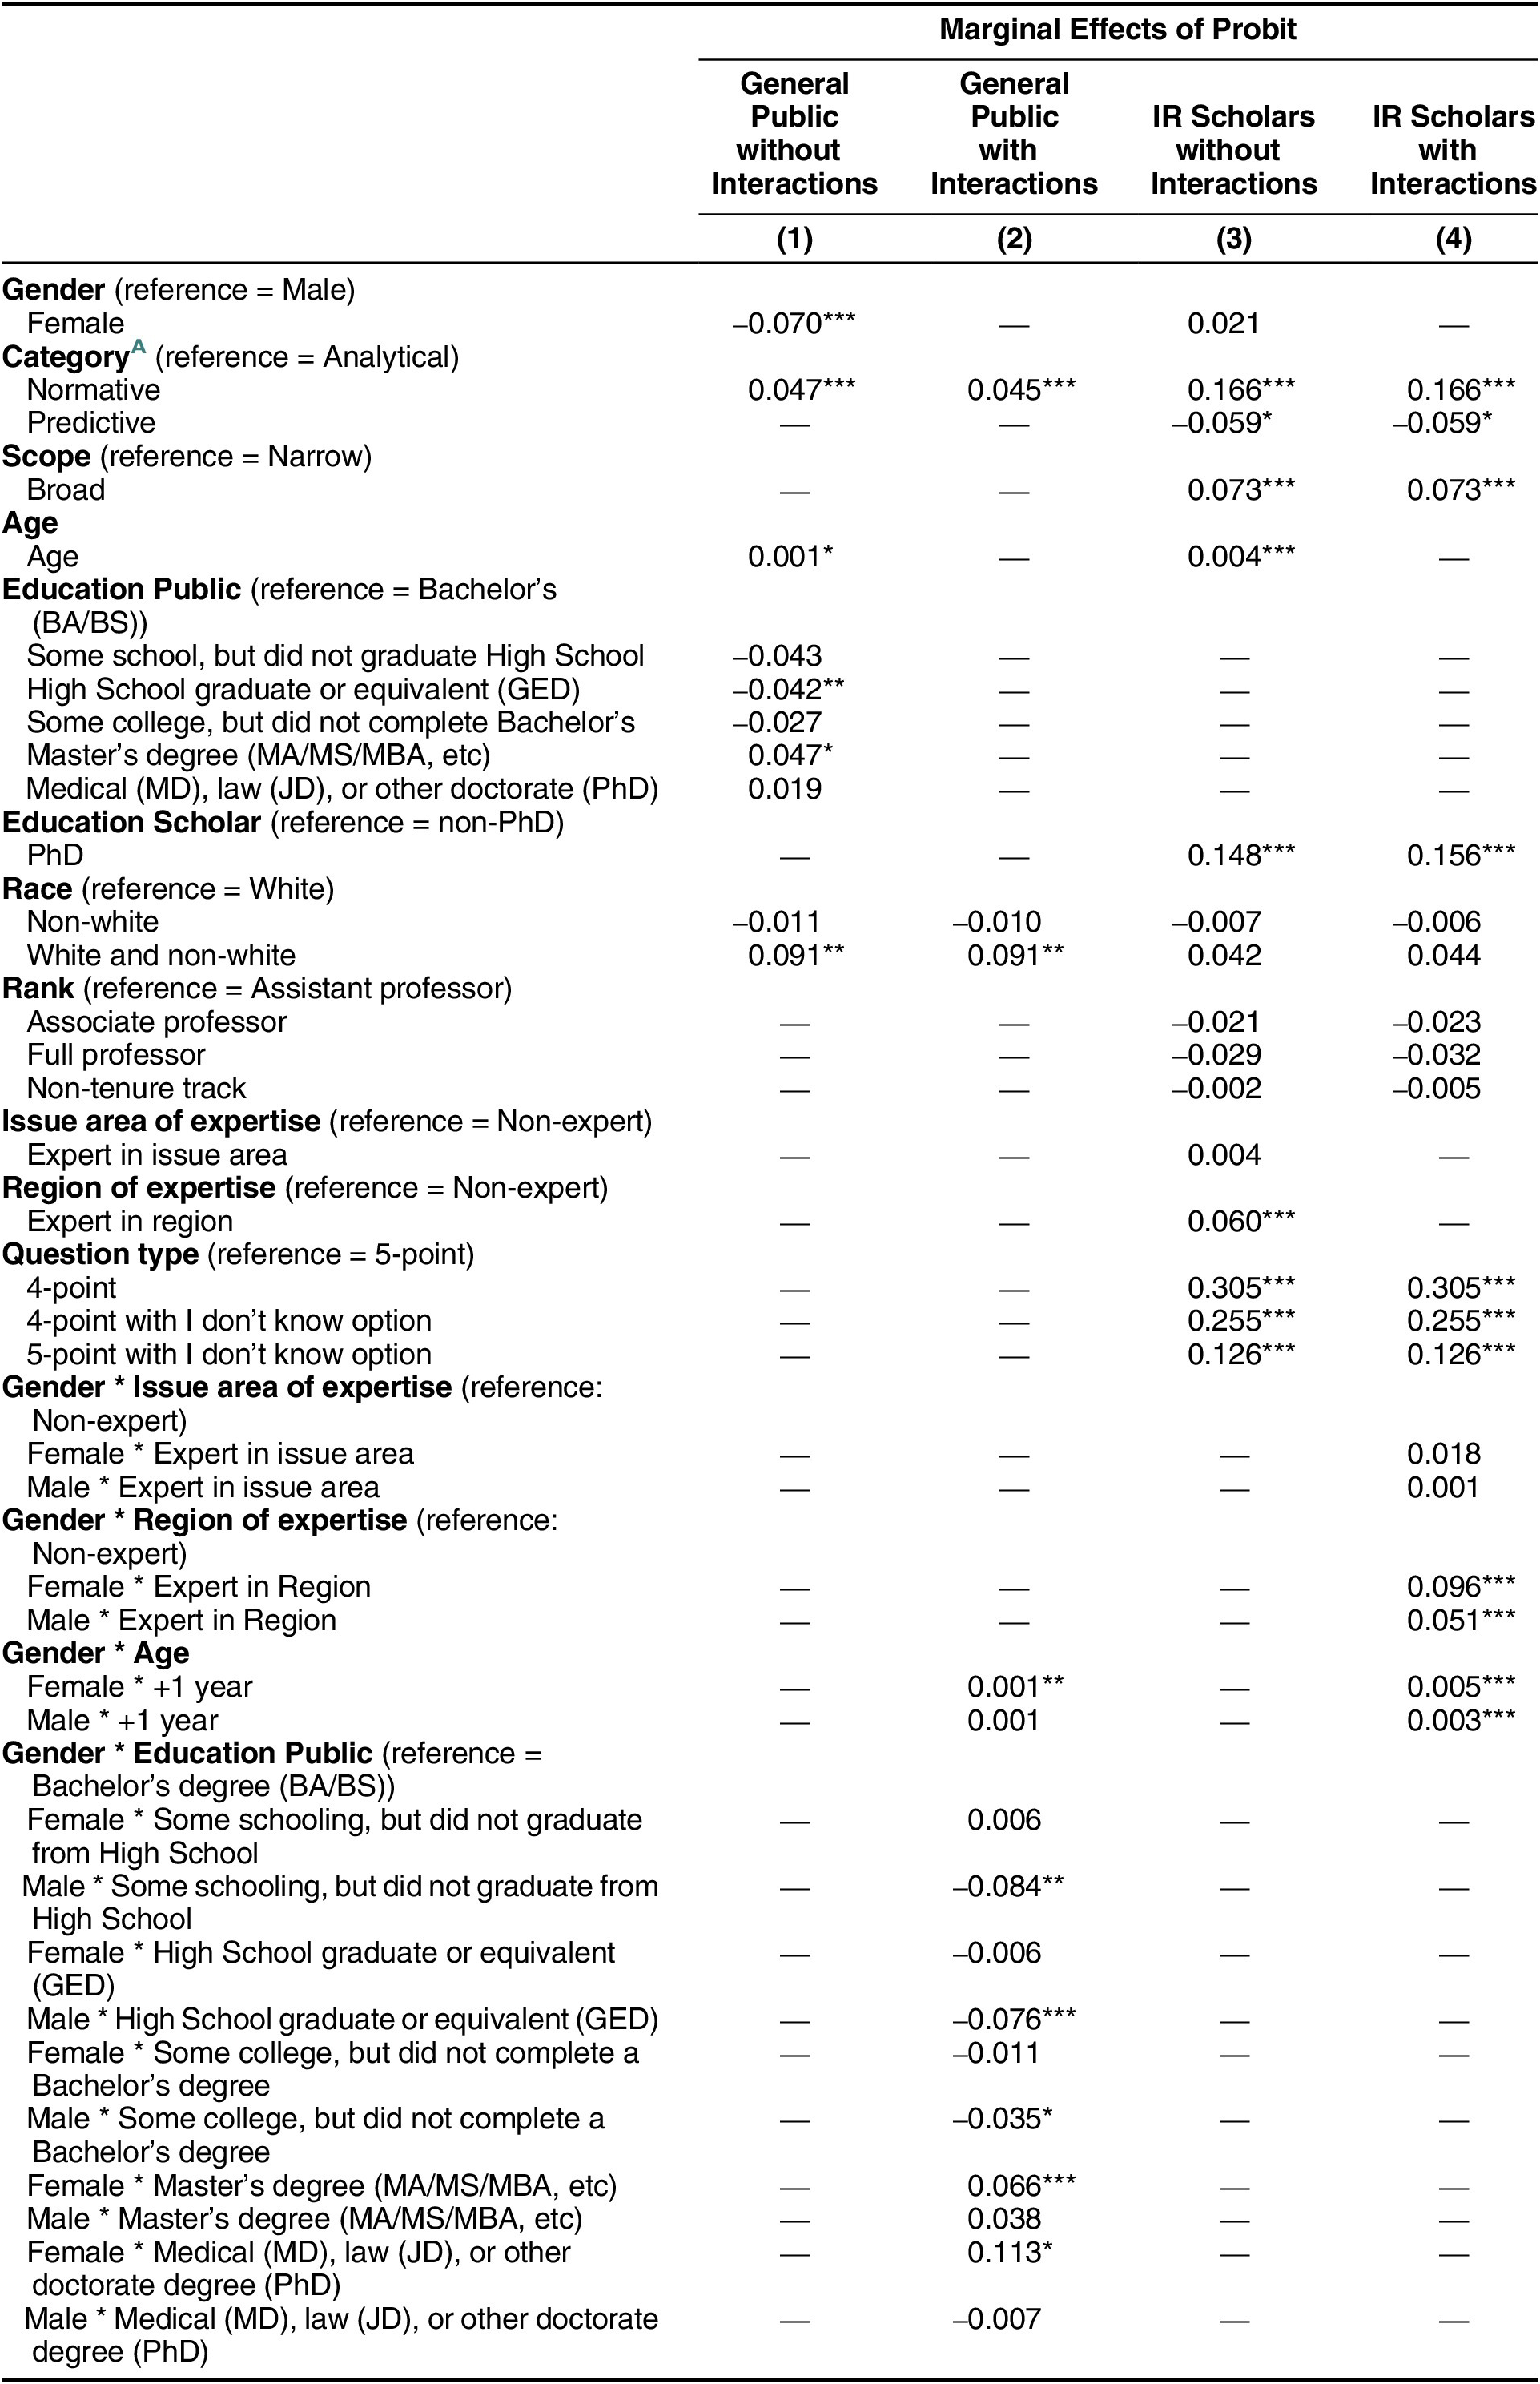
Notes:
A We didn’t ask any predictive questions of the public. Moreover, the category (normative, analytical, or predictive) co-varies perfectly with question type (ordinal or numerical scale responses) in the questions with extreme response options asked of the public, so it is impossible to know which variable is doing the causal work.
*p<0.1; >**p<0.05; >***p<0.01
Marginal effects: Probability of selecting an extreme answer among the general public and IR scholars (numerical response questions only)
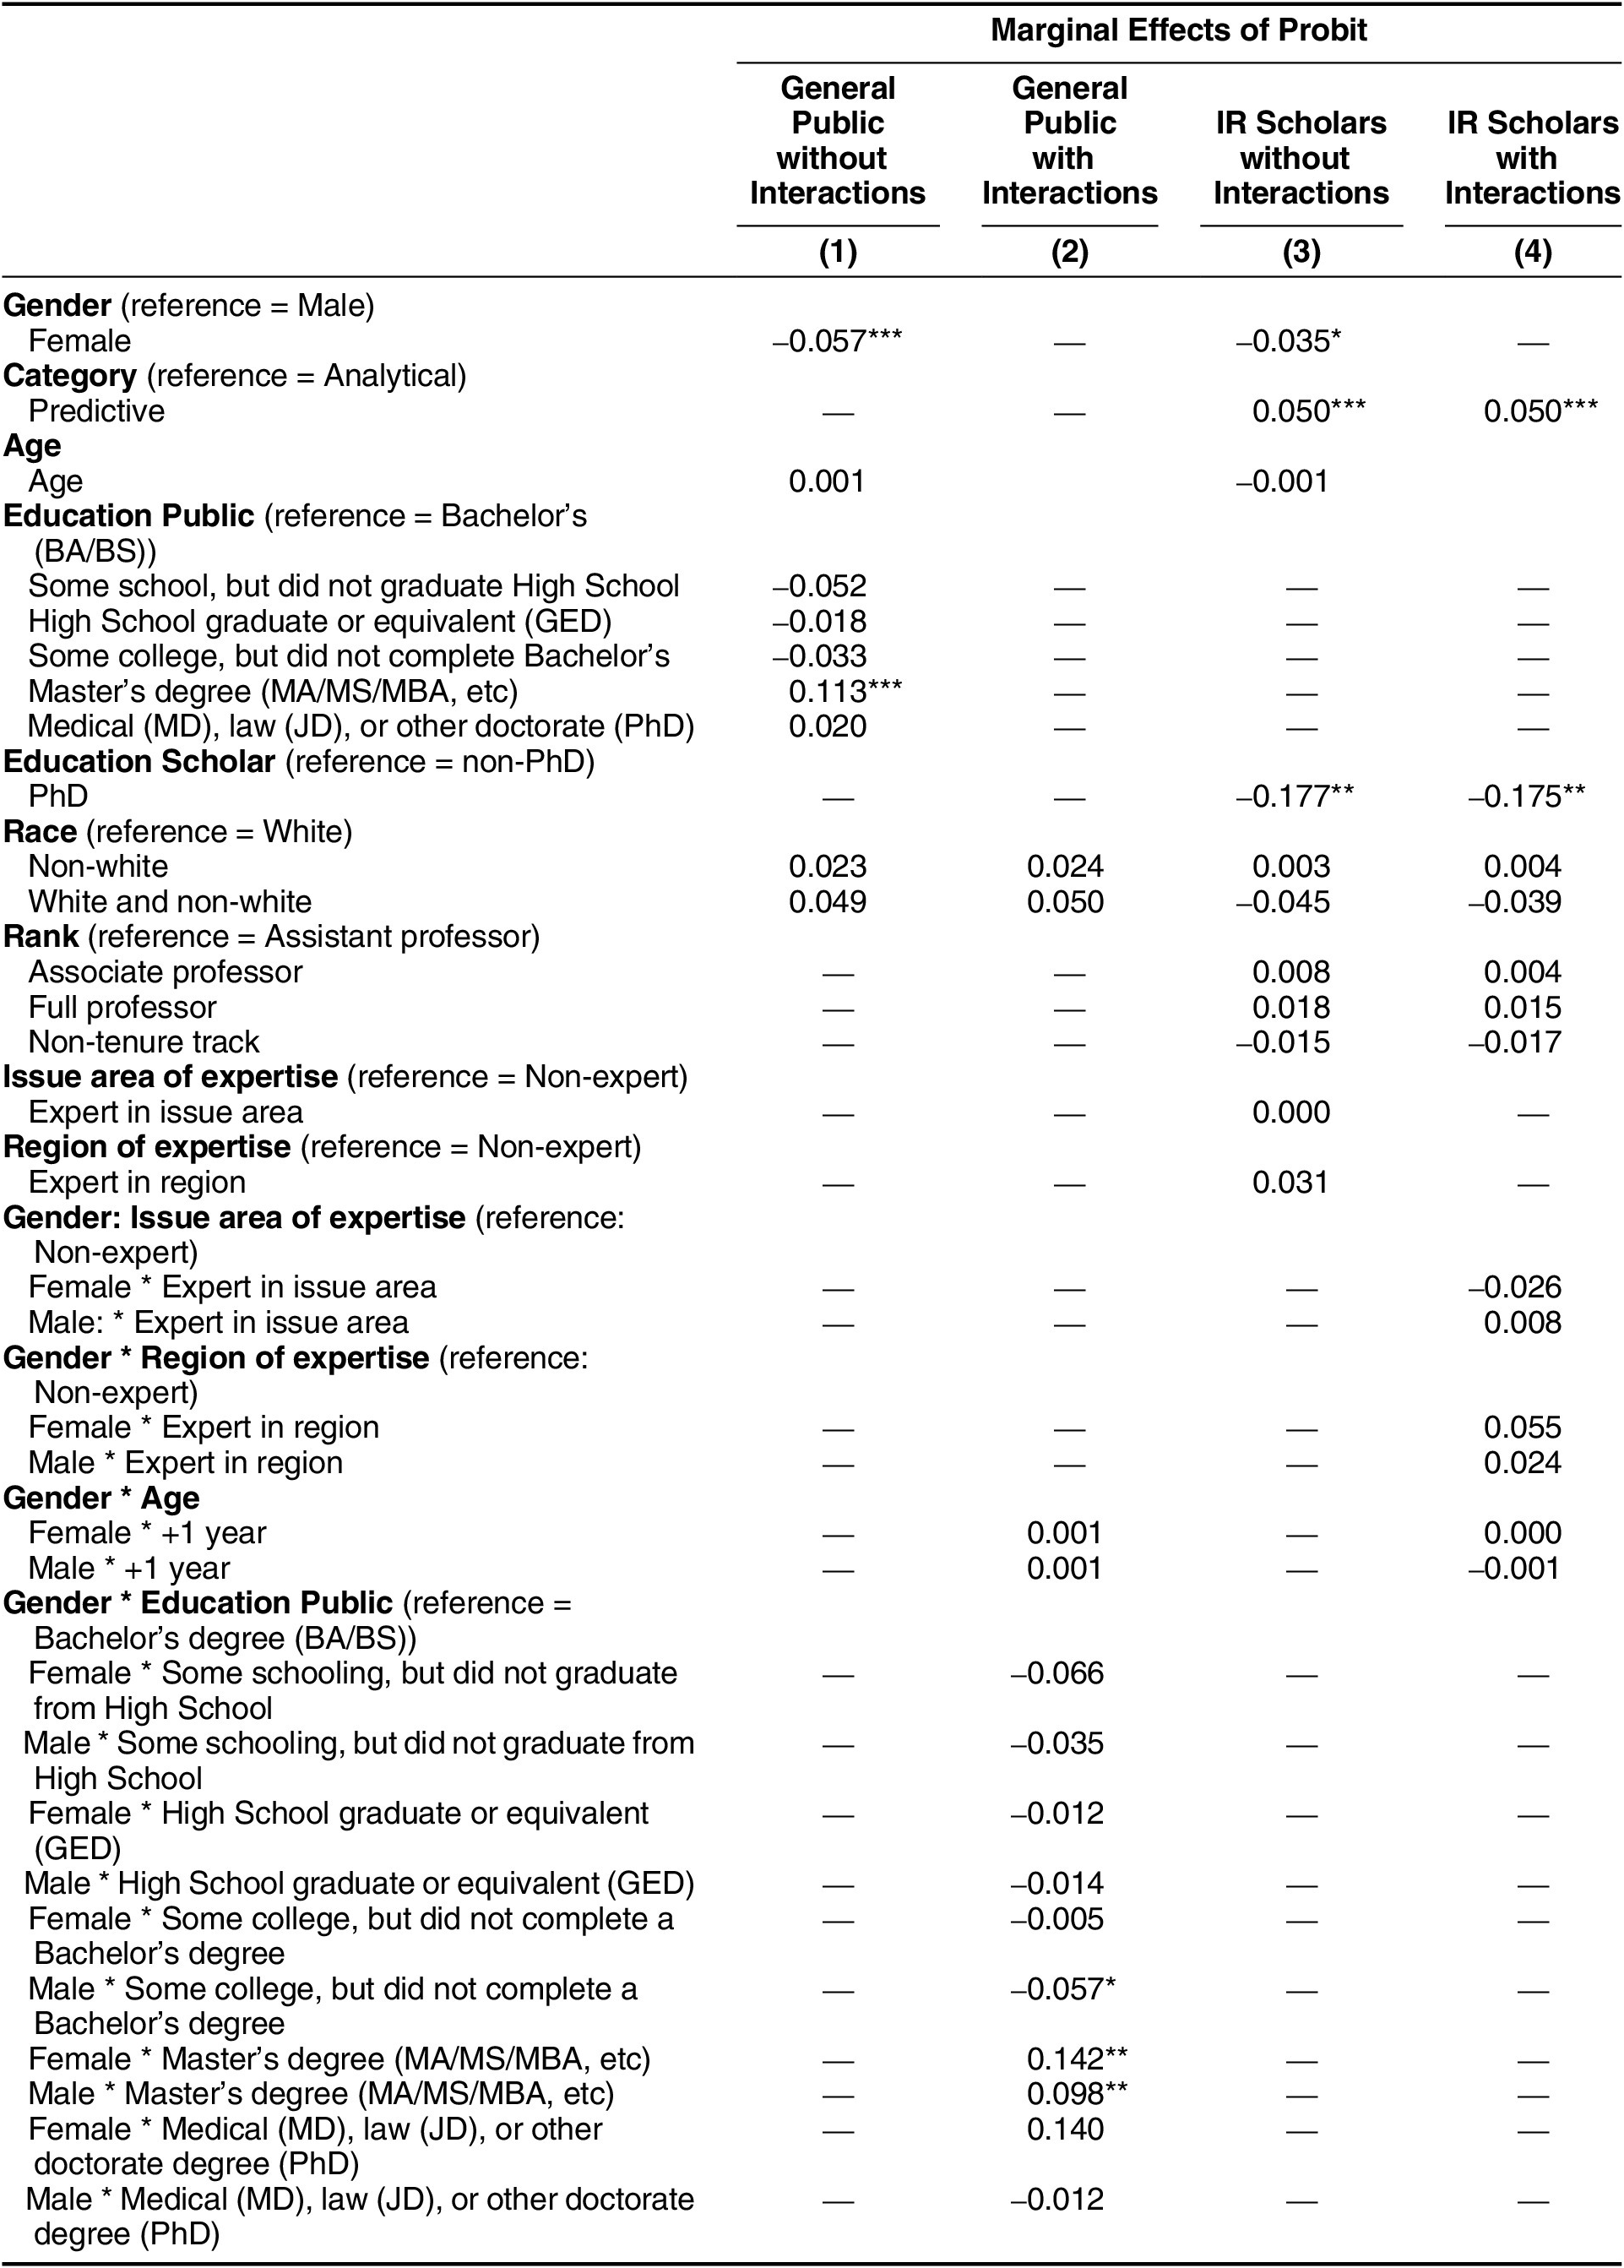
Note: *p < 0.1; **p < 0.05; ***p < 0.01
As table 4 shows, our results in the ordinal response questions differ slightly from those in the “don’t know” questions described above. For the public, we find similar results to those reported earlier: women are 7 percentage points less likely to select an extreme response when controlling for all other factors, as predicted by Hypothesis 5. Age has a significant, but small, impact, but not in the direction we might expect based on Rapoport’s (Reference Rapoport1982, Reference Rapoport1985) findings in his analysis of “don’t know” responses; increasing age slightly increases the likelihood that a respondent will select an extreme response. The effects of education are mixed, although high school graduates are 4.2 percentage points less likely than college graduates to select an extreme response. Among scholars, unlike the public, women are 2.1 percentage points more likely than men to choose an extreme response, but the relationship is not statistically significant. Female scholars are considerably more comfortable staking out an extreme response than are women in the general public, but contrary to Hypothesis 5, they are not less likely than their male colleagues to select extreme answers.Footnote 23 Our findings here, while inconsistent with our hypothesis, are consistent with Batchelor and Miao’s (Reference Batchelor and Miao2016) study of the literature on extreme response styles in which they report that women are slightly more likely than men to exhibit an extreme response style.
Among the control variables included in the model using the scholar sample, we find that question category has a strong influence: IR scholars are 16.6 percentage points more likely to provide an extreme response on normative questions, compared to analytical ones.Footnote 24 Questions with a 5-point scale without “don’t know” response options are least likely to elicit an extreme response, probably because respondents have more neutral options from which to choose. Expertise also matters: respondents with region-specific knowledge are 6 percentage points more likely to select extreme responses. Issue-specific knowledge has a much smaller and statistically insignificant impact. Nevertheless, combining the samples confirms the importance of gender in explaining respondents’ propensity to select extreme responses, and a comparison of the two samples highlights the power of education to substantially close that gap. When we interact gender with age, we see that age has a slightly greater impact for women than men. Similarly, we find that female scholars with a regional expertise in the area that the survey question asks about are 9.6 percentage points more likely than non-experts to select an extreme response, while male experts are 5.1 percentage points more likely.
The results for numerical scale responses differ slightly from those with categorical ordinal responses, as table 5 shows. Within both the public and scholar samples, women are less likely than their male counterparts to select an extreme answer, as predicted by Hypothesis 5. Among the public, the results are similar to those for the questions with ordered responses: women are 5.7 percentage points less likely than men to select an extreme response on a numerical scale. Among the scholar sample, though, and in contrast to the findings for the ordinal responses, women are 3.5 percentage points less likely than their male colleagues to select a numerical extreme response.Footnote 25 In addition to offering confirming evidence for Hypothesis H5, this finding runs counter to Batchelor and Miao’s (Reference Batchelor and Miao2016) conclusion that women are slightly more likely than men to provide extreme responses. Our finding is consistent, however, both with work on extreme response styles among academic elites (Sarsons and Xu Reference Sarsons and Xu2015) and with Batchelor and Miao’s (Reference Batchelor and Miao2016) conclusion that the literature, while finding a slight tendency among women toward an extreme response style, is contradictory.
Although our data do not allow us to explain the different response patterns for the ordinal and numerical response questions, we can speculate. When presented with numerical response options, women in both the public and scholar samples act as predicted: they are less likely than men to choose an extreme response. When answering a categorical or ordinal response question, however, female scholars (but not female members of the public) are more likely to select an extreme response. The difference might be explained by the fact that numerical response options, whether on a 0-to-10 or 0-to-100 scale, require or appear to require a greater level of specificity than ordinal response options, and include more “safe,” mid-range response options that allow respondents to express their views within the bounds of uncertainty. For this reason, if respondents lack confidence in their knowledge of the question’s subject matter, they may find it more difficult to choose an answer within the extreme parts of the numerical range than if there were fewer response choices.
For both the ordinal Likert and numerical scale responses, when we combine samples, we find that being a scholar has a positive effect on the likelihood of selecting an extreme response, as we would expect. As table 6 shows, IR scholars are 4.8 percentage points (not statistically significant) more likely for numerical scale questions and 8.8 percentage points more likely (statistically significant) for ordinal responses than the public to select extreme answers. This probably is because both male and female scholars have greater confidence in their ability to stake out strong positions due to their greater education and expertise. For both the ordered and numerical scale response questions, in fact, the interaction effect of gender and the sample shows that female scholars are more likely than members of the general public to select extreme response options, although again the results for the numerical scale questions are not statistically significant. Being a scholar, in short, may counteract the disparity between men’s and women’s habits of political expression.
Marginal effects: Probablility of selecting and extreme answer among the combined sample

Note: *p < 0.1; **p < 0.05; ***p < 0.01
Finally, we studied men’s and women’s self-reported confidence. We embedded questions in our surveys of both IR scholars and the general public that asked respondents to identify their level of confidence in either their answer to a previous question or their answer about a particular causal relationship or scenario. In three questions, we asked members of the public to gauge their confidence in their answer to the previous question using an 11-point numerical scale (0 to 10). We find a statistically significant difference between men and women in average levels of confidence. On average, women report a confidence level 0.44 points lower than men, when controlling for scope, age, education, and race, as table 7 shows.
Confidence levels among the IR scholars and the general public
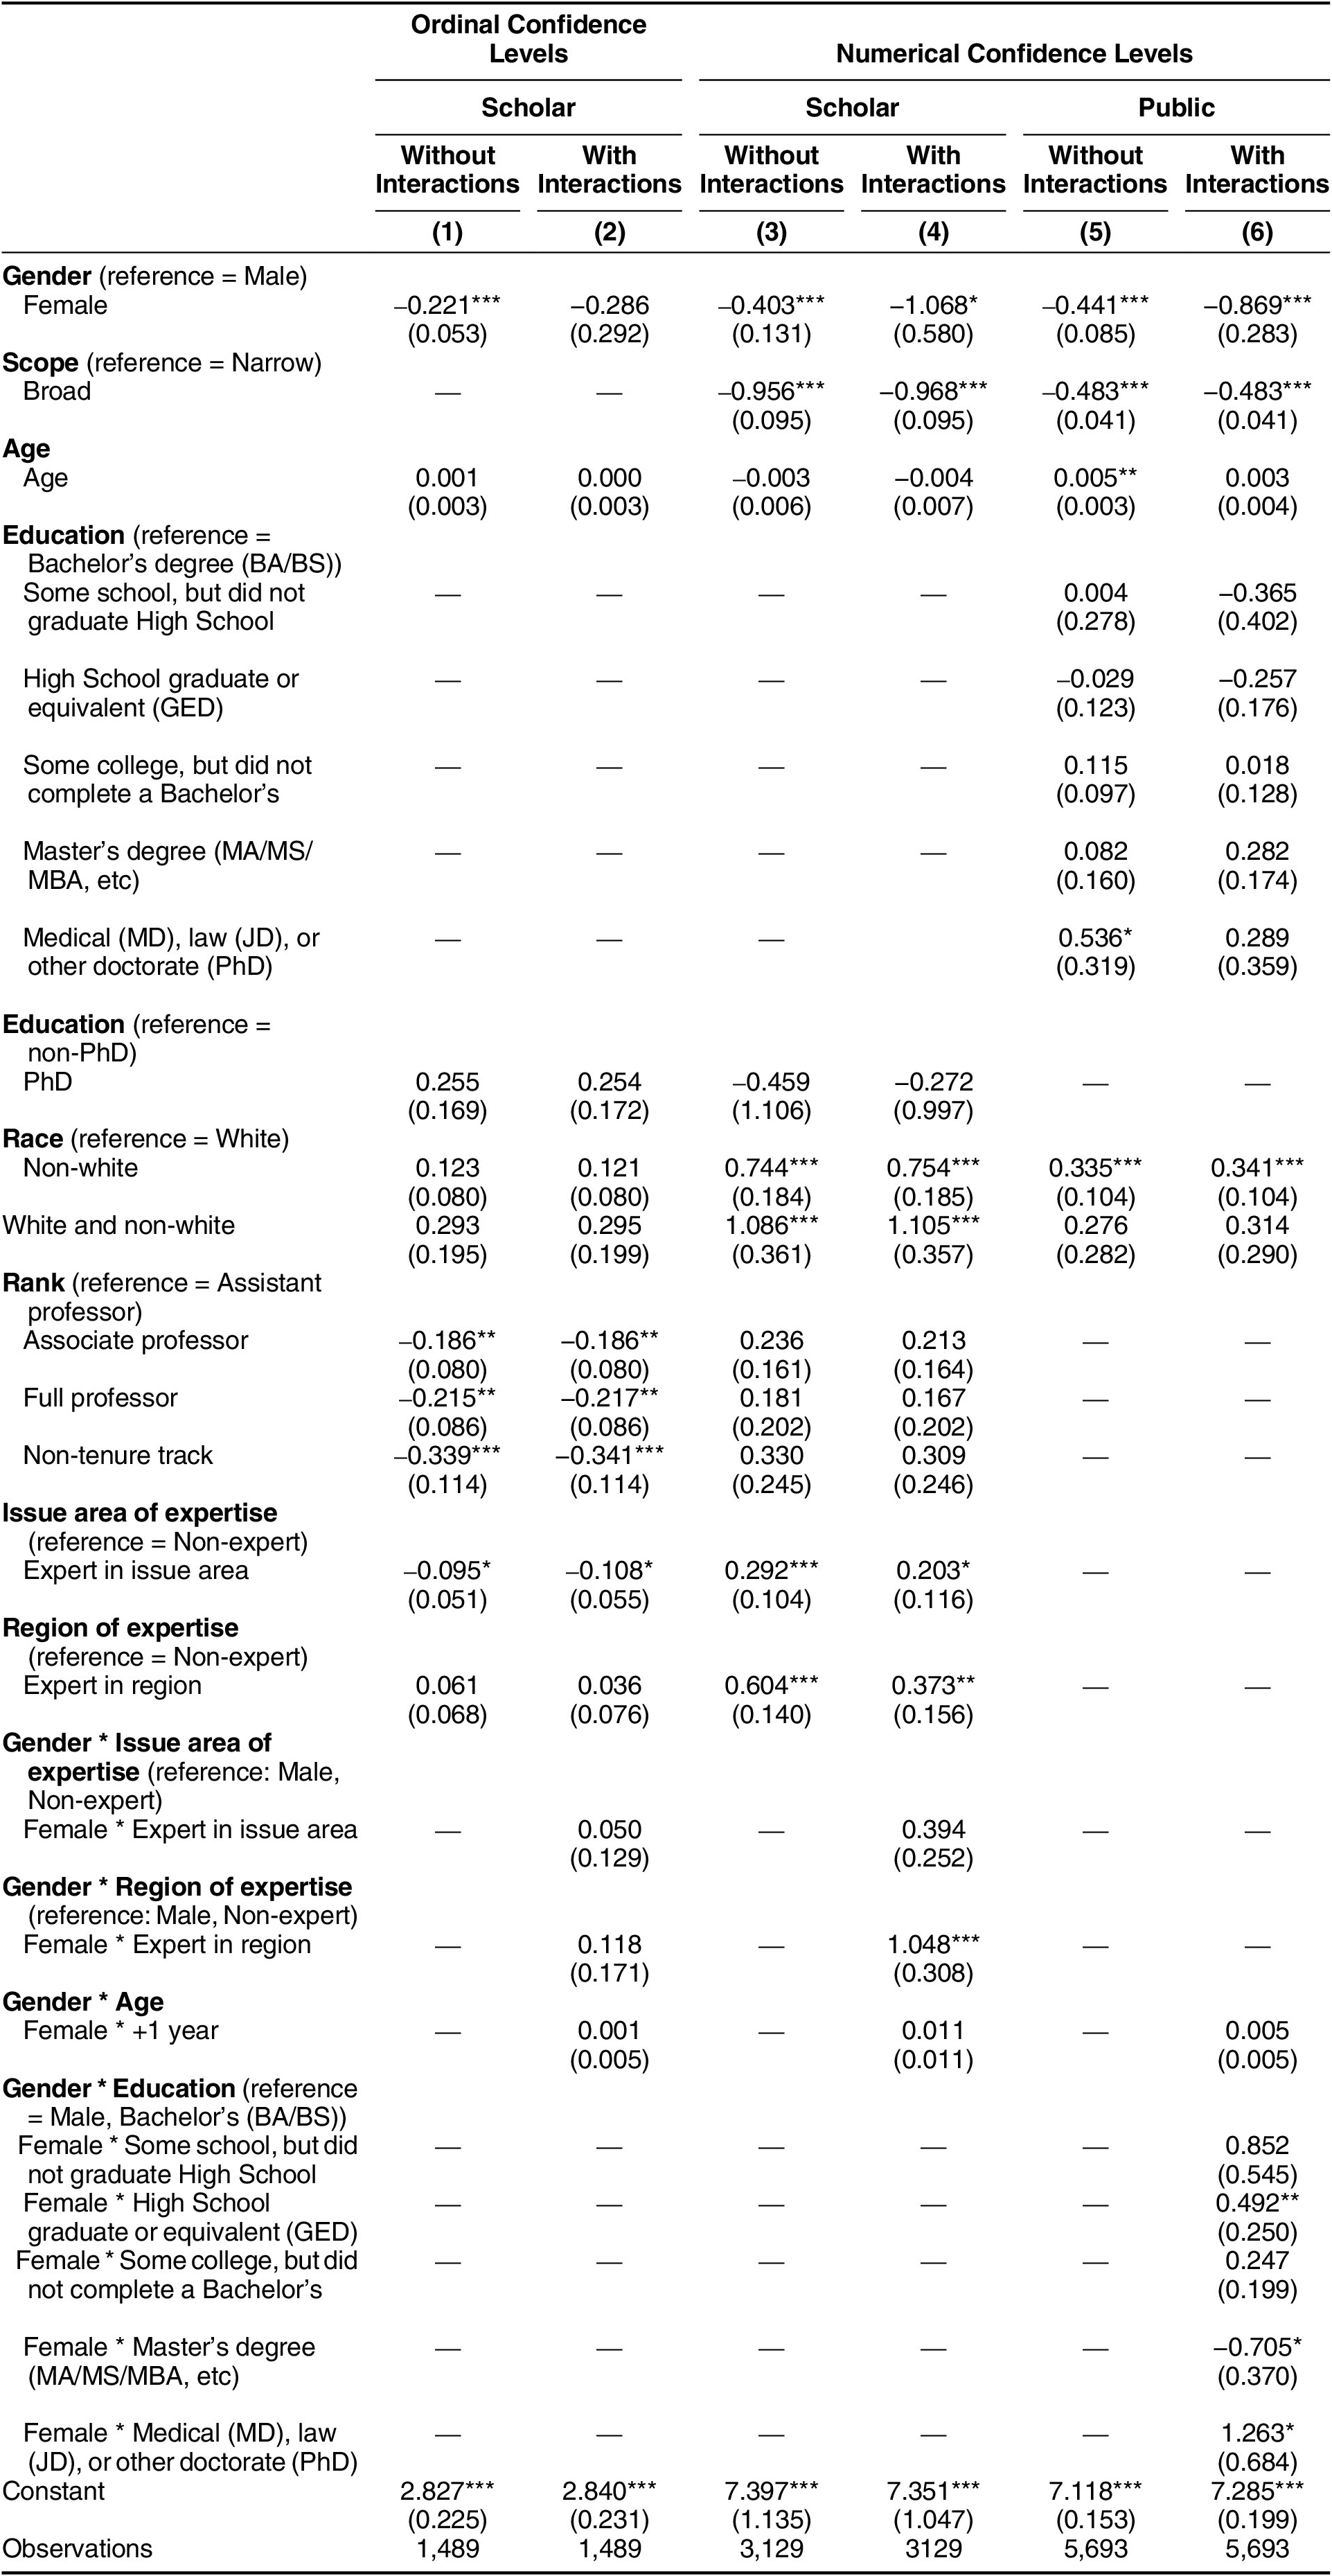
Note: *p<0.1; **p<0.05; ***p<0.01
Among IR scholars, we find a nearly identical effect in responses to seven confidence questions. Female scholars report a level of confidence that is 0.40 points lower than that of their male counterparts, again on an 11-point scale, when controlling for question scope, age, education, race, and issue and region of expertise (see table 7). Among scholars, but not the public, we also measured confidence using a four-point Likert scale ranging from “not confident at all” to “very confident.” On these questions, women scholars reported an average confidence level 0.22 points lower than male scholars, a statistically significant difference when controlling for the same variables discussed above.Footnote 26 That female scholars report less confidence than their male colleagues—a difference that is almost identical to the disparity in reported confidence between men and women within the general public—strongly suggests that confidence may help explain gender-based differences in political expression.
Education does not eliminate the confidence gap between men and women. Indeed, when we combine the public and scholar samples (refer to appendix B online), we see that the interaction effect of being a woman and a scholar does not have a statistically significant effect on reported confidence levels. Despite female scholars’ education and expertise, our results suggest that women may often be less confident of their knowledge than men. Somewhat counterintuitively, and in contrast to our findings on the extreme response questions, we find that the effect of being a scholar alone has a small, but statistically significant and negative effect on self-reported confidence levels. Their higher educational levels may make scholars more comfortable staking out extreme positions on international issues, but we speculate that their education also may teach scholars to recognize the limits of their own knowledge.
Explaining the Confidence Gap
Women’s lower self-reported confidence levels, greater propensity to say “don’t know,” and lower likelihood of providing an extreme response, at least under some circumstances, suggest the existence of a gender-based confidence gap. This gap is well documented: women express lower levels of confidence in their own abilities relative to equally performing men (e.g., Kling et al. Reference Kling, Hyde, Showers and Buswell1999; Orth, Trzesniewski, and Robins Reference Orth, Trzesniewski and Robins2010). Men exhibit greater confidence, but they also are more likely to exhibit overconfidence in their own abilities (e.g., Cimpian, Kim, and McDermott Reference Cimpian, Kim and McDermott2020). Understanding the origins of the gender gap requires that we understand both women’s relative lack of confidence and men’s overconfidence. Our data do not allow us to determine the origins of this gap, but they allow us to speculate on some potential causes. We have argued that knowledge alone cannot explain our findings and we need to consider confidence, but differing levels of political knowledge may help explain the gender-based confidence gap. If women are less knowledgeable than men about politics, they may be less confident in their ability to answer or stake out extreme responses to survey questions about political issues. We briefly consider three other potential explanations for the confidence gap, although there likely are others.Footnote 27
First, women may have a genetic susceptibility toward lower confidence, or men may have a hereditary predisposition to higher confidence. Using data from a study of twins, Vogt et al. (Reference Vogt, Zheng, Briley, Margherita Malanchini and Tucker-Drob2022) conclude that genetic factors account for as much as 28% of non-ability-based confidence. Neiss, Sedikides, and Stevenson (Reference Neiss, Sedikides and Stevenson2002) similarly conclude, based on a wide-ranging literature review, that genetic influences explain 30%–50% of variation in self-esteem.Footnote 28 Nevertheless, there are several problems with a purely biological explanation for the confidence gap. First, “while genetic influences are substantial, unique environmental influences explain the largest amount of variance in self-esteem in both genders”(Raevuori et al. Reference Raevuori, Dick and Keski-Rahkonen2007). Second, although genetics may be a strong driver of self-esteem, and there may be significant differences between males and females in their confidence levels, it does not necessarily follow that biology explains the confidence gap. Finally, even if biology is a source of the gender-based confidence gap, it is not determinant; even the highest estimate suggests that only half of variation in self-confidence is genetic.
Second, structural factors may explain women’s lower levels of confidence. Women are underrepresented in numerous areas of society, including academia, which may make them less confident—and men more confident—in their knowledge or ability to express their views. In the academy, women remain underrepresented on the faculty and pages of top journals. Women make up only 31% of IR scholars at U.S. institutions. In a 2022 survey, 55.13% of male IR scholars in the United States reported that they held the rank of full or chaired professor, compared with only 36.68% of women (Peterson, Powers, and Tierney Reference Peterson, Powers and Tierney2022). When U.S. faculty were asked in 2017 to name the scholars whose work has had the greatest impact on the field over the previous 20 years, eight of the top ten responses were men (TRIP 2017). Women penned less than 24 percent of articles published between 1980 and 2018 in the 12 leading IR journals (TRIP 2020).Footnote 29 Maliniak, Powers, and Walter (Reference Maliniak, Powers and Walter2013) find that women are systematically cited less often than their male colleagues. Women are less likely to appear on graduate course syllabi and are likely to be taken less seriously when they do (Gillooly, Hardt, and Smith, Reference Gillooly, Hardt and Smith2021; Hardt et al Reference Hardt, Smith, Kim and Meister2019). When underrepresentation is accompanied by systematic bias, its effects can be multiplied.
One preliminary test for the effects of structural factors is to compare IR subfields that differ in their inclusion of women. Our survey data show that 86.20% of IR faculty report that they study gender, but only 24.26% of security scholars are women. A structural approach might suggest that women in the gender subfield would be less likely than women in the security subfield to select “don’t know” answers, and that the gender gap in “don’t know” responses would be larger in security. That is not what we find, however. Female scholars in the gender subfield select “don’t know” in 7.81% of questions, while female security scholars do so 6.01% of the time. Similarly, the gap between men and women is considerably larger in the gender subfield (5.37 percentage points) than in security (0.90 points). This finding certainly does not refute structural explanations, but it does suggest that underrepresentation does not necessarily or automatically produce lower confidence. Highly confident women, for example, may self-select into the more male-dominated security subfield.
Socialization presents a third explanation for the confidence gap. This approach suggests that women are less confident of their political knowledge and ability to express it because they have learned to believe that holding and expressing political opinions is male behavior. Women’s political socialization—the process by which they develop attitudes and beliefs about their political identity and how they should behave in the political arena—starts early and continues throughout life (e.g., Heck et al. Reference Heck, Santhanagopalan, Cimpian and Kinzler2021; Patterson et al. Reference Patterson, Bigler, Pahlke, Brown, Amy Roberson Hayes and Nelson2019). Politics is an overwhelmingly male sphere where it is more socially appropriate and acceptable among men than women to express opinions (Eagly and Heilman Reference Eagly and Heilman2016; Heck et al Reference Heck, Santhanagopalan, Cimpian and Kinzler2021; Huddy and Capelos Reference Huddy, Capelos and Ottati2002; Rapoport Reference Rapoport1985; Schneider and Bos Reference Schneider and Bos2019). In such an environment, it would not be surprising that women developed less confidence in their political knowledge and their ability to express their views publicly or openly. Rapoport (Reference Rapoport1982, Reference Rapoport1985) finds, in fact, that, while women have higher overall “don’t know” response rates than men, the effect is more acute among older women, who were socialized in an earlier era when women’s roles were more narrowly defined.
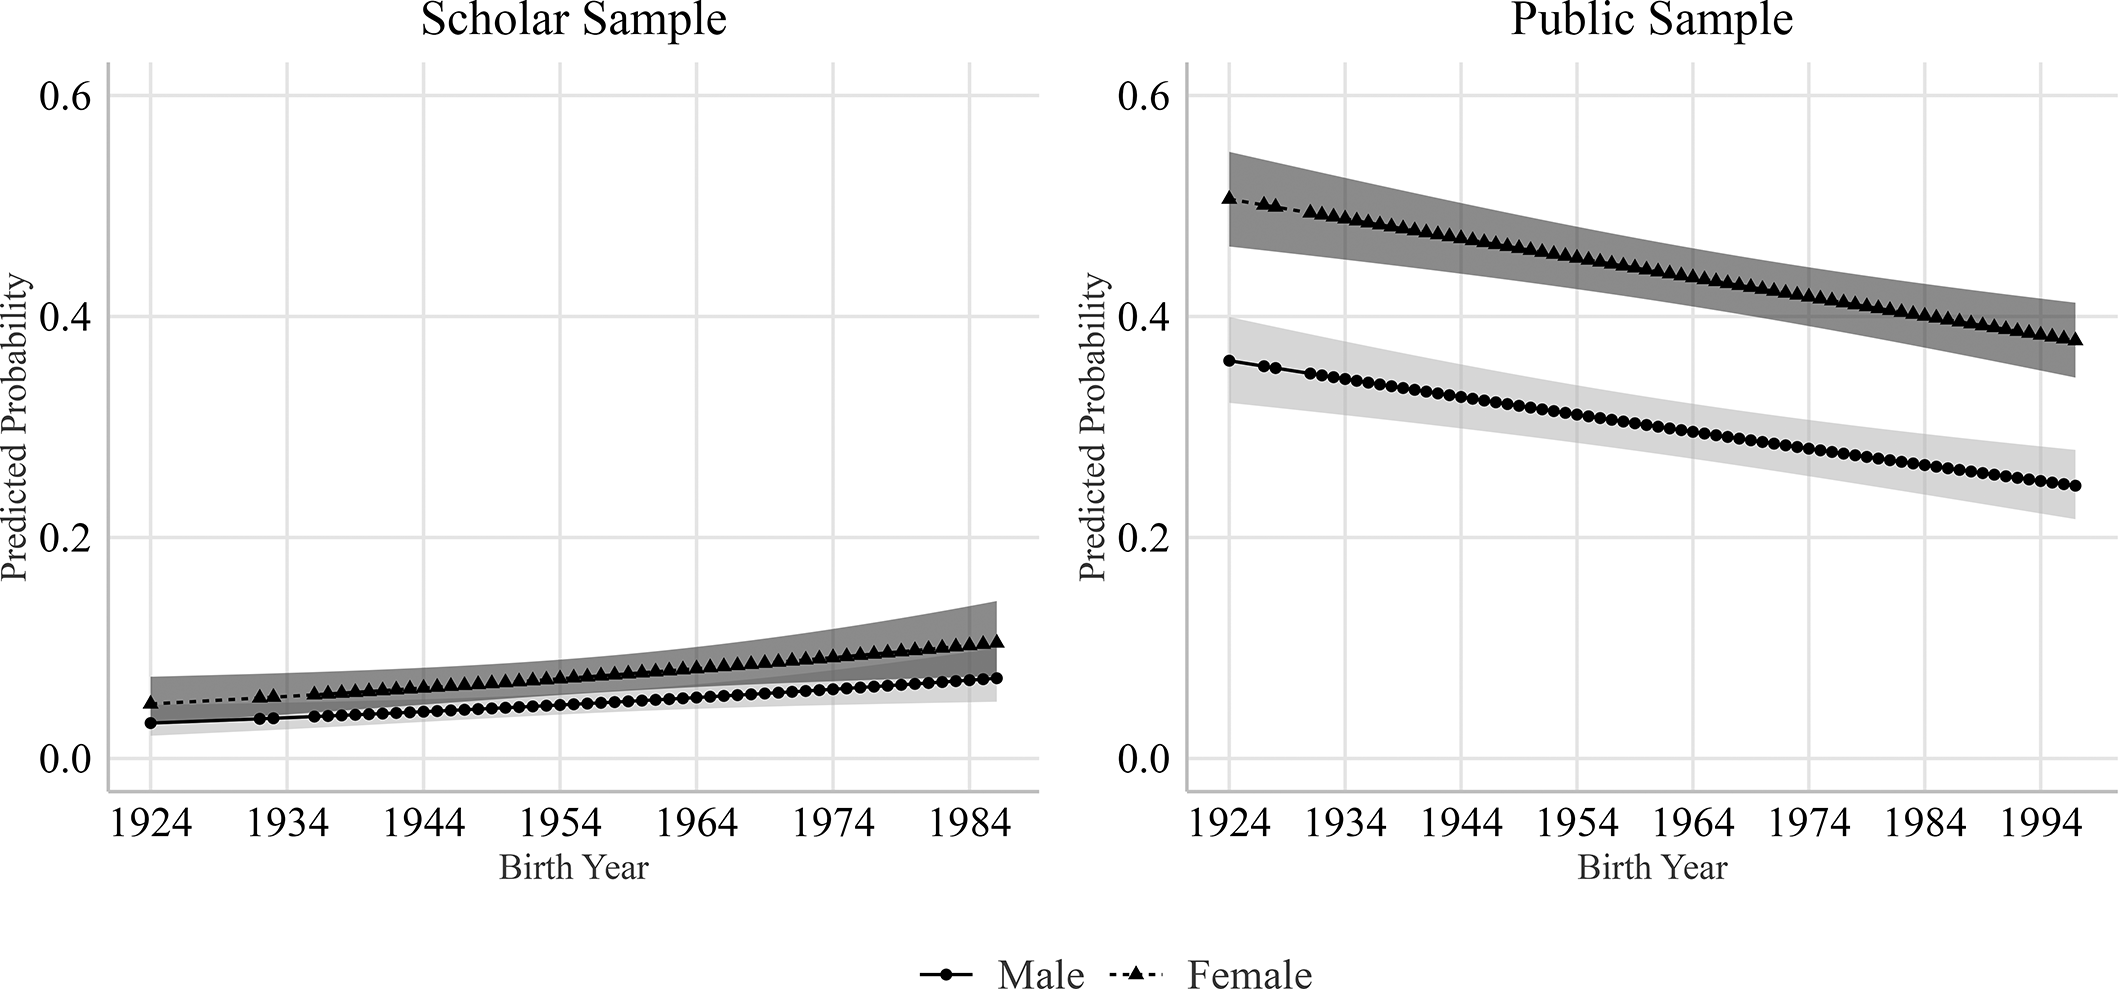
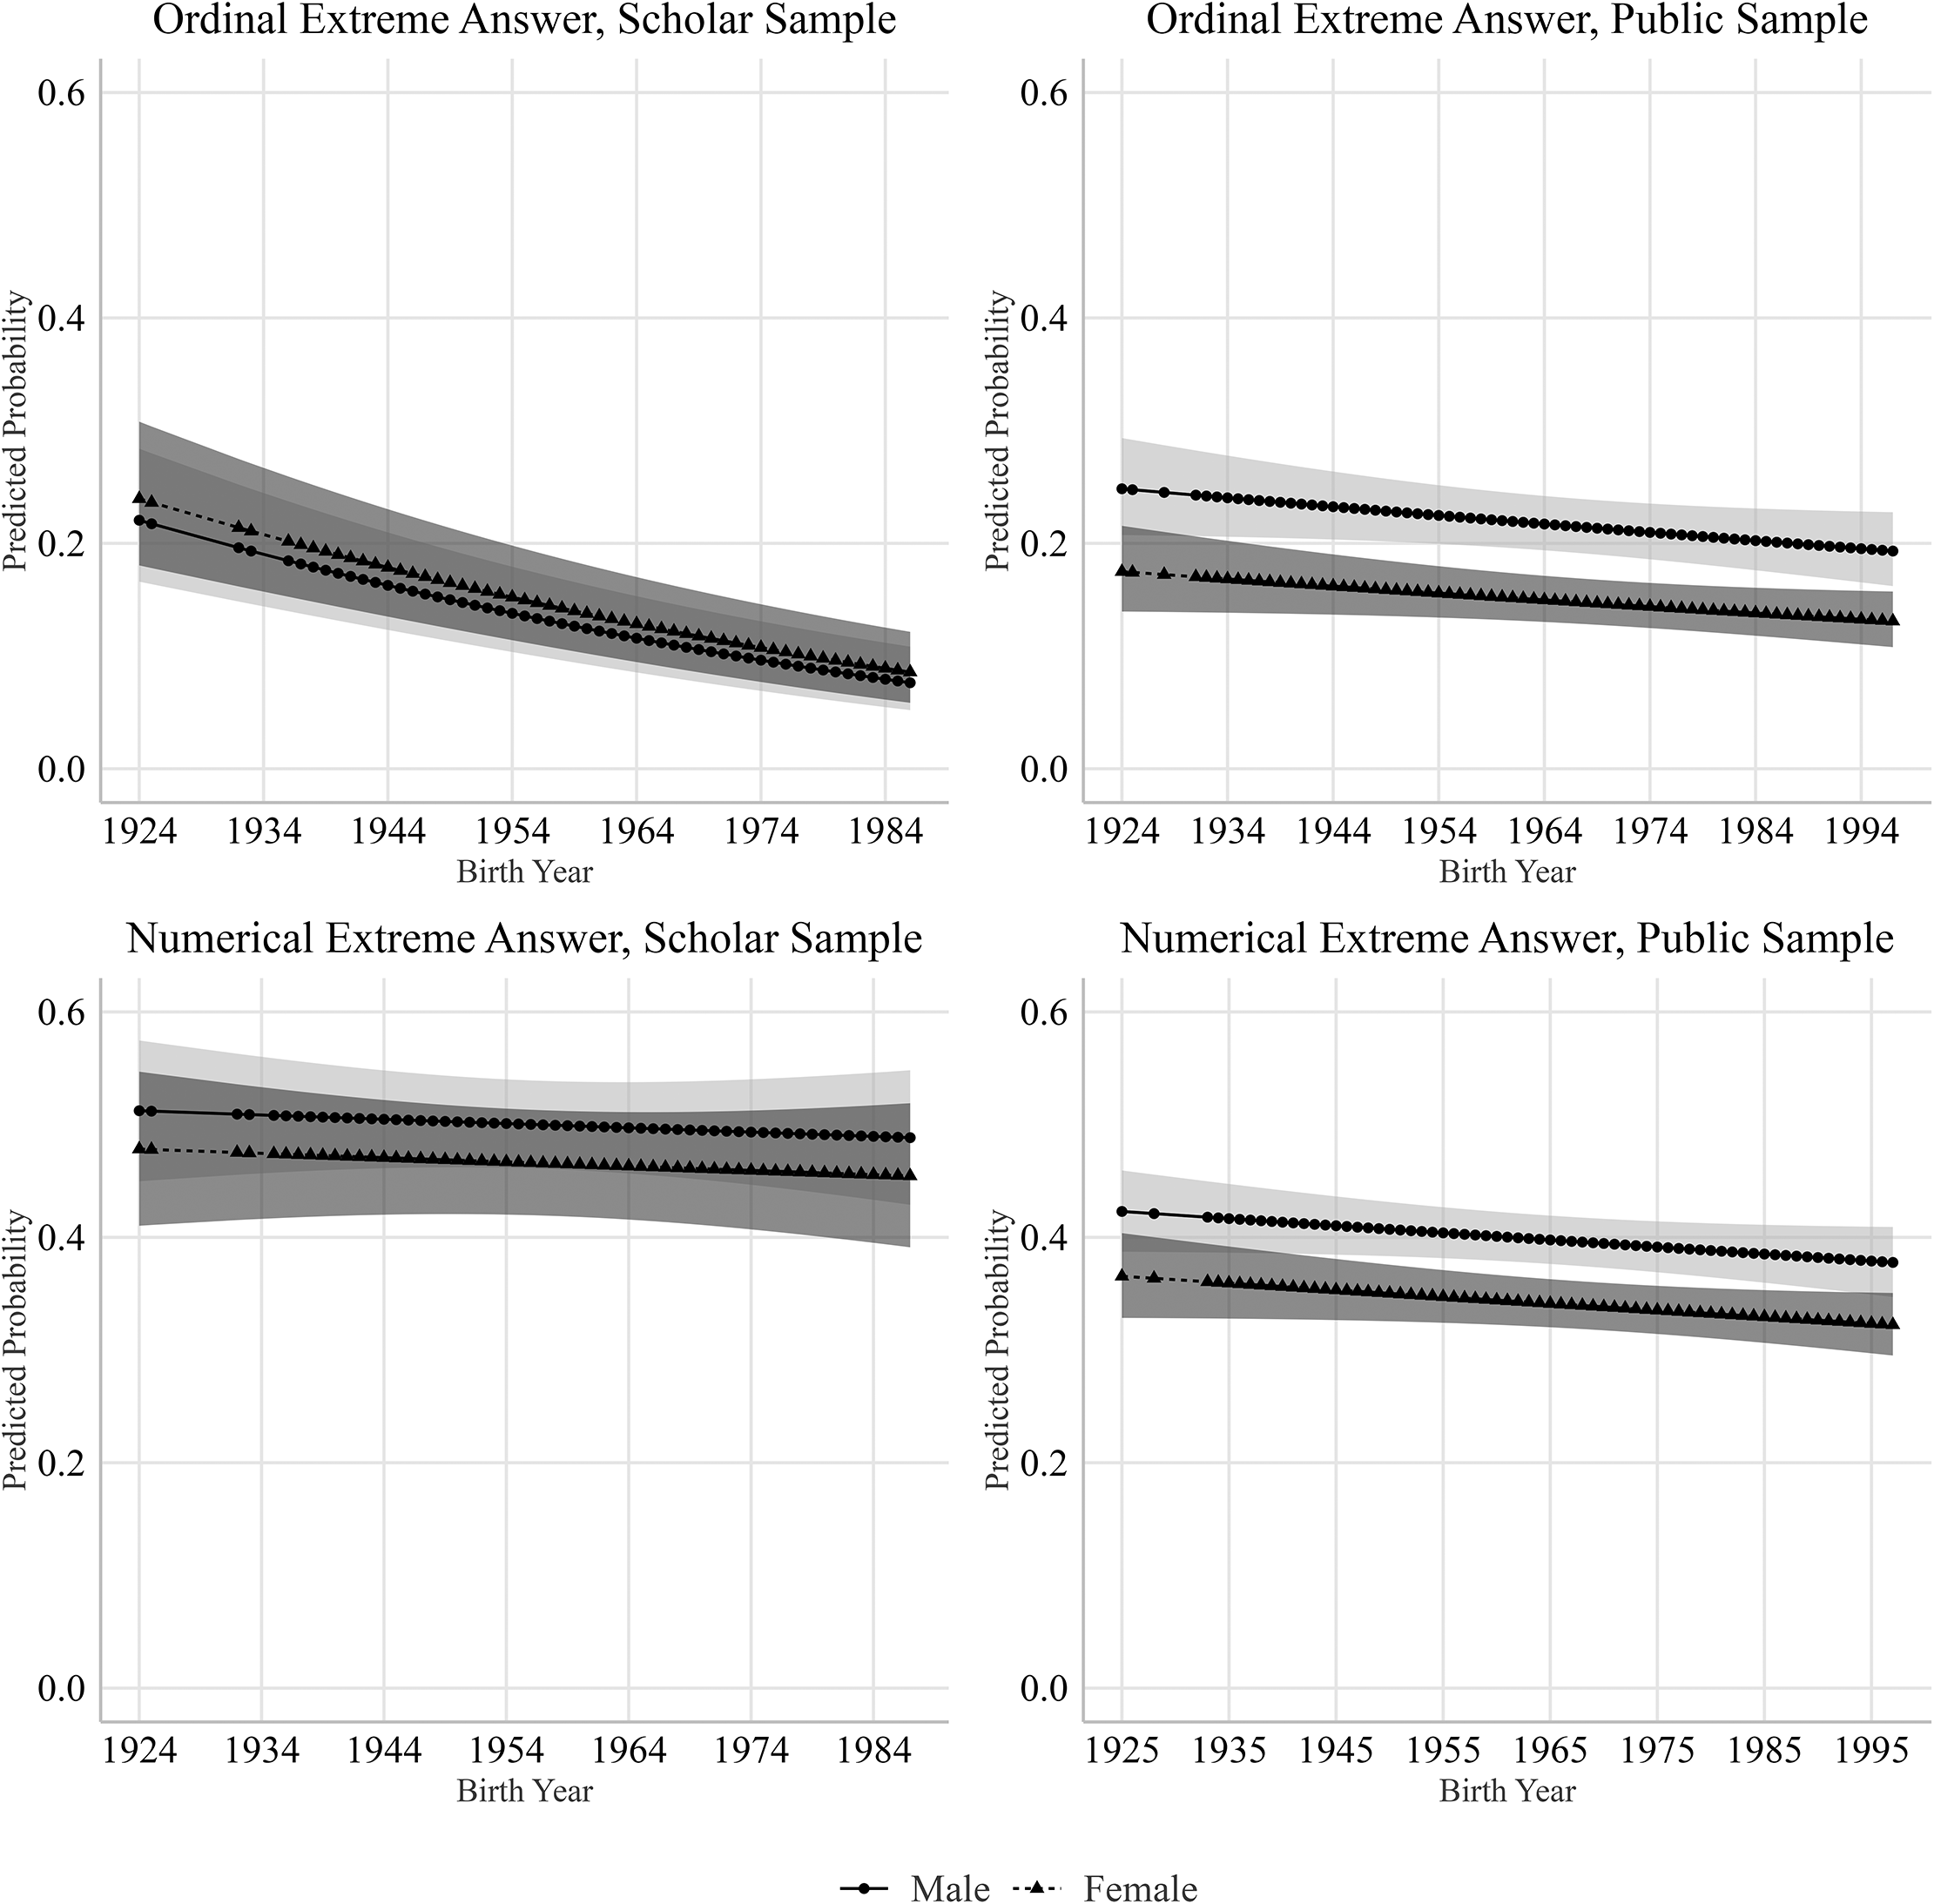
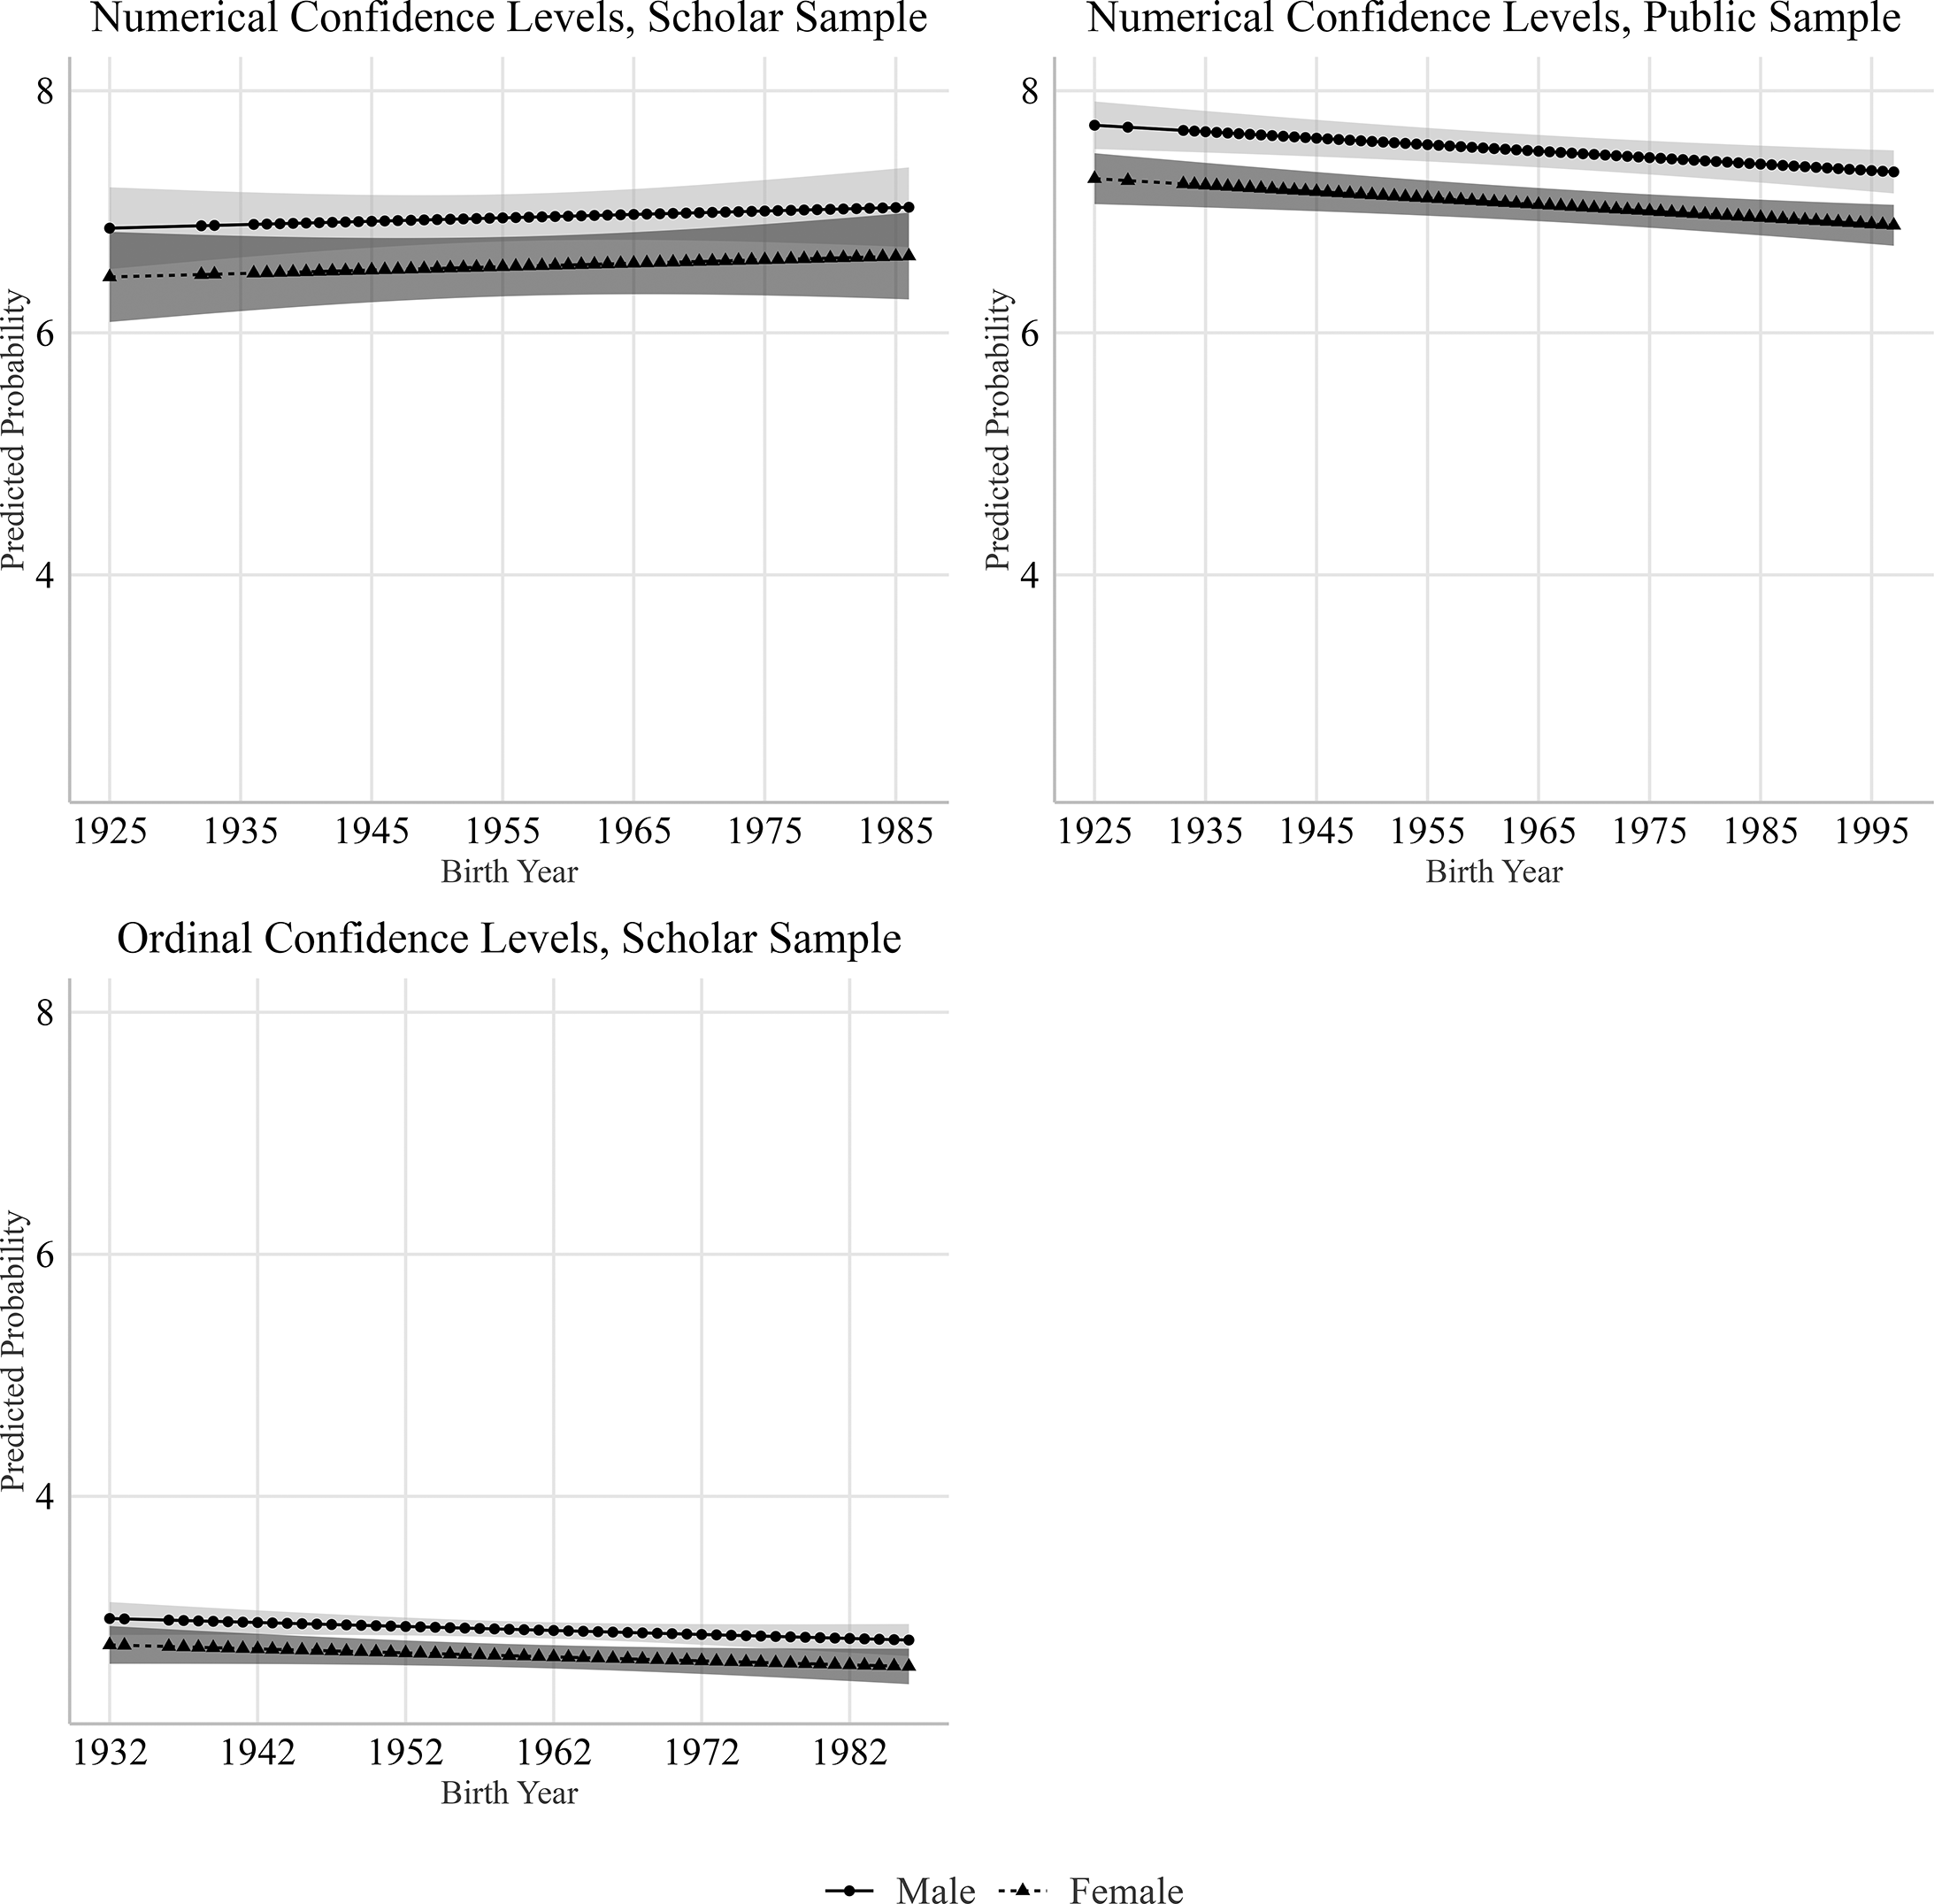
Although we did not set out to study the effects of socialization on women’s self-confidence, our data allow some basic tests. The results are mixed. Figures 2 through 4 show the predicted probability of answering “don’t know,” choosing an extreme response (on both ordinal and numerical response scales), and self-reported confidence levels based on respondents’ birth years. Consistent with Rapoport’s (Reference Rapoport1982, Reference Rapoport1985) findings, figure 2 shows that older members of the public are more likely to say they don’t know an answer, and the effect is more pronounced among women. Among scholars, however, the relationship between birth year and “don’t know” responses is reversed; older scholars are less likely than their younger colleagues to say they don’t know the answer. It appears, in other words, that being educated and socialized as a scholar may reverse some of the effects of gendered socialization. At the same time, as figure 3 demonstrates, older respondents in both samples are less likely to offer an extreme response, although the difference between male and female scholars is not statistically significant.
Probability of Answering Don’t Know
Scholar sample: The model from which these estimates are drawn also includes education, rank, category, scope, area of expertise, region of expertise, and race variables. Clustered at the respondent level.
Public sample: The model from which these estimates are drawn also includes education, category, and race variables. Clustered at the respondent level.
Probability of Selecting an Extreme Answer
Ordinal Extreme Answer, Scholar Sample: The model from which these estimates are drawn also includes education, rank, category, scope, area of expertise, region of expertise, question type, and race variables. Clustered at the respondent level.
Ordinal Extreme Answer, Public Sample: The model from which these estimates are drawn also includes education, category, question type, and race variables. Clustered at the respondent level.
Numerical Extreme Answer, Scholar Sample: The model from which these estimates are drawn also includes education, rank, category, area of expertise, region of expertise, and race variables. Clustered at the respondent level.
Numerical Extreme Answer, Public Sample: The model from which these estimates are drawn also includes education, and race variables. Clustered at the respondent level.
Finally, the results for self-reported confidence levels are mixed, as figure 4 shows. For confidence questions with numerical scale responses, older respondents among the public report higher levels of confidence than younger respondents, although women report significantly less confidence. The relationship between birth year and reported confidence is similar among scholars, although only for questions with ordinal response options.
Predicted Probability, Confidence Levels
Ordinal Confidence Levels, Scholar Sample: The model from which these estimates are drawn also includes education, rank, area of expertise, region of expertise, and race variables
Numerical Confidence Levels, Scholar Sample: The model from which these estimates are drawn also includes education, rank, scope, area of expertise, region of expertise, and race variables.
Numerical Confidence Levels, Public Sample: The model from which these estimates are drawn also includes education, scope, and race variables
Regardless of the reason, there is a clear confidence gap between men and women. Our data do not allow us to test alternative explanations for this gap, but we can speculate that none of these explanations alone suffices since some women overcome biology, structural constraints, and socialization effects to participate broadly in political life. Instead, all three approaches likely explain some part of gendered differences in political expression.
Conclusion
Female IR scholars are more likely than women generally to express political attitudes, although some reticence remains even within this highly educated cohort. We compared men’s and women’s responses to questions that offer a “don’t know” response option and those with so-called extreme response options, such as “strongly agree” or “strongly disagree.” Compared to the general public, female IR scholars select “don’t know” responses less often and extreme responses more often, but female IR scholars still mostly lag behind their male colleagues in this regard. Similarly, like their counterparts within the general public, female scholars are significantly less likely than their male colleagues to offer extreme responses, at least to questions with numerical responses; there is no statistically significant relationship between gender and extreme responses for ordinal-scale questions. For the most part, then, we find that the gender gap in political expression persists within the academy, but it generally is far narrower than within the general public.
The gap is widest on self-reported levels of confidence. Female IR scholars not only are less certain than their male colleagues of their responses to substantive questions; they are just as uncertain as women in the general public. This may suggest that even when these highly educated women behave in ways that suggest they are reasonably confident of their knowledge and their ability to express it, they do not feel confident. This finding may make it particularly difficult to shrink the confidence gap, and this difficulty may be compounded by overlapping and interdependent systems of discrimination.
Our study presents important findings on the gender gap in political expression among IR scholars. At the same time, one might question the generalizability of the findings to other subfields or disciplines, especially since the IR subfield is considered one of the more highly gendered subfields of political science. Women represent less than one-third of the faculty in IR, but they account for half of all tenure-track political science faculty in the United States and 40% of all political science PhDs (Argyle Reference Argyle and Mendelberg2020). Similarly, 40% of all faculty at U.S. institutions are women, as are 48% of all doctorates awarded (Monroe and Chiu Reference Monroe and Chiu2010). Women who enter the IR field may do so with an awareness of its gendered nature; in other words, they may self-select in terms of confidence and willingness to express their views. Indeed, the gap between men and women in their propensity to give extreme responses is smaller among IR scholars than it is among economists (Sarsons and Xu Reference Sarsons and Xu2015). Future research should compare IR with other subfields of political science and other social science disciplines.
Additional research also should explore specific causal factors that influence political expression by women, especially highly educated women. Our analysis does not allow us to definitively determine the causes of gendered differences in political expression. We can say, however, that education matters; the highly educated women we study are far more likely than women in the general public to answer survey questions rather than say they don’t know the answer, provide extreme responses, and express confidence in their responses. Education may work directly by increasing women’s political knowledge, or indirectly by increasing the confidence level of highly educated women, making them more likely to answer questions and select extreme responses. But education alone cannot explain the gender gap. We also find support for a confidence-based, rather than a purely knowledge-based, explanation; there remains a statistically significant difference in the levels of confidence that female and male IR scholars report having in their answers to substantive questions. In short, women may be less confident and less likely to hazard a guess if they are not certain of the answer.
Why does it matter that women are less likely than men to express political attitudes? Democratic political systems are based on the political participation of all citizens. If women are systematically less likely to share their political knowledge and preferences, they will be far less likely to influence policy debates and outcomes. When women are knowledgeable and willing to express their opinions about political issues, “they are more likely to participate in politics, more likely to have meaningful, stable attitudes on issues, better able to link their interests with their attitudes, more likely to choose candidates who are consistent with their own attitudes, and more likely to support democratic norms” (Delli Carpini and Keeter Reference Carpini and Keeter1996, 272). “It turns out that public opinion influences policy most of the time, often strongly” (Burstein Reference Burstein2003), so gender gaps in policy preferences matter. Further, because elite opinion shapes mass public opinion (Guisinger Reference Guisinger2011; Maliniak, Parajon, and Powers Reference Maliniak, Parajon and Powers2021; Zaller Reference Zaller1992), gender gaps among IR scholars also may shape political outcomes.
If female experts are less likely to share their knowledge and informed preferences, they are less likely to be perceived as experts in public spaces and conversations, as well as within the academy. Addressing the gender gap can reshape the IR discipline, particularly graduate training, in important ways. The IR field already has taken significant steps to begin confronting the underrepresentation of women. Studies of the status of women in the profession have brought attention to gender issues within the International Studies Association and the larger profession. Numerous journals have sought to increase submissions by and citations to female authors (Jackson et al. Reference Jackson, Maliniak, Parajon, Peterson, Powers and Tierney2023). Additional efforts to build communities of women within the discipline and within individual graduate programs help create more supportive environments for women. Departments also should make efforts to raise awareness of the gender gap as part of their students’ professional education. Together, these efforts encourage women to be more confident in their opinions and knowledge as well as create environments where they are more comfortable expressing themselves and where they can reasonably believe that if they speak, they will be heard.
As important as these efforts are, we should not assume that the problem driving the gender gap is only or even largely women’s lower levels of self-confidence. Women may be less confident than men, and this sometimes means that they don’t express an opinion, even though they may have one, or give an extreme response, even when they think one is warranted. At times, however, such reticence is warranted. It is clear that confidence, and even overconfidence, can have clear advantages (Shapira-Ettinger and Shapira Reference Shapira-Ettinger and Shapira2008), but claiming total certainty—a reluctance to say “I don’t know” and a willingness to stake out extreme positions—is not necessarily a good thing. Indeed, men may be too confident about their opinions and abilities (e.g., Cimpian, Kim, and McDermott Reference Cimpian, Kim and McDermott2020; Soll and Klayman Reference Soll and Klayman2004) and more likely to overclaim knowledge (Jerrim, Parker, and Shure Reference Jerrim, Parker and Shure2019), and they might do better sometimes to emulate the caution women more often exhibit. For this reason, graduate programs’ education and professionalization of their students should also include efforts to socialize students to admit uncertainty and say they don’t know an answer when they don’t. Schwartz (Reference Schwartz2008) reminds us of “the importance of stupidity in scientific research.” Graduate programs do students a disservice, he writes, by not helping them understand how little we actually know and how hard it is to do research. “No doubt, reasonable levels of confidence and emotional resilience help, but … the more comfortable we become with being stupid, the deeper we will wade into the unknown and the more likely we are to make big discoveries.”
Supplementary Material
To view supplementary material for this article, please visit http://doi.org/10.1017/S1537592725000507.
Data Replication
Data replication sets are available in Harvard Dataverse at: https://doi.org/10.7910/DVN/RH6FGH.
Acknowledgments
The authors thank Mary Trimble for research assistance and Kaden Paulson-Smith for significant input on an earlier version of this paper. They thank the Carnegie Corporation of New York and the Global Research Institute at William & Mary for financial and administrative support.


 Open access

