



Despite the well-established link between elevated dietary Na intake and hypertension( Reference Whelton, Appel and Sacco 1 – Reference Cook, Cutler and Obarzanek 4 ), a leading risk factor for CVD, the US population consumes an average of 3400 mg of Na daily( Reference Henney, Taylor and Boon 5 ), which exceeds daily recommendations from the American Heart Association (1500 mg/d)( Reference Lloyd-Jones, Hong and Labarthe 6 ) and the National Academy of Medicine (2300 mg/d)( 7 ). As more than 75 % of dietary Na comes from processed foods( 8 ) and because bread is a major contributor of Na in the US diet( 7 ), population-based strategies to lower Na in the food supply are necessary to improve population health( Reference Henney, Taylor and Boon 5 , Reference Appel, Frohlich and Hall 9 ).
The best-documented population-level Na reduction programme comes from the UK. In response to the growing evidence linking excess dietary Na to hypertension and other CVD, the UK Food Standards Agency partnered with food manufacturers, retailers and suppliers to implement a structured, gradual reformulation programme, in which they established voluntary, incremental Na targets for eighty-five categories to guide Na reduction in packaged foods( 10 ). As a result of this programme, large reductions in the Na content of packaged foods were seen, with a 17 % reduction in Na content of bread alone between 2001 and 2011( Reference Brinsden, He and Jenner 11 ). Over a 10-year period, mean consumption of dietary Na in England was reduced by ~1 g/d( 12 ), which is estimated to contribute to saving approximately 9000 lives per year and more than £1·5 billion per year in health-care costs( Reference Brinsden, He and Jenner 11 ). Further lower targets were subsequently set by the Department of Health (DH), who took over responsibility for nutrition in the UK, to be achieved by 2017( 13 ).
In the USA, similar initiatives are emerging. The National Salt Reductive Initiative (NSRI) was launched in 2009 and developed voluntary Na reduction targets for sixty-two packaged food categories to guide corporations in their efforts to reduce Na in their products by 2014( 14 ). In 2016, the Food and Drug Administration released draft voluntary Na reduction targets for 150 categories of processed food; however, these have not yet been finalized( 15 ). Implementation and evaluation of such targets require surveillance of the food supply, both to establish current levels of Na (and indeed, other nutrients of concern) and to assess the effectiveness of Na reduction efforts over time.
Because bread is one of the highest contributors to dietary Na in the USA, our objectives were to examine the Na content in US bread products (i) overall and by bread type, (ii) in comparison to similar products in the UK, due to the longevity and well-established effectiveness of its Na reduction initiative, and (iii) with respect to the proportion of products meeting US Na reduction targets.
Methods
Study design and data collection
Data for the present study were derived from Label Insight (labelinsight.com), which is the largest publicly available branded food composition database in the USA. Label Insight launched the Open Data Initiative in 2017, which provides researchers with open access to granular food composition data. The database is updated daily and contains information on >200 000 barcoded food and beverage items (representing >80 % of the US packaged food supply). From this data set, we extracted the brand name, product name, bread type, serving size and Na in mg per serving for 4466 bread products. Using serving size and Na content per serving, we calculated mg per 100 g for each product.
To assess Na content in UK bread products, we utilized the FoodSwitch UK database, which was previously developed by The George Institute for Global Health and Consensus Action on Salt and Health, and can serve as a contemporary, granular surveillance system of the packaged food supply in the UK. Data were collected during 2012–2016 from stores in the top nine supermarket chains in the Greater London area, using The George Institute Data Collector mobile phone application. For each product, the barcode was scanned and photographs were taken of the front of the package, nutrition label and ingredients list. Content from the images was then transcribed and entered into the FoodSwitch database. Additional data were also acquired in 2013–2014 from Brandbank, a company that provides product information for e-commerce websites and merchandising applications. We extracted bread name, product name, bread type and Na content in g/100 g for 1651 bread products. From the Na content given in g/100 g, we calculated the Na content in mg per 100 g for all products.
Statistical methods
We assigned each bread product to one of twenty sub-categories based on our previous research( Reference Dunford and Webster 16 ). The mean, median, sd and range of Na content in mg/100 g for bread products overall and for each sub-category for each country were calculated( Reference Dunford, Eyles and Mhurchu 17 ). The mean Na content in US and in UK bread products was compared both overall and by sub-category using Student’s t test. We compared the proportion of products meeting the 2014 NSRI Na target of ≤360 mg Na/100 g, which is the same as the 2017 DH Na target for the UK( 13 ), using the χ 2 test. We used the SAS statistical software package version 9.4 for all analyses.
Results
For 4466 US bread products, the mean (sd) Na content overall was 455 (170) mg/100 g, range 0–3219 mg/100 g (Table 1). Sub-categories with the highest mean Na levels were savoury bread (584 mg/100 g), rye bread (557 mg/100 g) and flat breads (549 mg/100 g). Sub-categories with the lowest mean Na levels were pizza bases (381 mg/100 g), other grain breads (such as spelt, sprouted grain; 351 mg/100 g) and fruit breads (345 mg/100 g). Overall, 21 % of US bread products met the 2014 NSRI Na target, with savoury bread having the lowest proportion of products meeting the target (5 %) and fruit breads the highest (62 %).
Comparison of sodium content in the USA and UK by bread type and by percentage meeting sodium reduction targets; data obtained from the US Label Insight Open Data Initiative (n 4466) in 2017 and the FoodSwitch UK database (n 1651) covering 2012–2016
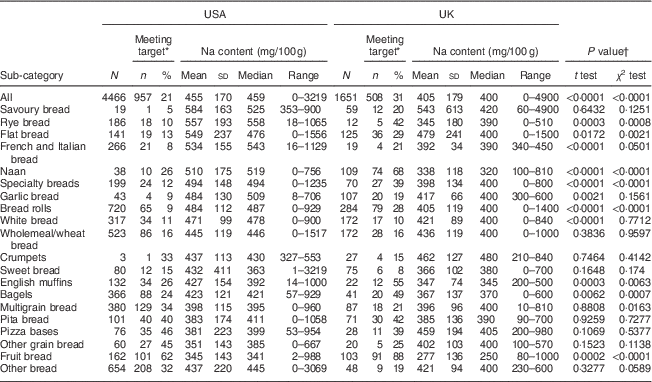
* Target is the US 2014 National Salt Reduction Initiative (NSRI) Na target of ≤360 mg/100 g, which is the same as the 2017 Department of Health Na target for the UK (NSRI target is ≤220 mg Na/100 g for sweet bread).
† t Test for mean Na content per 100 g by country or χ 2 test for proportion in target by country.
For 1651 UK bread products, the mean (sd) Na content overall was 406 (179) mg/100 g, range 0–4900 mg/100 g. Bread types with the highest mean Na content were savoury breads (543 mg/100 g), flat breads (479 mg/100 g) and crumpets (462 mg/100 g). Bread types with the lowest mean Na content were fruit bread (277 mg/100 g), naan (338 mg/100 g) and rye bread (345 mg/100 g). Overall, 31 % of UK bread products met the NSRI Na target, with sweet breads having the lowest proportion of products meeting the target (8 %) and fruit breads the highest (88 %).
Overall, the mean Na content of US bread products was 12 % higher than in the UK (455 mg/100 g v. 406 mg/100 g, P<0·0001). Additionally, a significantly smaller proportion of US bread products met the NSRI/DH Na target compared with the UK (21 % v. 31 %, P<0·0001). Cross-country comparisons by bread sub-category revealed similar patterns in most bread sub-categories, with US products having significantly more Na than UK products in eleven of the twenty bread sub-categories (P<0·05; Fig. 1) and a lower proportion of products meeting Na targets in eight of twenty bread sub-categories (P<0·05; Table 1). White bread products in the USA had significantly higher Na levels compared with similar products in the UK (471 mg/100 g v. 421 mg/100 g, P<0·001), but there were no differences between countries for wholemeal/wheat bread (445 mg/100 g v. 436 mg/100 g, P=0·96) or grain bread (398 mg/100 g v. 396 mg/100 g, P=0·88).
Box-and-whisker plots comparing sodium content in selected bread products by country ( , UK,
, UK,  , USA); data obtained from the US Label Insight Open Data Initiative (n 4466) in 2017 and the FoodSwitch UK database (n 1651) covering 2012–2016 (only sub-categories with fifty or more products in each country are shown). The bottom and top edge of the box represent the first and third quartiles (interquartile range); the line within the box represents the median; the ends of the bottom and top whiskers represent the minimum and maximum values; and the dots represent outliers

Discussion
Our findings demonstrate that, compared with the UK, bread products in the USA contain more Na and a lower proportion of US products meet national Na reduction targets. Because the mean Na content in all bread products was nearly 100 mg Na/100 g above the NSRI target and because nearly 80 % of US breads failed to meet this target, it is likely that population-level initiatives and close partnerships between policy makers, health organizations and manufacturers will be required to reduce Na levels in US packaged foods and to reduce population dietary intake of Na.
We also observed wide variation in Na content within US bread products and between both countries, which suggests that the lowering of Na content of bread products through voluntary reformulation efforts, similar to those enacted in the UK, is likely feasible in the USA. These differences and trends suggest that Na reduction initiatives, with sufficient buy-in and adequate independent monitoring, have the potential to achieve substantial change in salt intake of the population. Modelling estimates in the USA have suggested that reducing Americans’ Na intake by 1200 mg/d could reduce the annual number of deaths by 44 000 to 92 000, new cases of CHD by 60 000 to 120 000, stroke by 32 000 to 66 000, and myocardial infarction by 54 000 to 99 000( Reference Bibbins-Domingo, Chertow and Coxson 18 ). Coupled with the fact that more than two-thirds of dietary Na intake in the USA derives from packaged foods( Reference Drewnowski and Rehm 19 ), this suggests that the potential effects of population-level reductions in dietary Na through packaged food reformulation are large.
One limitation of our study is that our databases did not contain sales information, preventing us from assessing the Na content of frequently purchased foods. However, our findings for overall Na content of US breads are similar to those of the 2014 NSRI Na analysis for bread products (455 mg/100 g v. 454 mg/100 g)( Reference Curtis, Clap and Niederman 20 ). Per the NSRI analysis, there was a significant reduction in the Na content in bread products from 2009 to 2014, both for sales-weighted and unweighted data( Reference Curtis, Clap and Niederman 20 ). Thus, our findings demonstrate that, despite a reduction in Na between 2009 and 2014, there has been no further substantial change since 2014, underscoring the need for ongoing evaluation of the levels of adverse nutrients in the food supply and ongoing engagement with the food industry to effect further progress.
Overall, our analysis reinforces the call to approach Na reduction from a public health and policy standpoint and underscores the need for robust, granular and current data describing the nutritional composition of the packaged food supply. It also highlights the need for a comprehensive surveillance system and for consumer-based interventions to educate and enable individuals to make healthier choices at point of purchase. Na levels in US bread products remain high, and it is likely that a government-led initiative, such as what was seen in the UK, is needed to reduce the Na content of the US packaged food supply. It will be important to monitor whether the Food and Drug Administration’s draft Na reduction targets are finalized, and if so, whether they have an effect on Na reduction in the US food supply.
Acknowledgements
Acknowledgements: The authors would like to thank the Label Insight Open Data Initiative and FoodSwitch UK for granting access to their data sets for this project. Financial support: This research received funding support from the JR Alberts Foundation. The JR Alberts Foundation had no role in the design, analysis or writing of this article. E.K.D. was supported by a National Health and Medical Research Council of Australia Early Career Fellowship. Conflict of interest: None. Authorship: M.D.H., K.J.C. and E.K.D. contributed to development of the research question and project design, as well as interpretation of the findings. E.K.D. oversaw obtaining access to the US data set. K.J. oversaw obtaining access to the UK data set for analysis. A.S.B. conducted the data analysis and contributed to data interpretation. D.X. provided data for analysis and was involved in review of the final manuscript. All authors contributed to drafting the manuscript, and have reviewed and approved the contents of the final version. Ethics of human subject participation: This study did not involve the participation of human subjects.



