


I. Introduction
The Belt and Road Initiative (BRI), commonly referred to as China’s Marshall Plan or the New Silk Road, aspires to connect China with Western Asia, Europe, and Africa through a network of overland and maritime trade corridors. As of 2024, it encompasses 151 countries along its corridors, representing two-thirds of the world’s population and 40% of the global GDP.Footnote 1 BRI access is projected to decrease freight times by 12%, while increasing trade and income by 9.7% and 3.4%, respectively.Footnote 2 These improvements necessitate financing for an unprecedented $8 trillion in investments, setting the BRI apart as the largest infrastructure project in history.Footnote 3 Surprisingly, prior research has overlooked the financial consequences of the BRI on countries situated along its corridors, many of which have inadequate infrastructure and are likely to require considerable financing relative to the size of their economies.
This article is the first to investigate how gaining access to the BRI’s trade corridors influences public and private financing. If BRI access leads to increased public debt that is absorbed locally, it may reduce the availability of private credit (Demirci, Huang, and Sialm (Reference Demirci, Huang and Sialm2019), Huang, Pagano, and Panizza (Reference Huang, Pagano and Panizza2020)). Conversely, if corridor nations secure loans or development aid (e.g., from China Kaplan (Reference Kaplan2021)), public borrowing needs might decrease, thereby freeing up resources for corporate debt issuance (Williams (Reference Williams2018)). Overall, the net impact of BRI access on public and corporate financing is nontrivial and warrants careful empirical investigation.
Untangling the causal effects of BRI access is, however, challenging due to the deliberate planning involved in establishing the BRI’s trade routes. To navigate this, I use the inauguration of Marmaray, a subway service beneath the Bosporus Strait, positioning Eastern European countries on the BRI’s main railway corridor along the Ancient Silk Road, as a quasi-natural experiment. My empirical strategy involves comparing European countries to the east and west of Budapest, Hungary, before and after Marmaray commenced operations. This comparison is useful because, post-Marmaray, countries east of Budapest gained, for the first time, direct access to an effective railway corridor with China, while those to the west already had access through the Trans-Siberian Railway.
The launch of Marmaray provides an optimal setting to estimate directional effects of BRI access. First, Marmaray was designed primarily to alleviate traffic congestion on the bridges over the Bosporus, without an intention to impact financing in Europe. Turkey’s neighboring countries had little to no impact on its financing or construction and, in fact, they themselves were deficient in freight infrastructure.Footnote 4 Second, as Marmaray was announced 9 years before the BRI, it is unlikely that its development was significantly influenced by the BRI.Footnote 5 Third, the construction timeline and opening date for Marmaray were primarily shaped by unprecedented archaeological discoveries and one of the largest urban excavations in history, rather than by economic motives or predictable events. Aligning financing decisions with Marmaray’s completion therefore presented significant challenges.
I employ a difference-in-differences methodology to estimate the effects of BRI access on countries acquiring it after Marmaray’s inauguration. My analysis reveals that post-BRI access in 2013, the public debt-to-GDP ratios in treated countries increased by 10.39%. Data sourced from Refinitiv indicate that sovereign debt issuance in these nations tripled to $410 billion between 2013 and 2021, representing 51% of the region’s GDP as of 2012. On the other hand, Chinese financial assistance—encompassing loans, credit, grants, and other forms—has seen a marginal increase of 0.18% relative to GDP in treated countries. This increase is statistically insignificant, underscoring that the financing from China pales in comparison to that sourced from sovereign debt markets. Concurrent with the sharp increase in public debt issuance, there is a notable decline of 14.18% in the ratio of total corporate loans and debt to GDP, coupled with a 12.77% reduction in publicly traded firms’ overall debt-to-assets ratio at the national level.
My findings indicate that the estimated effects of BRI access are unique to the treated countries, with no observable spillover effects on control or nearby countries. The trends observed in the control countries lend strong empirical support to the observable counterpart of the parallel trends assumption and remain largely unaffected by the Marmaray intervention. Furthermore, placebo tests on countries geographically close to the treatment group, but with access to the same railway corridor to China without the need for Marmaray, produce statistically and economically insignificant results. The consistency and validity of the main findings also persist after excluding the “PIIGS” countries (Portugal, Ireland, Italy, Greece, and Spain), which were embroiled in the European Sovereign Debt Crisis that started four years prior to the inauguration of Marmaray.
I investigate investor composition in European sovereign debt markets to shed light on by whom newly issued public debt by treated countries is absorbed (Arslanalp and Tsuda (Reference Arslanalp and Tsuda2014a), (Reference Arslanalp and Tsuda2014b)). My findings reveal a $ 12.55\% $
increase in the share of domestic debt owned by local banks and non-bank financial institutions, while foreign entities, comprising foreign banks, non-bank investors, and central banks, demonstrate negligible inclination toward the sovereign debt offerings of treated countries. This finding indicates that the European Central Bank’s Asset Purchase Program (APP) is not the primary mechanism for absorbing sovereign debt issued by treated countries. Furthermore, I find that the yields on new public debt issued by treated countries rise by
$ 12.55\% $
increase in the share of domestic debt owned by local banks and non-bank financial institutions, while foreign entities, comprising foreign banks, non-bank investors, and central banks, demonstrate negligible inclination toward the sovereign debt offerings of treated countries. This finding indicates that the European Central Bank’s Asset Purchase Program (APP) is not the primary mechanism for absorbing sovereign debt issued by treated countries. Furthermore, I find that the yields on new public debt issued by treated countries rise by $ 1.24\% $
to
$ 1.24\% $
to $ 1.33\% $
post-BRI access. Meanwhile, yields on newly issued corporate debt in these countries also rise by
$ 1.33\% $
post-BRI access. Meanwhile, yields on newly issued corporate debt in these countries also rise by $ 1.28\% $
to
$ 1.28\% $
to $ 1.71\% $
. Together, these findings suggest that BRI-induced sovereign debt may heighten competitive pressures for local firms pursuing financing in domestic debt markets.
$ 1.71\% $
. Together, these findings suggest that BRI-induced sovereign debt may heighten competitive pressures for local firms pursuing financing in domestic debt markets.
I complement the previous analyses by exploring corporate financing decisions of firms from countries that secure BRI access with those from control countries, before and after the launch of Marmaray. My analysis reveals that firms that gain BRI access exhibit reductions of $ 5.08\% $
in total debt,
$ 5.08\% $
in total debt, $ 2.38\% $
in long-term debt,
$ 2.38\% $
in long-term debt, $ 2.67\% $
in non-convertible debt, and
$ 2.67\% $
in non-convertible debt, and $ 1.84\% $
in short-term debt, post-BRI access. I observe substantial effect heterogeneity among firms. I show that large amounts of public borrowing affect state-owned enterprises (SOEs) differently than private firms. In particular, non-SOEs are disproportionately affected by tighter credit conditions in BRI countries with high public debt issuance, whereas SOEs remain largely unaffected. Reductions in corporate debt issuance are also stronger for larger firms, older firms, and firms with higher financial constraints. Furthermore, firms, predominantly those in countries with facile access to equity issuance or loans, demonstrate a preference for even less debt, taking advantage of alternative financing strategies. These results are robust to controlling for firm characteristics along with firm and industry-year fixed effects, capturing unobserved industry-year shocks, including shifts in the competitive landscape due to changing international trade routes.
$ 1.84\% $
in short-term debt, post-BRI access. I observe substantial effect heterogeneity among firms. I show that large amounts of public borrowing affect state-owned enterprises (SOEs) differently than private firms. In particular, non-SOEs are disproportionately affected by tighter credit conditions in BRI countries with high public debt issuance, whereas SOEs remain largely unaffected. Reductions in corporate debt issuance are also stronger for larger firms, older firms, and firms with higher financial constraints. Furthermore, firms, predominantly those in countries with facile access to equity issuance or loans, demonstrate a preference for even less debt, taking advantage of alternative financing strategies. These results are robust to controlling for firm characteristics along with firm and industry-year fixed effects, capturing unobserved industry-year shocks, including shifts in the competitive landscape due to changing international trade routes.
My findings reinforce the notion that gaining BRI access prompts governments to issue sovereign debt, predominantly absorbed within local markets, thereby reallocating capital away from firms, which typically deploy resources more efficiently than governments. Next, I examine what governments do with newly raised funds. Specifically, I study whether the funds are funneled into relatively more productive channels such as R&D, manufacturing or education, or relatively less productive channels such as collective consumption. In doing so, I observe a $ 5.80\% $
increase in total social payouts, predominantly due to a
$ 5.80\% $
increase in total social payouts, predominantly due to a $ 2.52\% $
rise in government employee wages and a
$ 2.52\% $
rise in government employee wages and a $ 2.40\% $
increase in collective consumption. In contrast, there is an absence of substantial improvement in fixed capital formation, implying a lack of significant investments in infrastructure. In particular, there is no prominent increase in road, air, and sea infrastructure investments, with only a
$ 2.40\% $
increase in collective consumption. In contrast, there is an absence of substantial improvement in fixed capital formation, implying a lack of significant investments in infrastructure. In particular, there is no prominent increase in road, air, and sea infrastructure investments, with only a $ 0.10\% $
rise in railway investments by general governments and
$ 0.10\% $
rise in railway investments by general governments and $ 0.80\% $
rise in transportation expenditures by local governments.
$ 0.80\% $
rise in transportation expenditures by local governments.
To determine whether the previous results are driven by BRI access rather than a confounding variable, and to provide mechanisms through which BRI access impacts financial outcomes at both country and firm levels, I employ four supplemental analytical strategies. In my first supplementary strategy, I examine the incremental impact of a country’s political alignment with China through official membership in China’s BRI program. My findings suggest that countries with both Marmaray access and active BRI membership display a notable 8.76% increase in their government debt-to-GDP ratio. Simultaneously, these countries experience significant reductions in corporate loans and debt to GDP by 11.75% and in total corporate debt to assets by 11.50%. Importantly, European countries that are affiliated with the BRI program but did not gain direct access to the BRI corridors made accessible by Marmaray exhibit no significant economic or statistical effects in these variables.
The second strategy utilizes time series data to examine effect heterogeneity stemming from China-induced uncertainty. My analysis shows that an increase in the China’s Trade Policy Uncertainty (TPU) index, as described by Davis, Liu, and Sheng (Reference Davis, Liu and Sheng2019), and countries’ BRI program membership significantly impact corporate financing decisions. A 1-standard-deviation increase in China’s TPU index, for example, leads to a 4.22% decrease in corporate debt issuance. Furthermore, China’s TPU exhibits no significant effect on treated firms prior to Marmaray’s inauguration, suggesting that the observed effects on corporate debt likely stem from Marmaray-induced risks associated with China, rather than from the broader dynamics of China’s trade policy.
In my third supplementary strategy, I leverage topographic variation among European countries based on the pathways of the historic Orient Express (OE), an iconic train service from Paris to Istanbul that operated from 1883 to 1977. OE’s routes offer a unique approach to pinpoint countries that are more likely to be influenced by accessing BRI’s freight networks, particularly due to their less mountainous terrain—a key factor in the OE’s route selection in the 1880s. These countries are more likely to prioritize freight movement via Marmaray toward the East compared to their neighbors with large mountainous regions.Footnote 6
Incorporating this topographic variation enables me to utilize a triple-difference framework that facilitates comparisons among treated countries before and after BRI access, instead of solely relying on the trends in control countries. My findings reveal that treated countries along the OE routes experience significant changes in their financial landscapes post-BRI access: their public debt increases by 13.23% and corporate loans and debt decrease by 19.48%. This finding is robust to controlling for major historical events that could potentially introduce confounding—such as the Russo–Turkish War and the Treaty of Berlin—particularly if their long-term effects coincide with the timing of BRI access. The results are further supported by a tighter diff-in-diff framework focusing solely on the subsample of treated and control countries along the OE pathways. Moreover, in subsample tests where treated and control countries outside the OE network are compared, the BRI effects are much less pronounced, suggesting that the estimated effects in the article are driven by BRI access, rather than by factors unrelated to freight.
The fourth strategy employs synthetic difference-in-differences (SDID) regressions based on Arkhangelsky, Athey, Hirshberg, Imbens, and Wager (Reference Arkhangelsky, Athey, Hirshberg, Imbens and Wager2021). This approach involves creating synthetic controls using observable characteristics. While the main analyses in the article offer robust evidence supporting the observable counterpart of the parallel trends assumption, thereby countering potential bias from Marmaray anticipation, the SDID approach further validates this by generating counterfactual units that satisfy the parallel trends assumption by construction. The SDID estimates show a 10.16% increase in government debt-to-GDP ratio, an 11.90% decrease in corporate loans and debt-to-GDP ratio, a 10.20% increase in domestic demand for public debt, a 1.21% rise in sovereign yields, and a 10.14% decrease in total corporate debt to the book value of assets ratio.
Collectively, the previous findings provide tangible mechanisms for the significant and multifaceted influence of BRI access on the economic environment along the BRI corridor. For confounding factors to impact the article’s primary conclusions significantly, they would need to strongly correlate with the China TPU index, topographic factors, and OE railway network design from the 1880s, as well as countries’ BRI program membership patterns, while also accounting for several other patterns documented in the article. These include effect dynamics and heterogeneity in public and corporate debt issuance.
Previous analyses and media coverage of the BRI have often portrayed China’s overseas financing as a distinctive form of “patient capital,” characterizing it as a strategic asset for global commercial opportunities (Kaplan (Reference Kaplan2021)). In this article, I also investigate China’s loans and grants to BRI countries. However, my findings diverge from conventional wisdom as I reveal that BRI access leads to a substantial increase in public debt issuance, significantly surpassing the volume of financial assistance provided by China. This is the first study to highlight that nations located along the BRI’s corridors, representing large portions of global GDP and population, assume considerable financial risks by accruing sizable BRI-induced debt. Interestingly, this debt fails to stimulate infrastructure investment; instead, it appears to be directed toward collective consumption, leading to a crowding-out effect on corporate debt issuance.
Another strand of literature this article aligns with examines the corporate consequences of public debt issuance. Huang, Pagano, and Panizza (Reference Huang, Pagano and Panizza2020) discern that an increase in local public debt in China from 2006 to 2013 deterred private investments in respective Chinese cities by prompting banks to constrict credit availability to local businesses. While my analysis considers a comparable economic magnitude of debt issuance, it pertains to public debt issued outside China but linked to the BRI. Nonetheless, my findings also mirror a crowding-out narrative. Another related study by Demirci et al. (Reference Demirci, Huang and Sialm2019) examines how sovereign debt impacts corporate financing choices across 40 countries from 1990 to 2014. Their results indicate that domestically financed government debt adversely affects corporate leverage. My results corroborate their findings, emphasizing that public debt issuance stifles corporate debt issuance, with local investors predominantly absorbing the former. That said, my research question is not on the influence of public debt on corporate debt. I explore how BRI access impacts public and private debt.
This article contributes to the literature on sovereign debt issuance and trade, as well. Papers on sovereign debt issuance argue that governments trade off costs of making timely debt payments against external and internal costs (Bulow and Rogoff (Reference Bulow and Rogoff1989), Gibson and Sundaresan (Reference Gibson and Sundaresan2005), and Serfaty (Reference Serfaty2021)). The external costs include distortions in country reputation (Eaton and Gersovitz (Reference Eaton and Gersovitz1981)), international trade (Bulow and Rogoff (Reference Bulow and Rogoff1989), Gibson and Sundaresan (Reference Gibson and Sundaresan2005), and Rose (Reference Rose2005)), and asset seizures. Internal costs include the transmission of sovereign risk to the private sector (Lee, Naranjo, and Sirmans (Reference Lee, Naranjo and Sirmans2016)), distortion of bank balance sheets (Gennaioli, Martin, and Rossi (Reference Gennaioli, Martin and Rossi2014)), and firm activity (Almeida, Cunha, Ferreira, and Restrepo (Reference Almeida, Cunha, Ferreira and Restrepo2017), Williams (Reference Williams2018)). I extend this literature by presenting novel evidence on the BRI’s consequences. Consistent with the literature, I observe that nations with increased access to trade routes tend to amass more debt. Additionally, I find an upswing in sovereign yields following BRI access, shedding light on BRI-induced risks not previously documented in the literature, as seen in works by Duffie, Pedersen, and Singleton (Reference Duffie, Pedersen and Singleton2003), Lee, Naranjo, and Sirmans (Reference Lee, Naranjo and Sirmans2016), Chernov, Schmid, and Schneider (Reference Chernov, Schmid and Schneider2020), and Du, Pflueger, and Schreger (Reference Du, Pflueger and Schreger2020).Footnote 7
II. Hypothesis Development
This section formulates hypotheses regarding the potential impact of BRI access on financial outcomes. Section II.A explores the links between BRI access and public debt issuance. Section II.B delves into the relationship between BRI access and financing costs, while Section II.C investigates how BRI access could affect private debt issuance.
A. BRI Access and Public Debt Issuance
This section outlines two primary hypotheses concerning the effect of BRI access on public financing, setting them against the null hypothesis that BRI access has no observable effect. The first hypothesis posits that countries, upon BRI access, may prefer direct Chinese loans, bypassing local markets and potentially lowering their public debt issuance (Malik et al. (Reference Malik, Parks, Russell, Lin, Walsh, Solomon, Zhang, Elston and Goodman2021)). An alternative hypothesis suggests that countries might opt for market loans over Chinese financial assistance, either from preference or due to constraints on China’s capacity to fully finance corridor countries, consequently increasing public debt issuance (Serfaty (Reference Serfaty2021)). In summary, these hypotheses present opposing predictions regarding the influence of BRI access on public debt issuance.
A dimension of complexity is added by China’s widely recognized strategy of seizing assets for unpaid loans (Kaplan (Reference Kaplan2021)), which may deter governments from excessive dependence on Chinese funds. Given the inherent unenforceability of public debt contracts, which allows for default with limited backlash (Roos (Reference Roos2019)), populist or corrupt governments may find public debt issuance more appealing, especially if they intend to allocate funds toward social payouts instead of infrastructure projects, or to safeguard against potential asset seizures.
B. BRI Access and Financing Costs
If BRI access provides better trade opportunities and improved growth prospects (Frankel and Romer (Reference Frankel and Romer1999), Alcalá and Ciccone (Reference Alcalá and Ciccone2004)), it could reduce borrowing costs for corridor countries. Under this hypothesis, one could expect a reduction in primary market sovereign yields if corridor countries choose to issue public debt after BRI access. Alternatively, a second hypothesis suggests that higher dependence on China could introduce new sources of risk (Goodman (Reference Goodman2023)). These could originate from supply chain vulnerabilities, political risks, or uncertainties inherent to the BRI itself. In summary, under this counterhypothesis, one might anticipate a surge in sovereign yields post-BRI access. The net effect of BRI access on sovereign yields is therefore not immediately clear ex ante.
Notably, the success of the BRI also hinges on the synergistic collaborations of countries along its pathway. While drawing a causal graph of BRI-related risks is challenging, it is plausible that such risks are interconnected with China’s overall TPU. This suggests that, under the second hypothesis, sovereign debt markets could price China’s TPU, potentially influencing corporate financing decisions, as well.
The previous hypotheses operate under the assumption that BRI access will prompt an economically meaningful increase in public debt issuance. However, if BRI access leads to more Chinese financial assistance rather than an increase in public debt, as suggested by the first hypothesis in Section II.A, then the role of sovereign yields could become less prominent. In this scenario, the specific contractual agreements forged between corridor economies and China gain importance. These contracts might not only entail interest rates but also depend on the terms articulated in buyer’s or seller’s credit agreements, grants, and debt forgiveness, among others. Furthermore, official enrollment in the BRI program could mediate the impact of BRI access on borrowing costs and other related arrangements.
C. BRI Access and Corporate Debt Issuance
Considering the substantial economic scale of the BRI, it is likely that the effects of gaining access to it extend beyond influencing sovereign financing, also impacting corporate financing strategies significantly. This section introduces two main hypotheses, each paralleling previously posited hypotheses in Section II.A. The first hypothesis is a derivative of the initial proposition in Section II.A, which predicts a potential increase in corporate debt issuance, attributable to alternative public financing avenues such as Chinese loans, grants, or credit lines following BRI access. With governments possibly retracting from local debt markets due to these alternative resources, more capital might remain accessible for firms (Williams (Reference Williams2018)). Consequently, this scenario implies a potential crowding-in effect of BRI access.
The second hypothesis emerges from the second proposition in Section II.A, which predicts increased public debt issuance. If governments intensify borrowing within domestic markets, this could heighten competition for capital, constraining firms’ access to finance in local markets (Demirci et al. (Reference Demirci, Huang and Sialm2019), Huang et al. (Reference Huang, Pagano and Panizza2020)). This scenario also underscores the significance of alternative financing channels—for example, ease of equity issuance, access to international debt markets, or availability of bank loans—and relevant firm characteristics such as financial constraints, size, age, and government connections. These attributes could magnify the crowding-out effects of BRI access on firms.
This also leads to an important alternative narrative: treated countries may observe China engaging in infrastructure projects within their borders, primarily employing and paying Chinese firms for the execution. This dynamic could lead local firms to decrease debt issuance, attributed not just to the crowding-out effects of public debt but also to the lack of project opportunities due to the dominance of Chinese firms. If this scenario holds, we would not anticipate effect heterogeneity in corporate debt issuance. Specifically, if local firms’ financing needs diminish because they are not securing projects, there should not be a further reduction in debt issuance, when alternatives like equity issuance or new loan options become readily available. Ultimately, the prevailing effect of the two opposing hypotheses earlier remains uncertain, warranting empirical examination.
III. Background on the Marmaray Project
This section sheds light on the Marmaray project and explains its crucial role in this article’s identification strategy, particularly in determining treatment and control groups of countries in relation to BRI access. In 2004, to combat Istanbul’s pronounced traffic problems, the Turkish government unveiled plans for a 3 km subway tunnel beneath the Bosporus Strait, aiming to link Europe and Asia with underground railways. Illustrated in Graph A of Figure 1 and Figure A1 in the Supplementary Material, the tunnel, positioned 60 m deep and set 19 km away from the seismic fault line, merged the metro systems of the Asian and European sides of Istanbul under the name “Marmaray.”
Graph A of Figure 1 shows the New Silk Road and Trans-Siberian Railway in red and blue, respectively. The red solid lines represent existing fast-speed rail lines, while the pink solid lines denote existing railways planned for upgrades to facilitate faster freight transportation. Graph B shows the Ancient Silk Road in red. I sourced the first map from Mercator Institute for China Studies and the second map from Silk Road Trade & Travel Encyclopedia and recolored the existing paths for ease in visual comparison.

The urgency of the Marmaray project was starkly highlighted by a 5-year study which found that Istanbul residents, on average, dedicated a staggering 3.5 years of their lives to traffic congestion (Gürsoy (Reference Gürsoy2017)).Footnote 8 Despite its urgency, the endeavor turned into one of history’s most significant urban excavations, leading to monumental archaeological findings that complicated its construction timeline.Footnote 9 Notably, these archaeological findings were difficult to locate beforehand. The tunnel’s depth and station placements were determined by geological and seismic considerations, and not by potential archaeological sites, especially given that the existing railway service in the vicinity was entirely above ground at the time (Sakaeda (Reference Sakaeda2005)). While the project was initially slated for completion in 2008, the unforeseen excavations pushed the inauguration of the tunnel to late October 2013.Footnote 10 This timing notably coincided with President Xi Jinping’s announcement of the BRI during his visit to Kazakhstan.
Using hand-collected data from Turkish State Railways (TCDD), Figure A2 in the Supplementary Material depicts the yearly railway passenger counts for both Asian and European sections of Istanbul’s railway system from 2010 to 2020. Once operational, Marmaray swiftly grew in usage. Within a short span, its yearly patronage surged to 50 million, approximating the combined usage of the previously separate Asian and European railways in Istanbul prior to the 2013 renovations. Over the ensuing years, the inauguration of new subway stations eliminated the need for passengers to resort to express bus services to previously opened subway stations. Moreover, the introduction of high-speed rail lines, clocking in at 250 km/h (or 155 mph), extended first to Ankara and subsequently to Sivas in Eastern Turkey, amplifying Marmaray’s user base. By 2019, Marmaray served 125 million passengers, and even amid the 2020 pandemic, it catered to over 75 million.
Marmaray’s significance extends far beyond just linking the European and Asian parts of Istanbul. It serves as a crucial link, granting Eastern European nations swift access to a modern freight network that directly ties them to China, because it facilitates passenger transit during daytime hours and switches to freight transport at night or when there were no passenger services. Figure 1 illustrates how Marmaray’s prime location offers countries to the east of Budapest, Hungary, and to the west of Istanbul, Turkey, immediate connectivity to the BRI’s predominant trade corridor along the historic Silk Road.Footnote 11 This strategic link reduced the freight times between China and Eastern Europe from a lengthy month to just 12 days, whereas the transit times to Western Europe from China saw no significant change, averaging about 18 days.Footnote 12 Graph B of Figure 1 shows the Ancient Silk Road connecting China and Istanbul. A comparison of Graphs A and B reveals the remarkable similarities between the New Silk Road and its ancient counterpart.
Exploiting the variation in geographic locations relative to Budapest and Istanbul, I classify Albania, Bosnia and Herzegovina, Bulgaria, Croatia, Greece, Hungary, Kosovo, Macedonia, Moldova, Montenegro, Romania, Serbia, and Slovenia into a treatment group, with the remaining European nations constituting the control group. This allocation to treatment and control categories is graphically illustrated in Figure 2. As shown, treatment designation is based on new BRI access induced by the Marmaray tunnel. Prior to Marmaray, countries east of Budapest lacked a continuous rail-freight route through Istanbul to China because there was no Bosporus crossing. Figure A4 in the Supplementary Material, for example, documents weaker freight networks and rail speeds in these countries. After the tunnel opened (Figure A1 in the Supplementary Material), treated countries became connected to the BRI network. In contrast, control countries already had overland corridors to China (Figure 2) and thus saw little change in BRI access over the sample period. As noted earlier, neither treated nor control countries could directly influence the timing of Marmaray, which was primarily driven by Istanbul’s traffic needs and the pace of archaeological work under the Bosporus. For these reasons, treatment assignment described in Figure 2 is unlikely to be correlated with country- or firm-level characteristics.
Figure 2 presents countries in treatment and control groups. Treated countries are Albania, Bosnia and Herzegovina, Bulgaria, Croatia, Greece, Hungary, Kosovo, Macedonia, Moldova, Montenegro, Romania, Serbia, and Slovenia. Control countries are the remaining European nations.

IV. Empirical Strategy
In this section, I detail the article’s empirical strategy. I discuss the difference-in-differences framework I use to estimate the effects of BRI access on countries and their firms. In Section E of the Supplementary Material, I describe the supplementary approach of using the SDID methodology to estimate treatment effects, leveraging synthetic counterfactuals that adhere to the parallel trends assumption by construction.
Difference-in-Differences Estimation
I estimate the average treatment effect of BRI access on treated countries by running a difference-in-differences regression with the following two-way fixed effects (TWFE) structure:
 $$ {y}_{i,t}=\beta {\mathrm{Treated}}_i\times {\mathrm{Post}}_t+\gamma {X}_{i,t-1}+{\alpha}_i+{\delta}_t+{\unicode{x025B}}_{i,t}, $$
where $ i $
denotes the country and
$ i $
denotes the country and $ t $
represents the year. The main dependent variables, denoted as
$ t $
represents the year. The main dependent variables, denoted as $ {y}_{i,t} $
, encompass: Government Debt to GDP, which quantifies the annual total government debt of a country as a proportion of its GDP; Corporate Loans and Debt to GDP, representing the consolidated loan and debt stock of non-financial corporations, scaled by GDP; Household Debt to GDP, reflecting the annual household debt in a country, deflated by its GDP; Chinese Financial Assistance to GDP, representing total financial support that China extends to a country, deflated by GDP; and Total Corporate Debt to Assets and Total Long-Term Corporate Debt to Assets, depicting the respective ratios of total debt to book values held by non-financial corporations in a country for a given year.
$ {y}_{i,t} $
, encompass: Government Debt to GDP, which quantifies the annual total government debt of a country as a proportion of its GDP; Corporate Loans and Debt to GDP, representing the consolidated loan and debt stock of non-financial corporations, scaled by GDP; Household Debt to GDP, reflecting the annual household debt in a country, deflated by its GDP; Chinese Financial Assistance to GDP, representing total financial support that China extends to a country, deflated by GDP; and Total Corporate Debt to Assets and Total Long-Term Corporate Debt to Assets, depicting the respective ratios of total debt to book values held by non-financial corporations in a country for a given year.
The coefficient of interest in equation (1) is $ \beta $
, associated with Treated
$ \beta $
, associated with Treated $ {}_i $ $ \times $
Post
$ \times $
Post $ {}_t $
. It quantifies the homogeneous average treatment effect of BRI access on treated countries. The variable Treated
$ {}_t $
. It quantifies the homogeneous average treatment effect of BRI access on treated countries. The variable Treated $ {}_i $
is assigned a value of 1 for Eastern European countries that gained access to BRI after the Marmaray’s 2013 inauguration and 0 for others (refer to Figure 2 for illustration). Conversely, Post
$ {}_i $
is assigned a value of 1 for Eastern European countries that gained access to BRI after the Marmaray’s 2013 inauguration and 0 for others (refer to Figure 2 for illustration). Conversely, Post $ {}_t $
takes a value of 1 for the years post-2013 and 0 for the preceding years.
$ {}_t $
takes a value of 1 for the years post-2013 and 0 for the preceding years. $ {X}_{i,t-1} $
encompasses control variables including GDP Growth, representing the percentage increase in GDP; Unemployment Rate, indicating the percentage of the labor force that is unemployed; and Exports to GDP and Imports to GDP, quantifying the respective exports and imports as a percentage of GDP.
$ {X}_{i,t-1} $
encompasses control variables including GDP Growth, representing the percentage increase in GDP; Unemployment Rate, indicating the percentage of the labor force that is unemployed; and Exports to GDP and Imports to GDP, quantifying the respective exports and imports as a percentage of GDP. $ {\alpha}_i $
and
$ {\alpha}_i $
and $ {\delta}_t $
signify country and year fixed effects, respectively, while
$ {\delta}_t $
signify country and year fixed effects, respectively, while $ {\unicode{x025B}}_{i,t} $
is the disturbance term.
$ {\unicode{x025B}}_{i,t} $
is the disturbance term.
I complement country-level analyses by conducting regressions on a firm-year panel, enabling the estimation of average treatment effects on firms in treated countries. In particular, I run regressions on
 $$ {y}_{j,t}=\tau {\mathrm{Treated}}_j\times {\mathrm{Post}}_t+\theta {W}_{j,t-1}+{\gamma}_j+{\mu}_{t,k}+{\unicode{x025B}}_{j,t}, $$
where $ j $
signifies the firm,
$ j $
signifies the firm, $ k $
refers to Fama French 48 industry, and
$ k $
refers to Fama French 48 industry, and $ t $
denotes the year. The main firm-level dependent variables, denoted as
$ t $
denotes the year. The main firm-level dependent variables, denoted as $ {y}_{j,t} $
, encompass Total Debt, representing the ratio of a firm’s total debt in year
$ {y}_{j,t} $
, encompass Total Debt, representing the ratio of a firm’s total debt in year $ t $
to its book value of assets as of 2012; Long-Term Debt, indicating the ratio of long-term debt in year
$ t $
to its book value of assets as of 2012; Long-Term Debt, indicating the ratio of long-term debt in year $ t $
to the book value of assets as of 2012; and Non-Convertible Debt, Convertible Debt, Short-Term Debt, and Cash, each reflecting their respective ratios in year
$ t $
to the book value of assets as of 2012; and Non-Convertible Debt, Convertible Debt, Short-Term Debt, and Cash, each reflecting their respective ratios in year $ t $
to the book value of assets as of 2012. Employing the book value of assets from 2012 as a deflator enables the analysis of corporate debt dynamics without the influence of fluctuations in the book value.
$ t $
to the book value of assets as of 2012. Employing the book value of assets from 2012 as a deflator enables the analysis of corporate debt dynamics without the influence of fluctuations in the book value.
The coefficient of interest in equation (2) is $ \tau $
, which quantifies the average treatment effect of BRI access on firms headquartered in treated countries. The variable Treated
$ \tau $
, which quantifies the average treatment effect of BRI access on firms headquartered in treated countries. The variable Treated $ {}_j $
is assigned a value of 1 for firms headquartered in Eastern European countries that gained access to BRI after the Marmaray’s 2013 inauguration and 0 for others, and Post
$ {}_j $
is assigned a value of 1 for firms headquartered in Eastern European countries that gained access to BRI after the Marmaray’s 2013 inauguration and 0 for others, and Post $ {}_t $
takes a value of 1 for the years post-2013 and 0 for the preceding years.
$ {}_t $
takes a value of 1 for the years post-2013 and 0 for the preceding years. $ {W}_{j,t-1} $
includes control variables such as Exchange Rate Growth, indicating the percentage change in the year-end exchange rate to Euros for each firm’s local currency; Log(Book Value), the logarithm of the book value of assets in Euros; Tangibility and Intangibility, the ratios of the book values of tangible and intangible assets to the total book value, respectively; Log(Tobin’s Q), the logarithm of Tobin’s Q; Collateral, the ratio of collateral to book value; Profitability, the ratio of operating income before depreciation/amortization to the book value of assets; Losses, which is 1 if operating income to book value of assets is negative; and Dividend Paying, which is 1 if common dividends are positive. The terms
$ {W}_{j,t-1} $
includes control variables such as Exchange Rate Growth, indicating the percentage change in the year-end exchange rate to Euros for each firm’s local currency; Log(Book Value), the logarithm of the book value of assets in Euros; Tangibility and Intangibility, the ratios of the book values of tangible and intangible assets to the total book value, respectively; Log(Tobin’s Q), the logarithm of Tobin’s Q; Collateral, the ratio of collateral to book value; Profitability, the ratio of operating income before depreciation/amortization to the book value of assets; Losses, which is 1 if operating income to book value of assets is negative; and Dividend Paying, which is 1 if common dividends are positive. The terms $ {\gamma}_j $
and
$ {\gamma}_j $
and $ {\mu}_{t,k} $
represent firm and industry
$ {\mu}_{t,k} $
represent firm and industry $ \times $
year fixed effects, respectively. These allow for the separation of treatment effects from the effects of time-invariant firm characteristics and simultaneous shocks occurring at the industry-year level, like the ones affecting industries due to changes in international trade exposures after the opening of Marmaray. The symbol
$ \times $
year fixed effects, respectively. These allow for the separation of treatment effects from the effects of time-invariant firm characteristics and simultaneous shocks occurring at the industry-year level, like the ones affecting industries due to changes in international trade exposures after the opening of Marmaray. The symbol $ {\unicode{x025B}}_{j,t} $
denotes the error term.
$ {\unicode{x025B}}_{j,t} $
denotes the error term.
In both specifications, I implement two-way clustering at the country and year levels to address potential serial correlation within countries and years. This approach acknowledges the possibility of unobserved correlations within a country or year, inducing correlated disturbances in equations (1) and (2). Such correlations could stem from uncontrolled fluctuations in macroeconomic conditions, unobserved changes in government policies, or unobserved changes in BRI policies affecting multiple countries in a given year.
A possible concern in estimating $ \beta $
in equation (1) or
$ \beta $
in equation (1) or $ \tau $
in equation (2) is the potential breach of the unconfoundedness assumption, which can render the parallel trends assumption unreliable. How could unconfoundedness be violated? Marmaray, arguably, was not designed or financed to influence economic activity in either treated or control countries, and its completion was significantly influenced by unforeseeable archaeological discoveries. However, there may still be skepticism regarding whether certain European governments or firms could have anticipated the completion of Marmaray and its subsequent implications, prompting them to adjust their strategies accordingly.
$ \tau $
in equation (2) is the potential breach of the unconfoundedness assumption, which can render the parallel trends assumption unreliable. How could unconfoundedness be violated? Marmaray, arguably, was not designed or financed to influence economic activity in either treated or control countries, and its completion was significantly influenced by unforeseeable archaeological discoveries. However, there may still be skepticism regarding whether certain European governments or firms could have anticipated the completion of Marmaray and its subsequent implications, prompting them to adjust their strategies accordingly.
The main concern revolves around government expectations regarding yields before and after the completion of Marmaray in the context of BRI access. Some governments might have issued debt before Marmaray’s completion, expecting increased yields. On the other hand, others may have delayed issuance, anticipating reduced yields after Marmaray’s opening. The challenge arises when both debt issuance and yields increase, making it difficult to justify the second alternative hypothesis.
I do the following to mitigate these concerns. First, I offer extensive empirical evidence validating the observable counterpart of the parallel trends assumption. For each estimated BRI effect in the article, treated and control units display closely aligned pre-treatment trends. Second, I employ a more refined approach to estimating average treatment effects locally, bypassing the reliance on the parallel trends assumption. I utilize the latest methodologies in the literature to construct synthetic counterfactuals (Arkhangelsky, Athey, Hirshberg, Imbens, and Wager (Reference Arkhangelsky, Athey, Hirshberg, Imbens and Wager2021)). This method uses covariates to ensure that the trends of observed outcomes for treated units align with those of their synthetic counterparts. This not only guarantees adherence to parallel trends but also validates the findings from previous specifications in a more robust manner. These analyses can be found in Section E of the Supplementary Material. Third, I document covariate balance across a broad set of financial and economic variables, supporting comparability between treated and control units.
V. Summary Statistics
The empirical analyses in this article leverage data aggregated from a variety of sources. The IMF’s Global Debt Database (GDD) provides data on public and private debt, Thomson Reuters Refinitiv contains data on new sovereign and corporate bond issuances, and Thomson Reuters Worldscope delivers data on publicly listed firms. Additionally, comprehensive data on firm ownership, infrastructure investments, public spending, and macroeconomic outcome variables are obtained from Osiris, Eurostat, the World Bank, and the OECD. Since these data sets cover different countries and years, I maximize the inclusivity by utilizing the broadest range of countries available from each source as of 2023.
Table 1 encapsulates essential information on the variables under consideration, with Panels A and B presenting summary statistics at the country level, and Panel C at the firm level, respectively. I provide detailed descriptions for these variables in Sections A.A, A.B, and A.C of the Supplementary Material. In Panel A, the mean (median) government debt-to-GDP ratio is $ 60.50\% $
(
$ 60.50\% $
( $ 53.23\% $
) with a standard deviation of
$ 53.23\% $
) with a standard deviation of $ 34.81\% $
. Corporate loans and debt-to-GDP ratio is, on average,
$ 34.81\% $
. Corporate loans and debt-to-GDP ratio is, on average, $ 95.49\% $
with a median of
$ 95.49\% $
with a median of $ 91.68\% $
and a standard deviation of
$ 91.68\% $
and a standard deviation of $ 44.11\% $
. Household debt-to-GDP ratio has a mean of
$ 44.11\% $
. Household debt-to-GDP ratio has a mean of $ 55.80\% $
, a median of
$ 55.80\% $
, a median of $ 51.79\% $
, and a standard deviation of
$ 51.79\% $
, and a standard deviation of $ 30.91\% $
. GDP growth exhibits a mean and median of
$ 30.91\% $
. GDP growth exhibits a mean and median of $ 1.67\% $
and
$ 1.67\% $
and $ 2.06\% $
, respectively. The average unemployment rate is
$ 2.06\% $
, respectively. The average unemployment rate is $ 8.77\% $
, with a median of
$ 8.77\% $
, with a median of $ 7.25\% $
. The exports-to-GDP ratio averages at
$ 7.25\% $
. The exports-to-GDP ratio averages at $ 54.28\% $
with a median of
$ 54.28\% $
with a median of $ 45.65\% $
, while the imports-to-GDP ratio is
$ 45.65\% $
, while the imports-to-GDP ratio is $ 56.28\% $
(with a
$ 56.28\% $
(with a $ 52.14\% $
median). Total corporate debt to assets averages at
$ 52.14\% $
median). Total corporate debt to assets averages at $ 28.67\% $
, with a median of
$ 28.67\% $
, with a median of $ 26.60\% $
. Long-term corporate debt to assets has a mean and median of
$ 26.60\% $
. Long-term corporate debt to assets has a mean and median of $ 21.08\% $
and
$ 21.08\% $
and $ 20.50\% $
, respectively. The dollar-issue-amount-weighted (VW), average (EW), and median yields to maturity of newly issued domestic sovereign debt are
$ 20.50\% $
, respectively. The dollar-issue-amount-weighted (VW), average (EW), and median yields to maturity of newly issued domestic sovereign debt are $ 1.26\% $
,
$ 1.26\% $
, $ 1.23\% $
, and
$ 1.23\% $
, and $ 1.24\% $
, respectively. These values are calculated after replacing yields with 0 for years without new public debt issuance, a factor controlled for in regressions using dummy variables.Footnote
13
$ 1.24\% $
, respectively. These values are calculated after replacing yields with 0 for years without new public debt issuance, a factor controlled for in regressions using dummy variables.Footnote
13

In Panel B, total social payouts, encompassing government employee wages, collective consumption expenditure, and capital transfers to GDP, average at $ 57.58\% $
and have a median of
$ 57.58\% $
and have a median of $ 58.20\% $
. In contrast, fixed capital formation, representing the net acquisitions of fixed capital, inventories, and valuables, averages at a modest
$ 58.20\% $
. In contrast, fixed capital formation, representing the net acquisitions of fixed capital, inventories, and valuables, averages at a modest $ 11.14\% $
compared to consumption expenditure and has a median of
$ 11.14\% $
compared to consumption expenditure and has a median of $ 10.90\% $
. Railway investments to GDP and road investments to GDP average at
$ 10.90\% $
. Railway investments to GDP and road investments to GDP average at $ 0.24\% $
and
$ 0.24\% $
and $ 0.69\% $
, with medians of
$ 0.69\% $
, with medians of $ 0.22\% $
and
$ 0.22\% $
and $ 0.54\% $
, respectively. Air and sea investments to GDP are minimal, averaging at
$ 0.54\% $
, respectively. Air and sea investments to GDP are minimal, averaging at $ 0.04\% $
each, with medians of
$ 0.04\% $
each, with medians of $ 0.02\% $
and
$ 0.02\% $
and $ 0.01\% $
, respectively. Total infrastructure investments to GDP average at
$ 0.01\% $
, respectively. Total infrastructure investments to GDP average at $ 1.02\% $
with a median of
$ 1.02\% $
with a median of $ 0.90\% $
. Collectively, the data in Panel B highlight the low levels of investment in infrastructure across Europe in recent decades (Mayer, Micossi, Onado, Pagano, and Polo (Reference Mayer, Micossi, Onado, Pagano and Polo2018)).
$ 0.90\% $
. Collectively, the data in Panel B highlight the low levels of investment in infrastructure across Europe in recent decades (Mayer, Micossi, Onado, Pagano, and Polo (Reference Mayer, Micossi, Onado, Pagano and Polo2018)).
In Panel C, the firm-level data illustrate various aspects of debt and cash holdings. Total debt has a mean value of $ 29.92\% $
and a median value of
$ 29.92\% $
and a median value of $ 22.60\% $
. Total long-term debt averages at
$ 22.60\% $
. Total long-term debt averages at $ 17.96\% $
with a median of
$ 17.96\% $
with a median of $ 13.28\% $
. Non-convertible debt averages at
$ 13.28\% $
. Non-convertible debt averages at $ 16.31\% $
, with a median of
$ 16.31\% $
, with a median of $ 9.87\% $
. Convertible debt is scarcely used, with a mean of
$ 9.87\% $
. Convertible debt is scarcely used, with a mean of $ 0.07\% $
and a median of
$ 0.07\% $
and a median of $ 0.00\% $
. Short-term debt averages at
$ 0.00\% $
. Short-term debt averages at $ 6.80\% $
, with a median of
$ 6.80\% $
, with a median of $ 4.07\% $
. Firms hold, on average,
$ 4.07\% $
. Firms hold, on average, $ 15.40\% $
of their assets in cash, with a median value of
$ 15.40\% $
of their assets in cash, with a median value of $ 9.27\% $
.
$ 9.27\% $
.
Table A13 in the Supplementary Material provides evidence for covariate balance before the BRI intervention. Of the 48 Table 1 variables, 45 control-group confidence intervals exclude 0 and 33 treated-group intervals exclude 0, indicating that most mean variables are precisely estimated at the 5% level. Furthermore, confidence intervals intersect for 34 variables and do not intersect for 14, implying balance for the 34 intersecting cases. Among the 14 non-overlapping confidence intervals, eight belong to variables designated as controls, supporting their inclusion in the regression analysis, and the remaining variables—along with all 48 variables—show balance after demeaning following the empirical specifications in equations (1) and (2).Footnote 14
VI. Main Findings
This section presents the main findings of the article. In Section VI.A, the focus is on the consequences of BRI access, detailing its influence on Chinese financial assistance, public and private debt issuance, the types of investors absorbing sovereign debt supply, and the evolving patterns in yields. Section VI.B delves into corporate debt financing strategies in the wake of BRI access. Section VI.C examines public spending, with an emphasis on consumption and infrastructure expenditures. Section VI.D investigates effect heterogeneity based on OE railway network. Section VI.E studies state ownership and firm resilience to credit tightening, Section VI.F presents robustness tests, and Section VI.G provides a discussion.
A. Government Debt Financing After BRI Access
Diving into the empirical findings, Table 2 showcases the effects of BRI access on both public- and private-sector debt issuance, employing a difference-in-differences approach as specified in equation (1). For Government Debt to GDP $ {}_{i,t} $
, the estimated treatment effect of
$ {}_{i,t} $
, the estimated treatment effect of $ 10.39\% $
suggests that post-Marmaray, the treated countries experienced a sharp increase in government debt relative to GDP compared to the control group. The estimated effect is substantial, compared to the unconditional mean of 60.50% listed in Table 1.Footnote
15
$ 10.39\% $
suggests that post-Marmaray, the treated countries experienced a sharp increase in government debt relative to GDP compared to the control group. The estimated effect is substantial, compared to the unconditional mean of 60.50% listed in Table 1.Footnote
15

In contrast, Chinese financial assistance only increases by 0.18%, and this increase is statistically insignificant. In Figure A8 in the Supplementary Material, I present the dynamics of this average treatment effect, revealing a statistically significant 1.50% increase during the first year after the opening of Marmaray. However, the estimated effect of BRI access quickly converges to 0 thereafter. The figure also provides evidence supporting the parallel trends assumption. In Table A5 in the Supplementary Material, I delve deeper into various components of Chinese financial assistance and find that credits to GDP increase by 0.14% (still statistically insignificant), Chinese loans to GDP increase by 0.04% (also statistically insignificant), and grants and other types of assistance show even smaller changes. Table A14 in the Supplementary Material shows that the post-BRI effect on Chinese grants is positive and statistically significant among BRI member countries, whereas the corresponding effect is negligible for non-members. These results align with the second hypothesis in Section II.A, which predicts an increase in public debt issuance, rather than the first hypothesis, which predicts an increase in continued Chinese assistance.
Turning to Table 2, Corporate Loans and Debt to GDP $ {}_{i,t} $
shows a negative coefficient of
$ {}_{i,t} $
shows a negative coefficient of $ -14.18\% $
, suggesting a reduction in corporate debt issued by private and publicly listed firms in the treated countries after BRI access. Similarly, for publicly listed firms in treated countries, Total Corporate Debt to Assets
$ -14.18\% $
, suggesting a reduction in corporate debt issued by private and publicly listed firms in the treated countries after BRI access. Similarly, for publicly listed firms in treated countries, Total Corporate Debt to Assets $ {}_{i,t} $
and Total Long-Term Corporate Debt to Assets
$ {}_{i,t} $
and Total Long-Term Corporate Debt to Assets $ {}_{i,t} $
exhibit coefficients of
$ {}_{i,t} $
exhibit coefficients of $ -12.77\% $
and
$ -12.77\% $
and $ -9.17\% $
, respectively, both significant at the
$ -9.17\% $
, respectively, both significant at the $ 1\% $
level. These findings indicate a trend of reduced corporate debt post-BRI access, with the dependent variables controlling for book values of assets rather than GDP. Meanwhile, Household Debt to GDP
$ 1\% $
level. These findings indicate a trend of reduced corporate debt post-BRI access, with the dependent variables controlling for book values of assets rather than GDP. Meanwhile, Household Debt to GDP $ {}_{i,t} $
demonstrates an insignificant increase of
$ {}_{i,t} $
demonstrates an insignificant increase of $ 1.86\% $
, suggesting no substantial impact of BRI on household debt levels in the treated countries.
$ 1.86\% $
, suggesting no substantial impact of BRI on household debt levels in the treated countries.
These findings suggest a dichotomy in the effects of the BRI on debt issuance between the public and private sectors. After BRI access, there is a marked increase in government debt, contrasted by a decline in corporate debt, particularly long term, in the treated countries, supporting the crowding-out narrative in Section II.C. An alternative explanation centers around the economic turbulence that commenced in 2009 within the Eurozone, instigated by substantial public debt levels, particularly within the PIIGS countries (Portugal, Ireland, Italy, Greece, and Spain). These nations became focal points due to their diminishing economic performance and escalating financial instability, casting doubt on their capacity to repay debts and igniting fears of default. While the European debt crisis does not perfectly align with the post-treatment period examined in this article, and the PIIGS countries are represented in both treatment and control groups, it is crucial to ascertain whether the findings are influenced by these countries and the broader debt crisis spanning from 2009 to the mid-2010s. For this reason, I conduct robustness tests in which I exclude the PIIGS nations from the analysis. Table A6 in the Supplementary Material demonstrates that the core results of this article remain robust after this exclusion.
Another important assessment of the study’s robustness can be found in Table A1 in the Supplementary Material, where two placebo tests are conducted. The first test (Panel A of Table A1 in the Supplementary Material) compares Western European countries (the control group in Table 2) with placebo treatment units from the Middle East and Western Asia, both before and after the opening of Marmaray. The second placebo test (Panel B of Table A1 in the Supplementary Material) uses countries from the rest of Asia as placebo treatment units. It is important to note that these placebo treatment groups are already situated along the BRI corridor, irrespective of Marmaray’s opening. In both cases, the estimated effects are both statistically and economically insignificant. These test results provide support for the conclusion that China access alone does not lead to changes in debt issuance in nearby countries when compared to the control units. Nonetheless, the effects become pronounced when Marmaray serves as a conduit for BRI access. Table A1 in the Supplementary Material also indicates that BRI access due to Marmaray’s inauguration does not manifest observable spillover effects on neighboring countries outside the control group.
Figure 3 provides substantial evidence for the observable counterpart of the parallel trends assumption, a critical precondition for the difference-in-differences estimation strategy employed in Table 2. It shows the time-specific treatment effects of BRI access on public and non-financial corporate debt-to-GDP ratios, revealing no discernible pre-trends in either variable. Post-treatment, public debt to GDP experiences a rapid and sustained increase, while corporate debt to GDP exhibits a nearly symmetrical decline. Importantly, the dashed lines in Figure 3 represent the treatment effect of BRI access on GDP growth, which, as illustrated, is neither economically nor statistically significant.
Figure 3 presents time-specific treatment effects of BRI access on public (Graph A) and non-financial corporate debt-to-GDP (Graph B) ratios (Government Debt to GDP $ {}_{i,t} $
and Corporate Loans and Debt to GDP
$ {}_{i,t} $
and Corporate Loans and Debt to GDP $ {}_{i,t} $
). The effects are estimated by using a two-way fixed effects structure (i.e., after controlling for country and year fixed effects), and 90% confidence intervals are drawn for each point estimate. The dashed line illustrates the impact of BRI access on GDP growth. Data are pulled from IMF’s GDD data set. Detailed variable descriptions are in Section A of the Supplementary Material.
$ {}_{i,t} $
). The effects are estimated by using a two-way fixed effects structure (i.e., after controlling for country and year fixed effects), and 90% confidence intervals are drawn for each point estimate. The dashed line illustrates the impact of BRI access on GDP growth. Data are pulled from IMF’s GDD data set. Detailed variable descriptions are in Section A of the Supplementary Material.

I present trends in the issuance of public and corporate debt separately for treated and control units in Figure 4.Footnote 16 As shown in this figure, the fitted public debt-to-GDP ratio for control units remains relatively stable at around 60% from the pre-treatment era until 2019. In contrast, the public debt-to-GDP ratio for treatment units follows a similar path to control units in the pre-treatment era but increases from 63% to approximately 74% by 2019. Notably, this gap between treatment and control units persists during the COVID-19 era. Similarly, the corporate debt-to-GDP ratios for treated and control units closely mirror each other in the pre-treatment era. However, after treatment, the corporate debt-to-GDP ratio for control units remains relatively stable, whereas the ratio for treatment units experiences a significant decline. These findings provide further evidence in support of the observable counterpart of the parallel trends assumption and empirically highlight that the reported treatment effects are due to treatment effects on treated countries.
Graph A of Figure 4 illustrates linear trends in the total annual stock of government debt, deflated by GDP (Government Debt to GDP $ {}_{i,t} $
) during the period of the Marmaray’s opening event. Graph B illustrates linear trends in the combined loan and debt stock of non-financial corporations, deflated by GDP (Corporate Loans and Debt to GDP
$ {}_{i,t} $
) during the period of the Marmaray’s opening event. Graph B illustrates linear trends in the combined loan and debt stock of non-financial corporations, deflated by GDP (Corporate Loans and Debt to GDP $ {}_{i,t} $
) during the period of the Marmaray’s opening event. Figures display fitted values for both treatment and control groups, after employing a two-way fixed effects structure (i.e., controlling for country and year fixed effects) and control variables, as represented in equation (1).
$ {}_{i,t} $
) during the period of the Marmaray’s opening event. Figures display fitted values for both treatment and control groups, after employing a two-way fixed effects structure (i.e., controlling for country and year fixed effects) and control variables, as represented in equation (1).

Figure A6 in the Supplementary Material complements the previous findings by highlighting the effect dynamics on countrywide corporate debt-to-assets ratios, specifically on Total Corporate Debt to Assets $ {}_{i,t} $
and Total Long-Term Corporate Debt to Assets
$ {}_{i,t} $
and Total Long-Term Corporate Debt to Assets $ {}_{i,t} $
. Once again, no pre-trends are observed in the pre-treatment era, and substantial and increasing reductions in debt issued by firms in treated countries are evident post-BRI access. Furthermore, the negative treatment effects grow stronger alongside an increase in government debt issuance. This trend suggests that private debt issuance may be influenced or delayed in response to the rising public debt, as clearly illustrated in Figure 3.
$ {}_{i,t} $
. Once again, no pre-trends are observed in the pre-treatment era, and substantial and increasing reductions in debt issued by firms in treated countries are evident post-BRI access. Furthermore, the negative treatment effects grow stronger alongside an increase in government debt issuance. This trend suggests that private debt issuance may be influenced or delayed in response to the rising public debt, as clearly illustrated in Figure 3.
The findings so far show a clear rise in public debt and a corresponding decline in private debt, largely due to a decrease in corporate debt. To fully understand whether the rise in public debt is impacting private debt issuance—given potential competitive disadvantage of private firms against governments—more exploration into the economic mechanisms is needed. The subsequent analysis therefore focuses on identifying the entities that are absorbing public debt issuance in the treated countries.
Table 3 reveals who absorbs the increased sovereign debt supply, showing a strong preference for domestic entities, especially domestic banks and non-bank financial institutions, as evidenced by a significant coefficient of $ 12.55\% $
in column 1. The effect is substantial when compared to the unconditional mean of
$ 12.55\% $
in column 1. The effect is substantial when compared to the unconditional mean of $ 40.79\% $
, as shown in Table 1. This result is particularly striking when contrasted with the negligible interest from other investors, such as local and foreign central banks, and foreign investors, evidenced by the insignificant coefficients in columns 2–4. In particular, the shares of debt owned by the nation’s central bank (Domestic CB
$ 40.79\% $
, as shown in Table 1. This result is particularly striking when contrasted with the negligible interest from other investors, such as local and foreign central banks, and foreign investors, evidenced by the insignificant coefficients in columns 2–4. In particular, the shares of debt owned by the nation’s central bank (Domestic CB $ {}_{i,t} $
), foreign banks and non-bank investors (Foreign Investors
$ {}_{i,t} $
), foreign banks and non-bank investors (Foreign Investors $ {}_{i,t} $
), and foreign central banks (Foreign CB
$ {}_{i,t} $
), and foreign central banks (Foreign CB $ {}_{i,t} $
) do not show significant changes after BRI access, with coefficients of
$ {}_{i,t} $
) do not show significant changes after BRI access, with coefficients of $ -4.03\% $
,
$ -4.03\% $
, $ 1.79\% $
, and
$ 1.79\% $
, and $ -5.69\% $
, respectively. These findings suggest that BRI-driven sovereign debt is predominantly absorbed by domestic entities, limiting the exposure and subsequent impacts on foreign investors and central banks to the fiscal repercussions of such debt, while intensifying competition for local firms seeking to finance their operations through local debt markets.
$ -5.69\% $
, respectively. These findings suggest that BRI-driven sovereign debt is predominantly absorbed by domestic entities, limiting the exposure and subsequent impacts on foreign investors and central banks to the fiscal repercussions of such debt, while intensifying competition for local firms seeking to finance their operations through local debt markets.

Table A10 in the Supplementary Material shows that Table 3 results are robust to further controlling for i) capital controls on bonds, equity, money-market instruments, derivatives, credit operations, direct investment, and real estate (including nonresident-specific purchase/sale restrictions); and ii) a macroprudential policy measure defined as the net count of tightenings minus easings across 15 tools including countercyclical capital buffer, capital conservation buffer, capital requirements, leverage ratio, loan-loss provisioning, limits on credit growth, borrower-based loan restrictions, limits on foreign-currency loans, loan-to-value limits, debt-service-to-income limits, tax measures on financial intermediation, liquidity requirements, loan-to-deposit ratio limits, limits on foreign-exchange positions, and reserve requirements.
Graph A of Figure 5 presents the linear trends in the proportion of government debt held by domestic investors around the time of Marmaray’s opening, revealing that control units do not observe any major changes, while treatment units experience an increase in domestic demand for sovereign debt. Graph B unveils the dynamic treatment effects of BRI access, showing an immediate and statistically significant positive effect which remains robust for 8 years. This illustration not only reinforces the findings from Table 3, demonstrating a clear preference of domestic investors in treated countries for holding government-issued debt post-Marmaray, but also provides a visual support for the parallel trends between treated and control groups, thereby bolstering the credibility of Table 3’s findings.
Graph A of Figure 5 illustrates linear trends in the percentage of government-issued debt held by domestic investors (Domestic Investors $ {}_{i,t} $
) during the Marmaray’s opening event period. It displays fitted values for both treatment and control groups, after employing a two-way fixed effects structure (i.e., controlling for country and year fixed effects), as represented in equation (1). Graph B presents time-specific treatment effects of BRI access on the percentage of government-issued debt held by domestic investors, along with 90% confidence intervals for each point estimate. The data are sourced from Arslanalp and Tsuda (Reference Arslanalp and Tsuda2014a), (Reference Arslanalp and Tsuda2014b).
$ {}_{i,t} $
) during the Marmaray’s opening event period. It displays fitted values for both treatment and control groups, after employing a two-way fixed effects structure (i.e., controlling for country and year fixed effects), as represented in equation (1). Graph B presents time-specific treatment effects of BRI access on the percentage of government-issued debt held by domestic investors, along with 90% confidence intervals for each point estimate. The data are sourced from Arslanalp and Tsuda (Reference Arslanalp and Tsuda2014a), (Reference Arslanalp and Tsuda2014b).

Graph C of Figure A11 in the Supplementary Material shows that local-market issuance increases in treated countries—both in local currency and in Euros—while neither local-market foreign-currency issuance nor foreign-market issuance rises. In line with these results, Table A11 in the Supplementary Material shows in detail that public debt ownership of domestic banks increases by 9.19% and domestic non-banks increases by 6.89%. Overall, these patterns complement the Table 3 evidence that domestic investors absorb BRI-related increases in public borrowing.
The final piece of evidence on public debt financing pertains to original yields, as illustrated in Table 4. Panel A of the table demonstrates an increase in original yields to maturity for newly issued public debt following BRI access, with the estimated treatment effects in columns 1–3 being $ 1.33\% $
,
$ 1.33\% $
, $ 1.24\% $
, and
$ 1.24\% $
, and $ 1.27\% $
, respectively. These findings suggest an increase in cost of debt for countries that gain BRI access, mirroring the escalated risk discerned by investors. Importantly, they are robust to controlling for various bond characteristics such as Macaulay Duration, Investment Grade, and Inflation Protection dummies, along with macroeconomic outcomes.
$ 1.27\% $
, respectively. These findings suggest an increase in cost of debt for countries that gain BRI access, mirroring the escalated risk discerned by investors. Importantly, they are robust to controlling for various bond characteristics such as Macaulay Duration, Investment Grade, and Inflation Protection dummies, along with macroeconomic outcomes.

Figure 6 begins by illustrating the fitted values for both treatment and control groups, yielding important insights. First, it confirms the existence of highly parallel trends in the pre-treatment period. Second, it uncovers evidence of effect heterogeneity. The linear trends for treated units reveal a 50-basis-point increase in yields immediately after the inauguration of Marmaray and the consequent escalation in public debt issuance in 2013. The magnitude of this effect experiences variations over time, possibly mirroring the dynamic nature of risks related to the BRI. The second part of the figure delineates the dynamic treatment effects with confidence intervals, thereby validating the parallel trends and underscoring the significance of the effects in the post-treatment period.
Graph A of Figure 6 illustrates linear trends in dollar-issue-amount-weighted yields to maturity (Yield to Maturity $ {}_{i,t} $
) during the Marmaray’s opening event period. It displays fitted values for both treatment and control groups, after employing a two-way fixed effects structure (i.e., controlling only for country and year fixed effects), as represented in equation (1). Graph B presents time-specific treatment effects of BRI access on the sovereign yields, along with 90% confidence intervals for each point estimate. The data are sourced from Refinitiv. Detailed variable descriptions are in Section A of the Supplementary Material.
$ {}_{i,t} $
) during the Marmaray’s opening event period. It displays fitted values for both treatment and control groups, after employing a two-way fixed effects structure (i.e., controlling only for country and year fixed effects), as represented in equation (1). Graph B presents time-specific treatment effects of BRI access on the sovereign yields, along with 90% confidence intervals for each point estimate. The data are sourced from Refinitiv. Detailed variable descriptions are in Section A of the Supplementary Material.

Panel B of Table 4 complements the previous findings by examining the influence of BRI access on corporate original yields. As shown in columns 4–6 of Panel B, corporate original yields increase by 1.28% to 1.71% after BRI access. Comparing value-weighted, equally weighted, and median measures of original sovereign and corporate debt issuances, Panel B indicates that corporate yields rise slightly more than sovereign yields after BRI access. This pattern is consistent with the notion that corporate bond yields are often subject to sovereign “floors.” Namely, sovereign credit risk forms a component of corporate credit risk, so risk compensation for corporate borrowers is at least as high as that for their sovereigns (Durbin and Ng (Reference Durbin and Ng2005), Dittmar and Yuan (Reference Dittmar and Yuan2008), Mendoza and Yue (Reference Mendoza and Yue2012), Corsetti, Kuester, Meier, and Müller (Reference Corsetti, Kuester, Meier and Müller2014), Almeida et al. (Reference Almeida, Cunha, Ferreira and Restrepo2017), and Bevilaqua, Hale, and Tallman (Reference Bevilaqua, Hale and Tallman2020)). For brevity, Figure A10 in the Supplementary Material reports the dynamic treatment effects with confidence intervals, validating parallel trends and showing post-treatment effects in the range of 0.80%–2.00%.
In summary, this section unveils crucial insights into the financial adaptations occurring in Eastern Europe in the wake of Marmaray’s opening. There is a significant increase in public debt issuance for countries accessing BRI, contrasted with a significant decline in private debt financing, especially by non-financial firms, evidenced by reductions in country-level and long-term debt-to-asset ratios. A closer look at debt absorption shows that the influx in public debt is mainly absorbed domestically, particularly by non-bank investors and banks, who are compensated with higher yields to maturity.
B. Corporate Debt Financing After BRI Access
The preceding section has shed light on the implications of BRI access on country-level debt ratios. In this section, the focus narrows to explore the impact of BRI access on firm-level leverage, employing a difference-in-differences model as outlined in equation (2). This approach facilitates the estimation of treatment effects at the firm level, ensuring the observed effects in columns 4–5 of Table 2 are not disproportionately driven by large firms. It also allows me to provide insights into how firms adapt to evolving financing conditions, such as rising yields, within their domestic landscapes.
Table 5 reveals significant insights into how the BRI influences corporate debt financing, showing a significant reduction in various debt categories for treated countries post-treatment. Specifically, total debt, long-term debt, non-convertible debt, and short-term debt see changes of $ -5.08\% $
,
$ -5.08\% $
, $ -2.38\% $
,
$ -2.38\% $
, $ -2.67\% $
, and
$ -2.67\% $
, and $ -1.84\% $
, respectively, all economically significant compared to the mean values reported in Table 1. Conversely, there is a strategic increase in cash holdings by
$ -1.84\% $
, respectively, all economically significant compared to the mean values reported in Table 1. Conversely, there is a strategic increase in cash holdings by $ 0.95\% $
. This increase in cash reserves is indicative of firms taking precautionary measures to navigate the uncertainties and risks in the evolving financial and economic landscape. Figure 7 validates the parallel trends assumption related to Table 5 and illustrates the dynamic effects of BRI access on firm-level debt-to-assets ratios, specifically Total Debt
$ 0.95\% $
. This increase in cash reserves is indicative of firms taking precautionary measures to navigate the uncertainties and risks in the evolving financial and economic landscape. Figure 7 validates the parallel trends assumption related to Table 5 and illustrates the dynamic effects of BRI access on firm-level debt-to-assets ratios, specifically Total Debt $ {}_{j,t} $
and Non-Conv. Debt
$ {}_{j,t} $
and Non-Conv. Debt $ {}_{j,t} $
. The figure depicts simultaneous reductions in these ratios in the post-treatment period. Overall, these findings highlight distortionary effects of government borrowing on firm borrowing (Akkoyun, Ersahin, and James (Reference Akkoyun, Ersahin and James2023)).
$ {}_{j,t} $
. The figure depicts simultaneous reductions in these ratios in the post-treatment period. Overall, these findings highlight distortionary effects of government borrowing on firm borrowing (Akkoyun, Ersahin, and James (Reference Akkoyun, Ersahin and James2023)).

Figure 7 presents time-specific treatment effects of BRI access on total and non-convertible long-term debt-to-assets ratios (Total Debt $ {}_{j,t} $
and Non-Conv. Debt
$ {}_{j,t} $
and Non-Conv. Debt $ {}_{j,t} $
). The effects are estimated by using a two-way fixed effects structure (i.e., after controlling for country and year fixed effects), and 90% confidence intervals are drawn for each point estimate. Data are pulled from Worldscope data set. Detailed variable descriptions are in Section A of the Supplementary Material.
$ {}_{j,t} $
). The effects are estimated by using a two-way fixed effects structure (i.e., after controlling for country and year fixed effects), and 90% confidence intervals are drawn for each point estimate. Data are pulled from Worldscope data set. Detailed variable descriptions are in Section A of the Supplementary Material.

Table A7 in the Supplementary Material further shows that larger, older, and financially constrained firms cut debt issuance more after BRI access, when public debt issuance rises significantly. Across columns 1–3, the baseline BRI effect (coefficient on $ {\mathrm{Treated}}_i\times {\mathrm{Post}}_t $
) ranges from −1.96% to −3.34%. On top of this baseline, large firms reduce debt by an additional −6.62%. This is consistent with evidence that heavier sovereign issuance crowds out large corporate issuers that rely on public debt markets more (Houston and James (Reference Houston and James1996), Denis and Mihov (Reference Denis and Mihov2003)). Older firms cut debt further by 3.26% as well, which is in line with mature borrowers’ reliance on crowded out public debt markets (Johnson (Reference Johnson1997), Cantillo and Wright (Reference Cantillo and Wright2000)). Furthermore, firms classified as financially constrained by the Whited–Wu index (Whited and Wu (Reference Whited and Wu2006)) also reduce debt issuance incrementally by 4.14%, consistent with disability to obtain external funds amplifying the distortions experienced by firms in public debt issuance.Footnote
17 Complementing these results, Table A8 in the Supplementary Material shows that firms with better access to non-debt financing—such as those in high equity-capitalization markets or with abundant bank credit—substitute further away from bond financing (Faulkender and Petersen (Reference Faulkender and Petersen2006)).
$ {\mathrm{Treated}}_i\times {\mathrm{Post}}_t $
) ranges from −1.96% to −3.34%. On top of this baseline, large firms reduce debt by an additional −6.62%. This is consistent with evidence that heavier sovereign issuance crowds out large corporate issuers that rely on public debt markets more (Houston and James (Reference Houston and James1996), Denis and Mihov (Reference Denis and Mihov2003)). Older firms cut debt further by 3.26% as well, which is in line with mature borrowers’ reliance on crowded out public debt markets (Johnson (Reference Johnson1997), Cantillo and Wright (Reference Cantillo and Wright2000)). Furthermore, firms classified as financially constrained by the Whited–Wu index (Whited and Wu (Reference Whited and Wu2006)) also reduce debt issuance incrementally by 4.14%, consistent with disability to obtain external funds amplifying the distortions experienced by firms in public debt issuance.Footnote
17 Complementing these results, Table A8 in the Supplementary Material shows that firms with better access to non-debt financing—such as those in high equity-capitalization markets or with abundant bank credit—substitute further away from bond financing (Faulkender and Petersen (Reference Faulkender and Petersen2006)).
C. Public Spending for Infrastructure Investments and Social Payouts
Previous sections highlight a significant rise in public debt issuance coupled with a simultaneous decline in private debt issuance in treated countries following the inauguration of Marmaray. The significant increase in public debt issuance raises questions about the allocation and utilization of the newly acquired capital by governments. In this section, I delve into the specifics of how this capital is being used by the governments involved. More precisely, I explore whether the newly raised funds are being channeled into consumption, such as the provision of public goods or salaries for government employees, or if they are being invested in more productive avenues such as R&D or education.
The results presented in Table 6 provide insights into the allocation of resources by governments. Panel A of the table reveals a 2.52% increase in Government Employee Wages to GDP and a 2.40% rise in Collective Consumption to GDP. Additionally, Capital Transfers to GDP experience an 0.92% increase and Total Social Payouts to GDP see a substantial 5.80% increase. However, there is no significant change observed in fixed capital formation to GDP, indicating that the newly raised capital is not being invested in capital formation.

Table A13 in the Supplementary Material complements Table 6 by reporting government expenditures by function and the level of government. Several patterns stand out in Table A13 in the Supplementary Material. First, spending on public order and safety and environmental protection rises after BRI access for general governments. Second, within economic affairs, local-government transport outlays increase, while other categories show no clear change. Third, Panel B reports increases in R&D within general public services and in secondary education at the general-government level. These patterns indicate that categories plausibly linked to productivity—R&D and human capital—also expand, however modestly. The magnitudes of these estimated effects remain small relative to the contemporaneous rise in public debt issuance.Footnote 18
Turning the attention to Panel B of Table 6, my findings do not indicate any significant increase in investments in road, air, and sea infrastructure, either. There is a very modest increase in railway investments to GDP by 0.10% (in addition to rising local-government expenditures on transportation shown in Table A13 in the Supplementary Material), suggesting that the majority of the newly raised capital is not being allocated to infrastructure development projects. In line with these findings, Figure A4 in the Supplementary Material displays the rail-freight corridors across Europe. It confirms that, as of 2024, Eastern Europe’s freight infrastructure still lags significantly behind that of Western, Central, and Southern European regions.
Figure 8 shows the dynamic effects of BRI access on total social payouts. Graph A presents a rapid and persistent increase in social payouts for treated countries, contrasted by a stable trend in control countries. Graph B demonstrates the statistical significance of the differences in social payouts observed between treated and control countries. In conclusion, findings in this section suggest that the increase in public debt issuance is not primarily directed toward infrastructure investments.
Graph A of Figure 8 presents linear trends in total social payouts in treatment and control countries in the event time of Marmaray’s opening. Graph B presents time-specific treatment effects of BRI access on total social payouts. The effects are estimated by using a two-way fixed effects structure (i.e., after controlling for country and year fixed effects), and 90% confidence intervals are drawn for each point estimate. Data are from Eurostat. Detailed variable descriptions are in Section A of the Supplementary Material.

D. Orient Express and Topographic Variation
This section utilizes topographic variation among European countries to further substantiate the underlying mechanisms of the article. If the findings regarding crowding out are primarily attributed to BRI access rather than confounders, then countries better suited for freight logistics should predominantly explain the main findings. Such countries likely possess larger flat lands conducive to freight construction compared to their neighbors, who may have larger mountainous regions and are better suited for road, sea, or air transport.
The topographic variation I introduce derives from the OE, an iconic train service operating between Paris and Istanbul from 1883 to 1977. The routes of the OE provide a novel strategy to identify countries with less mountainous terrain, which was a critical consideration in the route selection of the 1880s.Footnote 19 Countries along the OE routes, therefore, emerge as more likely candidates to seek financing for freight infrastructure. These countries not only possess flatter areas conducive to the OE’s operation but also demonstrate a need for better freight infrastructure after gaining BRI access (see, e.g., Figure A4 in the Supplementary Material).
Motivated by this observation, I employ a triple-difference framework that allows for comparisons among treated countries in the post-treatment period. To perform my triple-difference regressions, I add the interaction term $ {\mathrm{Treated}}_i\times {\mathrm{Post}}_t\times \mathrm{Orient}\;{\mathrm{Express}}_i $
to equation (1), where
$ {\mathrm{Treated}}_i\times {\mathrm{Post}}_t\times \mathrm{Orient}\;{\mathrm{Express}}_i $
to equation (1), where $ {\mathrm{Orient}\ \mathrm{Express}}_i $
is set to 1 for countries along the OE routes, as shown in Graph A of Figure A9 in the Supplementary Material. This triple interaction provides an estimate of the influence of BRI access on the public and private debt issuance of treated countries along the OE routes.Footnote
20
$ {\mathrm{Orient}\ \mathrm{Express}}_i $
is set to 1 for countries along the OE routes, as shown in Graph A of Figure A9 in the Supplementary Material. This triple interaction provides an estimate of the influence of BRI access on the public and private debt issuance of treated countries along the OE routes.Footnote
20
I present my findings in Table 7. Columns 1–4 of the table indicate that BRI access increases debt issuance in treated countries along the OE by 12.85% to 13.31% across various specifications. In contrast, treated countries not on the OE routes do not see similar increases in public debt issuance. Similarly, countries along the OE routes but with existing access to Chinese trade routes via the Trans-Siberian Railway network do not show significant changes in their debt issuance following the opening of Marmaray. These results remain robust after controlling for the Treaty of Berlin, which accounts for the potential influence of the Russo–Turkish War and its long-term effects on Balkan countries which may coincide with the timing of BRI access. The results are also robust after controlling for country and year fixed effects, along with interactive fixed effects that control for yearly variations in treated and OE categories across various specifications. Columns 5–8 show a reduction in corporate loans and debt by 18.44% to 19.48% in treated countries along the OE post-BRI access. Again, treated countries outside the OE routes and OE countries in the control group show no significant changes in their private debt dynamics.

The previous results further corroborate the mechanism, emphasizing that countries more likely to invest in freight networks due to topological and historical factors are the ones driving the observed effects of the study. In Table A9 in the Supplementary Material, I present difference-in-differences regression results based on tighter (i.e., subsample) tests for countries on the OE, off the OE, on the northern OE routes, and on the southern OE routes, as shown in Figure A9 in the Supplementary Material. These subsample analyses confirm that the estimated difference-in-differences findings are robust to excluding countries not on the OE routes. For instance, column 1 of Table A9 in the Supplementary Material shows an 11.98% increase in public debt (compared to the main table coefficient of 10.39% in Table 2) and a 13.04% reduction in corporate loans and debt (compared to the main table coefficient of −14.18% in Table 2). Conversely, running the difference-in-differences regressions on treated and control countries outside the OE network reveals no statistically and economically significant changes in these variables. Collectively, these findings provide additional evidence supporting the notion that the estimated effects of the article are driven by BRI access rather than endogeneity or other factors unrelated to freight.
E. State Ownership and Firm Resilience to Credit Tightening
In this section, I examine whether the estimated BRI effects vary by firm ownership. State-owned enterprises (SOEs) are often insulated from credit constraints, implying that public borrowing may affect SOEs differently from private firms.Footnote 21 To test this, I revisit specification (2) and add two interaction terms capturing SOEs and countries with high levels of public debt, allowing me to examine how corporate borrowing responds to public debt issuance across firm ownership types. If SOEs are indeed insulated from credit tightening, their borrowing should remain relatively stable even in high public debt issuance years, whereas non-SOEs are expected to reduce borrowing in such environments.
Table 8 reports the results. The first column of Table 8 shows that, before accounting for public debt issuance, non-SOEs in treated countries borrow at levels similar to SOEs. SOEs experience a 5.32% reduction in total debt issuance, and the statistically insignificant interaction $ \mathrm{Treated}j\times {\mathrm{Post}}_t\times \mathrm{Non}\hbox{-} {\mathrm{SOE}}_j $
confirms that corporate debt issuance does not systematically differ by government ownership.
$ \mathrm{Treated}j\times {\mathrm{Post}}_t\times \mathrm{Non}\hbox{-} {\mathrm{SOE}}_j $
confirms that corporate debt issuance does not systematically differ by government ownership.

Column 2 reports how public debt issuance affects SOEs and non-SOEs in countries with and without BRI access. In low public issuance countries, BRI treatment effects are $ -9.10\% $
for SOEs and
$ -9.10\% $
for SOEs and $ -7.54\% $
for non-SOEs, indicating only minor differences due to government ownership. Instead, the results point to broader effects of BRI-induced uncertainty or alternative mechanisms. In high public issuance countries, SOEs see a
$ -7.54\% $
for non-SOEs, indicating only minor differences due to government ownership. Instead, the results point to broader effects of BRI-induced uncertainty or alternative mechanisms. In high public issuance countries, SOEs see a $ 2.93\% $
increase in corporate debt following BRI access, while non-SOEs experience a
$ 2.93\% $
increase in corporate debt following BRI access, while non-SOEs experience a $ 3.54\% $
decrease.Footnote
22 The quadruple interaction term,
$ 3.54\% $
decrease.Footnote
22 The quadruple interaction term, $ {\mathrm{Treated}}_j\times {\mathrm{Post}}_t\times \mathrm{Non}\hbox{-} {\mathrm{SOE}}_j\times {\mathrm{High}\ \mathrm{Issuance}}_{c,t} $
, is
$ {\mathrm{Treated}}_j\times {\mathrm{Post}}_t\times \mathrm{Non}\hbox{-} {\mathrm{SOE}}_j\times {\mathrm{High}\ \mathrm{Issuance}}_{c,t} $
, is $ -8.04\% $
and is statistically and economically significant.Footnote
23 This coefficient estimates the additional reduction in corporate debt for non-SOEs in high public debt issuance countries following BRI access.
$ -8.04\% $
and is statistically and economically significant.Footnote
23 This coefficient estimates the additional reduction in corporate debt for non-SOEs in high public debt issuance countries following BRI access.
The third column reports results after including a comprehensive set of fixed effects. After including these, the quadruple interaction $ {\mathrm{Treated}}_j\times {\mathrm{Post}}_t\times \mathrm{Non}\hbox{-} {\mathrm{SOE}}_j\times {\mathrm{High}\ \mathrm{Issuance}}_{c,t} $
remains statistically and economically significant at −13.68%. Overall, the previous evidence indicates that SOEs are shielded from credit constraints in BRI access countries with high public debt issuance.
$ {\mathrm{Treated}}_j\times {\mathrm{Post}}_t\times \mathrm{Non}\hbox{-} {\mathrm{SOE}}_j\times {\mathrm{High}\ \mathrm{Issuance}}_{c,t} $
remains statistically and economically significant at −13.68%. Overall, the previous evidence indicates that SOEs are shielded from credit constraints in BRI access countries with high public debt issuance.
F. Robustness Tests
I present additional robustness tests in Section F of the Supplementary Material. In Section F.A of the Supplementary Material, I show that BRI access effects are concentrated among official program members. Treated countries joining the BRI exhibit an 8.76% increase in public debt and an 11.75% decrease in corporate debt issuance. In Section F.B of the Supplementary Material, I show that China’s TPU significantly affects corporate financing for BRI-connected firms. High China TPU reduces treated firms’ debt issuance by 7.99%, with effects concentrated among official BRI members (−9.39%).
G. Discussion
This section links the main findings of the article with the hypotheses formulated in Section II. Section II.A proposed two hypotheses concerning the impact of BRI access on public debt issuance. The first hypothesis suggested that BRI access would reduce public debt, as countries could leverage Chinese financing. Conversely, the second hypothesis argued that countries would expand their debt issuance, driven by aspirations to transform their economies and upgrade infrastructure after obtaining BRI access. The evidence in Section VI.A provides empirical support for the second hypothesis, demonstrating that countries with BRI access have seen a statistically and economically significant rise in public debt issuance.
In Section II.B, I presented two distinct hypotheses about how BRI access might affect public financing costs. The first anticipated that BRI access would lead to decreased financing costs, observable through reduced sovereign yields for countries using public debt markets, or through lower interest rates for those securing Chinese loans, particularly for official BRI members. The second hypothesis forecasted a surge in financing costs stemming from BRI-related risks. The findings outlined in Section VI.A affirm the second hypothesis, indicating a rise in sovereign and corporate yields post-BRI access. Moreover, these findings suggest that domestic banks and non-bank investors demand higher yields to offset the increased BRI-related risks accompanying the surge in public debt following BRI access.
Section II.C posited two hypotheses regarding the private sector’s response to these developments, specifically the potential crowding in or crowding out of private debt. The findings reported in Section VI.B point to a pronounced crowding-out effect. Evidently, following BRI access, governments are amassing more funds via public debt, elevating yields. These escalated yields draw domestic investors, narrowing the opportunities for companies to issue debt. As a result, some firms resort to alternative financing methods, such as equity issuance.
VII. Conclusion
In September 2013, China unveiled the BRI, poised to be the most transformative infrastructure initiative of the century. Evoking memories of the Ancient Silk Road, the BRI not just represents a monumental infrastructure endeavor but also poses intricate financial challenges. In this study, I provide the first examination of the BRI’s ripple effects on financial outcomes. Using the inauguration of Marmaray beneath Istanbul’s Bosporus Strait as a quasi-natural experiment, I uncover that countries gaining access to the BRI markedly increase their sovereign debt issuance. These governments, however, channel more resources toward collective consumption, sidelining fixed capital investment. Businesses in these countries curtail their debt offerings. BRI-specific risks can be seen in primary market yields.
Transparency around debt allocation—including political ties with BRI and non-BRI partners—is essential to ensure funds are used productively. Since the BRI railway network functions as a cross-border system, delays in one country can weaken investment incentives elsewhere. Greater coordination would therefore help ensure that sovereign borrowing supports complementary efforts. In contrast, BRI countries that rely more heavily on maritime infrastructure—where coordination demands might be lower—may experience different economic and political dynamics. Overall, the regulatory and institutional reforms discussed earlier would benefit not only European countries but also other BRI participants by reducing trade-related uncertainty across the broader BRI network.
Supplementary Material
To view supplementary material for this article, please visit http://doi.org/10.1017/S0022109026102762.


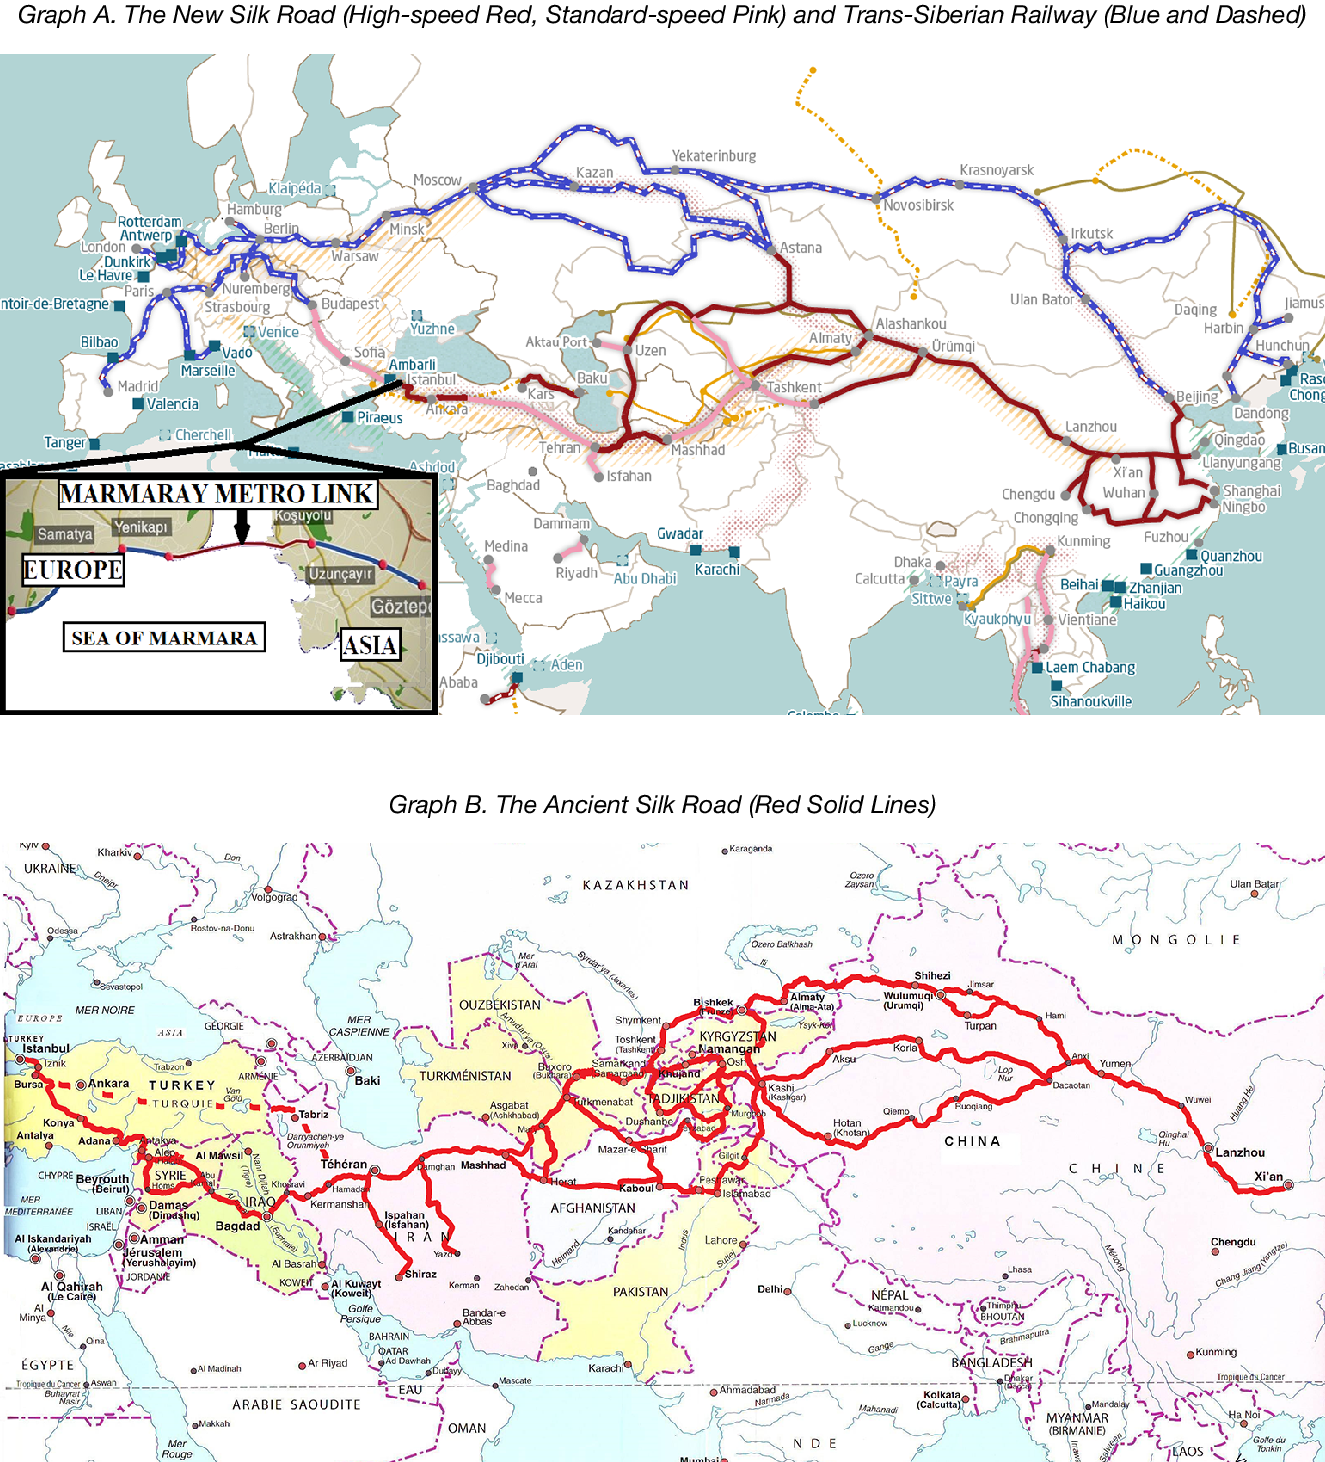
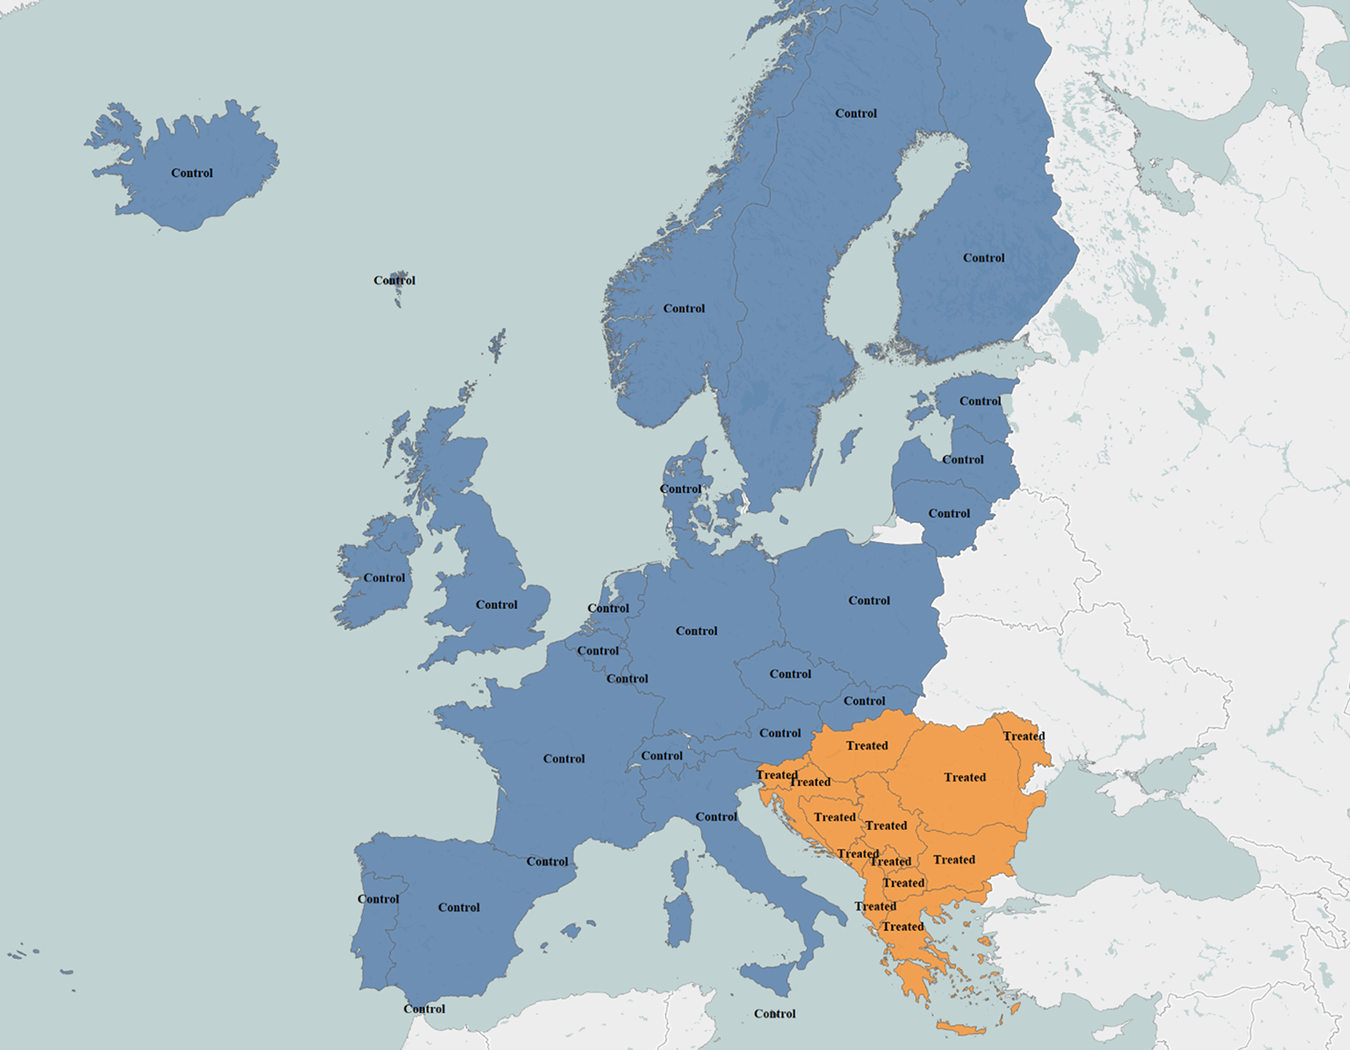
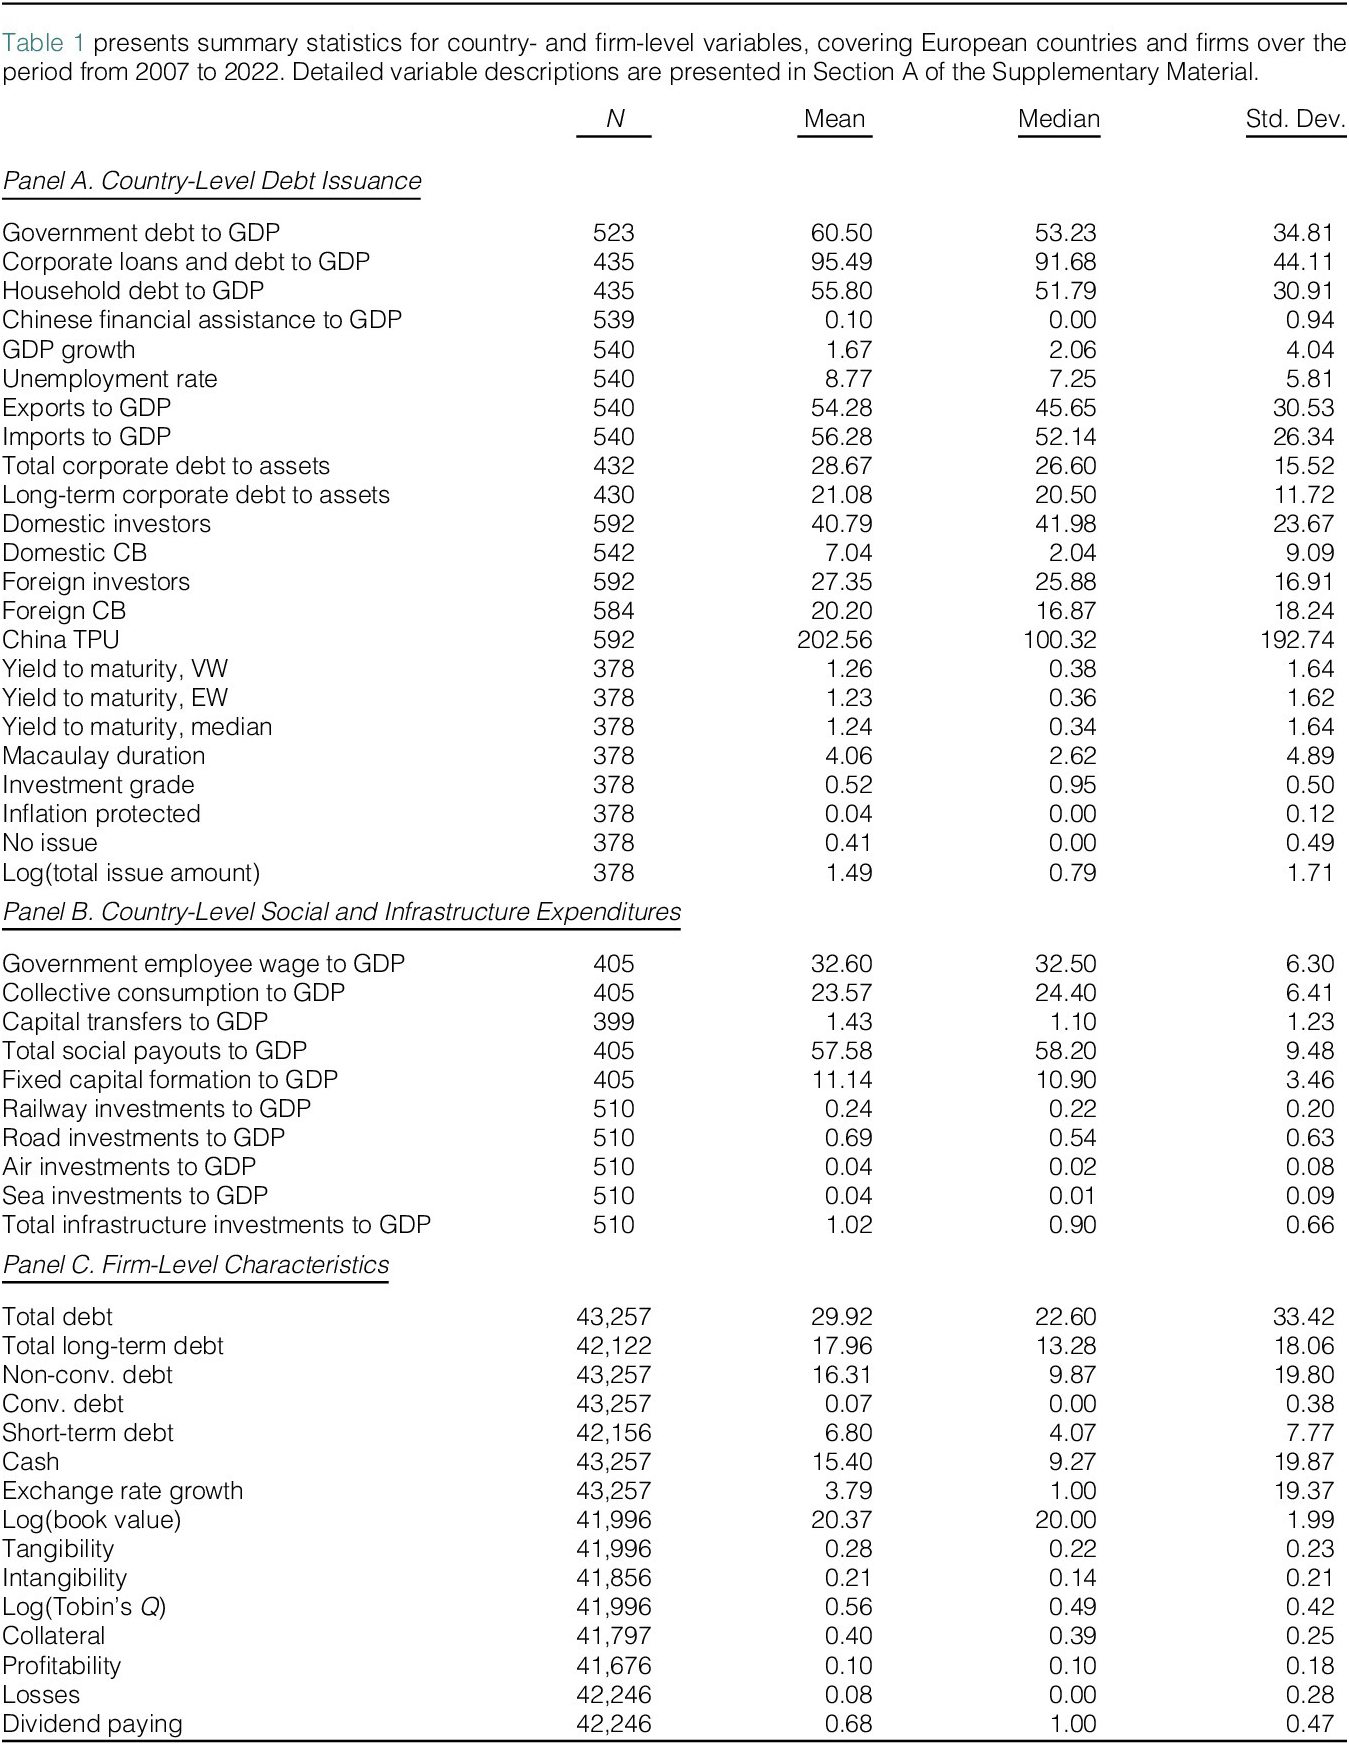
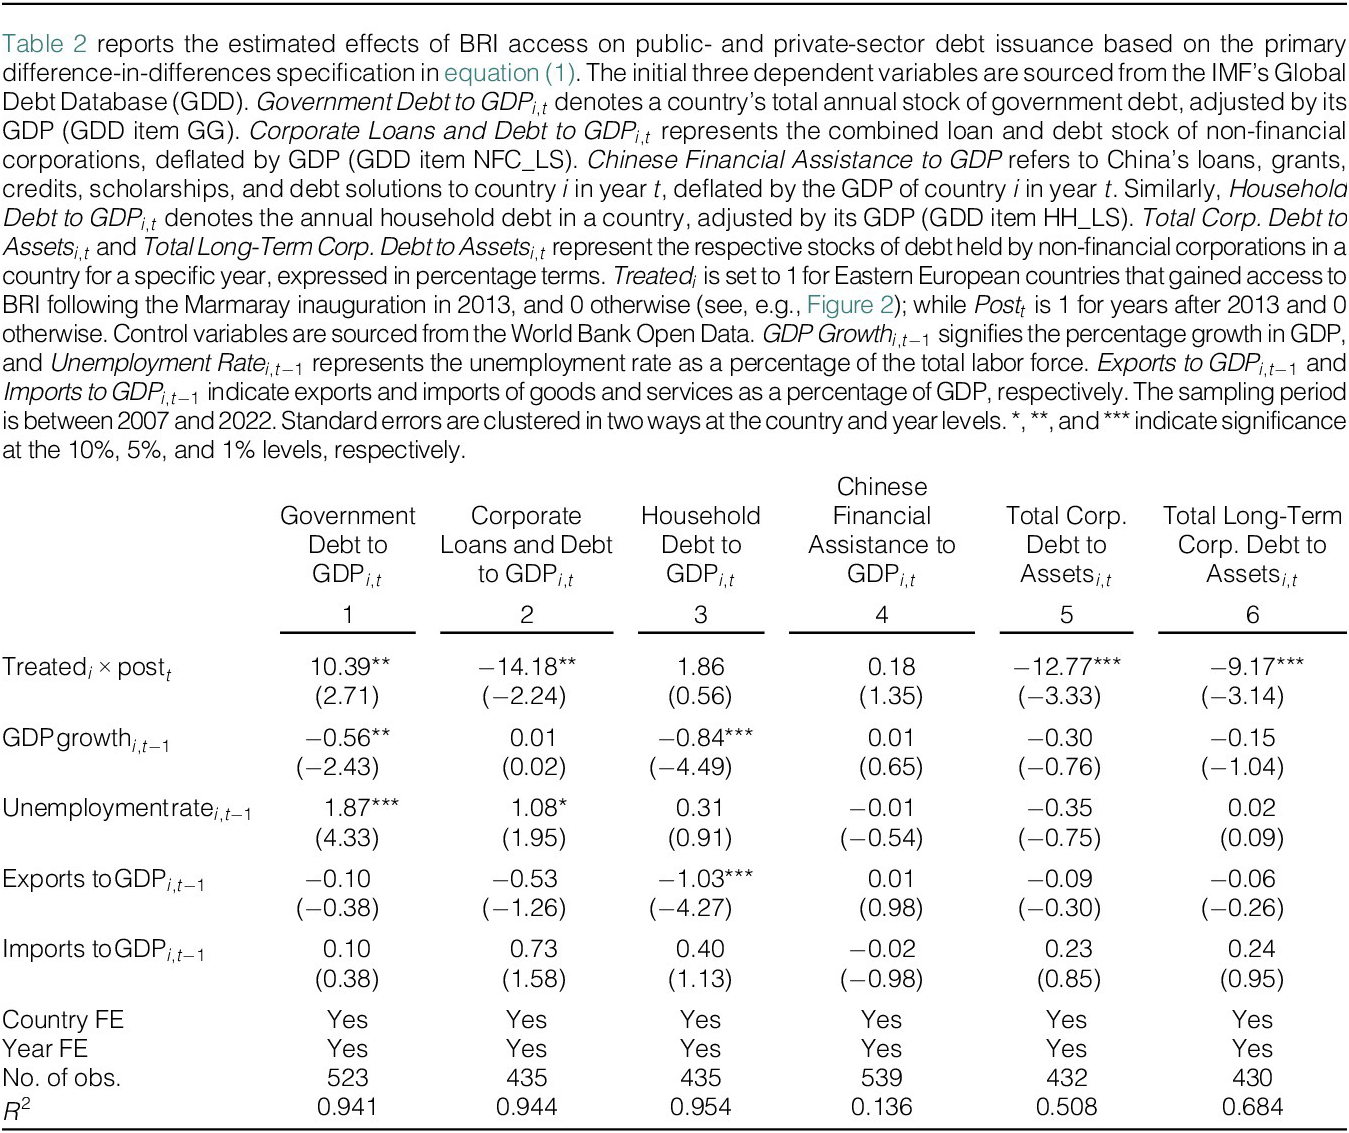
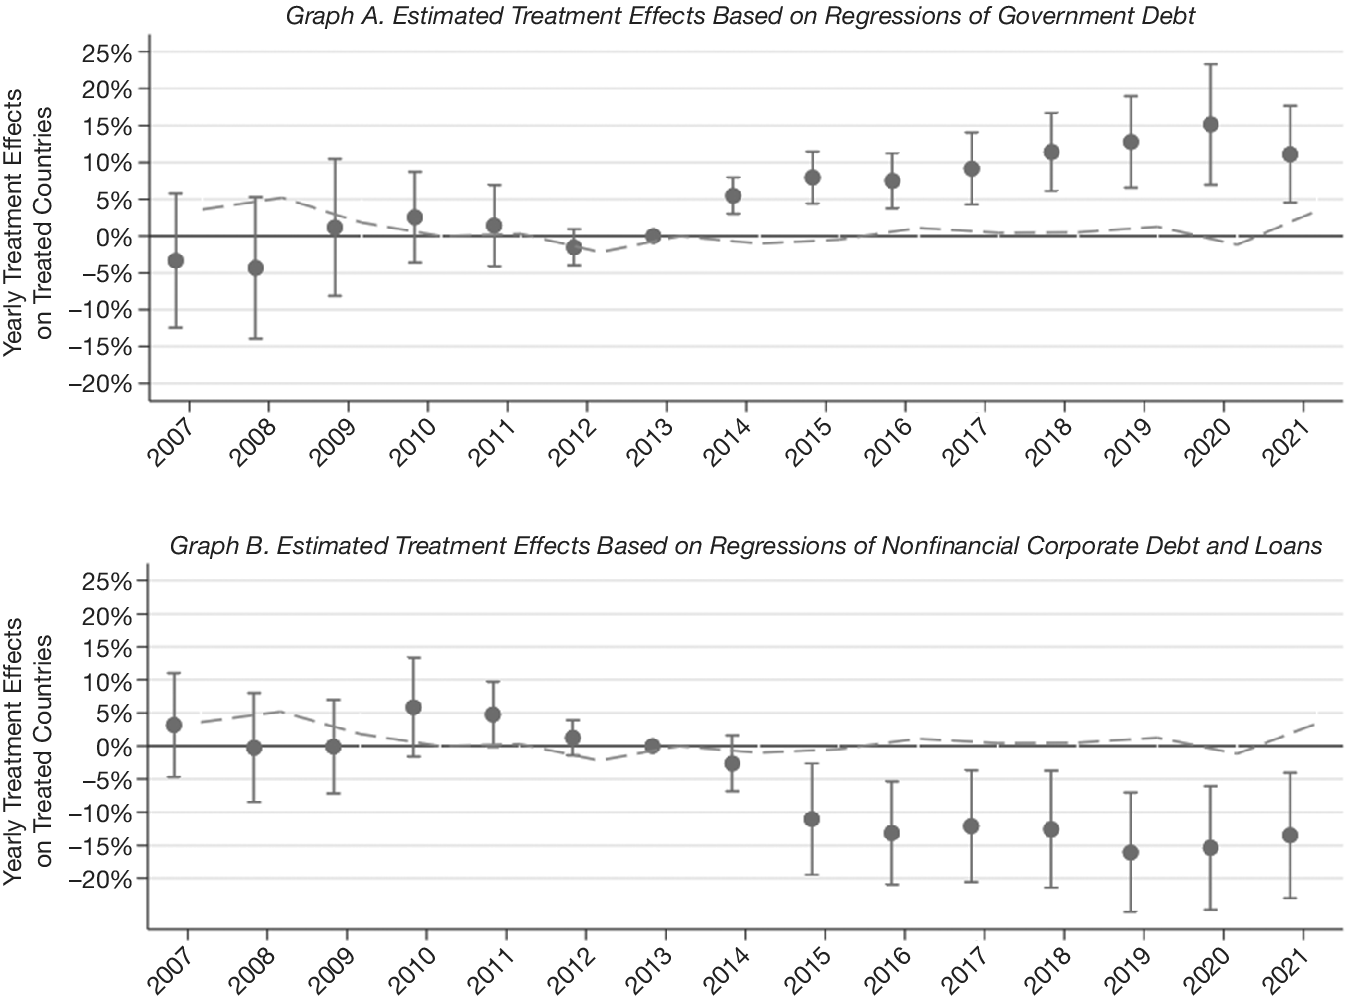


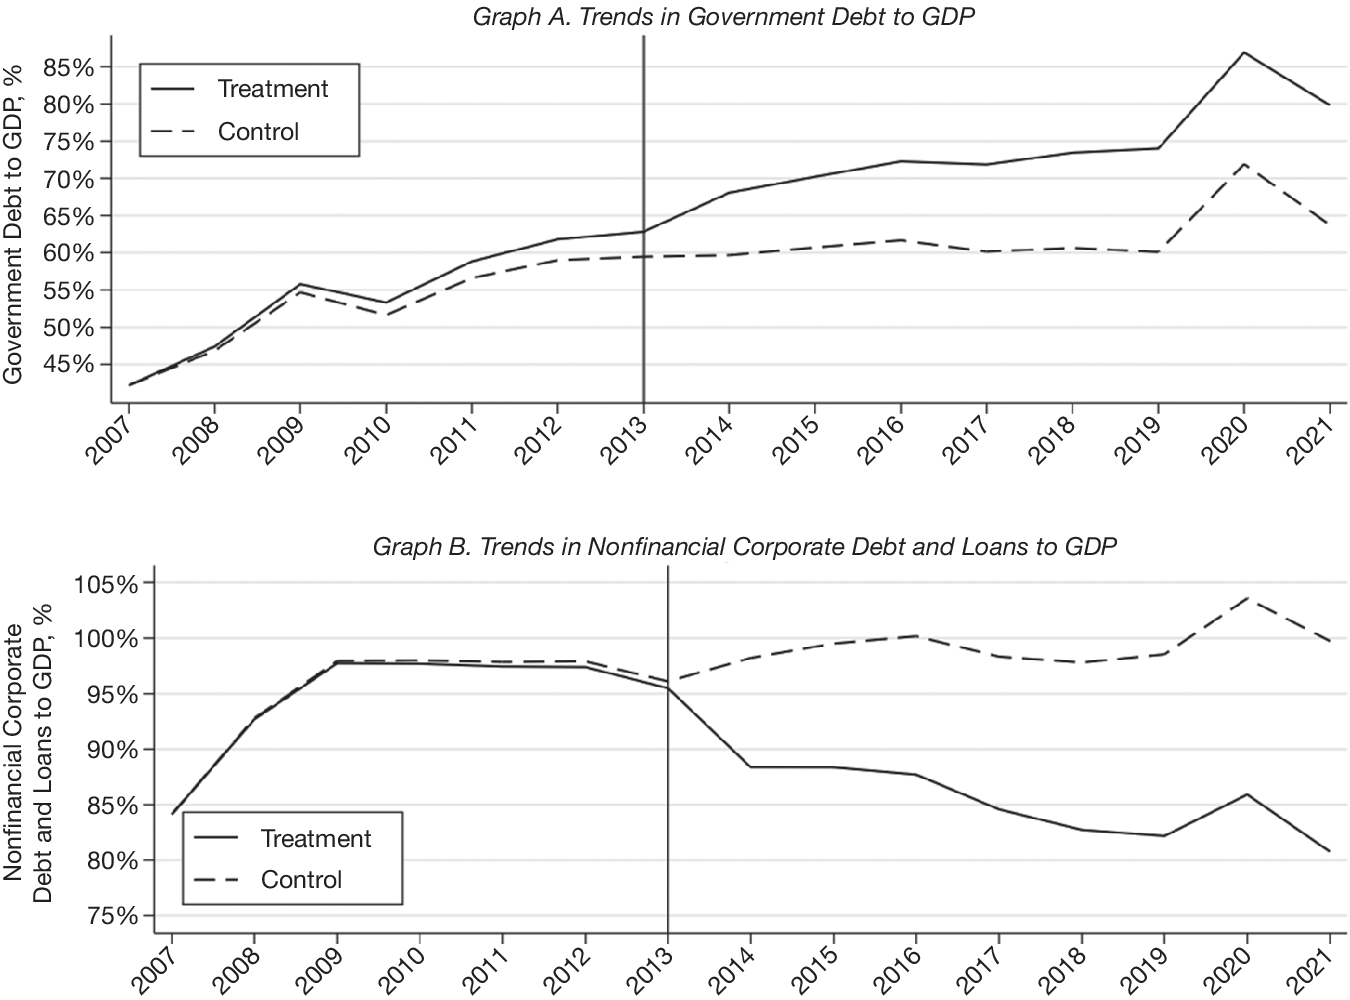


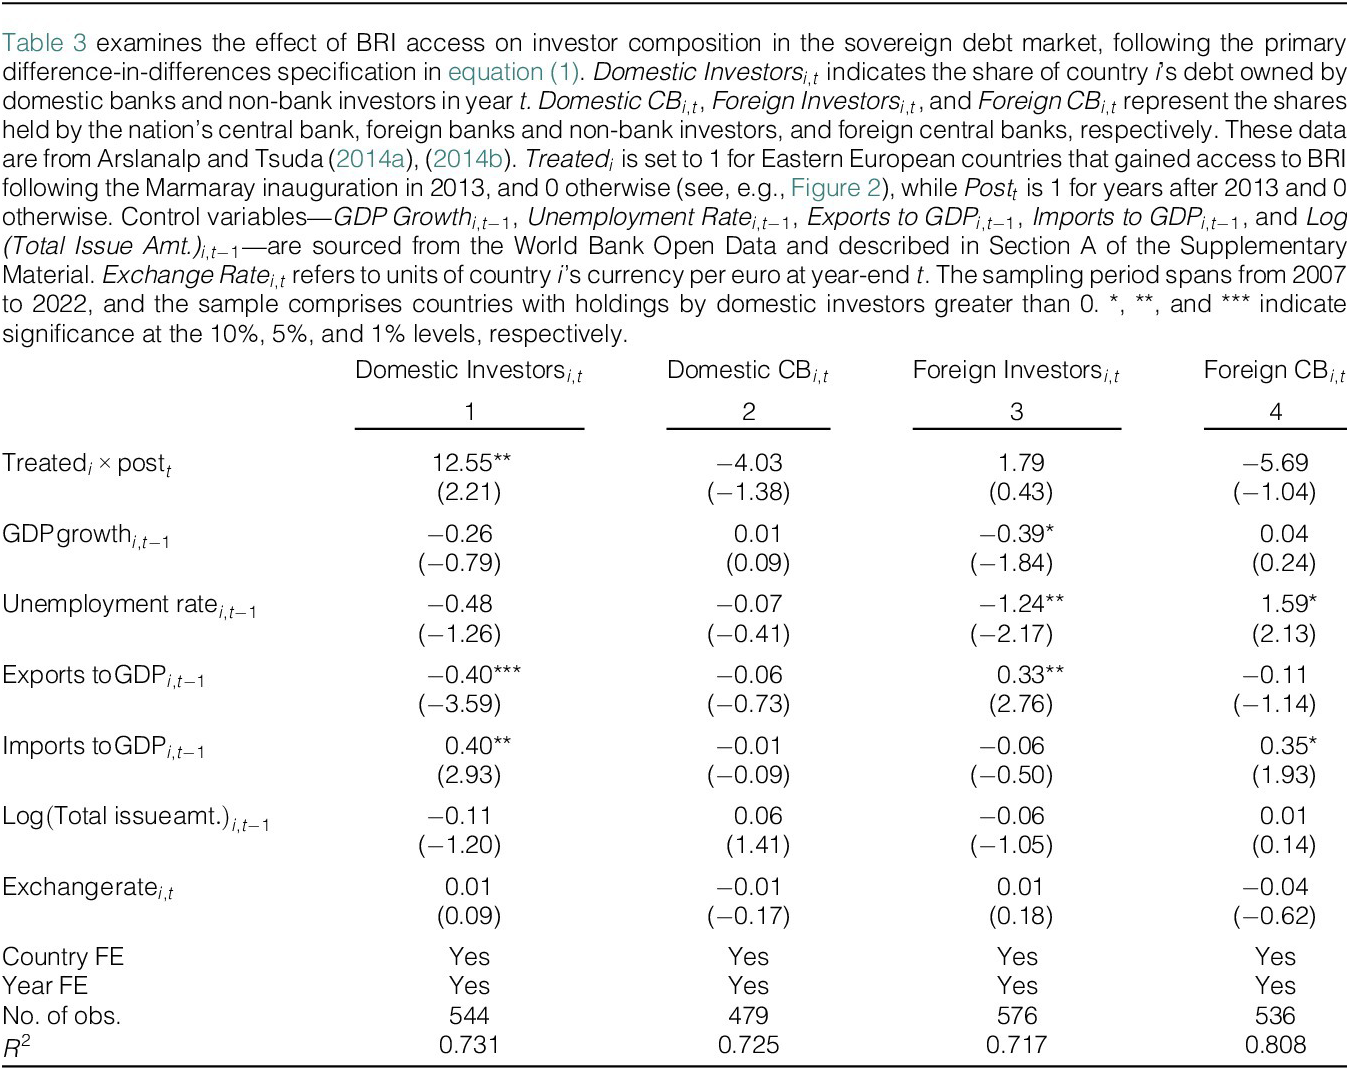
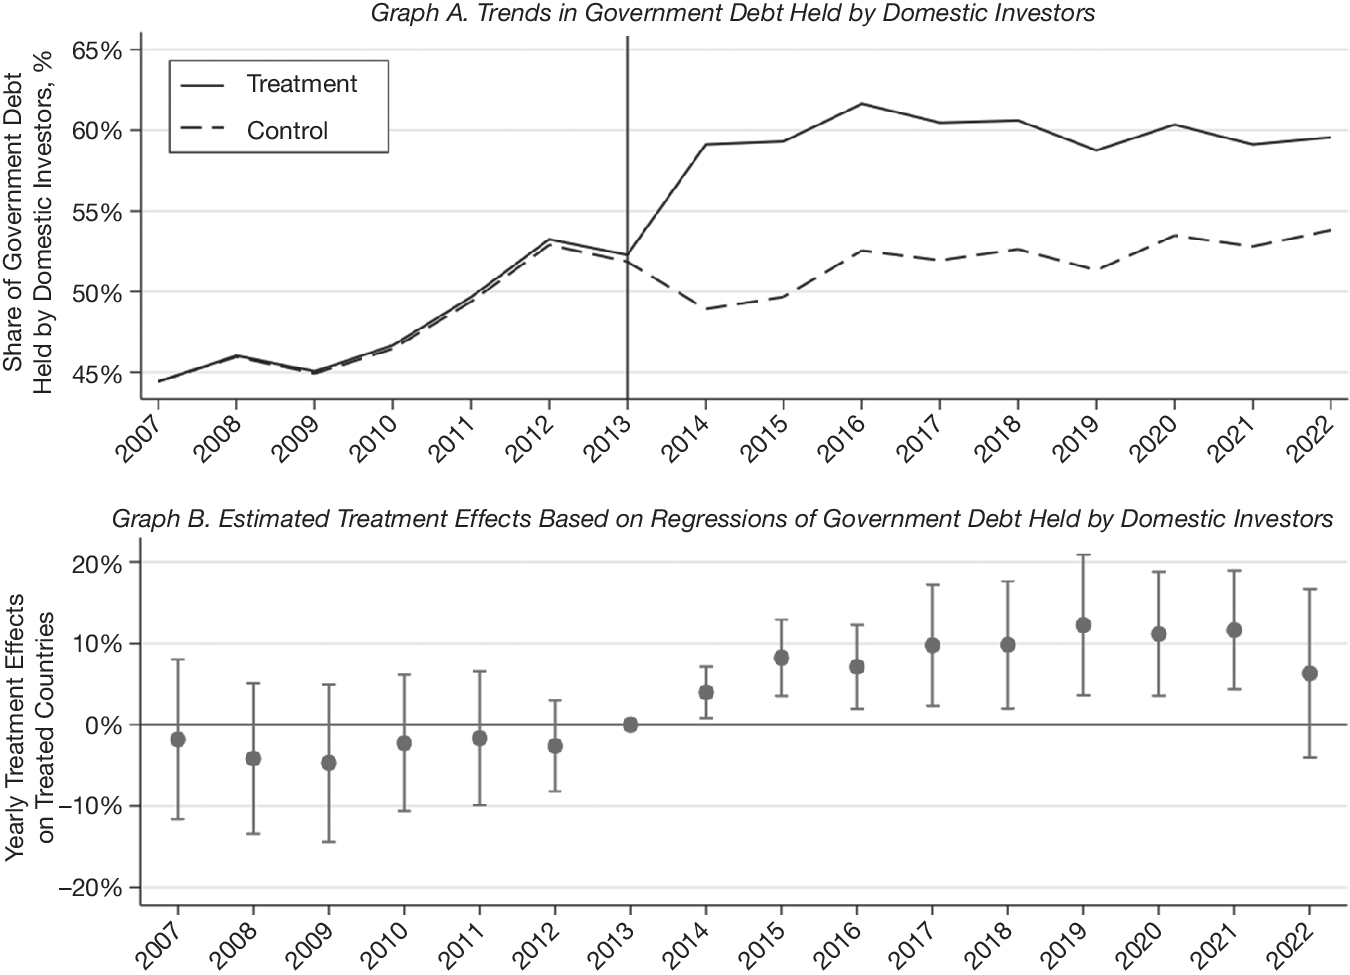

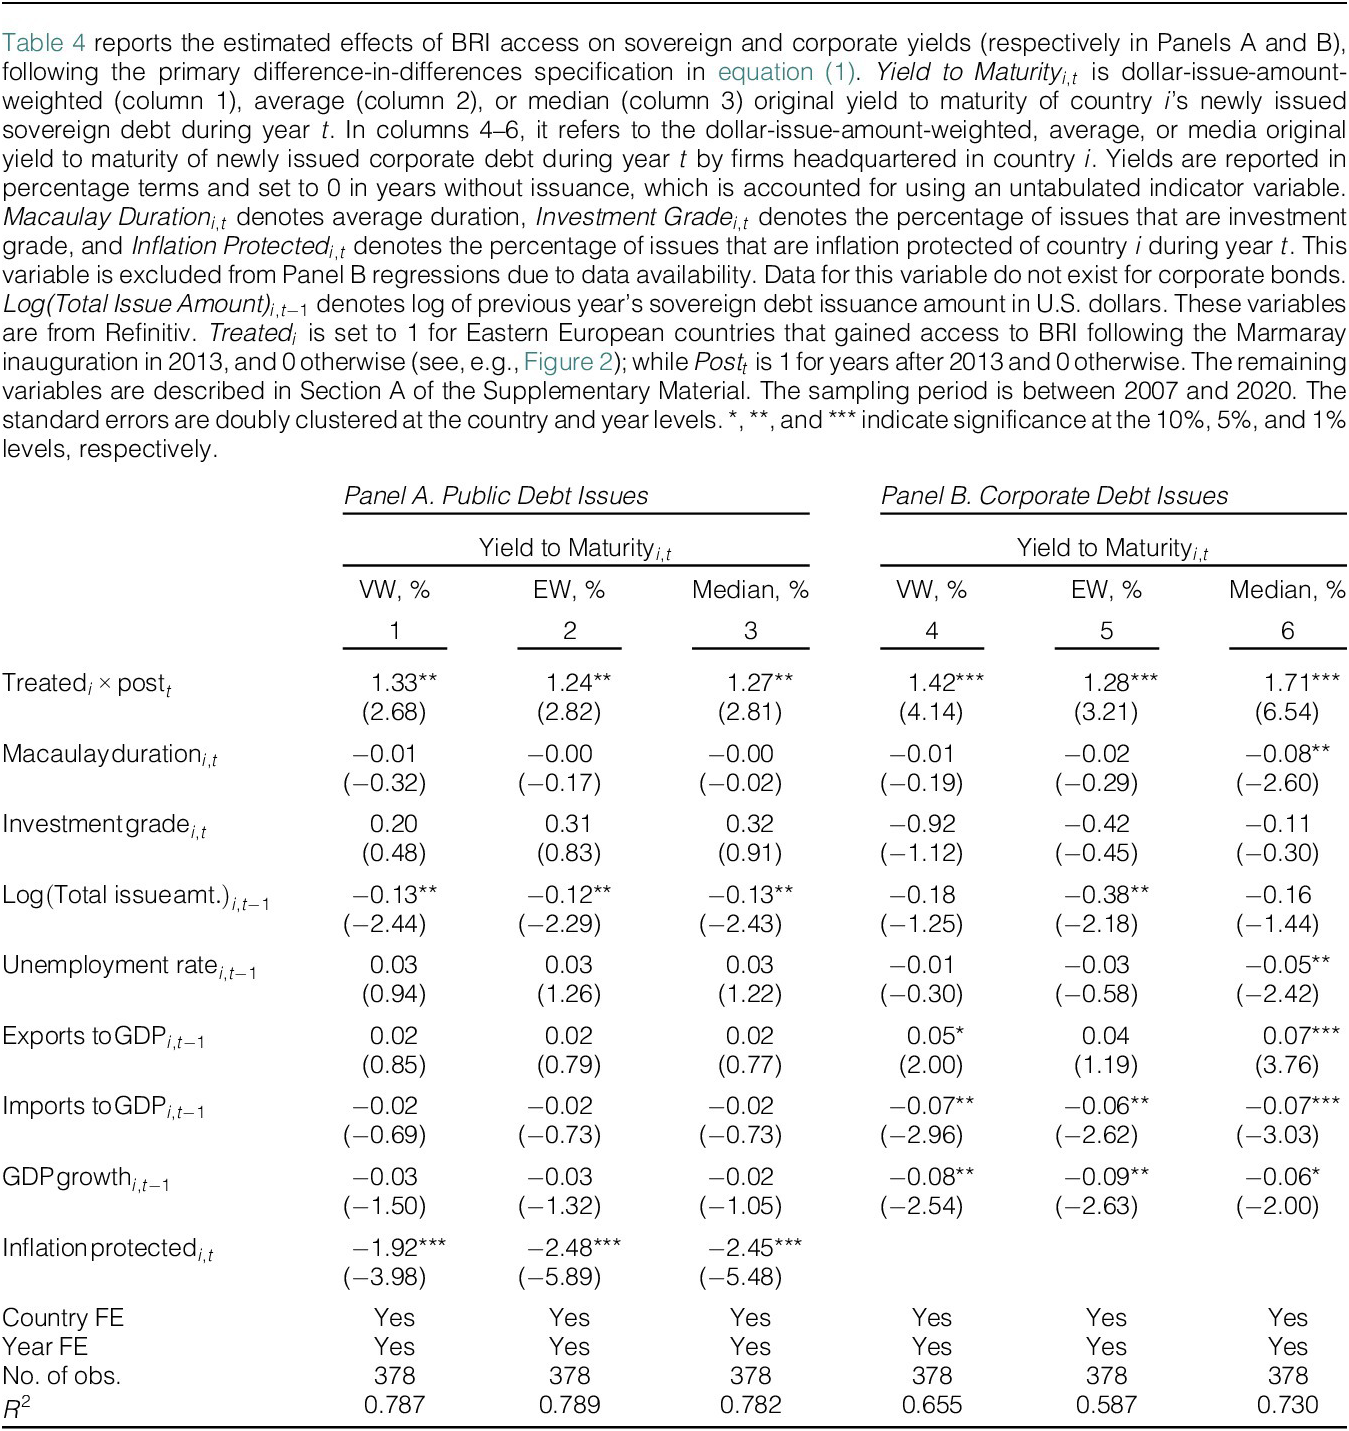
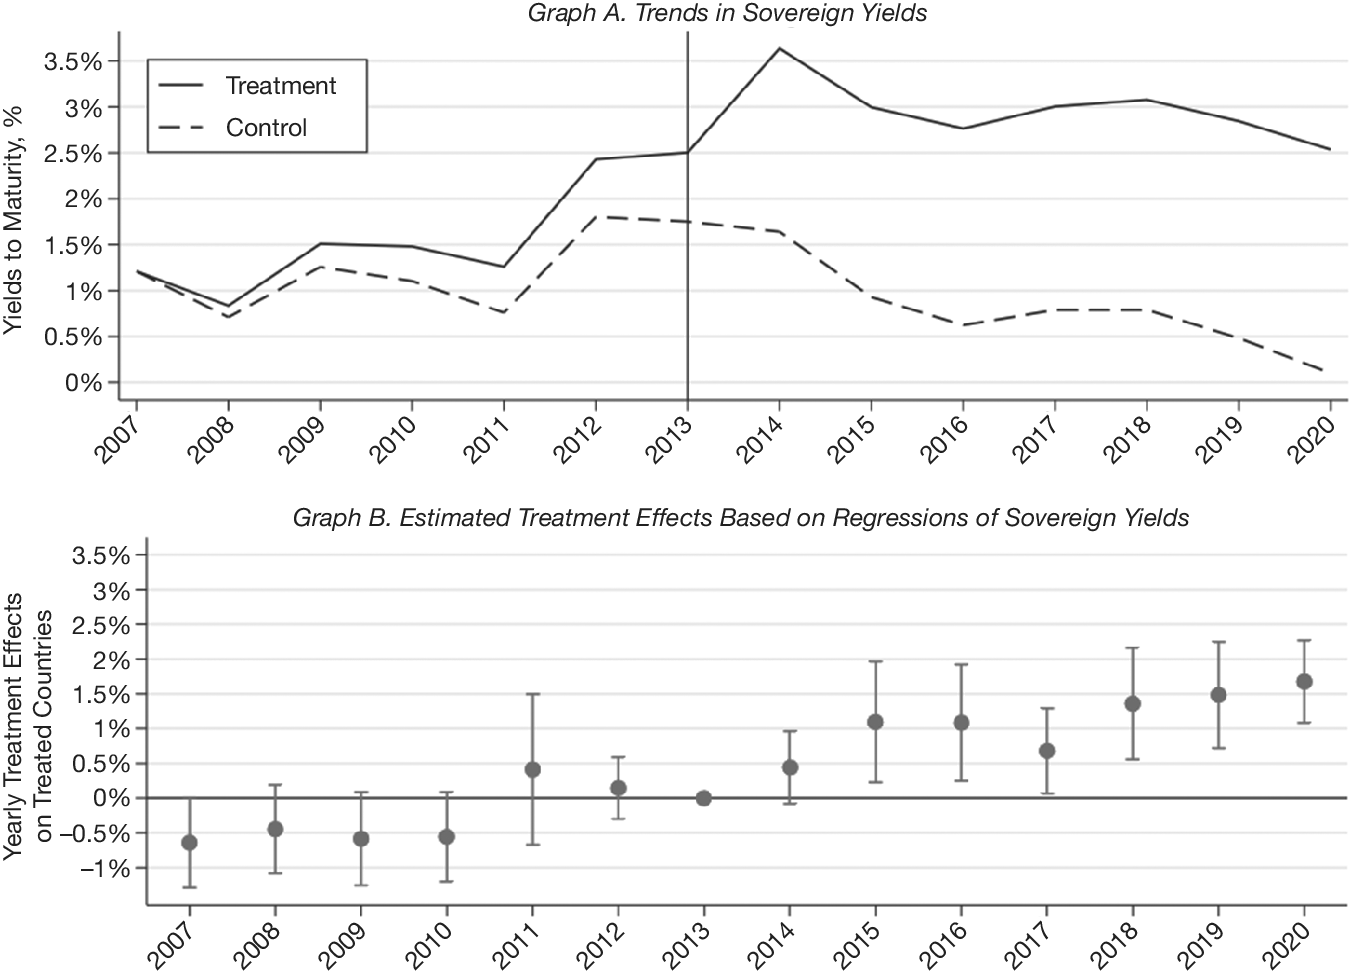

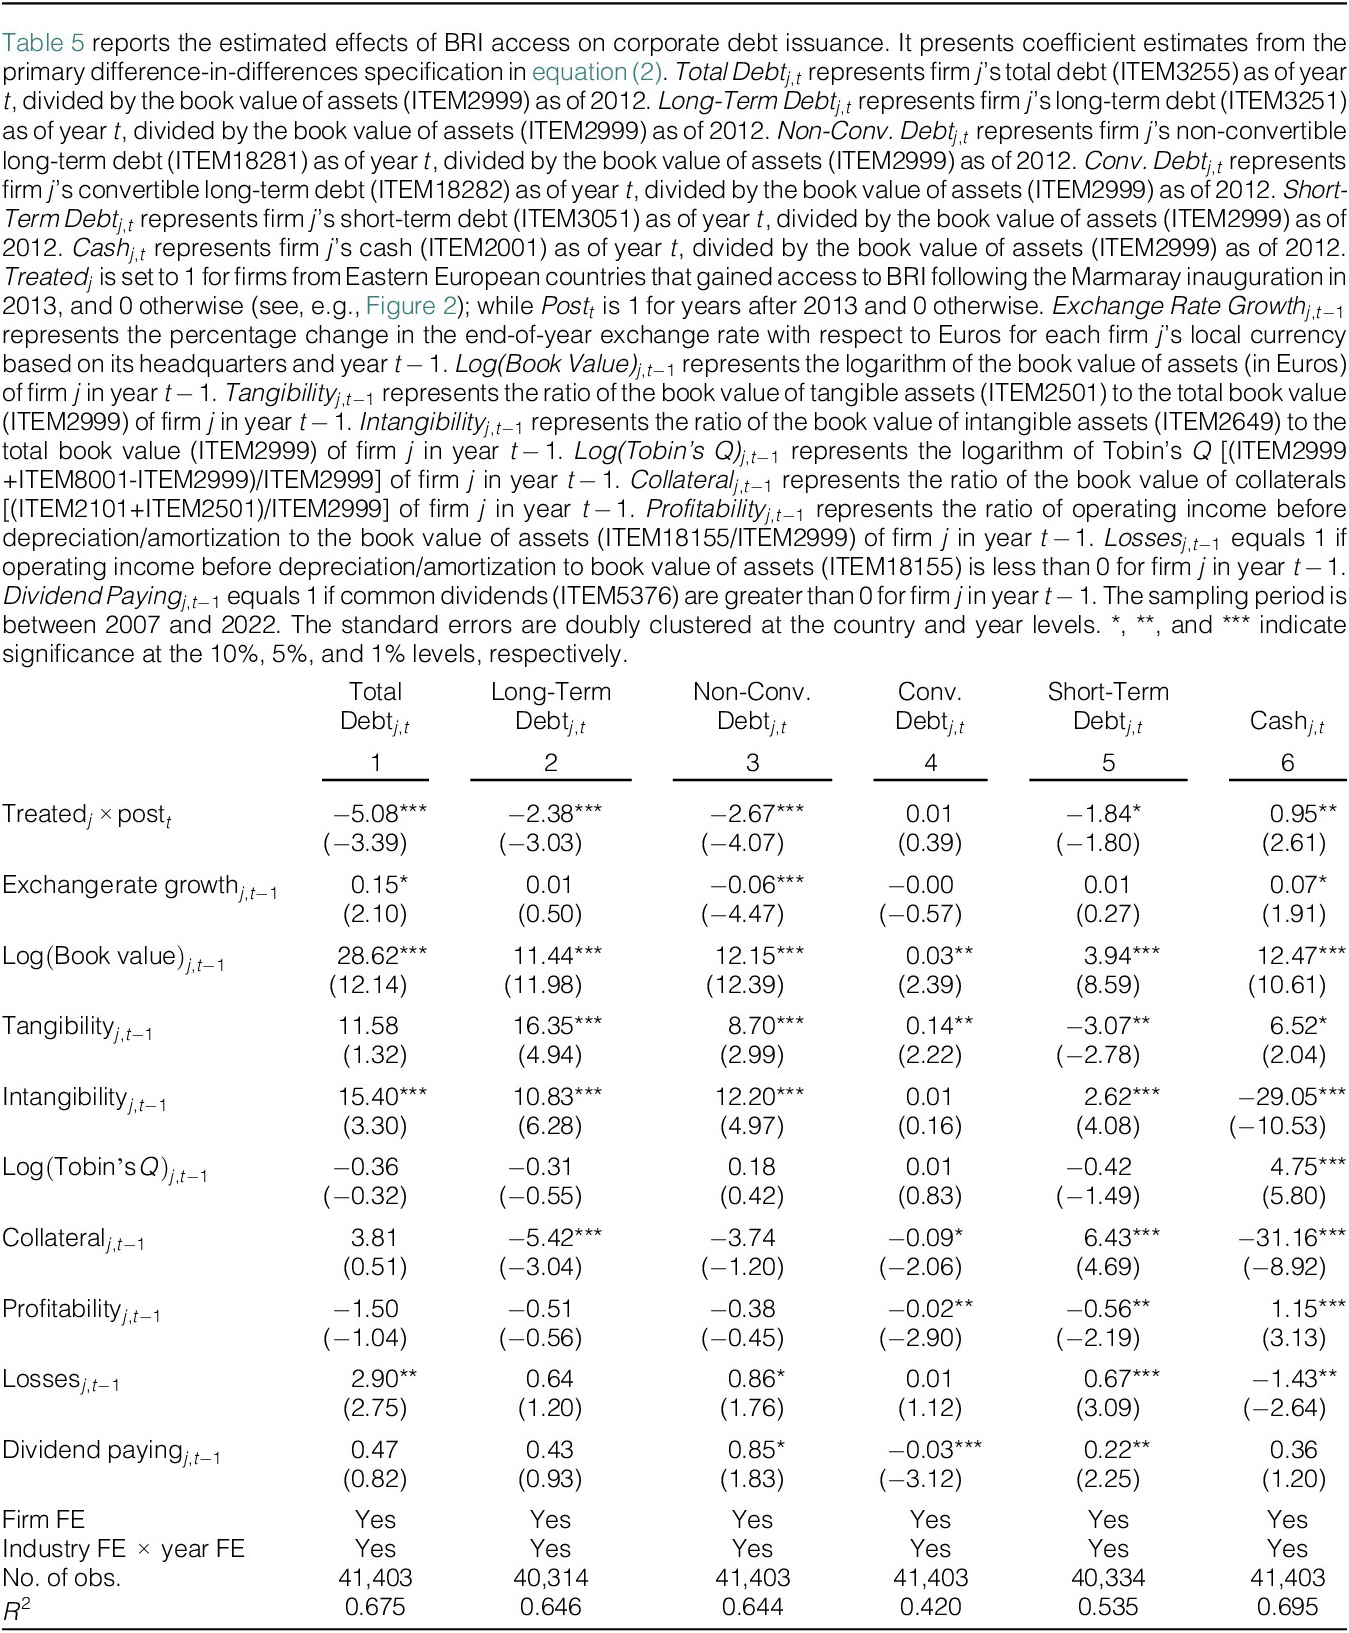
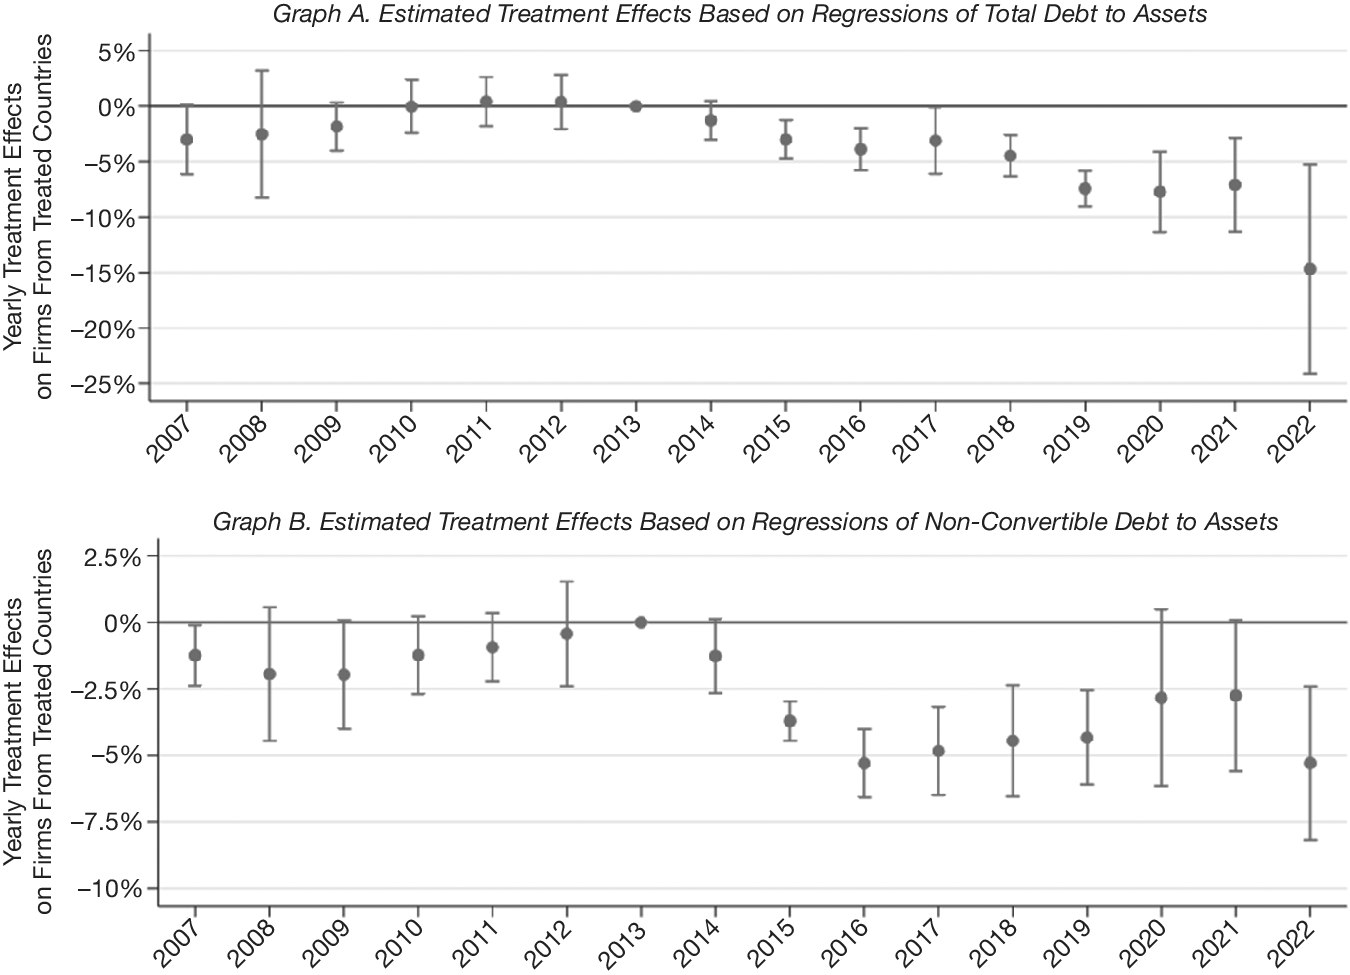


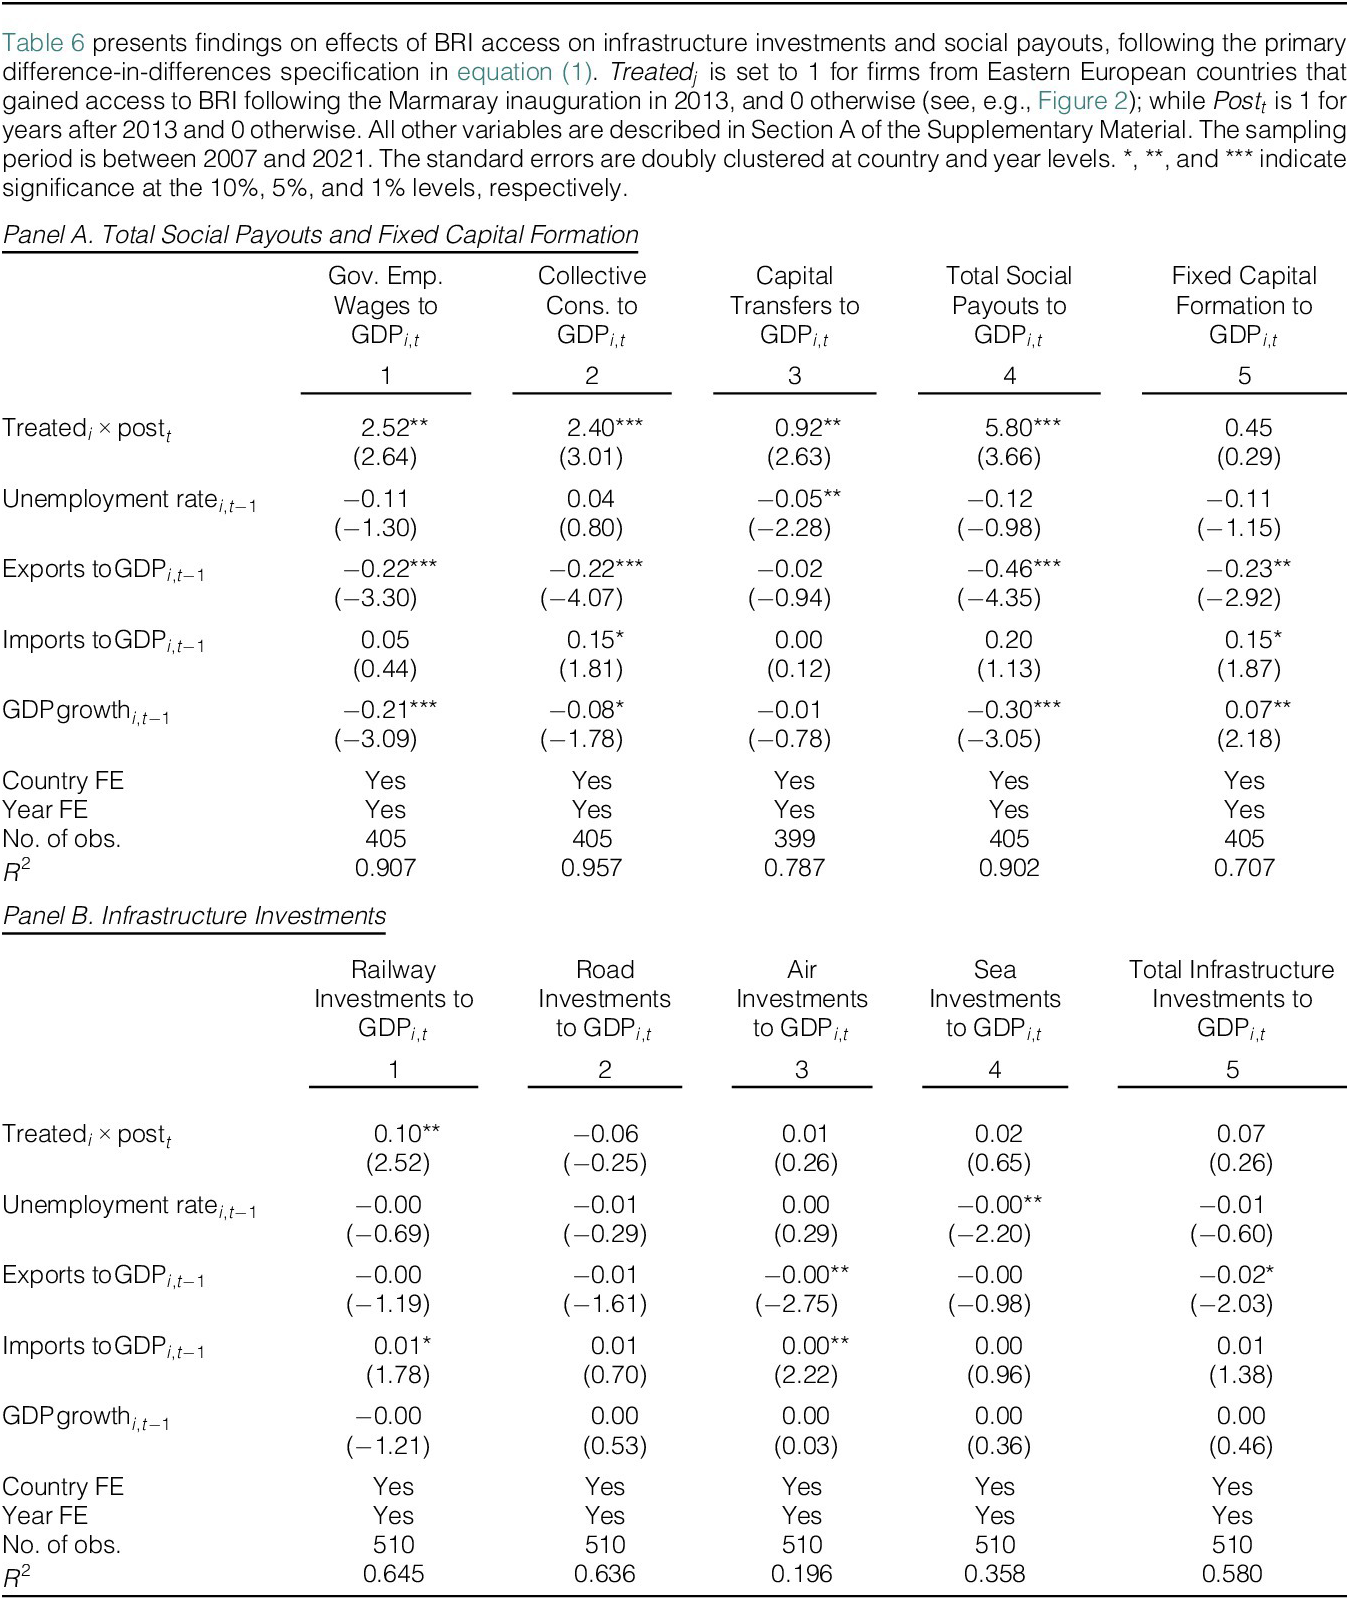
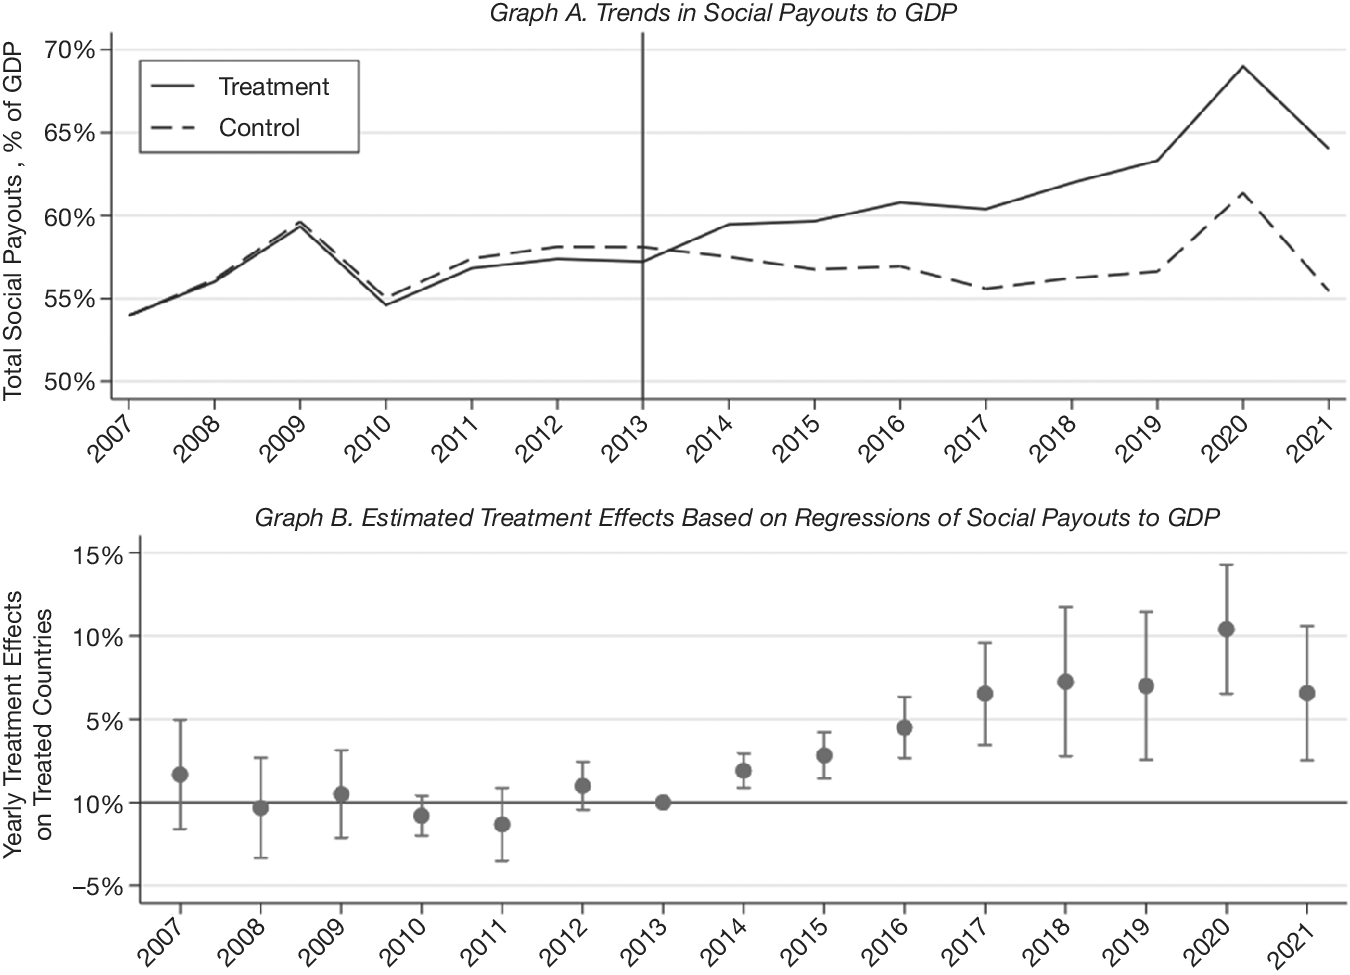
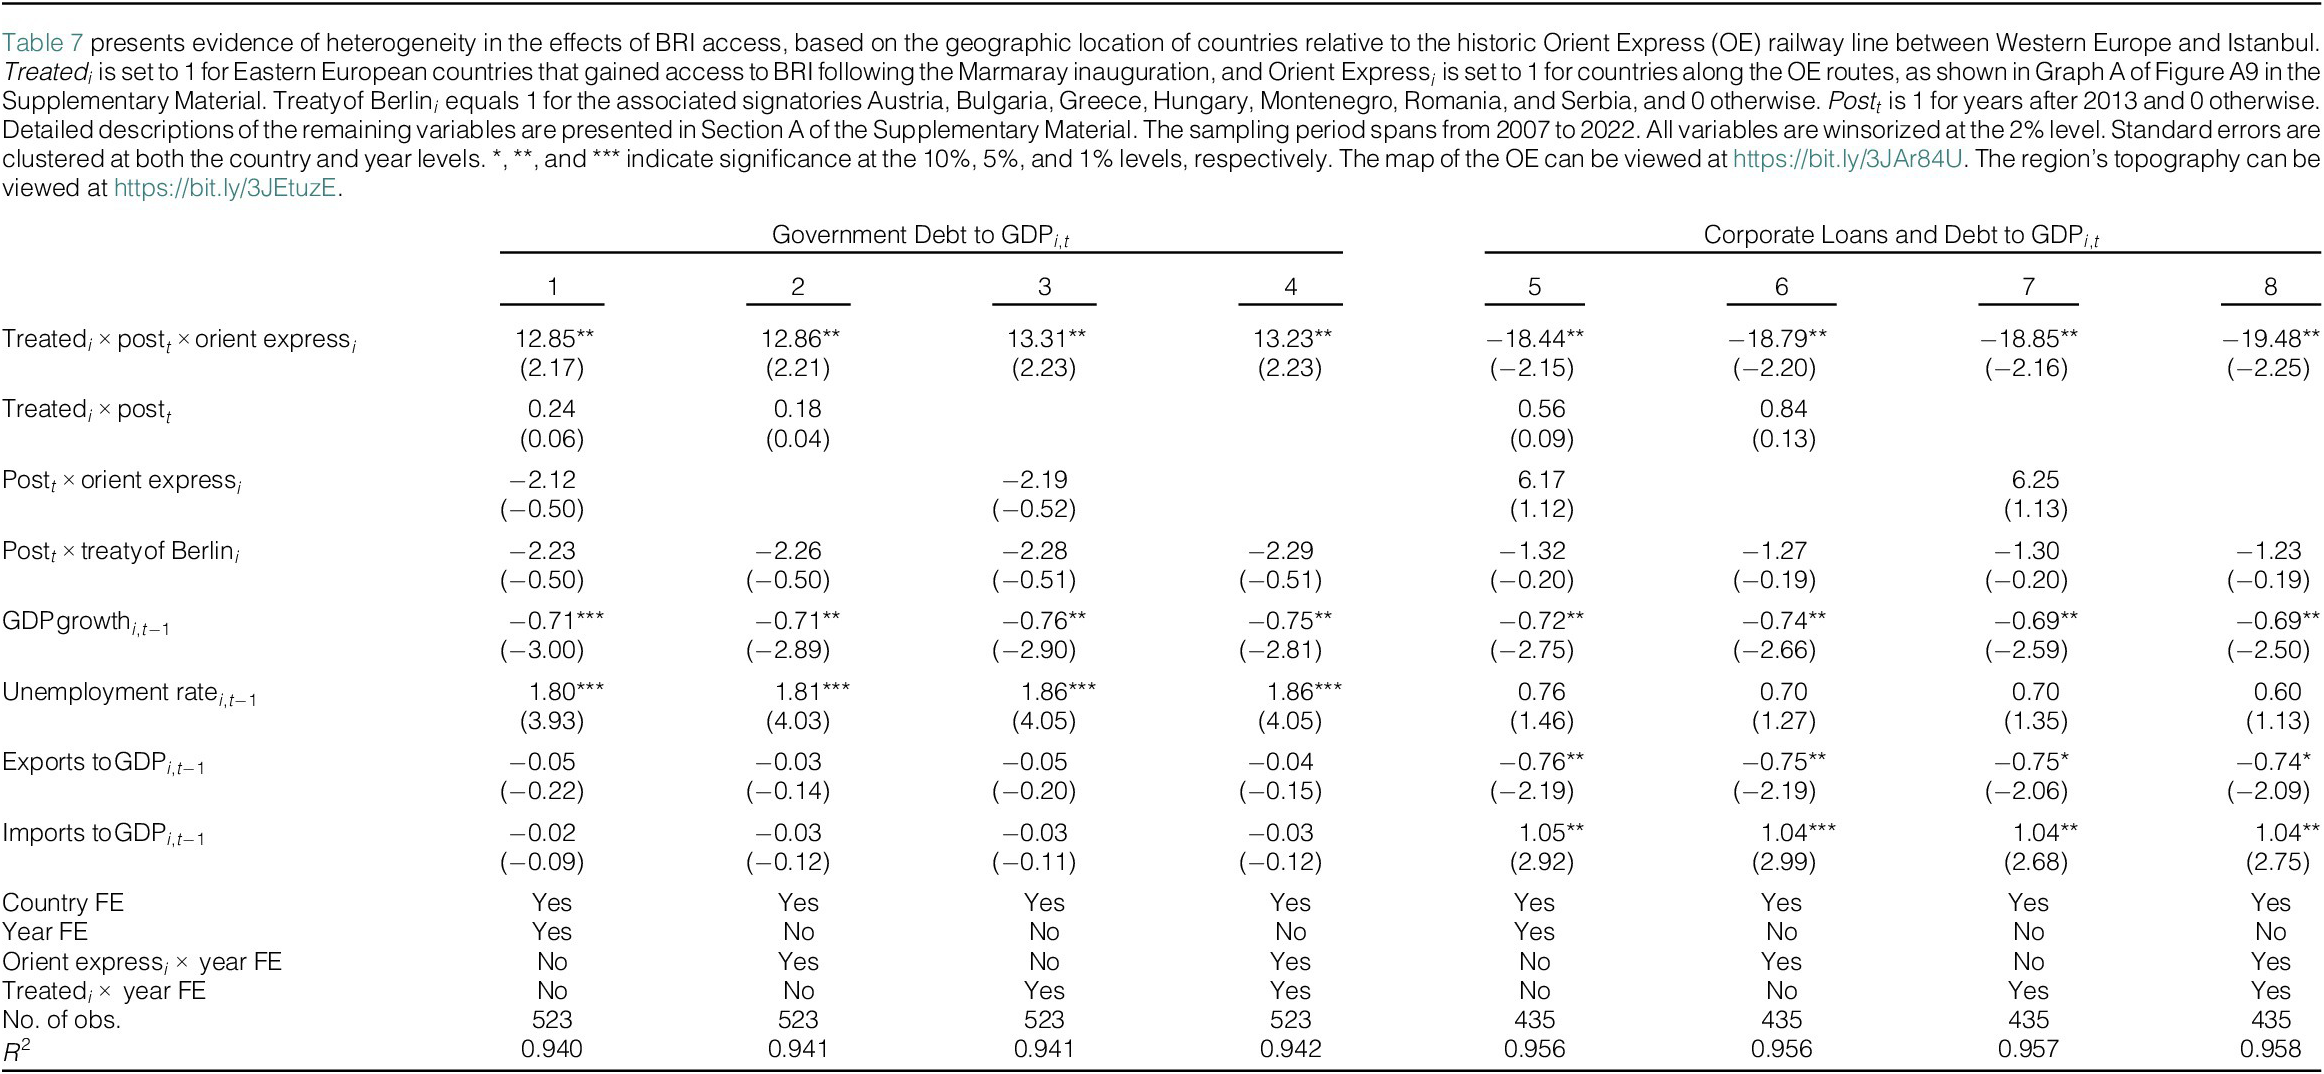
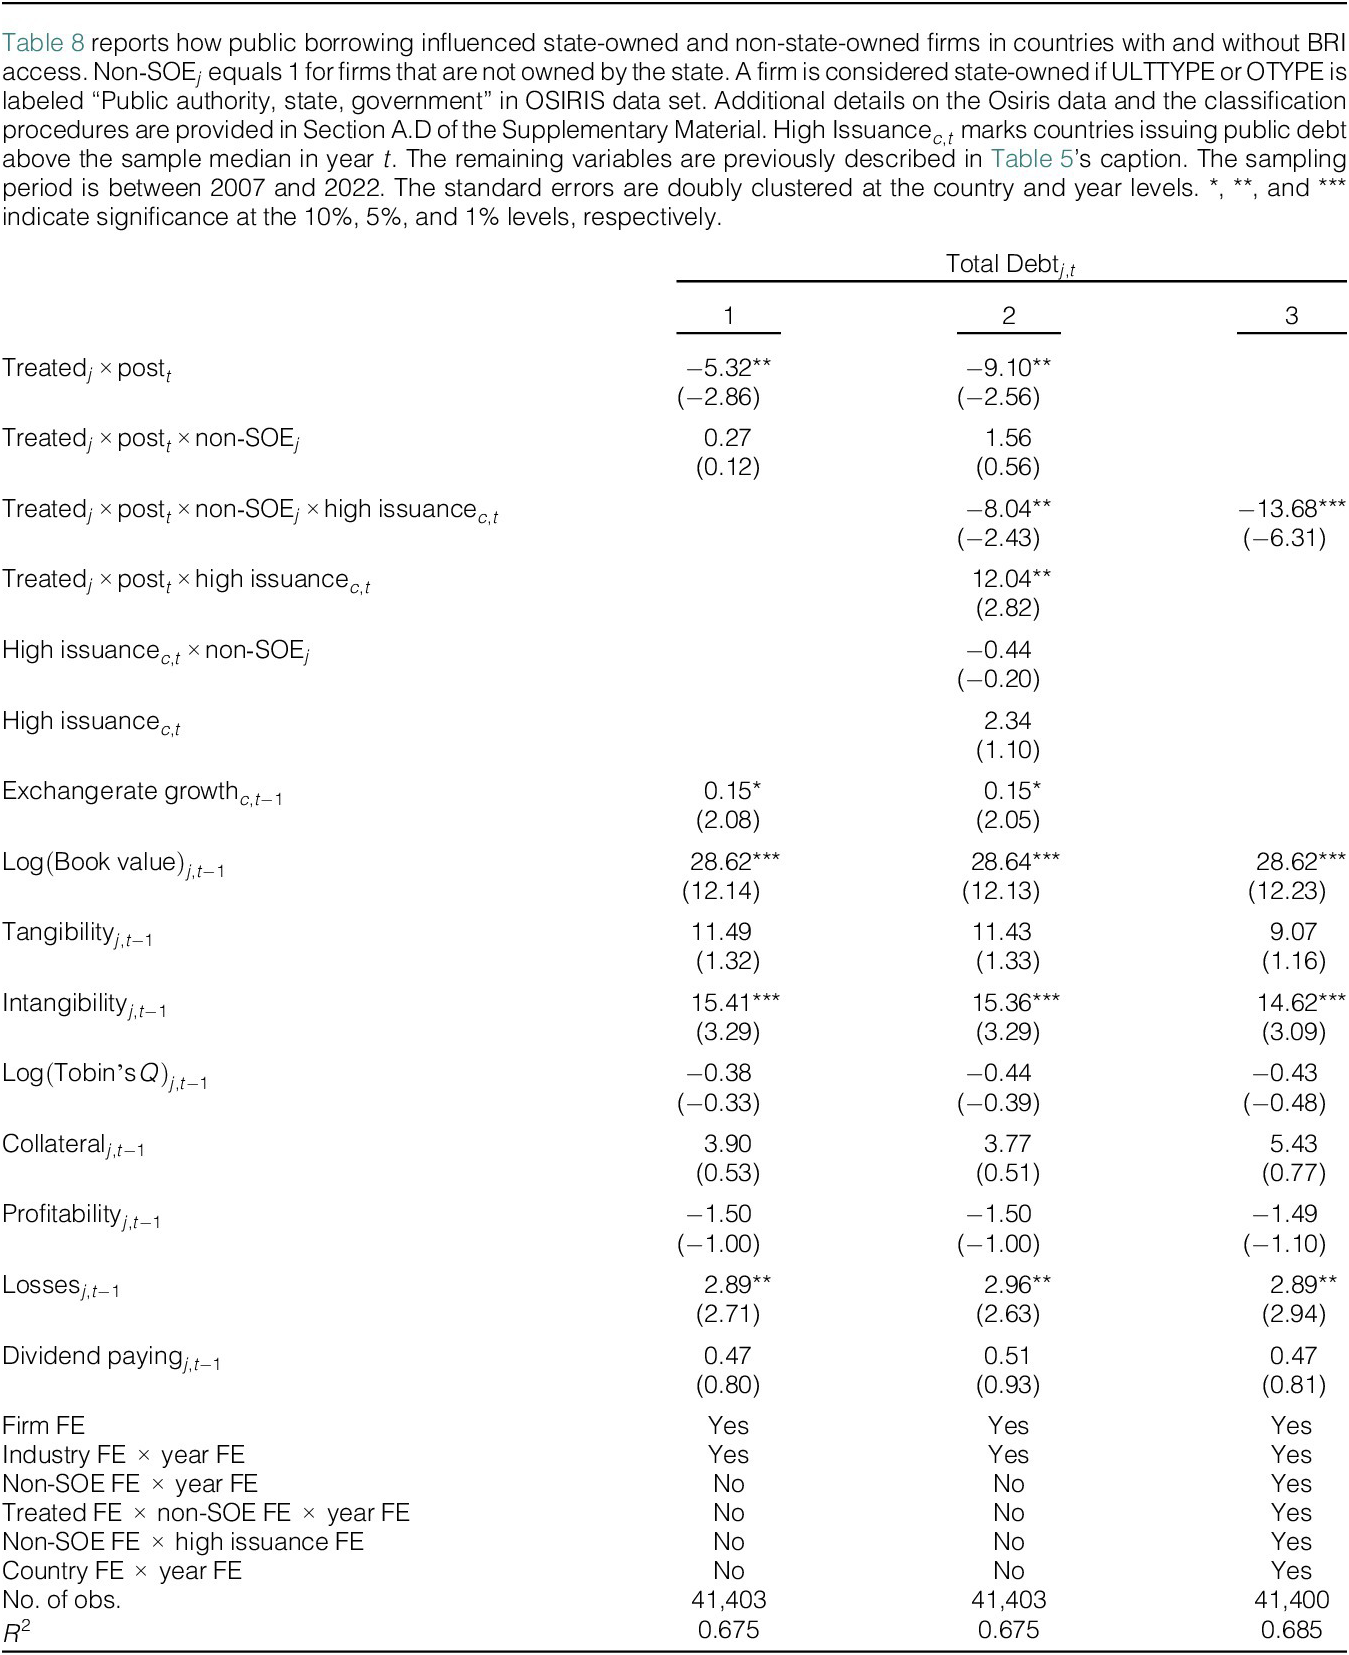


 Open access

