

Introduction
The last fifty years have been rife with predictions that America’s hegemony in the international political economy has peaked. According to this stance, the United States would be bound to face a steady decline of its power position from that point onwards. In fact, some scholars have even claimed in the 1980s that US hegemony had already been lost.Footnote 1 According to Immanuel Wallerstein and other proponents of the world-system approach, hegemony is cyclical; once a hegemon has reached the apogee it is bound to face perpetual decline vis-à-vis the rising power(s): ‘The decline of the United States is not the result of poor decisions by its president, but of structural realities in the world-system.’Footnote 2 This declinism also pertains to the field of global finance, the focus of this article. Many observers saw the end of the Bretton-Woods system in the early 1970s as an unmistakable sign of vanishing dominance of the US in the international financial system. Only a minority of scholars disagreed arguing that the demise of Bretton-Woods rather represented a shift or transformation of US hegemony from forms of direct power articulated via intergovernmental channels to forms of indirect or structural power exerted through private markets.Footnote 3
The latest wave of US declinism came in the years after the global financial crisis. Post-2008, the debate about America’s position in the global political economy has mainly focused on the ‘rise of the rest’, such as the BRIC countries (Brazil, Russia, India, China), and especially on the rise of China. The basic argument is that in a ‘Post-American World’Footnote 4 we witness a ‘relative erosion of the power, and political influence, of the United States in general’.Footnote 5 This is not to say that there was a complete absence of observers who argued for the persistence of US power in the international political economy.Footnote 6 However, declinism generally prevailed. In 2015, the Asian Infrastructure Investment Bank (AIIB), proposed by China, became the latest supposed piece of evidence for the continuous decline of America’s dominance and the seemingly unstoppable rise of China. Sceptics of US power claim that the AIIB can become a means for China to ‘establish a parallel global financial order.’Footnote 7 Moreover, the fact that key allies of the United States, such as Australia and the UK, announced to join the AIIB was widely seen as a clear indication of vanishing US economic power. Or, in the words of the Financial Times, ‘the decision by several US allies to sign up to an institution Washington had effectively said was off-limits is one of the most powerful symbols to date of the eastward shift of global power’.Footnote 8 Larry Summers even said that ‘this past month may be remembered as the moment the US lost its role as the underwriter of the global economic system’.Footnote 9 The data analysed in this article suggest that these conclusions are premature. Granted, the AIIB surely has symbolical importance as an institution that in all likelihood is going to be strongly influenced by Beijing. However, we have to put the discussion about this new development bank into perspective. The planned loan portfolio of the AIIB of about US $100 billion may sound much, but is really very little when compared to total international bank loans, which stand at more than US $20 trillion.Footnote 10 This new development bank will just be too small to create ‘a parallel global financial order’. Moreover, the primarily symbolic importance of the AIIB case is not suited to draw the conclusion that economic and political relations between the US and its closest allies, such as Australia and the UK, have deteriorated. In short, the AIIB does not represent a ‘crucial case’ from which we can conclude that America’s dominance in global finance is in fact vanishing.
On the contrary, I would argue that the way the case of the AIIB has been interpreted by many commentators underestimates the persistence of America’s dominance in global finance. The argument of this article is that we have to analyse the United States as a part (though of course the by far most powerful one) of a wider Anglo-America. Only then can we determine the true structural power of America in global finance.Footnote 11 Hence, Section 2 explains why such an approach is cogent. In addition to analysing Anglo-America as a whole, this article is based on the view that many data used by declinists are not really as decisive as they should be. Sean Starrs has convincingly argued that in the age of globalisation, conventional national measures of economic power such as GDP are not as meaningful as they had been during the Bretton-Woods era when corporations and finance were largely confined to the nation-state.Footnote 12 Or, in the words of Randall Germain: ‘the key question [is] not the weight of the American economy in the global economy, but the control exerted by American corporations and lawmakers over global markets’.Footnote 13 Hence, we have to dig deeper to uncover truly relevant data. Starrs has analysed the top 2,000 global corporations and found that US companies dominate virtually all segments – and that US dominance measured in this way has in fact increased from the years 2006 to 2012. GDP certainly has not become useless, but the power position of a country in the international political economy is just too complex to be captured by such a single measure. Herman Schwartz’s nuanced analysis has shown that American power in global finance can only be analysed by taking into account all financial segments, including real estate markets.Footnote 14 Furthermore, it is imperative to uncover fine-grained data that actually shed light on the nature of US dominance. Thus, Section 3 proceeds to analyse data on nine different key segments of global finance. Against predominant statistical conventions, the Anglo-American countries and territories are analysed here as a transnationally integrated whole and not on the grounds where they are located geographically. In virtually all statistics the UK and Ireland are treated as part of the EU, Australia as part of ‘Asia-Pacific’, and UK dependencies such as the British Virgin Islands and the Cayman Islands as Caribbean, even though the Anglophone countries and territories generally have more in common with Anglo-America than with neighbouring countries. The inclusion of UK dependencies – which, in legal terms, may still be called British ‘colonies’Footnote 15 – is crucial, because most of them act as large offshore financial centres that facilitate Anglo-American (global) finance; the Cayman Islands, for example, acts as the global jurisdiction of choice for the hedge fund industry. This novel analysis reveals that from around the year 2000 until 2014 Anglo-America’s structural power in global finance has not declined but proved to be remarkably persistent. Finally, Section 4 concludes.
Anglo-America in International Political Economy
Three different terms have been used by scholars studying the group of the Anglophone countries in International Relations (IR) and International Political Economy (IPE): Anglosphere, Lockean heartland, and Anglo-America. The Anglosphere approach by Srdjan Vucetic conceptualises the community of the English-speaking countries as based on a racialised Anglo-Saxon identity, ‘a social kind that exists because people believe it exists’.Footnote 16 Vucetic bases his analysis on historical case studies about crucial interactions between the core countries of the Anglosphere. He deliberately chooses episodes that concern the field of national security as this domain is commonly theorised to represent the least-likely case for cooperation. He argues that it clearly is a puzzle for most conventional IR theories how the ‘Anglo-American war became “unthinkable” while peace and cooperation became dependable’.Footnote 17 Vucetic has shed much needed light on Anglo-American cooperation; however, he has largely restricted his analysis to the field of IR, mostly excluding economic and financial aspects.
The Lockean heartland concept, developed by Kees van der Pijl, is an IPE approach integrating both political and economic dimensions.Footnote 18 The approach is named after John Locke who had generally argued for the withdrawal of the state from social and economic life and for self-regulation of civil society. According to van der Pijl, the Lockean state/society complex became recognisable in England in the late seventeenth century.Footnote 19 The Glorious Revolution of 1688 led to the constitutional limitation of state power and the protection of the genuinely ‘private’. The pattern of self-government that settlers from Britain brought with them to North America and Australia enabled the subsequent transnationalisation of the Lockean state/society complex. This formed the basis for the subsequent development of a transnational Lockean heartland spanning across the English-speaking countries: ‘with the Lockean pattern transmitted to the new areas of settlement, there emerged, on the foundations of industrial/commercial centrality and predominance, a heartland of the global political economy’.Footnote 20
The counter model to this Lockean state is the ‘Hobbesian’ state, which is characterised by the primacy of the state. The Hobbesian state generally has an explicit doctrine of national interest and relies on a powerful administration to regulate economy and society. In contrast, the Lockean state generally relies much on free markets that are largely seen as ‘self-regulating’. The mode of expansion of the Lockean state is transnational, whereas that of Hobbesian states is international. One of the primary purposes of the Lockean state is to foster free (capitalist) enterprise that ‘civil society’ (primarily the financial and business elites) pursues at home and abroad. The predominance of the Lockean heartland over the international political economy has been challenged by other states that rose to power. Such ‘Hobbesian contender states’ included Imperial Japan, Nazi Germany, and the Soviet Union. China could become the next contender in a few decades;Footnote 21 as a Hobbesian state it seeks to steer and regulate its economy tightly – particularly its financial markets.
In addition to Anglosphere and Lockean heartland, there is also the term Anglo-America. Andrew Gamble argues that Anglo-America is an ‘imagined community’, one that is ‘encompassing both ideals and interests, which is constructed and sustained through various narratives and embodied in particular institutions’.Footnote 22 Furthermore, Anglo-America has not one distinct centre, but consists of different states and nations, such as Australia, Britain, Canada, Ireland, Scotland, Wales, and the US. He argues that ‘Anglo-America is a political space constituted by wider economic, political, ideological and cultural relationships, and is as a consequence many-sided’.Footnote 23 Similarly, Peter Katzenstein argues that Anglo-America is ‘fluid, not fixed’.Footnote 24 According to Gamble, the hegemony of Anglo-America has four main dimensions. The first is military and has arguably been the most apparent dimension during the last century. The second and third dimensions are political, respectively cultural in nature: the political model advocated by Anglo-America is based on the idea of self-government, and the importance of (transnational) civil society; Anglo-American culture, shaped by Protestantism and individualism, manifests today primarily as consumerism. Finally, the fourth dimension has been the dominant Anglo-American model of capitalism – which is characterised by the primacy of markets, short-term goals, and the confinement of the state to enabling free enterprise rather than actively steering economic development –, and particularly the dissemination of this liberal economic order around the world. Gamble summarises the position of Anglo-America:Footnote 25
Global hegemony is how Anglo-America appears to those outside it, as a hegemonic order fashioned over two hundred years, in which the differences between its various states are less important than what they have in common.
Empirical evidence for the existence of an Anglo-American model of capitalism has been found by a number of scholars. Peter Hall and David Soskice as well as Bruno Amable argue that the Anglophone economies constitute a distinct socioeconomic model – ‘liberal market economies’ or ‘market-based economies’;Footnote 26 whereas countries pursuing an opposing model, such as China, have been dubbed ‘state-permeated market economies’.Footnote 27 Schwartz uses the term ‘Americanised Rich’ to characterise the group of Anglophone countries (plus the Netherlands, Sweden, and tentatively Switzerland). He finds that the group of the Americanised Rich has similar housing markets and corporate finance systems to those of the US.Footnote 28 In addition, these countries exhibit an overseas investment pattern comparable to the US, and their inward and outward direct investment from/to America is disproportionately high compared to other countries, such as the ‘Repressed Rich’ (Germany, France, Japan, and others). The exceptionally close transnational ties between the Anglo-American countries are reflected in various statistics pertaining to global finance. For example, the UK is by far the largest source of direct investment into the US when measured by country of ultimate beneficial owner.Footnote 29 The bilateral private portfolio investment relation between the US and the UK is the largest one in the world by far with almost US $2 trillion. Banking claims by foreign investors on the US, and vice versa US banking claims on foreigners, are dominated by the Anglosphere – over 60 per cent in each category.Footnote 30 Furthermore, investment banking, hedge funds, private equity, and burgeoning passive asset management (for example, BlackRock) are quintessentially Anglo-American financial industries, based around New York and London – and virtually nowhere else. The same is true for the top global law firms. Dariusz Wójcik uses the apt term ‘NY-LON’ to capture the joint global dominance of both intertwined financial centres.Footnote 31 Jeremy Green argues that there has been a close interaction between the Federal Reserve-Treasury-Wall Street nexus in the US and the City-Bank-Treasury nexus in the UK.Footnote 32 Moreover, a ‘transatlantic regulatory feedback loop’ between the US and the UK fostered international financial liberalisation and deregulation, making Anglo-America fundamental to the process of financial globalisation.Footnote 33 The dominance of Anglo-America in finance is underpinned by common law, which provides extensive freedom of contract. The legal systems of all Anglophone countries and territories are based on common law, in which law evolves in a bottom-up fashion from individual case decisions, thus significantly facilitating (transnational) finance. Under civil law (Germany, France, Japan, etc.) the state creates law in a top-down manner, which is rather hampering finance – this contrast between common and civil law reflects the Lockean/Hobbesian dichotomy by van der Pijl.
‘Smoking-gun observations’ are quite rare in the fields of IR and IPE. I would argue that the revelations on the intelligence cooperation of the ‘Five Eyes’ countries (US, UK, Canada, Australia, and New Zealand) represent smoking-gun evidence for the unique cooperation of the Anglo-American countries. The English-speaking countries cooperate extremely closely in defence and intelligence, which represent the least-likely fields of cooperation by sovereign states.Footnote 34 The unparalleled signals intelligence and internet surveillance activities operated by the ‘Five Eyes’ countries can hardly be explained by conventional concepts such as national security.Footnote 35 Indeed, the revelation of this pervasive joint global intelligence operation should have opened the eyes of all keen observers of international affairs that the group of Anglo-American countries represents something sui generis, as ‘latecomers from outside the Anglosphere are not welcome to join the club’.Footnote 36 Glenn Greenwald summarises the Anglosphere community as such:
It is not as though this is five distinctive countries trying to find common ground – the alliance is incredibly integrated. It is surprising, really. You would think that the different political cultures and histories of each country might mean they had different approaches but there is no indication of that.Footnote 37
The key implication of this section is that it makes sense to analyse the group of the English-speaking countries together. The argument here is not that there is a completely unified agency in Anglo-America, however. The Anglophone countries are politically sovereign, of course, and occasionally disagree on certain topics (such as the AIIB). Nonetheless, as argued above, Anglo-America is deeply integrated in crucial domains, such as finance and intelligence, and the Anglophone countries constitute each other’s closest allies by far. I would argue that in the structure of finance authority and decision-making power in Anglo-America form a set of concentric layers. At the very centre is NY-LON where the most important financial actors and institutions reside and where the primary decision-making power is located. NY-LON, in turn, is embedded in the two central Anglophone countries in finance, the US and the UK. Private finance has a strong influence in both countries – inter alia through the revolving doors between Wall Street and Washington and the fact that the majority of donations to the Tories are coming from the financial sector, especially hedge funds.Footnote 38 Surrounding this layered core is a group of crucial Anglophone offshore financial centres that are ancillary to NY-LON. These jurisdictions include the Cayman Islands, Bermuda, Jersey, and Ireland (the main destination of US corporate ‘inversions’). On the one hand, these common law tax havens enable Anglo-American financial actors and large corporations to gain advantage in international markets. On the other hand, they facilitate the flow of capital from around the world to the Anglo-American core. Finally, the outer layer is constituted by Australia and Canada, which do not act as tax havens but play a much more prominent role in global finance than the vast majority of similarly sized economies, thus helping to sustain the open global financial order centred on the US and the UK.
In 2013, Anglo-America has accounted for only between 6 per cent and 7 per cent of the world’s population (or about 450 million people), but its combined economies have produced about 31 per cent of global GDP (measured by market exchange rates), with the US accounting for roughly 22 per cent.Footnote 39 In 2000, Anglo-America’s share of the world economy had been roughly 40 per cent. Most conventional analyses of power would see this as a clear indication of decline. However, GDP is too blunt a measure of economic power. The analysis of nine different indicators, conducted in the next section, shows that Anglo-America’s structural power in global finance is not in seemingly perpetual decline, but has remained persistent.
Anglo-America’s structural power in global finance
Power can be analytically separated into two modes: relational and structural power.Footnote 40 The former is ‘the power of A to get B to do something they would not otherwise do’.Footnote 41 Susan Strange defined the latter as ‘the power to choose and to shape the structures of the global political economy within which other states, their political institutions, their economic enterprises, and (not least) their professional people have to operate’.Footnote 42 Crucially, the concept of structural power enables the analysis of forms of private authority much better than conventional relational power; Strange stressed that ‘the global articulation of power [is] constituted by a complicated amalgam of public and private authority’.Footnote 43 Here, Martijn Konings has shed light on the institutional basis of US structural power in global finance by analysing the interlinkages between private American finance and the US state.Footnote 44 However, as Green has noted, Konings underweights the role of the UK (and especially the City) in the emergence of the Euromarkets; instead, Green finds that the pivotal Euromarkets emerged in the City of London due to ‘co-constitutive Anglo-American development processes’.Footnote 45 Since the global financial crisis, there has been a significant revival of research on structural power in finance. Eric Helleiner argues that the absence of a dollar crisis and role of the US as de facto international lender of last resort are evidence for persisting US financial power.Footnote 46 According to Schwartz, the US still has a unique ability to create credit (and consequently demand) in the global economy, which derives from dominance in international production and a pivotal position in global credit networks.Footnote 47
Strange defined the structure of global finance as ‘the sum of all the arrangements governing the availability of credit plus all the factors determining the terms on which currencies are exchanged for one another’.Footnote 48 I would argue that this definition has become too narrow during the last twenty years. Global finance is now much broader and includes derivatives, large equity markets as well as enormous stocks of cross-border investment. Therefore, we need a broad analysis of fine-grained data on structural power indicators. Consequently, this article analyses nine key segments that together cover the entire breadth of global finance. Hence, this article extends the literature by providing the most comprehensive analysis of structural power indicators in global finance.Footnote 49 The following segments are the focus of this section: (1) over-the-counter (OTC) derivatives trading; (2) OTC foreign exchange trading; (3) currency composition of official foreign exchange reserves; (4) market capitalisation of publicly listed domestic corporations, and internationally-significant markets for raising capital; (5) external bank deposits; (6) inward direct investment; (7) outward direct investment; (8) international portfolio investment; and (9) financial and total wealth.Footnote 50 In most segments I compare how the market shares by Anglo-America, the eurozone (excluding Ireland), and Japan have changed. The development of absolute numbers is not as important as the relative change of market shares, because power in the global political economy is primarily about differential growth.Footnote 51 I focus on the period from around 2000 to 2014. Crucially, this period includes the global financial crisis, which according to many analysts has debilitated America’s position in global finance. The Chinese share (including Hong Kong, [HK]) is presented to put the rise of the People’s Republic into perspective, as China is the only conceivable challenger to Anglo-America’s structural power.
The geographical distribution of OTC derivatives trading
The spectacular rise of financial derivatives during the last three decades is a major development for the global political economy. Forms of derivatives have been around for centuries, but their trading volume only surged after the end of Bretton-Woods and the subsequent liberalisation and deregulation of finance pursued by Anglo-America in the 1980s. For Dick Bryan and Michael Rafferty one of the main consequences of modern financial derivatives is a significant intensification of competition between corporations.Footnote 52 Duncan Wigan argues that ‘derivatives have profoundly altered a host of financial practices so that the financial sphere sits on top of the world economy’.Footnote 53 One of the central factors here is certainly that derivatives have increased complexity significantly – tilting the playing field towards large sophisticated financial actors. There is no space to discuss all the effects of financial derivatives or their central role for the global financial crisis. The focus is on the role of Anglo-America for the OTC derivatives industry. In 2013, the notional value of all outstanding global OTC derivatives has amounted to US $693 trillion – the five large US banks JPMorganChase, Citigroup, Bank of America, Morgan Stanley, and Goldman Sachs have been responsible for almost 42 per cent of this gigantic value.Footnote 54 The Bank for International Settlements (BIS) conducts a triannual survey among central banks concerning the turnover of OTC interest rate derivatives.Footnote 55 Interest rate derivatives represent the largest type of OTC derivative by far, amounting to US $577 trillion.Footnote 56 Interest rate derivatives can be used as hedging instruments against changes in interest rates or as speculative instruments to profit from interest rate movements in a specific direction. Figure 1 shows the development of market shares in the trading of OTC interest rate derivatives from 1995 to 2013. Daily average turnover increased in this period more than thirteenfold from about US $209 billion to almost US $2.8 trillion. Anglo-America’s share has risen from nearly 48 per cent to over 75 per cent, while the share of eurozone countries declined from 24 per cent to 14 per cent. Japan’s share dropped dramatically from almost 13 per cent to just over 2 per cent. China’s share (including HK) is only 1.5 per cent.
Shares in OTC interest rate derivatives 1995–2013 (percentages). Source: The Bank for International Settlements (BIS), ‘Triennial Central Bank Survey – OTC Interest Rate Derivatives Turnover in April 2013: Preliminary Global Results’ (2013b), available at: {http://www.bis.org/publ/rpfx13ir.pdf} accessed 1 April 2016.
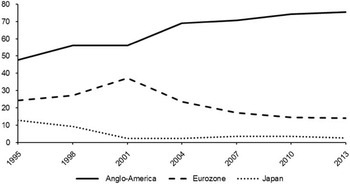
The UK has an astonishing lead in the trading of OTC interest rate derivatives with a market share of almost 49 per cent, reflecting the position of London as one of the two eminent global financial centres besides New York. Anglo-America (or rather, NY-LON) absolutely dominates global OTC derivatives trading. The dominance is so clear that it can be argued that financial derivatives represent a thoroughly Anglo-American phenomenon. Two authors from the BIS are seemingly puzzled by the Anglo-American dominance in OTC derivatives trading. Gyntelberg and Upper note that
contracts in most currencies are more heavily traded outside than inside their country, reflecting the market’s global character. … Paradoxically, the least internationalised currencies include the British pound and the US dollar, the home currencies of the two largest financial centres.Footnote 57
The opposite is true; it is not paradoxical that OTC interest rate derivatives in US dollar or British pound are not heavily traded in other financial centres, but rather logical because both countries absolutely dominate the worldwide trading in these financial derivatives – this market does not have a global character, it undoubtedly has an Anglo-American character. The BIS survey also covers another key segment of global finance: foreign exchange.
Geographical distribution of foreign exchange trading
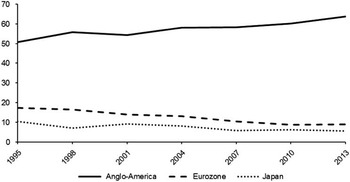
According to the BIS, the daily average turnover in the global market for foreign exchange increased more than tenfold from US $620 billion in 1989 to almost US $6.7 trillion in 2013.Footnote 58 This enormous growth is primarily due to the end of the Bretton Woods system induced by the US in the early 1970s and the concomitant transition from an international monetary system led by governments towards one dominated by markets. Since then, private market actors determine the exchange rates of most currencies worldwide (the Chinese renminbi being the most important exception). Figure 2 shows the development of market shares in foreign exchange trading from 1995 to 2013. The situation is similar to OTC derivatives but less drastic. Anglo-America’s share increased from 51 per cent to 64 per cent, while the eurozone declined from 17 per cent to 9 per cent and Japan dropped from 10 per cent to 6 per cent. China (including HK) has a share of 5 per cent. Similar to the situation in OTC interest rate derivatives, the UK (the City of London) is also by far the largest financial centre in the global market for foreign exchange trading with 40 per cent. This is followed by the US, which however has less than half that market share. On balance, Anglo-America (NY-LON) has increased its dominance in OTC interest rate derivatives as well as in global foreign exchange trading significantly.Footnote 59
Shares in global foreign exchange trading 1995–2013 (percentages). Source: International Monetary Fund (IMF), ‘CPIS Notes and Definitions’ (2013c), available at: {http://cpis.imf.org/notes.aspx} accessed 1 April 2016.
Next, I analyse the composition of official currency reserves from around the world. This indicator reveals how important Anglo-American currencies are as a perceived secure store of value for central banks of different countries.
Currency composition of foreign exchange reserves
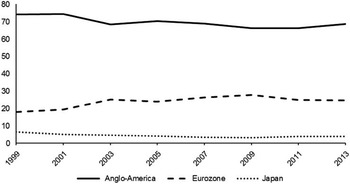
This indicator is based on data from the COFER (Currency Composition of Official Foreign Exchange Reserves) database maintained by the International Monetary Fund (IMF). COFER offers the most comprehensive data on the composition of global foreign exchange reserves – however, some key countries, such as China, do not participate.Footnote 60 Figure 3 shows the changing composition of global foreign exchange reserves from 1999 to 2013. Anglo-America’s share (the Australian, Canadian, and US dollar as well as the British pound) declined from 74 per cent in 1999 to 68 per cent in 2003. This is due to the introduction of the euro, its share increasing in this period from 18 per cent to 25 per cent. The share of the Japanese yen declined from over 6 per cent in 1999 to about 4 per cent in 2013. From 2003 to 2013, the market shares of all three groups have remained more or less constant.
Shares in official foreign exchange reserves 1999–2013 (percentages). Source: IMF, ‘Currency Composition of Official Foreign Exchange Reserves (COFER)’ (2013a), available at: {http://www.imf.org/External/np/sta/cofer/eng/index.htm} accessed 1 April 2016.
The US dollar is still the unrivalled global reserve currency. In 2013, the Chinese renminbi has overtaken the euro to become the second most used currency in trade finance.Footnote 61 However, the US dollar still dominates trade finance with a share of over 81 per cent – almost ten times the share of the renminbi (8.6 per cent). Recently, the renminbi became the fifth largest world payments currency. Nevertheless, its share is still just about 2 per cent, while Anglo-American currencies account for almost 57 per cent of all global payments.Footnote 62 The global financial crisis that originated in the US does not seem to have significantly changed the dominant global position of the greenback. Given the domestic economic instabilities as well as the persisting budget and current account deficits, some observers have proclaimed the demise of the US dollar. However, this has repeatedly been done since the 1970s but never actually happened.Footnote 63 Central reasons for the dominance of the US dollar as the global reserve currency are the position of Wall Street as one of only two truly global financial centres (besides London), and especially the role of US treasuries as the largest and most liquid financial instrument in the world.Footnote 64 Eswar Prasad has aptly characterised this situation as the ‘Dollar Trap’, in which countries such as China and Japan have fallen.Footnote 65 The Australian and the Canadian dollar are also among the top global reserves currencies, together playing a role comparable to the Japanese yen. Neither the euro nor the Japanese yen are in any position to challenge the US dollar. The renminbi will surely become more important in the future. However, the existence of capital controls is going to prevent the Chinese currency from seriously challenging the greenback. Abolishing capital controls would severely reduce Beijing’s control over financial markets, hence anything beyond a gradual and ultimately limited loosening of capital controls seems improbable.Footnote 66 The next indicator regarding the position of Anglo-America in global finance is not a particular global financial market, such as OTC derivatives or foreign exchange trading, but rather reflects the standing of Anglo-American publicly listed corporations vis-à-vis the publicly listed corporations of the rest of the world.
Market capitalisation of publicly listed corporations
There is a growing multidisciplinary body of research focusing on corporations as the relevant objects of study, which has found evidence for strong Anglo-American integration. Eelke Heemskerk and Frank Takes analyse how the largest one million global corporations are interconnected through interlocking directorates utilising community detection through modularity maximisation.Footnote 67 They report the existence of a globally dominant ‘North Atlantic & Commonwealth Community’ that integrates the Anglophone countries with former colonies such as India and South Africa. According to Daniel Haberly and Dariusz Wójcik, corporations from Anglophone countries form an international direct investment network, which they call ‘Anglo-Alliance’.Footnote 68 This subsection looks at the market capitalisation of listed corporations and the largest markets for raising capital internationally.
The market capitalisation of public corporations is calculated by multiplying the number of issued shares with the current share price. Capitalisation is always forward looking. In general, it can be said that ‘capitalization represents the present value of a future stream of earnings: it tells us how much a capitalist would be prepared to pay now to receive a flow of money later’.Footnote 69 Jonathan Nitzan and Shimshon Bichler emphasise the pivotal importance of capitalisation for contemporary capitalism: ‘The real thing is the nominal capitalization of future earnings. This capitalization is not “connected” to reality; it is the reality.’Footnote 70 There is no space here for going into all the details of capitalisation; it shall suffice to note that the market capitalisation is an important indicator for the power difference between publicly listed corporations. Because most large corporations in the world today are listed, it should be expected that the position of Anglo-America is significantly less dominant in this domain of global finance than in the previous segments. Figure 4 displays the development of the market capitalisation of publicly listed domestic corporations.
Market capitalisation of publicly listed corporations (percentages). Source: World Bank, ‘The World Bank DataBank’ (2015), available at: {http://databank.worldbank.org/data/home.aspx} accessed 1 April 2016; WFE, ‘Statistics: World Federation of Exchanges’ (2015), available at: {http://www.world-exchanges.org/statistics} accessed 1 April 2016.
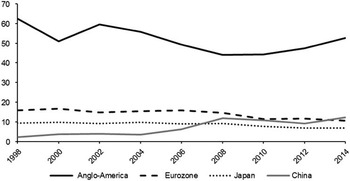
Anglo-America’s share decreased from 62 per cent in 1998 to 44 per cent in 2008 when panic paralysed US stock markets. Since then, however, the share has recovered to almost 53 per cent, reflecting the powerful position of Anglo-American corporations vis-à-vis the rest of the world. For listed companies from the eurozone and Japan the year 2008 has been a true watershed; their shares have declined significantly since then, the former from 15 per cent to 11 per cent and the latter from 9 per cent to 7 per cent. Taking into account that nowadays most large corporations are publicly listed, this is a surprisingly dominant position of Anglo-America. Nitzan and Bichler argue that ‘since relative capitalization represents power, increases in relative capitalization represent the augmentation of power’.Footnote 71 Thus, paradoxical as it might seem, the global financial crisis has not reduced the power of Anglo-American corporations, but augmented it.
This segment is the first in which the rise of China becomes apparent. The share of China (including HK) increased sixfold from just 2 per cent in 1998 to 12 per cent in 2014. During the first half of 2015, Chinese stock markets have grown rapidly with the Shanghai Composite Index increasing from 3,300 to 5,000 points. However, we have to be careful when comparing Chinese market capitalisation to the rest of the world, because access to mainland markets is still heavily restricted for foreign investors. The recent extraordinary stock market boom has been driven primarily by private Chinese capital, as real estate prices were falling and virtually all other investment possibilities are restricted by the state. In China, private investors play a much larger role in the stock market than in highly developed financial markets, making Chinese markets much more volatile and unstable. Hence, the 2015–16 stock market crash should not be surprising. Beijing has managed to halt the crash only in a very ‘Hobbesian’ way through outright banning stock sales by certain investor groups and through massive stock purchases of approximately US $234 billion, resulting in the situation that the ‘national team’ now holds at least 6 per cent of the Chinese stock market.Footnote 72
China has witnessed a high number of initial public offerings (IPOs) during the last decade, as many corporations had been privately held or state-owned. However, what is relevant for structural power in global finance is which countries act as significant markets for cross-border IPOs. Again, NY-LON dominates: from 2002–11, 41 per cent of cross-border IPOs took place in London and 23 per cent in New York.Footnote 73 In 2014, New York even accounted for 52 per cent of all global cross-border IPOs and 81 per cent by capital raised.Footnote 74 This staggering figure is due to the largest IPO of all-time, the Chinese e-commerce giant Alibaba that listed in New York via a holding company domiciled in the common law tax haven of the Cayman Islands. The Cayman Islands also plays an important role in the issuance of international debt securities – another way to raise capital for corporations. Anglo-America accounted for 43 per cent of all cross-border debt securities by residence of issuer in mid-2015.Footnote 75
International banking relations
Most segments discussed so far have analysed particular financial markets without distinguishing between domestic and cross-border transactions. The next four segments – external deposits of banks, inward and outward direct investment, and portfolio investment, on the other hand, only cover cross-border holdings. Portfolio investment is the largest segment (US $47 trillion), followed by direct investment (US $28 trillion). External bank deposits represent the smallest of the three segments (US $21 trillion). These three segments complement each other: together they comprise the vast majority of cross-border financial holdings (roughly US $96 trillion).
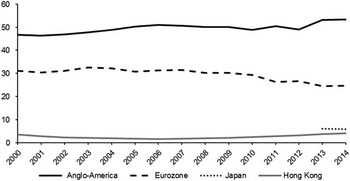
To analyse cross-border banking activities, I use data on external deposits of banks in individual reporting countries in all currencies vis-à-vis all sectors.Footnote 76 Total external deposits of banks at end-2014 amounted to US $20.7 trillion. Figure 5 shows that from 2000 to 2014 the share of Anglo-America has increased from about 46 per cent to over 53 per cent. Apparently, the global financial crisis did not have negative consequences for the attractiveness of Anglo-America for foreign deposits. However, there have been some internal shifts; the share of the UK declined from 23 per cent of all international deposits in 2007 to 20 per cent in 2014, while the share of the US increased from 13 per cent to 19 per cent and the rest of Anglo-America (for example, the Cayman Islands and Canada) increased from 10 per cent to 14 per cent. The share of the eurozone declined from 31 per cent in 2000 to under 25 per cent in 2014.Footnote 77 For Japan, we only have data for 2013 and 2014 – the share remained comparably low at 6 per cent. China does not report data to the BIS, but due to Chinese capital controls, the amount of foreign bank deposits is likely to be negligible. HK’s share dropped from almost 4 per cent in 2000 to under 2 per cent in 2006 and then rose again to 4 per cent in 2014. We can see that the trajectories of Anglo-America and the eurozone roughly mirror each other, the former increased by about 7 per cent during these 14 years while the latter dropped 6 per cent.
Shares in global external bank deposits 2000–14 (percentages). Source: BIS, ‘Locational Banking Statistics’ (2015a), available at: {http://www.bis.org/statistics/bankstats.htm} accessed 1 April 2016.
In the next step, I use bilateral data for 2012 on consolidated foreign claims by domestically owned reporting banks (immediate borrower basis) by the BIS to visualise Anglo-American dominance in cross-border banking activities.Footnote 78 Specifically, I use data for the top 19 global banking jurisdictions, which account for over 90 per cent of all external deposits. I add the two bilateral claims to get one value describing the scale of bilateral banking activity. This procedure reduces the detail of the graph (for example, that UK banks reported claims on the US of over US $1 trillion while American banks reported claims on the UK of ‘only’ US $500 billion) but enhances clarity significantly. The purpose of Figure 6 (and the following three visualisations) is not to give the greatest possible amount of detail, but to present a broad overview. William Kindred Winecoff provides a more detailed discussion about persistent American structural power in international banking after the financial crisis. He concludes that ‘despite being the epicentre of the crisis, the United States has increased in prestige according to some measures and remained at the core in others’.Footnote 79 Figure 6 displays bilateral banking claims amounting to almost US $17 trillion. The top 19 jurisdictions have been arranged in a way that the largest ones are at the centre and the smallest ones are at the periphery. Anglo-American jurisdictions are shown in red, all others in grey. The size of the jurisdictions is derived from the value of banking relations with the other 18 jurisdictions; in other words, the magnitude of the spheres in the visualisation is equivalent to the sum of all their bilateral banking relations. Connections between Anglo-American jurisdictions are red, connections outside of Anglo-America are grey, and those between the two are mixed.
Visualising the scale of banking activity between the top 19 jurisdictions (2012). Source: Author.
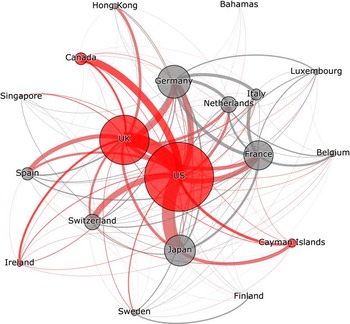
It is immediately visible that international banking is extremely concentrated at the Anglo-American centre. Except for very few countries such as Italy and Belgium, all jurisdictions have their largest bilateral banking relations with Anglo-America. The four largest individual cross-border positions are all claims on the US: (1) by Japan (US $1.2 trillion); (2) by the UK (US $1.1 trillion); (3) by Canada (US $716 billion); (4) by Switzerland (US $625 billion); and the fifth largest is claims by US banks on the UK (US $547 billion). Connections between jurisdictions at the periphery are barely noticeable. As Thomas Oatley et al. have argued, the international banking network is not flat, but hierarchical with the US and the UK as the only global hubs.Footnote 80 The next subsection analyses cross-border investment by corporations.
International direct investment
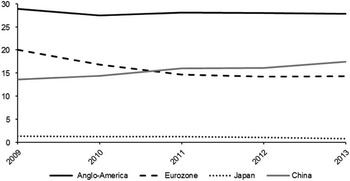
When an investor or a company owns more than 10 per cent of the voting rights of a foreign corporation, this is conceptualised as direct investment. Direct investment is commonly theorised to be more stable and long-term than portfolio investment and is made ‘in order to control or exert significant influence over the management of that [foreign] enterprise’;Footnote 81 direct investment comprises ‘greenfield’ investment (the building of new facilities) as well as mergers and acquisitions (M&A). The data for this indicator are taken from the Coordinated Direct Investment Survey (CDIS) conducted by the IMF.Footnote 82 I use CDIS data on both inward direct investment (IDI) and outward direct investment (ODI) to evaluate the position of the Anglo-American countries and jurisdictions in this segment of global finance. However, I exclude the Netherlands and Luxembourg, because the IMF has identified both jurisdictions as the two eminent global direct investment conduits; both countries act as huge black boxes that obscure the true origin of direct investment flows as they are routed through these two entrepôts.Footnote 83 The exclusion of the Netherlands and Luxembourg is not likely to overstate the position of Anglo-America in the field of direct investment, because Anglo-America accounts for most of IDI and ODI of both conduits. Bilateral direct investment data are only available from 2009 onwards. Total direct investment has increased from US $20 trillion in 2009 to about US $28 trillion in 2013. Figure 7 shows that Anglo-America’s share in IDI is significantly lower than in any segment before, declining slightly from 29 per cent to 28 per cent. The share of the eurozone has declined from 20 per cent to 14 per cent; Japan is too small to matter in this case. Foreign direct investment has played an important role for the rise of China. Hence, it is not surprising that China’s share in global IDI (including HK) has increased from close to 14 per cent in 2009 to over 17 per cent in 2013, thus surpassing the eurozone in 2011.
Shares in inward direct investment 2009–13 (percentages). Source: IMF, ‘Coordinated Direct Investment Survey’ (2013b), available at: {http://cdis.imf.org} accessed 1 April 2016.
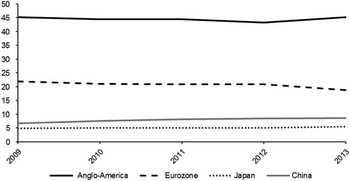
The situation is very different in ODI, as Figure 8 shows. Here, China’s share has increased only slightly from 7 per cent to 9 per cent. Japan is much stronger in ODI than in IDI, with its share remaining constant around 5 per cent. The eurozone decreased slightly from 22 per cent to 19 per cent. But what is really significant here is Anglo-America’s persistently high share of about 45 per cent between 2009 and 2013. The discrepancy between a share of 28 per cent in global IDI and 45 per cent in ODI is what Schwartz has called ‘global financial arbitrage’ by America (and the Americanised Rich countries).Footnote 84 Foreigners tend to hold mostly low-yielding assets such as US treasuries. Japan and China, for example, together hold nearly US $3 trillion of US long-term debt.Footnote 85 These giant holdings of US treasury and agency bonds provide some level of autonomy to Beijing and Tokyo, as they enable protection against sudden currency crises. However, these holdings yield very low or even negative returns when taking inflation into account and due to their enormous size they bind China and Japan to the US.Footnote 86 The US, on the other hand, mostly holds much higher yielding assets, such as direct investment. Hence, America earns much more with its overseas investment than foreign investors earn with investment in the US. The high American share of global ODI is also a reflection of US dominance in cross-border M&A.Footnote 87 As a result, US corporations have occupied central nodes in international value chains, which enables them to sustain their dominant position.Footnote 88
Shares in outward direct investment 2009–13 (percentages). Source: IMF, ‘Coordinated Direct Investment Survey’ (2013b), available at: {http://cdis.imf.org} accessed 1 April 2016.
Similar to the segment of banking, it is instructive to visualise the bilateral relations in the field of direct investment. Here, I include the Netherlands and Luxembourg in order to show their important international position in direct investment and their close relation to Anglo-America. I use 2012 data for the top 24 jurisdictions that collectively have been responsible for almost 90 per cent of all global direct investment. Again, the two bilateral investment stocks have been merged to display the scale of direct investment relations. Figure 9 shows bilateral direct investment to the tune of US $25 trillion – US $8 trillion more than the segment of banking. Four countries constitute the core of international direct investment: the Netherlands, the US, Luxembourg, and the UK. Only China and HK are not strongly bound to this core (both are, however, strongly connected to the Anglophone British Virgin Islands, which Chinese corporations use for roundtripping investment, thus gaining tax and legal benefits).
Visualising the scale of direct investment between the top 24 jurisdictions (2012). Source: Author.
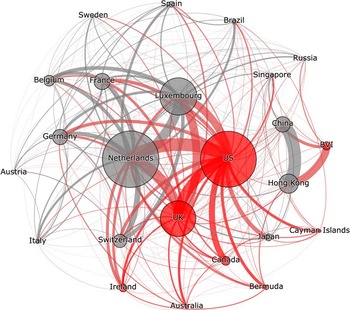
The largest bilateral direct investment relations are: (1) between the Netherlands and the US (US $1.35 trillion); (2) between China and HK (US $1.34 trillion); (3) between the US and the UK (US $1.08 trillion); (4) between the Netherlands and Luxembourg (US $1.02 trillion); and (5) between the Netherlands and the UK (US $1.01 trillion). Thus, the Netherlands and Luxembourg largely act as conduits for Anglo-American direct investment. This leaves only one major segment of global finance missing from the analysis, international portfolio investment.
International portfolio investment
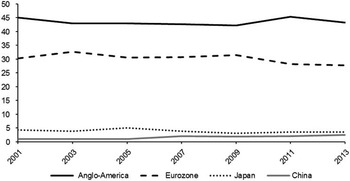
The data for this indicator are taken from the Coordinated Portfolio Investment Survey (CPIS) conducted by the IMF. The IMF defines portfolio investment as ‘cross border transactions and positions involving debt or equity securities, other than those included in direct investment or reserve assets’.Footnote 89 Hence, CPIS data only include assets (mostly stocks and bonds) held by private investors abroad and consequently exclude both portfolio investment held domestically and portfolio investment held by central banks (such as the large holdings by China and Japan). Portfolio investment can be assessed in two different ways. The first, and most obvious, is to take the assets that have been reported to the IMF by the 78 participating jurisdictions. The second one is to use ‘derived liabilities’ that are calculated by the IMF for over 200 jurisdictions using the data reported by the participants. Derived liabilities thus have the advantage that data for many more jurisdictions can be utilised, including offshore financial centres that underreport significantly. The most striking example in this regard is the Cayman Islands, which does not report the vast hedge fund sector – thus reporting assets of only about US $50 billion instead of over US $2 trillion. Total global portfolio investment increased from almost US $13 trillion in 2001 to nearly US $47 trillion in 2013, making it the largest cross-border segment analysed here. Figure 10 shows that Anglo-America’s share has remained almost constant (decreasing slightly from 45 per cent to 43 per cent). However, there have been some internal shifts; the shares of the UK and the US declined from 10 per cent and 24 per cent to 8 per cent respectively 20 per cent. Concomitantly, the aggregated share of Australia, Canada, the Cayman Islands, and Ireland increased from 8.5 per cent to 12.5 per cent. The share of the eurozone declined slightly from 30 per cent to 27 per cent, Japan remained constant at 4 per cent. Due to restrictions for foreign investors, the share of China (including HK) increased only from 1 per cent to 2.5 per cent.
Shares in international portfolio investment 2001–13 (percentages). Source: IMF, ‘Coordinated Portfolio Investment Survey’ (2013d), available at: {http://cpis.imf.org} accessed 1 April 2016.
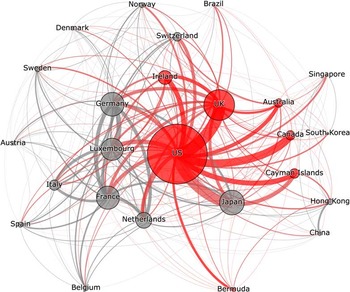
In the next step, I visualise the global network of portfolio investment. I use the 25 largest jurisdictions that have accounted for over 90 per cent of total portfolio investment. Once more, I add the two bilateral stocks of derived portfolio investment to one value describing the scale of portfolio investment between two jurisdictions. Figure 11 shows portfolio investment amounting to US $32 trillion. Again, the jurisdictions have been arranged in a way that the largest ones are at the centre and the smallest ones are at the periphery. This visualisation clearly shows Anglo-American dominance in private global portfolio investment. Eight of the ten largest bilateral portfolio investment relations in the world involve Anglo-America – the largest by far is between the US and the UK. Moreover, the vast majority of countries have their largest bilateral investment relation with a jurisdiction of Anglo-America. Japan in particular is strongly integrated with Anglo-America (both directly with the US, but also via the Cayman Islands); the clusters of France, Germany, Italy and Luxembourg as well as China and HK represent two notable exceptions that have significant investment relations outside of Anglo-America. However, both are still strongly integrated with the Anglo-American centre.
Visualising international portfolio investment of the top 25 jurisdictions (2012). Source: Author.
Each of the three visualisations presented here sheds light on the position of Anglo-America in different cross-border segments of private global finance. Now, I aggregate all three visualisations (portfolio investment, direct investment, and banking claims) to one in order to present a unique overview of global finance. The purpose is to show the ‘big picture’ of global finance. Figure 12 displays bilateral financial relations between the largest 34 jurisdictions, which in 2012 have amounted to an astounding US $81.6 trillion, slightly more than global GDP; note that this sum is by almost US $8 trillion larger than the three individual visualisations presented above, because I have not simply merged the data of the three visualisations, but added missing values. For example, China does not appear in the visualisation of banking claims. The international banking relations of China (as reported by the other jurisdictions), however, appear in Figure 12. I have also added India, which has not been large enough to appear in any of the three previous visualisations, because it is widely believed to play an important role in the future. Data for Jersey and Guernsey (historically treated as ‘Channel Islands’ for statistical purposes) have been merged, because each on its own is too small to appear here, seen together, however, they play a larger role in global finance than India or Finland.
The big picture of global finance in 2012. Source: Author.
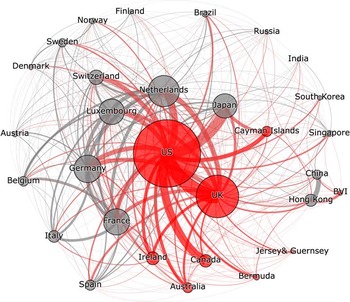
Figure 12 represents one of the most complete visualisations of cross-border global finance to date. The graph clearly shows that Anglo-America is the undisputed core of global finance, with the US-UK axis being the largest private bilateral financial relation on the planet with almost US $4.7 trillion. Japan is strongly integrated with Anglo-America and US-Japan financial relations represent the second largest bilateral connection (US $3.7 trillion). The following ten largest bilateral relations all involve the US or the UK – the only exception is China-HK on place six with US $1.6 trillion. The vast majority of countries have their largest bilateral financial relations with Anglo-America – the few exceptions are Austria, Belgium, Denmark, Finland, Italy, and of course China-HK. Thus, the contemporary system of global finance is unequivocally hierarchical with Anglo-America constituting the centre around which virtually all other countries revolve. Even if domestic political elites of European or Asian countries wanted to distance their economies from Anglo-America, it would be extremely difficult for them to escape the enormous financial gravity of the centre. The next subsection provides indications about how the shares of different countries in global (financial) wealth have developed since 2000 – regarding who has benefitted most from the system of global finance shaped by Anglo-America.
Total and financial wealth
The final and most comprehensive segment is wealth, particularly financial wealth. Wealth is a much better proxy of economic power in a globalised world than GDP: first, because wealth can be used transnationally to gain control over assets, while GDP is just an aggregate measure of production (or income or expenditure, depending on the perspective) within national borders; second, because estimated global wealth (US $263 trillion in 2014) is more than three times the size of global GDP (US $77 trillion).Footnote 90 Financial wealth – which is especially relevant for the topic of this article – amounted to US $165 trillion in 2014, more than two times global GDP. I use data by Anthony Shorrocks et al., which provide estimates of ‘total wealth’ and ‘financial wealth’ for 200 jurisdictions.Footnote 91 Figure 13 shows the share of Anglo-America in world GDP, total wealth and financial wealth from 2000 to 2014.
Anglo-America’s share in global GDP, total, and financial wealth 2000–14. Source: Author’s calculations based on Anthony Shorrocks, James Davies, and Rodrigo Lluberas, ‘Global wealth databook 2014’, Credit Suisse, available at: {https://publications.credit-suisse.com/tasks/render/file/?fileID=5521F296-D460-2B88-081889DB12817E02} accessed 1 April 2016.
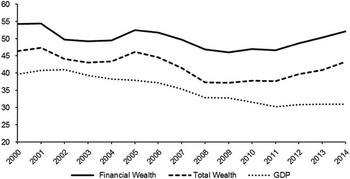
Anglo-America’s share of global GDP has continually decreased from 41 per cent in 2002 to 30 per cent in 2011. This reflects the ‘rise of the rest’, as China and other emerging economies have been able to generate higher rates of economic growth. Most conventional analyses would interpret this as a clear sign for Anglo-American decline in the international political economy. Since 2012, however, Anglo-America’s share in global GDP has stabilised at 31 per cent. More importantly, Anglo-America’s share in global total wealth has been much higher than its share in world GDP. It declined from a peak of 47 per cent in 2001 to a nadir of 37 per cent in 2008/2009. Since then the trend has reversed and the share of the Anglophone countries has risen again to 43 per cent in 2014. Hence, despite a slowly decreasing share in global GDP, Anglo-America has been able to increase its share in total wealth. This uncoupling is an important finding. The development of Anglo-America’s share in global financial wealth is even more significant. From the early 2000s to 2009, it has declined from a high of 54 per cent to a low of 46 per cent in 2009. Since then, however, the share of the Anglophone countries has increased again to an astounding 52 per cent of global financial wealth in 2014. Remarkably, Anglo-America’s share in financial wealth has increased faster than its share in total wealth. Before the global financial crisis, the distance between both shares had been mostly six or seven percentage points. Since 2008, the gap has been nine percentage points in most years. Thus, despite the financial crisis breaking out in Anglo-America, these countries managed to increase their share of global total wealth in recent years – and they increased their share in financial wealth even faster. In the Anglophone countries, wealth is highly concentrated in the hands of the top 1 per cent of the population. Thus, we can conclude that these wealthy political and economic elites have benefitted significantly from the dominant structural power of Anglo-America in global finance.
The eurozone and Japan show a different development. In 2000, the eurozone had 19 per cent of total wealth and 16 per cent of financial wealth. This increased to 25 per cent, respectively 20 per cent in 2009. Probably due to the European sovereign debt crisis, both values declined during the next five years to below 22 per cent, respectively 17 per cent in 2014, slightly above the shares of the eurozone in 2000. Japan, on the other hand has declined throughout the whole period from more than 16 per cent in both categories in 2000 to 9 per cent in total wealth and 10 per cent in financial wealth in 2014. China (including HK), on the contrary, roughly doubled its share in these two segments of wealth from around 4 per cent in 2000 to approximately 8 per cent in 2014 (still much lower than China’s share of global GDP, which stands at 12 per cent). Hence, in the pivotal segment of financial wealth Anglo-America (52 per cent) accounts for a much larger share than the eurozone, Japan, and China combined (35 per cent).
Conclusion
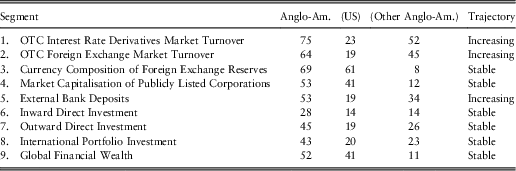
The nine segments discussed in this article allow for a truly comprehensive analysis of Anglo-America’s structural power in global finance roughly from 2000 until 2014. There is no space in this article to attribute different weights to the nine segments (if that is indeed possible) – however, it is clear that financial wealth is by far the largest segment. All nine segments together constitute contemporary global finance – the financial structure in which other states and foreign corporations have to operate. Table 1 provides an overview of the different segments, specifying the latest share of Anglo-America (also split up into the share of the US and that of the other Anglo-American jurisdictions) as well as the trajectory observed in the period for which data have been available. The market shares in the different segments have to be seen against the backdrop that Anglo-America represents about 31 per cent of global GDP. In all segments, except inward direct investment, Anglo-America has a much higher share than this 31 per cent. Anglo-American dominance has been particularly strong (and increasing) in the first two segments of OTC trading. Here, NY-LON has a very dominant position. The third segment is about foreign exchange reserves. Here, the US dollar clearly dominates globally (being also the leading international payments currency). The US is the dominant country in terms of the market capitalisation of domestic publicly listed corporations, the subject of segment four. America accounts for about 22 per cent of global GDP, yet its corporations are responsible for 41 per cent of total global market capitalisation. Thus, US corporations are in a very powerful position globally, as also found by Starrs.Footnote 92 Anglo-America as a whole even accounts for 53 per cent of global market capitalisation.
Anglo-America’s dominance in nine key domains of global finance (latest year, in percentages).
Source: Author.
This dominant position is similar in segment five, external bank deposits. Again, the UK plays an important role here, helping to increase Anglo-America’s share in recent years. Segments six, seven, and eight have to be seen together. Segment six, inward direct investment, is the only one in which Anglo-America (28 per cent) has a global share below 43 per cent. However, this should not be interpreted as a weakness, because it is a manifestation of what Schwartz has called ‘global financial arbitrage’;Footnote 93 the US (and Anglo-America in general) invests more in high-yielding outward direct investment, whereas non-Anglophone investors mostly hold lower yielding portfolio investment (including US treasuries) and significantly less inward direct investment into (Anglo-)America. The four novel visualisations presented in this article show very clearly that the US-UK axis is the fulcrum of private global finance and that Anglo-America as a whole has a very dominant position in cross-border finance. The vast majority of non-Anglophone countries shown in the different visualisations is profoundly integrated into Anglo-American structures of global finance, making it extremely difficult for them to decouple. Finally, the analysis of global financial wealth – a good proxy for financial power – is very instructive. Contrary to conventional wisdom, Anglo-America’s share in financial wealth has increased since the financial crisis and remained stable since the early 2000s.
If we assume that hegemony in international political economy is cyclical, as many world-system analysis scholars seem to suggest, than it would be logical to conclude that the US is on a trajectory of perpetual decline vis-à-vis the rising powers, such as China. Analysing the power position of the US in isolation misses the big picture, however. America has a ‘family’, so to speak, which is the group of the Anglophone countries. The Anglo-American countries and territories have deep common roots that manifest themselves in similar socioeconomic systems, likewise legal systems based on common law, and comparable overseas investment patterns. Moreover, the Anglosphere has its own corporate community via board interlocks as well as a distinct cross-border direct investment network.Footnote 94 Finally, the unparalleled global intelligence cooperation of the Anglophone countries is the most obvious indication that we should analyse Anglo-America together and not classify the individual jurisdictions solely on geographical grounds. Van der Pijl calls this formation the Lockean heartland of the global political economy, in which Anglo-American ‘civil society’ (primarily the business and financial elites) operates transnationally. That is arguably why Anglo-America is strongly integrated by private financial holdings. The very nature of the Lockean state/society complex implies that Anglo-America is not a formally organised and politically centralised entity. Instead, integration is more informal and often private (the Five Eyes cooperation, board interlocks, or ownership patterns), resulting in extremely elastic and flexible yet robust and ‘deep’ ties that are frequently overlooked by conventional analyses, but nonetheless bind. Occasional disagreements (for example, about joining the AIIB) do not contradict this. On the contrary, they are an immanent feature of the Anglo-American ‘family’ and should not be overrated.
The findings of this article show that Anglo-America clearly dominates the structure of global finance with market shares in eight key segments between 43 per cent and 75 per cent. Hence, Anglo-America exerts dominant structural power in global finance. Arguably, today Anglo-American global finance – a complex amalgam of public and private authority – permeates almost every political economy in the world and influences political and economic decision-making. At least in the OECD-world, finance has become the ‘super-structure’, increasingly dominating the structures of production and knowledge (though not necessarily security). The global financial crisis, which developed in Anglo-America and then spread internationally, certainly has led to growing scepticism and even resistance against the liberal Anglo-American model of global finance amongst citizens and politicians in a number of countries.Footnote 95 However, business and financial elites of most countries are still strongly attracted towards Anglo-American markets and corporations. Once countries have integrated themselves into the open international financial order created and dominated by Anglo-America it becomes extremely costly to extricate themselves from it. This is comparable to what Walter Russell Mead has called the ‘sticky’ power of America.Footnote 96 The eurozone and Japan are certainly stuck to this Anglo-American global financial order. At present, the only conceivable challenger to Anglo-America is China, which is actively trying to increase its autonomy, for example, through the AIIB. The findings of this article suggest a coming dilemma for Beijing: if China wants to truly challenge Anglo-America in the global structure of finance, it eventually will need to abolish capital controls. This, however, would diminish Beijing’s control over domestic finance significantly and the interests of Chinese business and financial elites would, over time, increasingly align themselves to the Anglo-American centre, which, contrary to conventional wisdom, is not in perpetual decline but enjoys persistent structural power in global finance. A final note is in order, though. The dominance of Anglo-America in global finance is unambiguous yet at the same time marked by a high degree of latent fragility. Global finance has not been re-regulated drastically after the global financial crisis;Footnote 97 significant imbalances, inequalities and contradictions persist and are even likely to grow, potentially undermining the legitimacy and the stability of the whole system. However, most OECD countries (and increasingly China too), have integrated themselves in the open global financial order dominated by Anglo-America and are hence not inclined to directly challenge it – even though the Anglophone centre (NY-LON) seems to reap significantly larger benefits than them.
Acknowledgements
The author would like to thank Herman Schwartz, Leonard Seabrooke, Kai Koddenbrock, and participants of the panel ‘Theories and Concepts in the Study of Global Finance’ at the 2015 ISA Annual Convention for feedback on earlier versions of this article. The insightful comments of three anonymous reviewers helped me to improve the article significantly.



