

Excess Na increases a person’s risk for heart disease and stroke, which together are the number one cause of death in the USA( 1 ). A modest reduction in salt intake reduces blood pressure in both hypertensive and normotensive individuals and reduces the risk of stroke and fatal CHD in adults( 2 – Reference Strazzullo, D’Elia and Kandala 5 ). The recent Institute of Medicine report, Sodium Intake in Populations, reaffirmed the relationship between Na intake and risk of CVD, which is consistent with existing evidence on blood pressure as a surrogate indicator of CVD and stroke risk for the general population( 6 ).
Americans’ dietary Na intake averages about 3300 mg/d( 7 ). This is considerably higher than the 2300 mg/d recommendation for the general population in the 2010 Dietary Guidelines for Americans( 8 ) and the tolerable upper limit established by the Institute of Medicine in 2004( 8 , 9 ). The Institute of Medicine’s report, Sodium Intake in Populations, questioned the health outcomes evidence for the specific recommendation made in the 2010 Dietary Guidelines for Americans to limit Na intake to 1500 mg/d for the following groups: people 51 years of age and older, African Americans, and those who have high blood pressure, chronic kidney disease or diabetes( 8 ). However, this should not detract from the fact that approximately nine out of ten persons in the USA consume more Na than recommended( 10 ) and the amount of Na consumed every day by the average American can raise blood pressure and increase the risk for CVD( 6 , 9 , 11 ).
About 75 % of Na intake comes from salt added to food during manufacturing and processing( Reference Mattes and Donnelly 12 ). NaCl is a widely used food additive because it is perceived to improve flavour and also is a preservative( Reference Mattes and Donnelly 12 , Reference Hutton 13 ). Population reduction of salt intake has both health and economic benefits. Estimates indicate that reducing Na in processed and restaurant foods to a level that would lead to an average intake of 2200 mg/d would save 280 000 to 500 000 Americans from dying prematurely from CVD over a decade( Reference Coxson, Cook and Joffres 14 ) and save $US 18 billion in health-care costs( Reference Palar and Sturm 15 ).
Bread, which is generally produced locally, can be a good source of nutrients and fibre. However, it is also the single largest contributor of Na to the American diet( 10 ). This is largely due to the amount of bread consumed, as well as the high Na content of some bread products. Studies done outside the USA have demonstrated that reductions of 10–30 % in the Na content of white bread and French bread did not result in a detectable change in flavour or taste and did not decrease population bread consumption( Reference Girgis, Neal and Prescott 16 – Reference Ferrante, Apro and Ferreira 19 ). However, existing research findings cannot be applied to the US population because taste preferences, regulatory environments and individual Na consumption vary from country to country. Dunford et al. found substantial differences in Na content of fast-food offerings across countries, suggesting that population preferences for salty foods vary depending on location( Reference Dunford, Webster and Woodward 20 ).
To inform efforts to reduce Na in bread products, we sought to determine the level at which consumers could detect a difference in Na content between reduced-Na bread and bread with a typical Na content in Oregon, USA and to determine if consumer sensory acceptability and purchase intent differed between reduced-Na bread and bread with a typical Na content.
Methods
The study was conducted in two phases: (i) consumer difference testing of control bread and bread given a 10 %, 20 % and 30 % Na reduction; and (ii) acceptability testing of the four bread types to measure consumer liking of bread sensory characteristics and purchase intent. Difference testing was conducted on 29 January 2013 and acceptability testing was conducted on 31 January 2013 in Portland, OR, USA at the Oregon State University Food Innovation Center with different consumers for each test.
Consumer recruitment
Two hundred and ten consumers were recruited from a pool of over 17 000 potential testers in the Oregon State University Food Innovation Center’s sensory testing database. All members of the database are sent an email with the possibility to apply for participation. Potential participants fill out a screening questionnaire assessing demographic information and selected food preferences. Of the 785 individuals who submitted a screening questionnaire, 210 were selected and emailed an invitation to participate; ninety for the difference testing and 120 for the acceptability testing. Selection was based on having an equal distribution of ages, incomes, genders and education levels along with being self-identified users and likers of sandwich bread. Participants who self-reported as being more sensitive to Na were given preferential selection for difference testing. Of those invited to participate in testing, 82/90 (91 %) and 109/120 (91 %) agreed to participate and completed the difference and acceptability testing, respectively. For difference testing, a sample size of seventy participants or more was required to detect at least a 65:35 split among consumers at the 0·05 level of significance. These are the most commonly used difference test parameters( 21 ). For acceptability testing, between 100 and 120 participants were required to detect differences at the 0·05 level of significance, which is a standard for acceptability testing in the sensory testing field( Reference Meilgaard, Civille and Carr 22 ). A $US 25 incentive was given to participants.
Materials
Bread for testing was made by the Wheat Marketing Center located in Portland, OR, USA. The loaves of bread were made with 50 % whole-wheat flour and 50 % white bread flour. For the control bread, the NaCl was 2 % of flour at 14 % moisture basis (104mgNa), and it was reduced to 1·8 % % (83mgNa), 1·6 % (72mgNa) and 1·4 % (64mgNa), corresponding to 10 %, 20 % and 30 % Na reductions, respectively. Sodium propionate was also used as a mould inhibitor. The bread was made one day prior to testing and was stored in plastic bags overnight. Fifty per cent whole-wheat bread was used because it meets the whole grain-rich criteria for the US National School Lunch Program (NSLP)( 23 ).
Difference testing
Difference testing was conducted with eighty-two consumers. Consumers took three difference tests: (i) control v. 10 % Na reduction; (ii) control v. 20 % Na reduction; and (iii) control v. 30 % Na reduction. The bread was sliced the morning of the test at a local bakery using a professional bread slicing machine to ensure uniformity. Each consumer received approximately one-half slice, with crusts removed, of each control and reduction sample. The samples were served on coded liners and placed on the serving tray just prior to serving. Samples were coded with 3-digit numbers and sample presentation was counterbalanced over the entire test to avoid order effects. Participants were instructed to cleanse their palates with water and a non-salted cracker before and after each trial. When presented with the two samples, consumers were asked, ‘In front of you are two samples. Taste both samples from left to right. Which sample is saltier?’. In between each tasting session, consumers were asked five to ten questions about nutrition, including Na-related behaviours, to help mitigate panellist fatigue. This time between product tastings allows consumers to rest and reset their palates for the next tasting. These question responses were analysed, but not reported as they did not add significance to the findings of the sensory testing.
Two Na detection tests were run with the same eighty-two consumers who participated in difference testing. Na detection tests were conducted to verify that, as a group, the consumers participating in difference testing were discriminators of Na. After the difference testing of the three bread products, each consumer was given two additional difference tests with deionized water and deionized water plus a 3mm concentration of NaCl. Consumers were asked, ‘In front of you are two samples. Taste both samples from left to right. Which sample is saltier?’. During consumer selection, salt sensitivity was assessed through the screener question ‘How sensitive are you to salt/sodium?’. Na detection tests were conducted to verify salt sensitivity self-reported in the screener.
Acceptability testing
The acceptability testing was conducted with 109 consumers who did not participate in difference testing. Consumers tasted bread from four different loaves: (i) control; (ii) 10 % Na reduction; (iii) 20 % Na reduction; and (iv) 30 % Na reduction. Consumers received one slice of each bread type being tested. Bread samples were served one sample at a time in the same position on the serving tray and served the same number of times. The samples were served on coded liners and placed on the serving tray just prior to serving. Samples were coded with 3-digit numbers and sample presentation was counterbalanced over the entire test to avoid order effects. Participants were instructed to cleanse their palates with water and a non-salted cracker before and after each trial.
Consumers were asked to rate sensory characteristics of the bread products, including appearance, aroma, overall liking, flavour, sweetness, salt level and texture. For appearance consumers were asked, ‘How well do you like or dislike the APPEARANCE of sample X?’. For aroma consumers were asked, ‘Please smell sample X. How much do you like or dislike the SMELL of sample X?’. For overall liking consumers were asked, ‘Please taste sample X. How much do you like or dislike sample X OVERALL?’. For flavour respondents were asked, ‘How much do you like or dislike the FLAVOR of sample X?’. For sweetness respondents were asked, ‘How much do you like or dislike the SWEETNESS of sample X?’. For salt level respondents were asked, ‘How much do you like or dislike the SALTINESS of sample X?’. For texture consumers were asked, ‘How much do you like or dislike the TEXTURE of sample X?’.
Consumers rated the sensory characteristics of each bread sample on the following nine-point hedonic scale: 9 =‘like extremely’, 8=‘like very much’, 7=‘like moderately’, 6=‘like slightly’, 5=‘neither like nor dislike’, 4=‘dislike slightly’, 3=‘dislike moderately’, 2=‘dislike very much’ and 1=‘dislike extremely’. In between each tasting session, consumers were asked five to ten questions about Na-related behaviours to help mitigate panellist fatigue.
Purchase intent
After consumers rated the bread samples on sensory characteristics they were asked to rate purchase intent for each bread product. Consumers were asked, ‘Now that you know how each bread tastes, would you BUY a 22 oz. loaf of sample X if its price was $2·49?’. A 22 oz. loaf was selected for the question because this is the size of a standard loaf of bread. A purchase price of $US 2·49 was selected because this was the average price of a 22 oz. loaf of bread in a small sample of bread products available in recent online advertisements for local grocery stores. Consumers rated their purchase intent using the following five-point scale: 5=‘definitely buy’, 4=‘probably buy’, 3=‘might or might not buy’, 2=‘probably not buy’ and 1=‘definitely not buy’.
Data collection and statistical analyses
Participants were presented with samples in individual testing booths adjacent to the sample preparation area, equipped with serving windows, controlled lighting and computers for ballot presentation and data collection. Napkins, water and non-salted crackers to cleanse the palate were also provided.
Compusense® Data Acquisition System (Compusense Inc., Ontario, Canada), a computer software package for sensory analyses data collection, was used during the course of the study. The software was used to create questionnaires, present questionnaires to consumer participants according to the experimental design plan, and collect and analyse difference and acceptability testing data. Two-alternative forced choice (2AFC) testing was used to determine a consumer’s ability to detect the difference in Na levels across the four bread samples and across the two follow-up samples of deionized water. 2AFC testing is a sensory method to determine whether a difference exists in the perceived intensity of a specified attribute (in this case Na) between two samples. Acceptability and purchase intent results were analysed using one-way ANOVA and Tukey’s honest significant difference test to determine if there was a significant difference in mean acceptability scores and purchase intent scores across the four bread types. Statistical significance was set at the 0·05 level for all analyses.
Results
Difference testing
Demographics of difference testing participants are provided in Table 1. In difference testing of 10 %, 20 % and 30 % reduced-Na bread, 35/82 (43 %), 47/82 (57 %) and 66/82 (80 %) correctly identified the control bread as higher in salt content, respectively. Ability to discriminate between reduced-Na bread and control bread with higher salt content was statistically significant at the P<0·05 level for the 20 % and 30 % reductions, but not the 10 % reduction.
Characteristics of participants in difference and acceptability testing of reduced-sodium bread, Oregon, USA, 2013

For the Na detection tests, 52/82 (63 %) of consumers chose the correct sample of deionized water with added Na in the first trial (P<0·05) and 61/82 (74 %) of consumers chose the correct sample in the second trial (P<0·05). These results verified that consumers participating in difference testing were discriminators of Na.
Acceptability testing
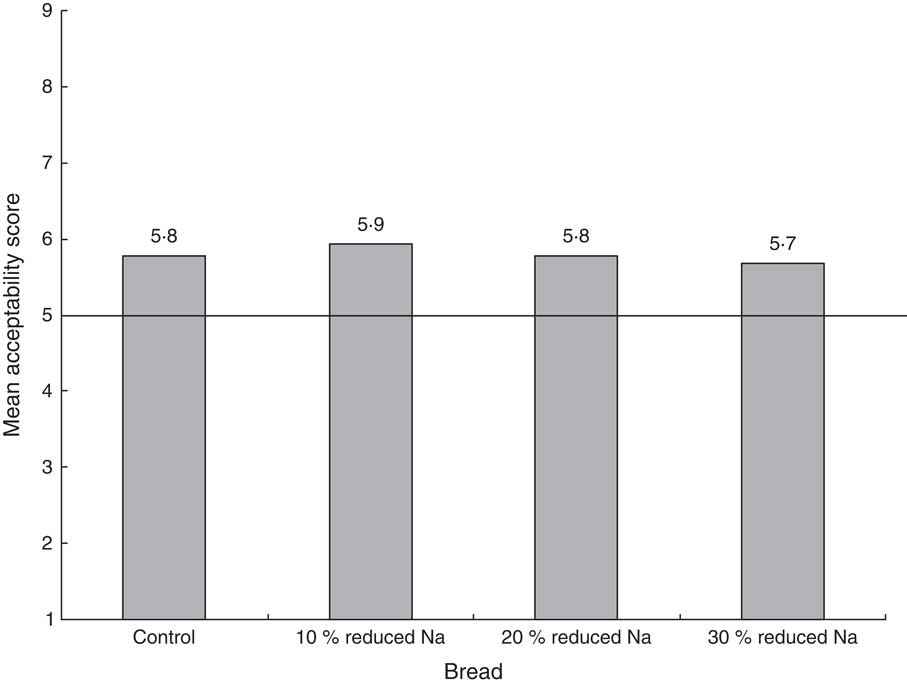
Demographics of acceptability testing participants are provided in Table 1. Mean scores for bread sensory characteristics are provided in Table 2 and mean scores for overall liking are presented in Fig 1. Consumer acceptability scores for overall liking, appearance, aroma, flavour, sweetness, salt level and texture were not significantly different across the four bread types (P>0·05).
Mean acceptability scores for overall liking of bread with typical sodium content (control) and breads given a 10 %, 20 % and 30 % sodium reduction among consumers (n 109) in Oregon, USA, 2013. Acceptability was measured using a nine-point hedonic scale where 1 = ‘dislike extremely’ and 9 = ‘like extremely’; the horizontal line (———) represents an acceptability score of ‘neither like nor dislike’. A mean acceptability score above this line indicates that consumers, on average, liked the bread product
Mean acceptability scores for sensory characteristics and purchase intent of bread samples among consumers (n 109) in Oregon, USA, 2013

Acceptability of sensory characteristics was rated on nine-point hedonic scale ranging from 1 = ‘dislike extremely’ to 9 = ‘like extremely’. Purchase intent was measured using a five-point purchase intent scale ranging from 1 = ‘definitely buy’ and 5 = ‘definitely not buy’.
aBread samples with the same superscript letter indicate no difference in multiple comparisons by ANOVA.
Purchase intent
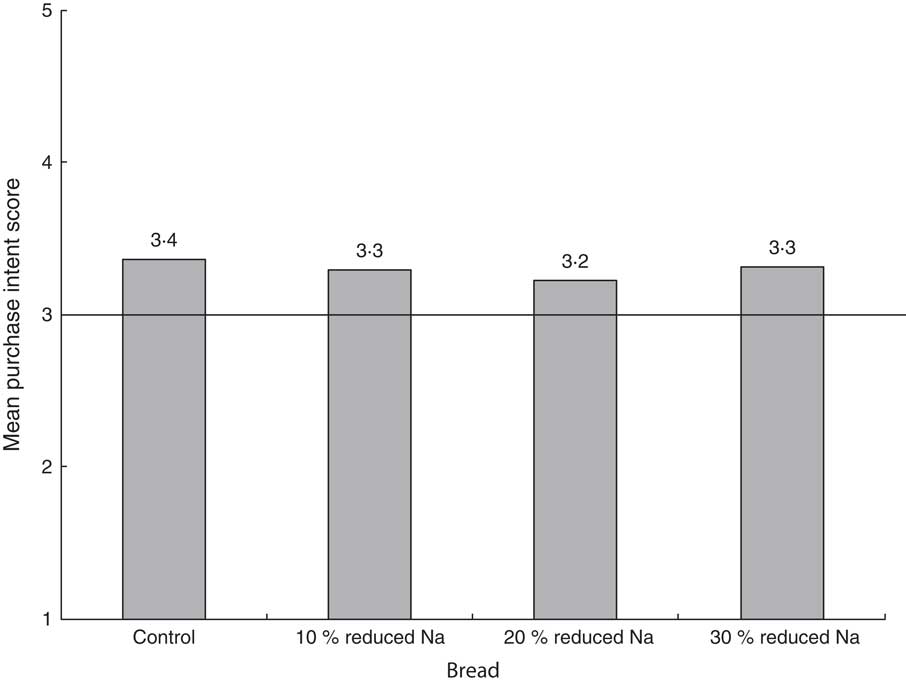
Mean scores for purchase intent are presented in Table 2 and Fig. 2. Consumer purchase intent scores were not significantly different across the four bread types (P>0·05).
Mean purchase intent scores of bread with typical sodium content (control) and breads given a 10 %, 20 % and 30 % sodium reduction among consumers (n 109) in Oegon, USA, 2013. Purchase intent was measured using a five-point purchase intent scale where 1 = ‘would definitely not buy’ and 5 = ‘would definitely buy’; the horizontal line (———) represents a purchase intent score of ‘might or might not buy’. A mean purchase intent score above this line indicates that consumers, on average, would buy the bread product
Discussion
To our knowledge, the present study is the first one in the USA to assess the feasibility of reducing Na in bread products while maintaining consumer acceptability and purchase intent. We found that a 10 % reduction in Na in bread was not detected by consumers and while consumers could detect 20 % and 30 % reductions, those reductions were not associated with decreases in consumer acceptability of sensory characteristics or purchase intent of the product.
These results align with the Institute of Medicine’s Strategies to Reduce Sodium Intake in the United States that recommends to ‘slowly, over time, reduce the sodium content of the food supply in a way that goes unnoticed by most consumers as individuals’ taste sensors adjust to the lower levels of sodium’( 11 ). These results also suggest that bread producers could lower the Na content in their products by as much as 30 % without putting themselves at a competitive disadvantage in the marketplace and without losing the sensory qualities of their products on which their brand identity is based.
The findings from the present research can be coupled with Na-specific nutrition standards for government food procurement (e.g. school meals, correction facilities) to influence the production of lower-Na bread products. For example, the nutrition standards in the NSLP have the potential to influence what products are available from the food industry as a whole. The present study tested reduced-Na 50 % whole-wheat bread rather than white bread, because it meets the whole grain-rich criteria for the NSLP( 23 ). It will be difficult for schools to comply with NSLP Na requirements without procuring reduced-Na bread. The final target for the NSLP Na standard is a 53 % reduction from current levels( 23 ). All three bread samples tested (10 %, 20 % and 30 % reduced Na) would aid manufacturers in meeting the requirement for lower-Na bread products in schools. Bread producers can capitalize on the regulatory requirements of large bread purchasers, like NSLP, to increase their consumer base and profits while decreasing the Na content of their products. Food procurement standards create a more nutritious food environment and drive demand for increased availability of lower-Na products.
With support from the bread industry, successive small reductions could be made without any noticeable effect on taste and lead to significant reductions in population salt intake. Proactive Na reductions may also help companies stay ahead of future regulatory mandates. These reductions could be one of the most cost-effective ways to reduce CVD and improve public health( 11 , Reference Coxson, Cook and Joffres 14 , Reference Palar and Sturm 15 , Reference Asaria, Chisholm and Mathers 24 , Reference Murray, Lauer and Hutubessy 25 ).
The present study has several limitations. The sample size of consumer participants was small. However, sample size calculations were performed to ensure power to detect differences at the 0·05 level of significance. The study did not consider the effects of reducing Na on shelf-life or perishability, which will be an important consideration for bread producers. The study was conducted among a population that is primarily white, non-Latino, so the results may not be generalized to populations that are more racially and ethnically diverse. Finally, the study was conducted exclusively among adults, so it is difficult to extrapolate results to the school-age population. Future difference and acceptability testing among the school-age population is warranted, as the results would inform the integration of reduced-Na bread products into the NSLP.
Conclusion
The results of the present study indicate that reductions of up to 10 % in the salt content of 50 % whole-wheat bread are not detectable to consumers and reductions of up to 30 %, while detectable, did not adversely affect consumers’ perceptions of flavour and texture, nor did they adversely affect consumer purchase intent. These results bolster the feasibility of local and national bread producers gradually reducing the Na content in their products. These results also indicate that it is possible to thoughtfully establish progressive Na targets for reformulating bread products without harming bread producers’ consumer bases and profits.
Acknowledgements
Acknowledgements: The authors thank Karen Girard, Bruce Gutelius and Katrina Hedberg of the Oregon Health Authority for their critical review of this manuscript. Financial support: This study was funded in part by Centers for Disease Control and Prevention (CDC) Heart Disease and Stroke Prevention Program (grant number DP07-70403CONT09). The publication does not necessarily represent the decisions or stated policy of CDC and the designations employed and the presentation of the material do not imply the expression of any opinion on the part of CDC. CDC had no role in the design, analysis, or writing of this article. Conflict of interest: None. Authorship: K.W.L.C., S.C.F., A.E.C., C.A.D., M.T.M., D.K.D. and M.A.K. conceived the study aims and design. S.C.F. and K.W.L.C. contributed to the systematic review. A.E.C. facilitated the data collection and A.E.C., S.C.F. and C.A.D. performed the analysis and interpreted the results. K.W.L.C. and S.C.F. drafted the manuscript. A.E.C., M.T.M., D.K.D. and M.A.K. reviewed the manuscript. Each author has seen and approved the contents of the manuscript. Ethics of human subject participation: Ethical approval not required.


