
Working-class citizens – people employed in manual labor, service industry, clerical, informal sector, and labor union jobs – rarely go on to hold elected office in the world’s democracies. Whereas workers typically make up majorities of most countries’ labor markets,Footnote 1 people who had working-class jobs when they got into politics rarely go on to hold more than 5 percent of the seats in most national legislatures (e.g., Best Reference Best2007; Best and Cotta Reference Best and Cotta2000; Carnes and Lupu Reference Carnes and Lupu2015; Reference Carnes and Lupu2023b; Joshi Reference Joshi2015; Warburton et al. Reference Warburton, Muhtadi, Aspinall and Fossati2021).
These kinds of inequalities in the social class makeup of governments can have important consequences for public policy.Footnote 2 Politicians from the working class – like working-class citizens in most democracies – are more likely than other legislators to have proworker or leftist views about economic issues, preferring state intervention into the economy and a robust social safety net, and they tend to behave accordingly in office, at least to the extent that they have some personal discretion in their official decisions. These differences in politicians’ attitudes and choices – coupled with the sharp numerical underrepresentation of leaders from the working class – seem to tilt policy outcomes in favor of the more rightist preferences of white-collar professionals on economic issues (Alexiadou Reference Alexiadou2020; Borwein Reference Borwein2021; Carnes Reference Carnes2013; Reference Carnes2018; Carnes and Lupu Reference Carnes and Lupu2015; Curto-Grau and Gallego, this volume; Hemingway Reference Hemingway2020, Reference Hemingway2022; O’Grady Reference O’Grady2019).Footnote 3 This may help to explain why rising inequality in recent decades has not been met with the kind of compensatory redistribution that canonical theories might expect (see Lupu and Pontusson, this volume).Footnote 4
Why, then, are working-class citizens so sharply underrepresented in the world’s legislatures? If holding public office can have significant consequences for public policy, it is natural to wonder: What keeps workers out office?
As it stands, no one really knows. Some studies have tested hypotheses that might shed light on why so few working-class citizens go on to hold office in the world’s democracies. Most have been inconclusive; they have yielded null results, or the associations they have uncovered have stopped far short of accounting for the vast underrepresentation of workers. Moreover, all of the existing studies that might help explain why workers are so badly underrepresented have focused either on small numbers of countries (e.g., Carnes and Lupu Reference Carnes and Lupu2016a; Hemingway Reference Hemingway2020; Joshi Reference Joshi2015; Vivyan et al. Reference Vivyan, Wagner, Glinitzer and Eberl2020) or on just one country at a time (e.g., Carnes Reference Carnes2018; Dal Bó et al. Reference Dal Bó, Finan, Folke, Persson and Rickne2017; Griffin, Newman, and Buhr Reference Griffin, Newman and Buhr2019; Matthews and Kerevel Reference Matthews and Kerevel2022; Wüest and Pontusson Reference Wüest and Pontusson2018).
The time seems right for broader cross-national research that explores why so few working-class people go on to hold public office. In that spirit, this chapter takes stock of what scholars know about the causes of working-class officeholding and uses new data on the social class backgrounds of national legislators in the OECD to present initial analyses of several common country-level explanations that have never been tested before using data from a large sample of countries.
Our findings suggest that some hypotheses have promise and warrant future research: working-class people more often hold office in countries where labor unions are stronger and income is distributed more equally. However, some common explanations do not pan out in our data – neither Left-party strength nor proportional representation are associated with working-class officeholding. Moreover, the various country-level explanations that scholars have put forward in the past do not take us very far toward a complete explanation of the phenomenon of working-class underrepresentation; they account for at most 30 percent of the gap between the share of workers in the public and in national legislatures.
Future research would do well, we think, to explore some country-level explanations in more detail, but there may also be limits to what we can learn from country-level analyses. If scholars wish to understand why working-class people so rarely go on to hold office in the world’s democracies, it may be helpful to focus comparative analyses on individual- and party-level explanations as well, and to consider the possibility that there are factors common to all democracies that limit working-class officeholding.
Unequal Officeholding and the Working Class
Research on the numerical underrepresentation of any social group generally tries to answer two questions: when are members of the group screened out of the candidate selection process at disproportionately high rates, and why are they screened out at those stages?
The question of when is the more straightforward of the two, since it is essentially a descriptive question. Broadly speaking, the candidate selection process can be thought of as a series of semidiscrete stages (see e.g., Carnes Reference Carnes2018; Fox and Lawless Reference Fox and Lawless2005; Lovenduski Reference Lovenduski2016; Norris and Lovenduski Reference Norris and Lovenduski1995): (1) a person must have the qualifications and abilities that allow someone to run (i.e., they must be what scholars sometimes refer to as potential candidates); (2) they must have some intrinsic desire to run or hold office (what scholars call nascent political ambition); (3) they must formally declare their candidacy (expressive ambition); (4) in many countries, their party must select them and decide how strongly to support them; and, finally, (5) they must win enough votes to take office. Scholars differ in how granular their accounts of this process are, but at bottom, to determine when a social group is screened out, researchers simply divide the candidate entry process into stages and then measure the group’s representation at each stage in order to determine when, exactly, that group is disproportionately removed from the process of political selection.
The question of why social groups are screened out is more complicated. We can generally divide scholars’ hypotheses into three categories based on the kinds of political phenomena they study: micro- or individual-level explanations, macro- or polity-level explanations, and meso-level explanations.Footnote 5
Individual- or micro-level explanations posit that groups are screened out because of the attitudes and choices of individual citizens, usually potential candidates or voters. This research aims to understand the most immediate reasons why members of a given social group are less interested in running, less capable campaigners, less likely to win votes, and so on. Most scholarship in this category focuses either on the characteristics of potential or actual candidates (Why are qualified women in the United States less interested in running for office? Are attorneys more likely to run because they are better at fundraising?)Footnote 6 or on the characteristics and motivations of voters (Do voters see working-class candidates as more relatable?). In either case, the focus is on the attitudes or choices of ordinary citizens and the immediate antecedents to those choices.
Of course, scholars recognize that individual choices and attitudes are driven by larger macro-level forces like political institutions or economic and social conditions. Researchers who carry out macro-level studies attempt to determine whether there are features of entire cities, states, or nations that might help explain the shortage of candidates or officeholders from a given social group. The most common explanations focus on things like election rules, unionization rates, and economic conditions; studies in this category often begin by simply examining whether the numerical representation of a social group is associated with the aggregate-level characteristics of entire polities. Whereas an individual-level study will usually focus on one discrete stage of the candidate entry process, macro-level research often focuses broadly on whether the characteristics of a country or state is associated with the rate at which a social group holds office, or perhaps the rate at which members of that social group run.
Some explanations are positioned in between the polity and the individual; the most common of these meso-level explanations focus on political parties, hypothesizing that party rules or platforms or the attitudes and behaviors of the leaders of formal party organizations help explain the shortage of a social group in the candidate pipeline (e.g., Norris and Lovenduski Reference Norris and Lovenduski1995; Thomsen Reference Thomsen2017). Of course, the importance of parties in the candidate entry process varies from country to country, but parties are at least influential – if not the exclusive drivers of – the candidate entry process in virtually every democracy. As such, when many scholars seek to understand why a given social group is underrepresented, they focus on the biases and behaviors of political parties and other large, stable organizations within countries.
These different levels of explanation are not mutually exclusive, of course, or inherently in tension with one another. To the contrary, they are often complementary, differing more in terms of where in the theorized causal process they focus (e.g., individual choices, or the groups and institutions that structure those choices). In any given country, theories at all three levels might be useful: people from a given social group might be reluctant to run because they worry that they will not receive needed support (an individual-level explanation) because party leaders so rarely recruit or support them, fearing that they will make worse candidates (a meso-level explanation), which in turn happens because fundraising is so important in elections in that country (a macro-level explanation). In most democracies, we would expect the underrepresentation of a social group to be linked to processes that occur at all three levels. When studying the reasons why a social group is numerically underrepresented in public office, all three levels of analysis can help illuminate the obstacles the group faces.
These frameworks for thinking about when and why a social group is screened out of the political selection process can be used to study any social group in any country. To date, however, there are few studies that use these approaches to shed light on why so few working-class citizens go on to hold office in the world’s democracies. Some of the gaps in the literature are simply geographic: there are roughly 120 electoral democracies in the world, but to date, research on working-class officeholding has only been conducted in around twenty of them. More broadly – and more pressing – there simply are not many studies in this literature in the first place.
On the question of when workers are screened out, most existing studies focus on a single country or a single stage of the political selection process. They usually find no evidence that working-class citizens are screened out because of differences in qualifications or nascent ambition: workers seem just as likely as nonworkers to have characteristics that make them attractive potential candidates (Carnes Reference Carnes2016; Reference Carnes2018), and they appear to be just as interested as nonworkers in running for office (Carnes and Lupu Reference Carnes and Lupu2023a). Numerous studies have also looked at whether working-class candidates perform worse than nonworkers in elections. While some find evidence that workers perform worse (Matthews and Kerevel Reference Matthews and Kerevel2022; Wüest and Pontusson Reference Wüest and Pontusson2018), others find that they perform about as well as – and sometimes better than – nonworkers (Albaugh Reference Albaugh2020; Campbell and Cowley Reference Campbell and Cowley2014; Carnes Reference Carnes2018; Carnes and Lupu Reference Carnes and Lupu2016b; Griffin, Newman, and Buhr Reference Griffin, Newman and Buhr2019; Kevins Reference Kevins2021; Hemingway Reference Hemingway2020; Sadin Reference Sadin2012; Vivyan et al. Reference Vivyan, Wagner, Glinitzer and Eberl2020).Footnote 7 Related studies also find that working-class candidates are often evaluated more positively (Carnes and Lupu Reference Carnes and Lupu2016a; Hoyt and DeShields Reference Hoyt and DeShields2021), especially by working-class voters (Heath Reference Heath2015).
Even if some of the explanation has to do with the election stage, workers seem to be mostly screened out of the candidate entry pipeline at the decision to formally run or apply to run. In England, Norris and Lovenduski (Reference Norris and Lovenduski1995, 121) find that nonprofessionals (a close approximation to working-class people) were less likely to apply to be candidates for the House of Commons (but no less likely to be selected by the party), and in the United States, Carnes (Reference Carnes2018) finds that in state and local elections, working-class people made up over half of the labor force, but less than 5 percent of the people who actually ran for state, county, and local offices (and 3 to 5 percent of the people who won).
Although this body of “when” research points generally to one stage in the candidate pipeline (expressive ambition), there are still many gaps in this literature. So far, the work has been piecemeal, focusing on just one country and just one stage at a time. To our knowledge, no study has ever comprehensively analyzed the candidate pipeline from start to finish in a single country; that is, no study has analyzed a single sample of citizens to check for social class gaps in qualifications, nascent ambition, expressive ambition, party selection, and winning, all in a single, directly comparable group of people. Moreover, almost every published study has focused on just one country; we know of just three that have studied more (Carnes and Lupu Reference Carnes and Lupu2016a; Hemingway Reference Hemingway2020; Kelly Reference Kelly, Morgan, Witko and Enns2019). There is still a great deal of room for research that asks the basic descriptive question of when working-class people are screened out of the political selection process.
The research on when workers are screened out is still emerging, so naturally, research on why they are screened out is scarce and piecemeal as well. We know of just two studies that present positive evidence to support an individual-level explanation about resource constraints (Carnes Reference Carnes2018; Hemingway Reference Hemingway2020) and just a few that test party-level explanations (Carnes Reference Carnes2016; Reference Carnes2018; Hemingway Reference Hemingway2020; Norris and Lovenduski Reference Norris and Lovenduski1995). Some studies note that certain types of parties appear more likely to recruit working-class candidates (Best and Cotta Reference Best and Cotta2000; Joshi Reference Joshi2015; Matthews and Kerevel Reference Matthews and Kerevel2022; Tarditi and Vittori Reference Tarditi and Vittori2021). In particular, leftist parties typically have less affluent core constituencies (Garrett Reference Garrett1998; Huber and Stephens Reference Huber and Stephens2001; Korpi and Palme Reference Korpi and Palme2003), so their voters may prefer working-class candidates, or these parties may be more likely to recruit workers as candidates.
The most common explanations focus on the macro level, highlighting four key factors. One such factor is the strength of labor unions (Carnes Reference Carnes2016; Feigenbaum, Hertel-Fernandez, and Williamson Reference Feigenbaum, Hertel-Fernandez and Williamson2018; Hemingway Reference Hemingway2020; Sojourner Reference Sojourner2013). Where unions are strong, they may have formal arrangements with certain political parties that make it more likely that workers will get on the ballot (Aylott Reference Aylott2003; Høyer Reference Høyer2015; Norris and Lovenduski Reference Norris and Lovenduski1995). Alternatively, since unions often mobilize votes for leftist parties (e.g., Korpi Reference Korpi1983), they may simply help workers already on leftist party lists get elected just by increasing the vote share of leftist parties.
Another macro explanation has to do with features of the electoral system (Carnes Reference Carnes2018; Hemingway Reference Hemingway2020; Joshi Reference Joshi2015). For instance, proportional representation (PR) systems are often thought to ensure that a larger proportion of the electorate is represented (e.g., McDonald and Budge Reference McDonald and Budge2005), promoting a closer connection between voters and representatives (Bernauer et al. Reference Bernauer, Giger and Rosset2015). And PR is also associated with better descriptive representation for other social groups (e.g., Kittilson and Schwindt-Bayer Reference Kittilson and Schwindt-Bayer2010; Schwindt-Bayer and Mishler Reference Schwindt-Bayer and Mishler2005).
Campaign costs, which vary tremendously across countries, are routinely cited by scholars of US politics as obstacles to working-class candidacy and officeholding (Carnes Reference Carnes2018). Finally, places where economic resources are distributed unequally may give more affluent citizens disproportionate political influence (Erikson Reference Erikson2015; Rosset et al. Reference Rosset, Giger and Bernauer2013).
To date, however, most studies of macro explanations focus on just one country or, at best, a handful (see Best and Cotta Reference Best and Cotta2000; Hemingway Reference Hemingway2020), making it hard to draw general inferences about the global phenomenon of working-class underrepresentation. The time seems right, then, for scholars interested in the shortage of working-class politicians to expand their focus to a broader range of democracies and to delve more deeply into the questions of both when and why working-class people are screened out of the political selection process. There is still a lot of ground to cover here.
As a step in that direction, in this chapter, we ask how working-class officeholding varies with four types of macro-level forces that have been cited by scholars in the past as possible drivers of working-class underrepresentation: the strength of Left parties, electoral rules (proportional vs. majoritarian), the costs associated with campaigning (the availability of public financing), and labor market conditions (economic inequality and unionization rates). Using a new dataset, we study the thirty-seven OECD member nations, the largest sample of countries in which these macro-level explanations have been analyzed.
What can we learn from a large cross-national analysis of working-class representation? Can macro-level characteristics like these help explain why so few working-class people hold office in the world’s democracies?
Working-Class Officeholding in the OECD
To find out, we collected an original dataset with a team of collaborators (Carnes et al. Reference Carnes, Golden, Lupu, Nazrullaeva and Wolton2021). This dataset includes individual-level information about the last occupation held by each member of the unitary or lower chamber of the national legislature in each of the world’s 103 large electoral democraciesFootnote 8 during one legislative session between 2016 and 2018 – a total of over 20,000 individual legislators.
Like past research on politicians (e.g., Carnes and Lupu Reference Carnes and Lupu2015; O’Grady 2018) and social class analysis more generally (see Oesch Reference Oesch2013), we focus here on occupations as our measure of social class. Occupational information about politicians is universally observable (unlike income and wealth data), even if the data are not always easy to collect. Moreover, alternative measures like income can vary over a person’s life cycle (a construction worker and a PhD student might earn similar annual incomes but belong to very different social classes) and education often does not determine labor market outcomes (e.g., Bill Gates does not have a college degree). And although politicians often discuss their parents’ occupations, research on parental occupations is mixed at best; studies of lawmakers find that parental occupations are not associated with legislative conduct (e.g., Carnes Reference Carnes2013; Carnes and Lupu Reference Carnes and Lupu2015) or only associated under certain conditions (e.g., Grumbach Reference Grumbach2015; Pilotti Reference Pilotti2015), and studies of ordinary citizens find that for people with similar adult social classes, there is little evidence of a link between the social class of their parents and their adult political views (Barber Reference Barber1970; Langton Reference Langton1969). As Manza and Brooks (Reference Manza, Brooks, Lareau and Conley2008, 204) explain:
Occupation provides the most plausible basis for thinking about how specifically class-related political micro processes and influences occur…. Workplace settings provide the possibility of talking about politics and forging political identity, and work also provides a springboard for membership in organizations where class politics are engaged: unions, professionals associations, business associations, and so forth.
As such, we focus here on lawmakers who had working-class occupations as adults.Footnote 9
We focus in this chapter on data on the occupational backgrounds of legislators in the thirty-seven OECD member countries. With these data, we can carry out simple tests of several hypotheses about the factors that discourage working-class officeholding using new, accurate, aggregate-level data on national legislatures (which to our knowledge did not previously exist; we know of no prior database that includes complete information about the share of working-class lawmakers in the national legislatures of a large number of democracies).Footnote 10
Figure 8.1 plots the rates at which working-class people held office in these thirty-seven countries. For each country, we plot the percentage of lawmakers who were primarily employed in working-class occupations when they were first elected to public office (darker bars) and the percentage of the country’s labor force made up of working-class jobs (lighter bars). We define the working class as people who work in manual labor, service industry, clerical, and informal sector jobs, and people who work for unions that represent these kinds of occupations.Footnote 11
Working-class representation in the OECD
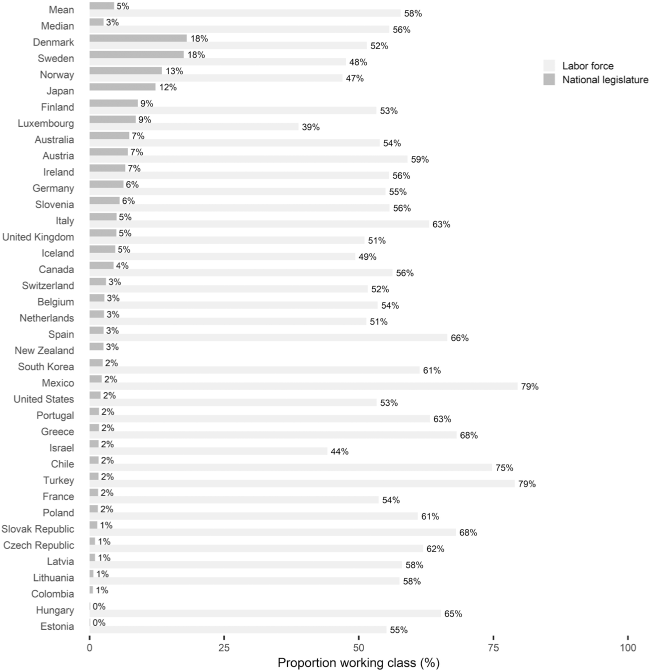
As the figure illustrates, working-class citizens are vastly numerically underrepresented in OECD legislatures. In the average country, working-class jobs make up 56 to 58 percent of the labor force, but former workers make up just 3 to 5 percent of the national legislature, a 53-percentage-point gap in the absolute numerical representation of working-class people in elected institutions.Footnote 12 The size of the disparity varies from country to country, of course; it is smallest in Luxembourg, a country that reports below-average rates of working-class jobs in its labor force (due to its exceptionally high rates of employment in white-collar or professional occupations, in particular banking). But even in this best-case scenario of sorts, working-class citizens still make up around four out of every ten employed citizens but just one out of every ten elected legislators, and nonworkers – who we refer to as professionals or white-collar citizens – still make up 90 percent of the legislature, only a little less than what they make up in the average OECD country.
As other studies have argued, the shortage of working-class politicians seems to be essentially orthogonal to the well-documented underrepresentation of women in public office (see also Carnes Reference Carnes2015; Reference Carnes2020). In the individual-level OECD data summarized in Figure 8.1, 4.4 percent of male legislators and 4.9 percent of female legislators came from working-class jobs. If we focus only on the legislators who had working-class occupations, 29.7 percent were women; among nonworkers, 27.2 percent were women. Unfortunately, at this time, we cannot check for racial or ethnic balances with these data.
Does the variation across OECD countries seem to track major macro-level characteristics of countries like Left-party strength, electoral systems, campaign costs, economic inequality, or unionization rates? Do traits like these have the potential to help us understand why so few working-class people hold office in most electoral democracies?
Macro-Level Explanations
Left-Party Strength
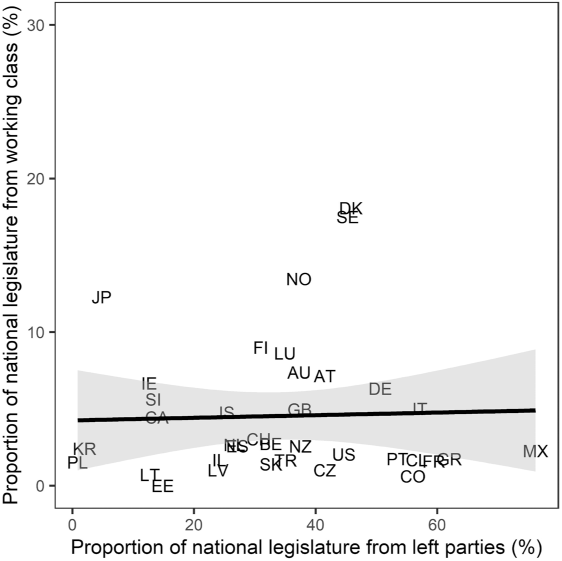
Figure 8.2 begins to answer these questions by plotting the representation of working-class people in OECD legislatures (vertical axis) against the rate at which Left partiesFootnote 13 hold office in the same national legislatures (horizontal axis). There is no relationship: workers are no more or less likely to hold office in countries with more Left-leaning national legislatures.
Left-party representation and worker representation
Some patterns seem evident, however, in more fine-grained data on the types of Left and Right parties in OECD countries. Among the three leftist party families identified by the Comparative Manifestos Project (ecological, left, and social democratic), the proportion of working-class legislators was 4.3 percent, 6.5 percent, and 6.6 percent, respectively; for the rightist parties, it was 1.7 percent (liberal), 4.3 percent (Christian democratic), 3.1 percent (conservative), 8.1 percent (nationalist), and 4.7 percent (agrarian). In the OECD countries, there is no broad or narrow category of political party in which a large percentage of legislators are drawn from working-class occupations, but the variations here also seem to square with basic intuitions about party families. Left and social democratic party legislators – those from the traditional party families associated with the working classes – are two percentage points more likely to be from working-class occupations than green party legislators, which tend to represent more affluent constituencies. Among the rightist parties, legislators from nationalist parties (many relative political newcomers) are four percentage points more likely to come from working-class occupations, and legislators from liberal parties (the traditional parties of business and capitalism) are three percentage points less likely than others to come from working-class occupations. The differences are modest, but there seems to be a basic logic to the distribution of working-class politicians across party families. These differences do not align with a simple expectation that Left parties will tend to have more working-class politicians, but they suggest that certain party families may be associated with more working-class representation.
Of course, the differences are only marginal; in the OECD countries, the gap between the party families with the most and least working-class legislators in just six percentage points, far smaller than the overall shortage of workers (roughly 53 percentage points). Something beyond simple differences in the party makeup of national legislatures is driving the shortage of working-class legislators.
Electoral Systems
What about electoral systems? Proportional representation systems tend to be associated with greater representation for groups like women and racial or ethnic minorities, and scholars often speculate that PR systems may be more accessible to candidates from the working classes. Pilotti’s (Reference Pilotti2015, 247, emphasis added) research on Sweden found hopeful evidence that “the ratio of elected representatives from working-class families increased after the introduction of PR: less than 10% before the constitutional change to about 15–17% after the reform and until the 1970s–1980s” (see also Joshi Reference Joshi2015). Are legislators who had working-class occupations themselves better represented in proportional representation systems in the OECD?
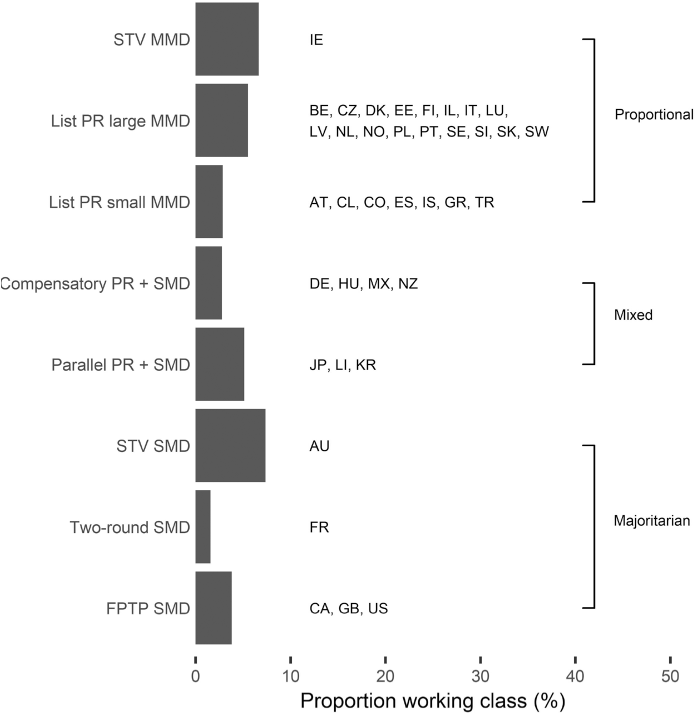
Figure 8.3 plots the average representation of working-class people, disaggregating OECD countries by the broad category of electoral system they use (proportional, majoritarian, or mixed) and the narrower electoral rules listed in the V-Dem dataset (Coppedge et al. Reference Coppedge, Gerring, Henrik Knutsen, Lindberg, Teorell, Altman, Bernhard, Cornell, Fish, Gastaldi, Gjerløw, Glynn, Hicken, Lührmann, Maerz, Marquardt, McMann, Mechkova, Paxton, Pemstein, von Römer, Seim, Sigman, Skaaning, Staton, Sundtröm, Tzelgov, Uberti, Wang, Wig and Ziblatt2021).Footnote 14 In contrast to research on the representation of other social groups in proportional representation systems, there is no evidence that PR systems tend to have more working-class politicians in their national legislatures (and none of the differences documented in Figure 8.3 are statistically significant). We do not find evidence that the ratio of elected representatives from working-class occupations is higher or lower in proportional or mixed systems relative to countries with majoritarian elections. (Figure 8.A2 in the online appendix reports similar analyses comparing countries by district magnitude and the number of seats in the national legislature.) As far as we can tell, there is nothing about the broad form of national electoral systems that helps account for why so few working-class people hold office in the OECD.
Worker representation, by electoral system
Public Financing
Public financing, in contrast, is at least weakly associated with working-class officeholding. Figure 8.4 plots our original data on the occupational backgrounds of elected leaders in the OECD against V-Dem’s measure of public financing liberalism.Footnote 15 In countries where public financing funds a large share of most parties’ expenditures (closer to a 4 on the underlying scale), workers hold office slightly more often, although the difference is not statistically significant (p < 0.06).
Public financing predicts modest differences in worker representation
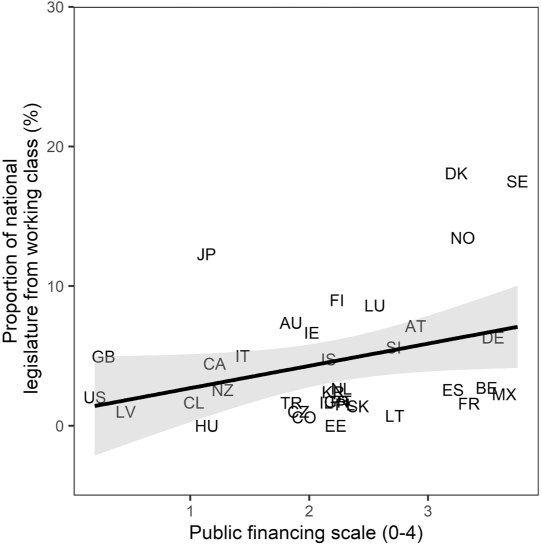
Like the differences between the party families with the most and fewest working-class members, the differences between countries with the most and least generous campaign finance systems are modest. Extrapolating from the data in Figure 8.4, workers make up close to 0 percent of the average national legislature in a country with no public financing but only about 6 percent of the national legislature in the average country with the most generous public financing system, still almost 50 percentage points short of a complete explanation for the shortage of working-class politicians in the world’s democracies. That is, the campaign finance landscape seems to explain (at most) only a marginal difference in working-class officeholding – far less than a complete explanation for why so few working-class citizens go on to hold office.
Economic Environment
Of the four kinds of macro-level characteristics we examined, the economic characteristics of countries were by far the most strongly associated with working-class officeholding. In Figure 8.5, we focus on three important economic characteristics of the OECD member nations: GDP, economic inequality (measured here as the share of total posttax/transfer income earned by the lowest-income half of the country; results are similar with pretax income), and the country’s unionization rate. All three are statistically associated with working-class officeholding, and the differences are substantial: countries with higher GDPs, more egalitarian income distributions, and more heavily unionized labor forcesFootnote 16 do, in fact, have more working-class people in their national legislatures.
Economic characteristics of society matter on the margin
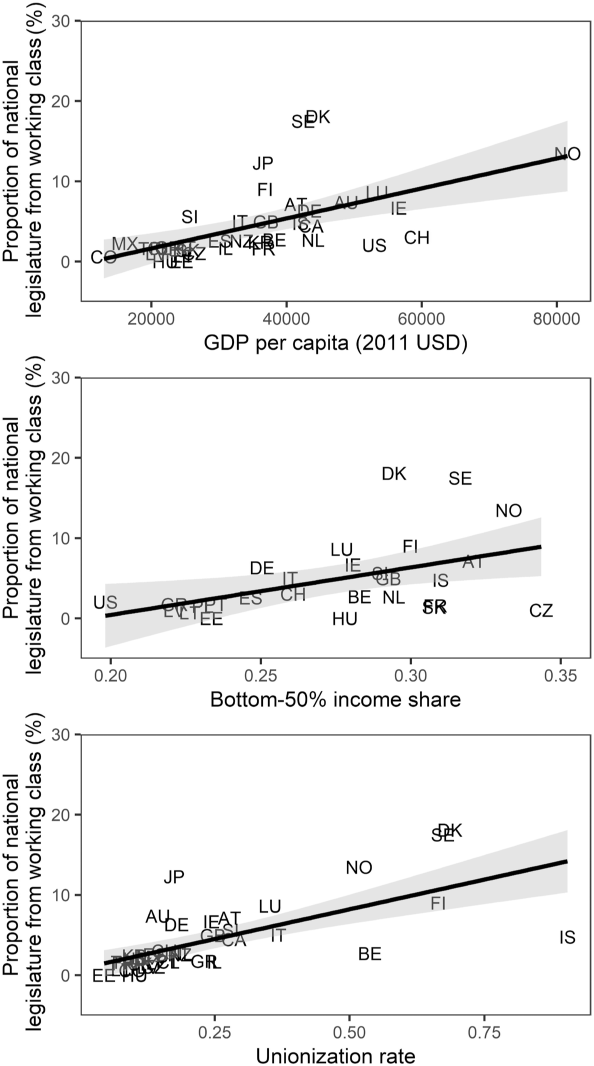
Of course, this kind of analysis – like all the preceding findings – cannot discern the nature of the causal relationships, and in this preliminary study we will not attempt to push the data further than simply documenting these bivariate relationships. It could be that the better economic fortunes of the working classes in these countries cause workers to go on to hold office at higher rates, or it could be that working-class officeholders encourage countries to adopt policies that promote shared prosperity, or both (or neither, if the associations are spurious).
Even if we assume that any of these economic characteristics truly cause working-class representation, these kinds of explanations seem to have the potential to take us only part way to an explanation for why so few workers go on to hold office. Increasing GDP from $20,000 to the maximum in this sample, $80,000, is associated with an increase of 10 percentage points, under one fifth of the total gap between working-class representation in the labor forces and national legislatures of these countries. As unionization rates approach 100 percent or bottom 50 percent income shares approach 50 percent, working-class representation is still projected to be below 20 percent. Even considered in tandem, these three economic variables do not take us far; they are all positively correlated, so if we regress the working class’s percentage in the national legislature on all three variables, then predict worker representation setting all variables at their theoretical or observed maximums (100 percent unionization, 50 percent income going to the bottom 50 percent, and $80,000 per capita GDP), the expected share of workers in the national legislature is just 20 percent. That is, together, these variables only seem to explain about 30 percent of the observed gap between workers and politicians, even when we make the heroic assumption that all three are true causes of working-class representation.
Of course, 30 percent is not trivial. These country-level explanations each warrant future research. But there is still far more to the story of why so few working-class people go on to hold office. Perhaps the country-level variables scholars have often discussed interact in important ways: perhaps proportional representation makes more of a difference in countries where elections are also inexpensive, or perhaps Left-party government matters more in states with strong labor unions. And maybe there are country-level variables we have yet to consider. Or, perhaps there are traits that are common across all modern democracies that discourage working-class officeholding.
Where Should We Go Next?
Our aim with this simple analysis was not to close the case on why so few working-class people hold office in the world’s democracies, but rather to open it in the first place. There has never been broad cross-national research on the question of why so few working-class people go on to hold elected office in the world’s democracies. Our analyses suggest that scholars could learn a great deal from comparative studies that analyze large samples of countries. There is meaningful variation across countries (see Figure 8.1) that differs in some promising ways (like the analysis of economic conditions in Figure 8.5) and also that does not differ much in ways that defy some ideas scholars have put forward about the factors that might be discouraging working-class people to hold office (like the analyses of Left-party strength, proportional representation, and public financing in Figures 8.2, 8.3, and 8.4). The simple first-cut analysis seems to suggest that some popular scholarly explanations may provide a partial explanation for why workers so rarely hold office (but only a partial one), while others may not ultimately be borne out in the data.
Where does this leave us? There is still a great deal that scholars need to learn about the basic question of when in the candidate pipeline working-class people are screened out in most democracies. In almost every democracy in the world, no one actually knows whether working-class citizens are less qualified, less interested in running for office, less likely to run, less likely to be chosen by parties, and/or less likely to win.
The results of this first cross-national analysis suggest, moreover, that scholarship on why so few working-class people hold office should continue exploring in more detail the country-level factors that discourage working-class officeholding. Here we have looked at just four kinds of variables – there are, of course, many more characteristics of countries that deserve our attention. The variables we studied here also beg for more detailed analyses to determine the extent to which the associations (and nonassociations) we document are causal and generalizable.
The fact that all OECD countries have large shortages of working-class officeholders also raises a possibility that transcends even country-level analyses, namely, that perhaps there are universal features of democracies that discourage working-class officeholding. In addition to individual-, meso-, and macro-level analyses, scholars should consider universal-level analyses. Understanding the traits common to democracies will almost certainly require more advanced methodologies than the simple cross-sectional comparisons that have been a staple of research on this topic in the past.
Another way forward might be to engage in cross-national analyses of meso-level forces, in particular the role of political parties and interest groups in facilitating or discouraging working-class representation. Figure 8.6 replots the country-level data on working-class officeholding from Figure 8.1. But now we compare the share of working-class lawmakers in each country’s national legislature (darker bars) and the share of working-class lawmakers in the political party with the highest rate of worker representation in each country’s national legislature (excluding parties with fewer than five delegates; lighter bars).
Worker representation varies more in parties than countries
Note: Bars report the share of working-class lawmakers in the national legislature (darker bars) and in the party with the highest rate of working-class officeholders (excluding parties with fewer than five members; lighter bars), along with the names of parties and the total numbers of legislators they elected.
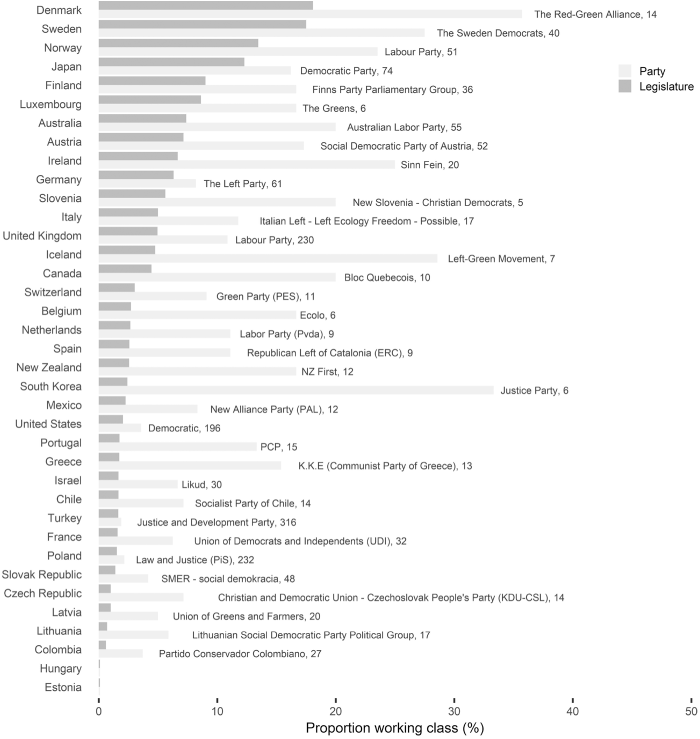
Viewed this way, it is easy to see that political parties are far more varied in how well-represented working-class citizens are than countries as a whole. These differences do not seem to track neatly onto existing left-right distinctions or party typologies, nor are they confined only to smaller parties. Something else is driving some parties to run large numbers of working-class politicians and others to sidestep workers in favor of white-collar candidates. Understanding these party-level gatekeeping processes – as scholars have sometimes done in individual countries (e.g., Norris and Lovenduski Reference Norris and Lovenduski1995) – should be a high priority.
Above all, the work must simply move forward. As Thomsen (Reference Thomsen2019, 576) recently put it, “It is rare for scholars to have such an open empirical terrain.” Every approach to studying working-class officeholding – descriptive work on when workers are screened out, and micro-, meso-, macro-, and universal-level research on why workers are screened out – is currently in short supply. The empirical terrain is indeed open, and it is high time for cross-national research to move forward.


 Open access