

Introduction
Snow on sea ice plays an integral role in the Arctic’s energy balance, owing to its influence on surface albedo, sensible- and latent-heat exchanges, and because of its considerable spatial and temporal variability. The significance of snow is particularly emphasized during the snowmelt period (Reference Groisman, Karl and KnightGroisman and others, 1994), when the surface albedo drops from values of >0.8 for dry snow-covered surfaces, to values of <0.3 for wet snow-covered surfaces (Reference Goodison, Greenstone and KingGoodison and others, 1999). The change in albedo from a highly reflective surface to a highly absorptive surface is expedited by the temperature-albedo feedback (Reference Curry, Schramm and EbertCurry and others, 1995), where an increase in air temperature enhances surface melt, reducing the spatial coverage of snow, decreasing albedo and in turn leading to greater absorbed energy and warmer air temperatures. Based partly upon this temperature-albedo feedback, general circulation models typically predict enhanced climate warming in the Arctic (e.g. Reference Maxwell, Watson, Zinyowera and MossMaxwell and others, 1998; Reference GatesGates and others, 1999), highlighting the need to better understand spatial and temporal variations in snowmelt.
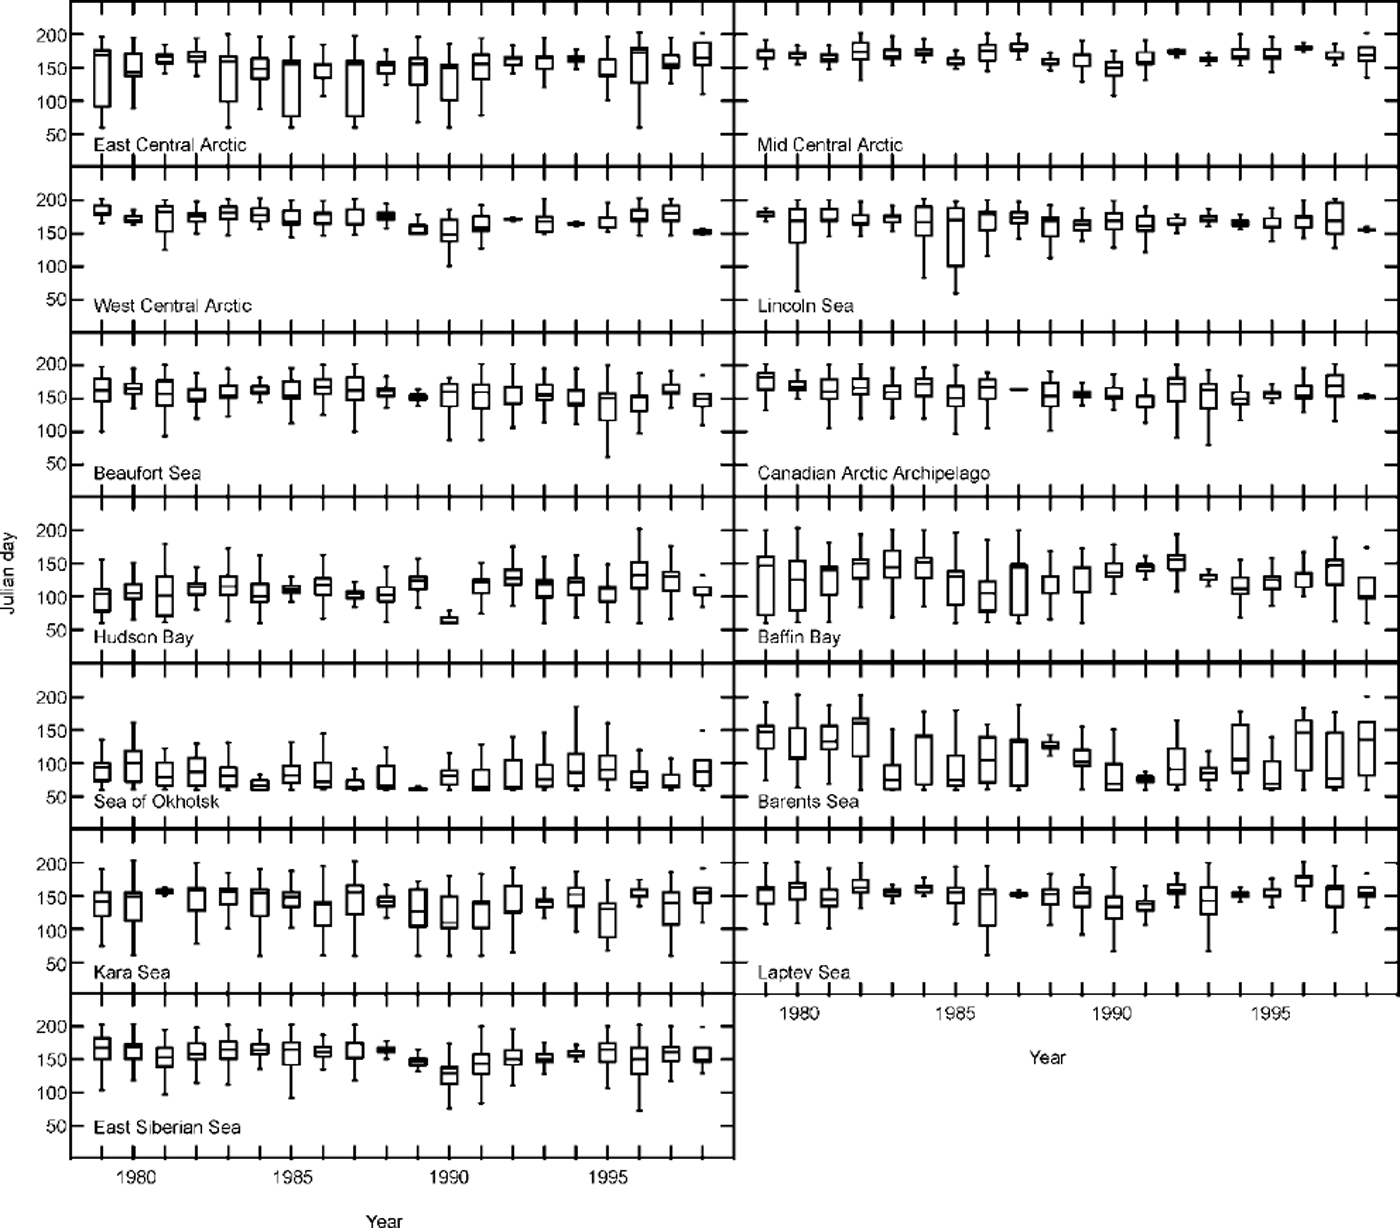
Observational studies of passive-microwave-derived snowmelt onset, defined as the point in time when brightness temperatures increase in response to liquid-water inclusions around snow grains, demonstrate that there is significant spatial and temporal variability (Reference Abdalati and SteffenAbdalati and Steffen, 1995; Reference Mote and AndersonMote and Anderson, 1995; Reference SmithSmith, 1998). A regional assessment (Fig. 1) of the spatial and temporal variability in snowmelt-onset dates from 1979 to 1998 (Reference Anderson and DrobotAnderson and Drobot, 2001) illustrates large variations in the timing of snowmelt onset between regions in a given year, and between years within a given region (Fig. 2). Reference Anderson and DrobotAnderson and Drobot (2001) hypothesize the snowmelt-onset variations are at least partly related to variations in atmospheric conditions. The objective of this paper is therefore to examine how atmospheric variations relate to snowmelt onset. The Arctic Oscillation (AO) is used to represent atmospheric variability, because other studies on atmosphere-sea-ice interactions (e.g. Reference Deser and TimlinDeser and others, 2000) note sea-ice variations are strongly associated with AO variations. The AO is defined as a see-saw between anomalously high and low pressure over the Arctic, and is considered the dominant mode of low-frequency atmospheric variability in the Northern Hemisphere (Reference Thompson and WallaceThompson and Wallace, 1998). Regression analyses are used to statistically associate monthly-averaged AO values with mean annual regional snowmelt-onset dates. In addition, a case-study in 1990 further defines the relationship between 500 hPa heights, 2 m air temperatures and snowmelt onset.
Regional study sites: 1. east central arctic; 2. mid central arctic; 3 west central arctic; 4. lincoln sea; 5. beaufort sea; 6. canadian arctic archipelago; 7. hudson bay; 8 baffin bay; 9. sea of okhotsk; 10. barents sea; 11. kara sea; 12. laptev sea; 13 east siberian sea.

Temporal variability in median annual melt-onset dates for each region.
Data
Snowmelt-onset dates are derived with 25 km2 daily-averaged brightness-temperature data from Scanning Multichannel Microwave Radiometer (SMMR) and Special Sensor Microwave/Imager (SSM/I) radiometers. An improved version of the Reference AndersonAnderson (1997) algorithm is used to compute snowmelt onset over first-year and multi-year sea-ice surfaces from 1979 to 1998. The new algorithm, termed the Advanced Horizontal Range algorithm (AHRA), monitors the difference between 18 GHz (SMMR) or 19 GHz (SMM/I) and 37 GHz horizontal brightness temperatures over a 20 day window. At the snowmelt-onset point, liquid-water inclusions form around snow grains, and the difference between 18 or 19 GHz minus 37 GHz horizontal brightness temperatures changes from being positive to near zero or negative. By monitoring the 20 day window for signs of a consistent change in the 18 or 19 GHz - 37 GHz brightness temperature, the occurrence and variability in snowmelt onset are monitored. Additional details on the AHRA are provided in a companion paper (Reference Anderson and DrobotAnderson and Drobot, 2001) as well as Reference DrobotDrobot (2000). Although the AHRA has been verified for use over first-year and multi-year sea-ice surfaces, anomalous snowmelt-onset dates, due to pixel averaging, sensor errors, polynyas, etc., may still be present in the snowmelt-onset dataset. In most cases, however, this should not affect the overall results.
The snowmelt dates are subsequently stratified into the same 13 regions as Reference Anderson and DrobotAnderson and Drobot (2001) in order to examine the regional associations between snowmelt onset and the AO. Note that the regions north of 80° N closely resemble regions developed by Reference SmithSmith (1998), but they are shifted 45° in this study from the work of Reference SmithSmith (1998) in order to keep snowmelt-onset dates in the Lincoln Sea in one region.
Atmospheric data consist of monthly-averaged AO values, 500 hPa heights and 2 m air temperatures, all derived from U.S. National Centers for Environmental Prediction/ National Center for Atmospheric Research (NCEP/NCAR) re-analysis data. The re-analysis data provide a consistent source for atmospheric data, because re-analysis data are based on a static data-assimilation scheme, quality control is superior to first-order stations, the data analysis is global in extent and more observations are used (Reference KalnayKalnay and others, 1996). The monthly-averaged AO values were acquired from the Joint Institute for the Study of Atmosphere and Ocean (JISAO) at the University of Washington, while the 500 hPa height and 2 m air-temperature data were collected from NC AR. Atmospheric data were analyzed only for the months February-June, since most snowmelt occurs during this period (Reference SmithSmith, 1998; Reference DrobotDrobot, 2000).
Methods
A two-step analytical approach is used to demonstrate AO snowmelt-onset relationships. Regression analyses between the monthly-averaged AO values and mean annual regional snowmelt-onset dates highlight statistical associations between the AO and snowmelt onset. While these statistical analyses are useful in determining regional relationships between the AO and snowmelt onset, the statistical associations cannot explain fully how the AO influences snowmelt onset. Synoptic atmospheric conditions are therefore examined during a pronounced positive AO phase to illustrate how atmospheric manifestations of the AO, namely, 500 hPa heights and 2 m air temperatures, influence snowmelt onset. To facilitate synoptic analysis, the atmospheric data are compared with snowmelt-onset anomalies extending into the middle of the following month. For example, atmospheric conditions in April are compared to the melt anomalies up to 15 May. The rationale for this approach is that the low-frequency features of the 500 hPa heights and 2 m air temperatures from one month blend into the beginning of the following month. Therefore, the atmospheric conditions in one month will influence snowmelt onset in the beginning of the next month.
Statistical Links Between the AO and Snowmelt Onset
An examination of monthly-averaged AO values (Table 1) demonstrates that annual and monthly variations in the strength and phase of the AO are common. In some years, such as 1990, a pronounced positive phase dominates from February through June, while in others, such as 1979 and 1980, a strong negative phase is present in all but one month. However, in most years a mixture of positive and negative phases typically exists.
Monthly averaged ao values, 1979−98

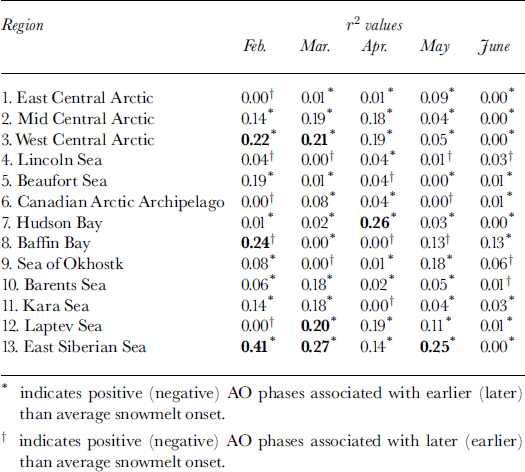
Since phase changes in the AO are linked to large atmospheric variations in near-surface air temperatures and sea-level pressure across the Arctic (Reference Thompson and WallaceThompson and Wallace, 1998), it is not surprising that monthly-averaged AO values (Table 1) are significantly related to mean annual snowmelt-onset dates in several regions (Table 2). Variations in February AO values explain a significant portion of the variations in mean annual snowmelt-onset dates in the West Central Arctic, Baffin Bay and East Siberian Sea. Variations in March AO values also explain a significant portion of the variations in mean annual snowmelt-onset dates in the West Central Arctic, Laptev Sea and East Siberian Sea. Variations in April AO values explain a significant portion of the variations in mean annual snowmelt-onset dates in Hudson Bay, while variations in May AO values explain a significant portion of the variations in mean annual snowmelt-onset dates in the East Siberian Sea. The significant relationships imply positive (negative) phases of the AO are associated with earlier (later) snowmelt onset in the West Central Arctic, Laptev Sea, East Siberian Sea and Hudson Bay, and later (earlier) snowmelt onset in Baffin Bay. These results are consistent with the findings of Reference Thompson and WallaceThompson and Wallace (1998), who noted positive AO phases were related to enhanced surface warming in western Russia and cooling in southern Greenland and Labrador. The regression analyses between February and March AO values and mean annual snowmelt-onset dates in the West Central Arctic also suggest there are lag relationships between the atmosphere and snowmelt onset, since snowmelt onset does not typically occur in the West Central Arctic until May or June (Reference Anderson and DrobotAnderson and Drobot, 2001). While this implies some sort of complex relationship between the atmosphere and snowmelt, it is likely that the reduction in significant associations in the latter months is actually due to increased variability in atmospheric conditions as the spring progresses. Serreze and others (1993) note shortwave synoptic activity in the Arctic increases in summer, and thus dominant low-frequency atmospheric patterns such as the AO become weaker. This would in turn make it more difficult to extract significant relationships between the AO and snowmelt onset in the latter months.
Per cent variation of mean annual snowmelt-onset dates that are explained by variations in monthly-averaged ao values. statistically significant relationships (a =0.05) are represented by bold text
Synoptic Analysis for 1990
To better understand why positive (negative) AO phases correspond with earlier (later) than average snowmelt onset in the West Central Arctic, Hudson Bay, Laptev Sea and East Siberian Sea, and later (earlier) than average snowmelt onset in Baffin Bay, snowmelt onset and atmospheric conditions are examined during the positive AO phase of 1990. Generally, snowmelt occurred earlier than average over most of the western Arctic in 1990, and later than average over the Beaufort Sea, the Canadian Arctic Archipelago and Baffin Bay (Fig. 3). The aerial coverage of snowmelt by mid-month was also greater in comparison to average melt conditions over much of the western Arctic. Greater aerial coverage of snowmelt is especially evident prior to 15 May in the East Siberian Sea, and also for snowmelt occurring prior to 15 June in the Arctic Ocean. Conversely, the aerial coverage of snowmelt by mid-month was diminished over the Beaufort Sea, the Canadian Arctic Archipelago and Baffin Bay, in comparison with average snowmelt conditions (Fig. 3).
Snowmelt anomalies in 1990 (left) compared with mean snowmelt coverage from 1979 to 1998 (right).

An examination of monthly averaged 500 hPa heights and 2 m air temperatures reveals several possible mechanisms by which the atmosphere influences snowmelt onset in 1990. Consistent with positive AO phases, 500 hPa heights are below average in the central Arctic during March (Fig. 4). The resulting flow pattern suggests that thermal advection, cloud cover and atmospheric moisture content, the latter two associated with cyclonic shortwave disturbances, are contributing factors in influencing snowmelt. For instance, thermal advection of near 0°C air provides a mechanism for the abnormally early snowmelt between Svalbard and Novaya Zemlya, and in the Kara Sea. In comparison, thermal advection of cold air from the Canadian Arctic Archipelago into Baffin Bay could explain the lack of snowmelt in the Baffin Bay region by mid-April. The 500 hPa flow pattern also implies increased cyclonic activity could be present in the Kara Sea area, since the 500 hPa level is often considered a steering level for shortwave disturbances. Therefore, cyclonic systems traveling along the 500 hPa flow pattern would preferentially travel into the Kara Sea region, bringing increased cloudiness, enhancing the surface longwave radiation flux and possibly increasing atmospheric moisture. Since an increase in the surface longwave radiation flux is known to cause snowmelt (Reference Crane and AndersonCrane and Anderson, 1994), the presence of increased cyclonic activity could account for the abnormally early observed snowmelt.
500 hpa heights and 2 m air temperatures for (a) march, (b) april and (c) may 1990

A slight shift in the April 500 hPa flow pattern is a result of abnormally high heights near the Aleutian Low and abnormally low heights near the central Arctic Ocean, Barents and Kara Seas and Hudson and Baffin Bays (Fig. 4). The corresponding 500 hPa flow pattern veers north after reaching western Russia, and instead of traveling around the Aleutian Low, airflow traverses the Russian coastline into the East Siberian Sea. Abnormally warm air (5°C above normal) and cyclonic systems subsequently flow into the Laptev and East Siberian Seas, where earlier than average melt covers a greater area than is typically expected (Fig. 3). Conversely, there is little snowmelt in Baffin Bay, and what does melt is abnormally late. The 500 hPa flow pattern near Baffin Bay is similar to March, when cold air advection from the central Arctic into Baffin Bay could delay snowmelt.
In May, the 500 hPa flow pattern remains similar to April (Fig. 4), with the flow pattern favoring advection of warm air and increased cyclonic activity over the Laptev Sea, the East Siberian Sea and portions of the Arctic Ocean, where abnormally early melt (Fig. 3) covers a much greater area than would normally be expected in these regions. In contrast, melt in the Beaufort Sea is delayed (Fig. 3), possibly because the 500 hPa flow pattern favors advection of cool Arctic air over the Beaufort Sea.
Based on the synoptic analysis for 1990, a reasonable hypothesis is that early snowmelt onset occurs when abnormally warm air temperatures and/or increased cyclonic activity are present, and delayed snowmelt onset occurs when abnormally cool air and/or decreased cyclonic activity exists. These results are consistent with other papers on atmosphere-sea-ice interactions, which noted atmospheric circulation patterns exert a strong influence over sea-ice conditions (e.g. Reference Serreze, Maslanik, Key, Kokaly and RobinsonSerreze and others, 1995; Reference Maslanik, Serreze and BarryMaslanik and others, 1996, Reference Maslanik, Serreze and Agnew1999). Moreover, Reference Maslanik, Serreze and BarryMaslanik and others (1996) refer specifically to how increased cyclonic activity in the central Arctic may be responsible for decreases in sea-ice extent, especially in the Siberian sector. The increase in cyclonic activity may also account for some of the statistically significant trends towards earlier snowmelt onset observed in the West Central Arctic (Reference Anderson and DrobotAnderson and Drobot, 2001). Additional research into atmosphere-snowmelt relationships will be valuable in determining the atmospheric influence on snowmelt, and in predicting how future changes in atmospheric circulation might alter snowmelt onset over Arctic sea ice.
Summary
Utilizing passive-microwave-derived snowmelt-onset dates, and monthly-averaged AO values, 500 hPa heights and 2 m air temperatures, atmosphere-snowmelt-onset relationships were examined. Regression analyses showed variations in the AO explained a significant amount of the variation in mean annual snowmelt-onset dates in the West Central Arctic, Laptev Sea, East Siberian Sea, Hudson Bay and Baffin Bay. Positive (negative) phases of the AO were related to earlier (later) than average snowmelt onset in the West Central Arctic, Laptev Sea, East Siberian Sea and Hudson Bay, and later (earlier) snowmelt onset in Baffin Bay.
An examination of monthly-averaged 500 hPa heights and 2 m air temperatures for 1990 provided plausible explanations behind the observed snowmelt onset for 1990. Earlier (later) than average melt onset occurred where the 500 hPa flow pattern favored enhanced (diminished) warm-air advection and/or increased (decreased) cyclonic activity. The results show low-frequency atmospheric variations play an important role in defining the observed variations in snowmelt onset. Further analysis of low-frequency variations and snowmelt onset should provide a better understanding of atmosphere-snowmelt-onset interactions, which can then be applied to understand better the impact of projected climate warming on future snowmelt conditions.
Acknowledgements
This work was supported by NASA grant NGT5−30175. Brightness-temperature data were obtained from the National Snow and Ice Data Center in Boulder, CO. Monthly-averaged AO values were acquired from theJISAO. The comments of reviewers are also gratefully acknowledged.


