


1. Introduction
It has long been known that the apex of an electrified liquid cone (Taylor cone or electrospray) of sufficiently electrically conducting electrolytes can eject submicrometre jets with diameters decreasing at increasing electrical conductivities K of the sprayed liquid (Smith Reference Smith1986). In the extreme limit of singularly conducting electrified liquid metals (K $\sim 10^6$
S m−1) operated in vacuo, the emissions often involve exclusively atomic ions (Gabovich Reference Gabovich1984; Prewett & Mair Reference Prewett and Mair1991). In spite of their vastly smaller electrical conductivities, concentrated electrolytes of polar solvents such as formamide (K
$\sim 10^6$
S m−1) operated in vacuo, the emissions often involve exclusively atomic ions (Gabovich Reference Gabovich1984; Prewett & Mair Reference Prewett and Mair1991). In spite of their vastly smaller electrical conductivities, concentrated electrolytes of polar solvents such as formamide (K $\sim$
1 S m−1), have been seen to yield a mixture of very small drops and molecular ions. The ions were clearly being evaporated directly from the electrified meniscus (Gamero-Castaño & Fernández de la Mora Reference Gamero-Castaño and Ernández de la Mora2000), very much as in liquid metals. Certain room temperature molten salts (ionic liquids, ILs) supported on capillary tubes may achieve emissions reported as purely ionic (PI) (Romero-Sanz, Bocanegra & Fernandez Reference Romero-Sanz, Bocanegra, Fernandez de la Mora and Gamero-Castaño2003; Romero-Sanz & Fernandez de la Mora Reference Romero-Sanz and Fernandez de la Mora2004), although this behaviour is not readily reproduced, and does not apply to most ILs. In contrast, externally wetted ionic liquid ion sources (ILIS) (Lozano & Martínez-Sánchez Reference Lozano and Martínez-Sánchez2005) similar to those conventionally used with liquid metals, yield PI emissions reproducibly with many ILs, including moderately and even poorly conducting liquids such as 1-butyl-3-methylimidazolium iodide (BMI-I, with K = 0.07 S m−1 at room temperature; (Fedkiw & Lozano Reference Fedkiw and Lozano2009)). The remarkable success of ILIS and other related porous variants (Legge & Lozano Reference Legge and Lozano2011) have subsequently led to their almost universal adoption in applications requiring the generation of molecular ions completely free from the undesirable company of drops. Among these applications, electrical propulsion makes several conflicting demands. On the one hand, PI propulsion is desirable to achieve very high ion velocities, hence little propellant consumption for a given total impulse. In this respect, given the multitude of existing ILs available, IL electrosprays offer much greater flexibility in terms of mass/charge control than almost any other ion propulsion approach. On the other hand, for a given power budget, even the heaviest molecular ions are not massive enough to produce the large thrusts that may be occasionally necessary for fast orbit changes. Electrosprays producing primarily drops are therefore of propulsive interest for such quick manoeuvres. Unfortunately, no practical way has been developed to achieve efficient operation with a single thruster even in two narrow domains of the high thrust drop emission regime and the high specific impulse ion regime. The apparent difficulty in accessing this so-called dual-mode propulsion follows from the facts that ILIS are thought to be unsuitable for operation under the drop regime, while capillary sources had until recently been abandoned by most players as potentially operable ion sources. This situation has changed while this study was being completed by the discovery that the PI regime from capillary sources may be obtained by reducing the diameter of the capillary emitter tip, which stabilises decreasing liquid flow rates (Caballero-Perez, Galobardes-Esteban & Gamero-Casta Reference Caballero-Perez, Galobardes-Esteban and Gamero-Castaño2025). The original purpose of the present article was to identify several ILs capable of PI operation from capillary sources, in the hope that some of them would also be efficient in the drop regime. Our prior experience indicated that PI operation from capillaries was in principle possible with at least the propellant EMI-BF
$\sim$
1 S m−1), have been seen to yield a mixture of very small drops and molecular ions. The ions were clearly being evaporated directly from the electrified meniscus (Gamero-Castaño & Fernández de la Mora Reference Gamero-Castaño and Ernández de la Mora2000), very much as in liquid metals. Certain room temperature molten salts (ionic liquids, ILs) supported on capillary tubes may achieve emissions reported as purely ionic (PI) (Romero-Sanz, Bocanegra & Fernandez Reference Romero-Sanz, Bocanegra, Fernandez de la Mora and Gamero-Castaño2003; Romero-Sanz & Fernandez de la Mora Reference Romero-Sanz and Fernandez de la Mora2004), although this behaviour is not readily reproduced, and does not apply to most ILs. In contrast, externally wetted ionic liquid ion sources (ILIS) (Lozano & Martínez-Sánchez Reference Lozano and Martínez-Sánchez2005) similar to those conventionally used with liquid metals, yield PI emissions reproducibly with many ILs, including moderately and even poorly conducting liquids such as 1-butyl-3-methylimidazolium iodide (BMI-I, with K = 0.07 S m−1 at room temperature; (Fedkiw & Lozano Reference Fedkiw and Lozano2009)). The remarkable success of ILIS and other related porous variants (Legge & Lozano Reference Legge and Lozano2011) have subsequently led to their almost universal adoption in applications requiring the generation of molecular ions completely free from the undesirable company of drops. Among these applications, electrical propulsion makes several conflicting demands. On the one hand, PI propulsion is desirable to achieve very high ion velocities, hence little propellant consumption for a given total impulse. In this respect, given the multitude of existing ILs available, IL electrosprays offer much greater flexibility in terms of mass/charge control than almost any other ion propulsion approach. On the other hand, for a given power budget, even the heaviest molecular ions are not massive enough to produce the large thrusts that may be occasionally necessary for fast orbit changes. Electrosprays producing primarily drops are therefore of propulsive interest for such quick manoeuvres. Unfortunately, no practical way has been developed to achieve efficient operation with a single thruster even in two narrow domains of the high thrust drop emission regime and the high specific impulse ion regime. The apparent difficulty in accessing this so-called dual-mode propulsion follows from the facts that ILIS are thought to be unsuitable for operation under the drop regime, while capillary sources had until recently been abandoned by most players as potentially operable ion sources. This situation has changed while this study was being completed by the discovery that the PI regime from capillary sources may be obtained by reducing the diameter of the capillary emitter tip, which stabilises decreasing liquid flow rates (Caballero-Perez, Galobardes-Esteban & Gamero-Casta Reference Caballero-Perez, Galobardes-Esteban and Gamero-Castaño2025). The original purpose of the present article was to identify several ILs capable of PI operation from capillary sources, in the hope that some of them would also be efficient in the drop regime. Our prior experience indicated that PI operation from capillaries was in principle possible with at least the propellant EMI-BF $_4$
(Romero-Sanz et al. Reference Romero-Sanz, Bocanegra, Fernandez de la Mora and Gamero-Castaño2003; Romero-Sanz & Fernandez de la Mora Reference Romero-Sanz and Fernandez de la Mora2004). Furthermore, many other ILs have since been synthesised and commercialised. A few among them are less viscous and more conducting than EMI-BF
$_4$
(Romero-Sanz et al. Reference Romero-Sanz, Bocanegra, Fernandez de la Mora and Gamero-Castaño2003; Romero-Sanz & Fernandez de la Mora Reference Romero-Sanz and Fernandez de la Mora2004). Furthermore, many other ILs have since been synthesised and commercialised. A few among them are less viscous and more conducting than EMI-BF $_4$
, and appeared as potentially better candidates for PI emission. Here, in addition to EMI-BF
$_4$
, and appeared as potentially better candidates for PI emission. Here, in addition to EMI-BF $_4$
, we have investigated EMI-SCN, EMI-N(CN)
$_4$
, we have investigated EMI-SCN, EMI-N(CN) $_2$
and EMI-C(CN)
$_2$
and EMI-C(CN) $_3$
, and found that all approach closely the PI regime. Yet, in all cases (including EMI-BF
$_3$
, and found that all approach closely the PI regime. Yet, in all cases (including EMI-BF $_4$
) a small percentage of drop current appears to be present, as independently confirmed via energy and time of flight analysis. This translates into a sizable mass flux of drops in the spray that degrades the propulsive performance of this quasi-ionic (QI) regime. However, our original plan had to be rethought following the discovery by Caballero-Perez et al. (Reference Caballero-Perez, Galobardes-Esteban and Gamero-Castaño2025) that reaching PI operation is substantially facilitated by using capillary tip diameters considerably smaller (15
$_4$
) a small percentage of drop current appears to be present, as independently confirmed via energy and time of flight analysis. This translates into a sizable mass flux of drops in the spray that degrades the propulsive performance of this quasi-ionic (QI) regime. However, our original plan had to be rethought following the discovery by Caballero-Perez et al. (Reference Caballero-Perez, Galobardes-Esteban and Gamero-Castaño2025) that reaching PI operation is substantially facilitated by using capillary tip diameters considerably smaller (15 $\unicode{x03BC}$
m) than employed in our study (30–36
$\unicode{x03BC}$
m) than employed in our study (30–36 $\unicode{x03BC}$
m). Furthermore, they find one IL, 1-butyl-3-methylimidazolium-C(CN)
$\unicode{x03BC}$
m). Furthermore, they find one IL, 1-butyl-3-methylimidazolium-C(CN) $_3$
(BMI-C(CN)
$_3$
(BMI-C(CN) $_3$
), exhibiting a sharp transition from the QI to the PI mode. Their study reveals also that the QI regime identified here for all the liquids investigated does not arise for most ILs. Our new focus is accordingly on the peculiarities of the QI regime, and on the likely mechanism leading to the
$_3$
), exhibiting a sharp transition from the QI to the PI mode. Their study reveals also that the QI regime identified here for all the liquids investigated does not arise for most ILs. Our new focus is accordingly on the peculiarities of the QI regime, and on the likely mechanism leading to the $\textrm{QI} \rightarrow \textrm{PI}$
transition.
$\textrm{QI} \rightarrow \textrm{PI}$
transition.
2. Experimental
2.1. Materials
The liquids, commercial sources, full anion names and key physical properties available in the literature are listed in table 1. The first three were selected based on their singularly low viscosities and high electrical conductivities. EMI-C(CN) $_3$
was included as a probably less viscous and more electrically conducting salt than the 1-butyl-3-methylimidazolium-tricyanomethanide successfully investigated by Caballero-Perez et al. (Reference Caballero-Perez, Galobardes-Esteban and Gamero-Castaño2025). All the experiments presented here have been performed in negative mode for consistency with prior work (Perez-Lorenzo Reference Perez-Lorenzo2022), and to highlight the relevance of the anion in the emission performance.
$_3$
was included as a probably less viscous and more electrically conducting salt than the 1-butyl-3-methylimidazolium-tricyanomethanide successfully investigated by Caballero-Perez et al. (Reference Caballero-Perez, Galobardes-Esteban and Gamero-Castaño2025). All the experiments presented here have been performed in negative mode for consistency with prior work (Perez-Lorenzo Reference Perez-Lorenzo2022), and to highlight the relevance of the anion in the emission performance.
Properties at 25 $\,^\circ \mathrm{C}$
of the ILs investigated:
$\,^\circ \mathrm{C}$
of the ILs investigated: $\unicode{x03BC}$
= viscosity;
$\unicode{x03BC}$
= viscosity; $\gamma$
= surface tension; K = electrical conductivity;
$\gamma$
= surface tension; K = electrical conductivity; $\rho$
= density;
$\rho$
= density; $\text{EMI}$
= 1-ethyl-3-methylimidazolium,
$\text{EMI}$
= 1-ethyl-3-methylimidazolium, $\textrm{SCN}$
= thiocyanate;
$\textrm{SCN}$
= thiocyanate; $\text{N}(\text{CN})_2$
= dicyanamide,
$\text{N}(\text{CN})_2$
= dicyanamide, $\text{BF}_4$
= tetrafluoroborate,
$\text{BF}_4$
= tetrafluoroborate, $\text{C}(\text{CN})_3$
= tricyanomethanide.
$\text{C}(\text{CN})_3$
= tricyanomethanide. $^{1}$
Seki et al. (Reference Seki, Kobayashi, Kobayashi, Takei, Miyashiro, Hayamizu, Tsuzuki, Mitsugi and Umebayashi2010),
$^{1}$
Seki et al. (Reference Seki, Kobayashi, Kobayashi, Takei, Miyashiro, Hayamizu, Tsuzuki, Mitsugi and Umebayashi2010), $^{2}$
Zhang et al. (Reference Zhang, Li, Zhang and Wu2014),
$^{2}$
Zhang et al. (Reference Zhang, Li, Zhang and Wu2014), $^{3}$
Wang et al. (Reference Wang, Xing, Zhang, Liu and Zhang2022),
$^{3}$
Wang et al. (Reference Wang, Xing, Zhang, Liu and Zhang2022), $^{4}$
Safarov et al. (Reference Safarov, Nachhu, Hassel and Müller2021),
$^{4}$
Safarov et al. (Reference Safarov, Nachhu, Hassel and Müller2021), $^{5}$
Klomfar, Souckova & Patek (Reference Klomfar, Souckova and Patek2011),
$^{5}$
Klomfar, Souckova & Patek (Reference Klomfar, Souckova and Patek2011), $^{6}$
Schreiner et al. (Reference Schreiner, Zugmann, Hartl and Gores2010),
$^{6}$
Schreiner et al. (Reference Schreiner, Zugmann, Hartl and Gores2010), $^{7}$
Neves et al. (Reference Neves, Kurnia, Coutinho, Marrucho, Lopes, Freire and Rebelo2013),
$^{7}$
Neves et al. (Reference Neves, Kurnia, Coutinho, Marrucho, Lopes, Freire and Rebelo2013), $^{8}$
Souckova, Klomfar & Patek (Reference Souckova, Klomfar and Patek2011),
$^{8}$
Souckova, Klomfar & Patek (Reference Souckova, Klomfar and Patek2011), $^{9}$
Vila et al. (Reference Vila, Ginés, Pico, Franjo, Jiménez, Varela and Cabeza2006),
$^{9}$
Vila et al. (Reference Vila, Ginés, Pico, Franjo, Jiménez, Varela and Cabeza2006), $^{10}$
Souckova, Klomfar & Patek (Reference Souckova, Klomfar and Patek2015),
$^{10}$
Souckova, Klomfar & Patek (Reference Souckova, Klomfar and Patek2015), $^{11}$
(Zubeir et al. Reference Zubeir, Rocha, Vergadou, Weggemans, Peristeras, Schulz, Economou and Kroon2016; Musiał et al. Reference Musiał, Cheng, Wojnarowska and Paluch2020).
$^{11}$
(Zubeir et al. Reference Zubeir, Rocha, Vergadou, Weggemans, Peristeras, Schulz, Economou and Kroon2016; Musiał et al. Reference Musiał, Cheng, Wojnarowska and Paluch2020). $^{*}$
Value used is the average between these two studies.
$^{*}$
Value used is the average between these two studies. $^{12}$
Freire et al. (Reference Freire, Teles, Rocha, Schröder, Neves, Carvalho, Evtuguin and Santos2011),
$^{12}$
Freire et al. (Reference Freire, Teles, Rocha, Schröder, Neves, Carvalho, Evtuguin and Santos2011), $^{13}$
Fröba et al. (Reference Fröba, Rausch, Krzeminski, Assenbaum, Wasserscheid and Leipertz2010).
$^{13}$
Fröba et al. (Reference Fröba, Rausch, Krzeminski, Assenbaum, Wasserscheid and Leipertz2010).

2.2. Apparatus
Our instrument offers the unique ability to measure energy and velocity distributions in series, for the whole beam and with angular resolution. This permits an unusually detailed characterisation of the drops and ions produced, even in fairly complex mixtures. Alternative arrangements to infer such information have been previously given by Gamero and colleagues (Gamero-Castaño Reference Gamero-Castaño2008; Gamero-Castaño & Cisquella-Serra Reference Gamero-Castaño and Cisquella-Serra2021) and Prince and colleagues (Miller et al. Reference Miller, Ulibarri-Sanchez, Prince and Bemish2021). The electrosprays are generated from a fused silica capillary (Polymicro Technologies), with inner diameter (ID) 50 $\,\unicode{x03BC} \text{m}$
(40
$\,\unicode{x03BC} \text{m}$
(40 $\,\unicode{x03BC} \text{m}$
for C(CN)
$\,\unicode{x03BC} \text{m}$
for C(CN) $_3$
) and length
$_3$
) and length $\sim 0.5{\rm \,m}$
. The emitting end is pulled under a flame, mechanically sharpened to an outer diameter of approximately 36
$\sim 0.5{\rm \,m}$
. The emitting end is pulled under a flame, mechanically sharpened to an outer diameter of approximately 36 $\,\unicode{x03BC} \text{m}$
(30
$\,\unicode{x03BC} \text{m}$
(30 $\,\unicode{x03BC} \text{m}$
for C(CN)
$\,\unicode{x03BC} \text{m}$
for C(CN) $_3$
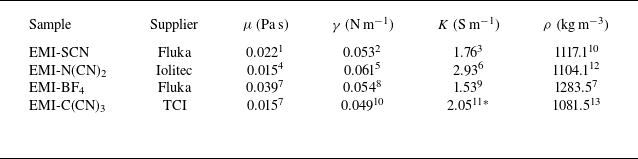
) (figure 1), and sputter coated with a thin layer of iridium (Caballero-Perez et al. Reference Caballero-Perez, Galobardes-Esteban and Gamero-Castaño2025). The opposite end of the capillary is immersed in the liquid sample, contained in a pressurised reservoir that also provides electrical contact through a platinum electrode. This electrode is connected through a current meter to a negative high voltage power supply. Because there is a non-negligible voltage drop through the length of the capillary, the voltage at the iridium-coated emitter tip is determined separately by an electrostatic voltmeter (Advanced Energy Trek 370) without either physical contact with the meniscus or charge transfer. This arrangement avoids the chemical degradation of the thin metallic coating at the electrospraying tip (see page 28 of Perez-Lorenzo Reference Perez-Lorenzo2022) since electrochemical reactions take place instead in the liquid reservoir. The effect of these reactions on the purity of the IL sample is minimal because the reservoir volume (approximately 1
$_3$
) (figure 1), and sputter coated with a thin layer of iridium (Caballero-Perez et al. Reference Caballero-Perez, Galobardes-Esteban and Gamero-Castaño2025). The opposite end of the capillary is immersed in the liquid sample, contained in a pressurised reservoir that also provides electrical contact through a platinum electrode. This electrode is connected through a current meter to a negative high voltage power supply. Because there is a non-negligible voltage drop through the length of the capillary, the voltage at the iridium-coated emitter tip is determined separately by an electrostatic voltmeter (Advanced Energy Trek 370) without either physical contact with the meniscus or charge transfer. This arrangement avoids the chemical degradation of the thin metallic coating at the electrospraying tip (see page 28 of Perez-Lorenzo Reference Perez-Lorenzo2022) since electrochemical reactions take place instead in the liquid reservoir. The effect of these reactions on the purity of the IL sample is minimal because the reservoir volume (approximately 1 $\textrm {cm}^{3}$
) is much larger than the liquid volume sprayed during a typical experiment. As a test of the reliability of the electrostatic voltmeter, we verified that its reading coincided with the voltage applied to the platinum electrode when the spray current was cancelled by stopping the liquid flow. The iridium-coated emitter tip is in mechanical contact with a stainless steel sheath tube, which is insulated from the chamber through a PEEK sheath on the vacuum side, and an alumina sheath
$\textrm {cm}^{3}$
) is much larger than the liquid volume sprayed during a typical experiment. As a test of the reliability of the electrostatic voltmeter, we verified that its reading coincided with the voltage applied to the platinum electrode when the spray current was cancelled by stopping the liquid flow. The iridium-coated emitter tip is in mechanical contact with a stainless steel sheath tube, which is insulated from the chamber through a PEEK sheath on the vacuum side, and an alumina sheath $\sim \kern-2pt 100$
mm long on the atmospheric side. The whole side of the vacuum chamber, including the 10’ vacuum flange and extractor where the emitter is located, and the silica sheathed section of the capillary, can be heated or cooled in the range
$\sim \kern-2pt 100$
mm long on the atmospheric side. The whole side of the vacuum chamber, including the 10’ vacuum flange and extractor where the emitter is located, and the silica sheathed section of the capillary, can be heated or cooled in the range $0{-}140^{\,\circ} \text{C}$
. The chamber flange and the extractor electrode are in thermal contact, limiting radiative heat loss of the capillary’s cantilevered section to just the extractor orifice region, which is small with respect to the assembly size. With regard to thermal conductivity, the heated/cooled section of the capillary is composed of aluminium, alumina, stainless steel and silica of reasonable thermal conductivity. For the liquid flowing through the silica capillary, the thermal relaxation time
$0{-}140^{\,\circ} \text{C}$
. The chamber flange and the extractor electrode are in thermal contact, limiting radiative heat loss of the capillary’s cantilevered section to just the extractor orifice region, which is small with respect to the assembly size. With regard to thermal conductivity, the heated/cooled section of the capillary is composed of aluminium, alumina, stainless steel and silica of reasonable thermal conductivity. For the liquid flowing through the silica capillary, the thermal relaxation time $\tau _{\textit{TH}} \sim C_v r^2/\lambda$
, where
$\tau _{\textit{TH}} \sim C_v r^2/\lambda$
, where $C_v$
is the volumetric heat capacity,
$C_v$
is the volumetric heat capacity, $r$
is the pipe radius and lambda is the thermal conductivity) is much shorter than that of the residence time
$r$
is the pipe radius and lambda is the thermal conductivity) is much shorter than that of the residence time $\tau _{\textit{RES}} = \textit{LQ}/A$
, where
$\tau _{\textit{RES}} = \textit{LQ}/A$
, where $L$
is the pipe length,
$L$
is the pipe length, $Q$
is the liquid flow rate and
$Q$
is the liquid flow rate and $A$
is the pipe cross-section. For a representative case of EMIBF
$A$
is the pipe cross-section. For a representative case of EMIBF $_4$
, these values differ from approximately 1 ms to 100 s, suggesting an excellent thermal homogenisation prior to emission.
$_4$
, these values differ from approximately 1 ms to 100 s, suggesting an excellent thermal homogenisation prior to emission.
Detail of the electrospray tip with (a) and without (b) IL. The distance between the small marks is 10 $\,\unicode{x03BC} \text{m}$
.
$\,\unicode{x03BC} \text{m}$
.

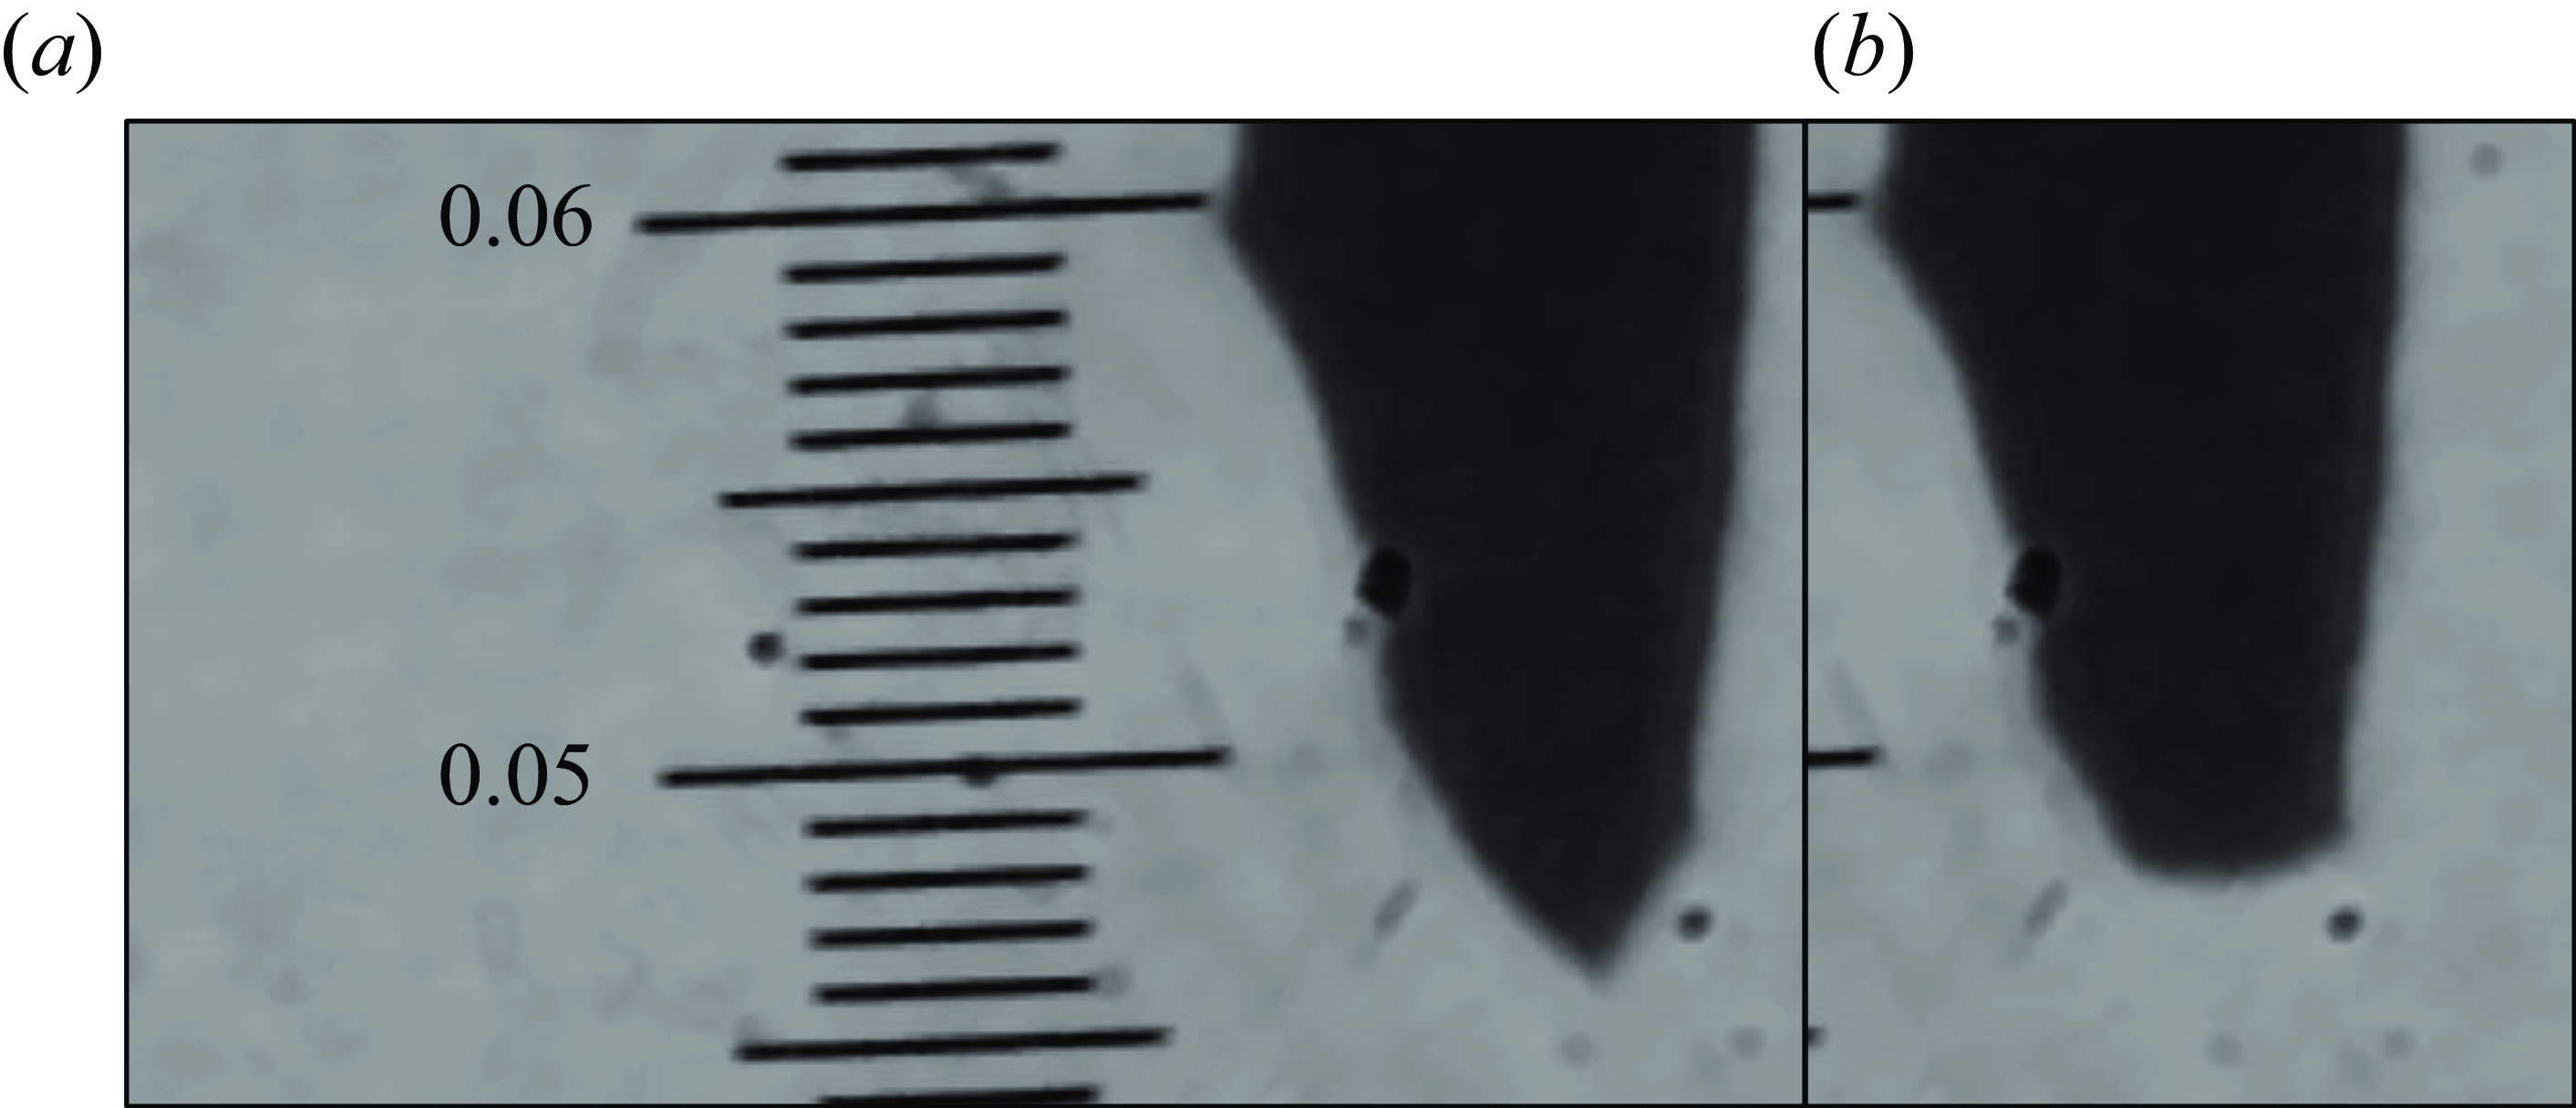
Detail of the experimental set-up. Here, $\textrm{RPA}_V$
is stopping potential or
$\textrm{RPA}_V$
is stopping potential or $V_G$
,
$V_G$
, $\textrm{RES}_V$
reservoir voltage,
$\textrm{RES}_V$
reservoir voltage, $\textrm{RES}_P$
reservoir pressure,
$\textrm{RES}_P$
reservoir pressure, $\textrm{ESVM}$
electrostatic voltmeter,
$\textrm{ESVM}$
electrostatic voltmeter, $\textrm{EXT}$
extractor (current meter),
$\textrm{EXT}$
extractor (current meter), $\textrm{ES}_I$
electrospray (current meter),
$\textrm{ES}_I$
electrospray (current meter), $\textrm{OX}$
oscilloscope (8 channel),
$\textrm{OX}$
oscilloscope (8 channel), $\textrm{OPA}$
operational amplifier (current feedback, inverting configuration),
$\textrm{OPA}$
operational amplifier (current feedback, inverting configuration), $\textrm{ETRAP}_V$
electron trap collector bias voltage,
$\textrm{ETRAP}_V$
electron trap collector bias voltage, $\alpha _{\textit{min}, \textit{max}}$
open angle corresponding to a collector,
$\alpha _{\textit{min}, \textit{max}}$
open angle corresponding to a collector, $ \textrm{SWITCH} $
electronic MOSFET alternating between
$ \textrm{SWITCH} $
electronic MOSFET alternating between $\textrm{RPA}_V$
and
$\textrm{RPA}_V$
and $ \textrm{GND} $
ground. During regular operation the electrospray voltage is constant. On a data capture event, the gate’s central electrode is initially at
$ \textrm{GND} $
ground. During regular operation the electrospray voltage is constant. On a data capture event, the gate’s central electrode is initially at $\textrm{RPA}_V$
and then the switch rapidly connects it to
$\textrm{RPA}_V$
and then the switch rapidly connects it to $ \textrm{GND} $
, the electrometer records current over time synchronised with the switching operation.
$ \textrm{GND} $
, the electrometer records current over time synchronised with the switching operation.

The experimental set-up determining the particle velocity, energy and angular distribution has been thoroughly described (Perez-Lorenzo & Fernandez de la Mora Reference Perez-Lorenzo and Fernandez de la Mora2022). It is also schematically shown in figure 2. In essence, it consists of a planar gate electrode arrangement placed perpendicularly to the spray axis. The gate is rapidly pulsed between ground and progressively higher absolute values $V_G$
of the negative voltage, allowing only the passage of negatively charged particles with energies above
$V_G$
of the negative voltage, allowing only the passage of negatively charged particles with energies above $V_G$
. In this planar gate configuration, particles moving off-axis experience some deflection during the gate transition. Their axial velocity is first slowed and then accelerated by the gate. But the radial component remains unperturbed, resulting in a deflection away from the axis. Although the deflection is drastic for particle energies very close to or below the gate potential, it is relatively modest even at energies only 1 % above the gate potential (see figure 4.7 of Perez-Lorenzo Reference Perez-Lorenzo2022). The narrow energy distributions found for ions confirm that these deflections are inconsequential. Additionally, this gate configuration leads to other minor issues, including transparency loss due to material accumulation within the grids, material backscattering into the emitter and energy alterations for the material trapped between the grids during switching. Note that for terminological convenience the term `energy’ here means energy per unit charge, and is used as synonymous with `retarding voltage’. The charge collector consists of six planar electrically insulated concentric rings, also perpendicular to the spray axis. Each ring is connected to an independent electrometer, which records the current versus the time t after the gate opens or closes. The flight times
$V_G$
. In this planar gate configuration, particles moving off-axis experience some deflection during the gate transition. Their axial velocity is first slowed and then accelerated by the gate. But the radial component remains unperturbed, resulting in a deflection away from the axis. Although the deflection is drastic for particle energies very close to or below the gate potential, it is relatively modest even at energies only 1 % above the gate potential (see figure 4.7 of Perez-Lorenzo Reference Perez-Lorenzo2022). The narrow energy distributions found for ions confirm that these deflections are inconsequential. Additionally, this gate configuration leads to other minor issues, including transparency loss due to material accumulation within the grids, material backscattering into the emitter and energy alterations for the material trapped between the grids during switching. Note that for terminological convenience the term `energy’ here means energy per unit charge, and is used as synonymous with `retarding voltage’. The charge collector consists of six planar electrically insulated concentric rings, also perpendicular to the spray axis. Each ring is connected to an independent electrometer, which records the current versus the time t after the gate opens or closes. The flight times $t$
and the stopping potentials
$t$
and the stopping potentials $V_G$
associated with the charged particles received by each collector determine the particle velocity and energy as
$V_G$
associated with the charged particles received by each collector determine the particle velocity and energy as $u = L/(t \cos\alpha )$
and
$u = L/(t \cos\alpha )$
and $\xi = V_G/\cos^2\alpha$
, where
$\xi = V_G/\cos^2\alpha$
, where $\alpha$
is the polar angle between the axis and the mid-radius of each ring, with the capillary tip used as the origin of coordinates. Here,
$\alpha$
is the polar angle between the axis and the mid-radius of each ring, with the capillary tip used as the origin of coordinates. Here, $L$
is the axial distance from the collector to the gate. The electrometer electrodes are biased to + 10 V with respect to a grounded grid placed immediately in front of them to reject backscattered electrons back into the collectors. The outermost collector ring is symmetrically divided into three
$L$
is the axial distance from the collector to the gate. The electrometer electrodes are biased to + 10 V with respect to a grounded grid placed immediately in front of them to reject backscattered electrons back into the collectors. The outermost collector ring is symmetrically divided into three $120\,^\circ$
sections to diagnose any mismatch between the plume and the geometric axes. With this set-up, approximately
$120\,^\circ$
sections to diagnose any mismatch between the plume and the geometric axes. With this set-up, approximately $50\,\%$
of the emitted current is directly collected by the electrometer, and almost all of it is accounted for when correcting for the transparencies of the various components (masks and meshes). The emitted flow rate is calculated based on the known pressure drop applied between reservoir and vacuum, corrected for the temperature-dependent viscosity along the various sections of capillary, in addition to the effects of reservoir height and tip geometry. Interestingly, the measured voltage drop (reservoir–tip) with electrospray current and material conductivity results in an effective capillary ID, of a smaller value of
$50\,\%$
of the emitted current is directly collected by the electrometer, and almost all of it is accounted for when correcting for the transparencies of the various components (masks and meshes). The emitted flow rate is calculated based on the known pressure drop applied between reservoir and vacuum, corrected for the temperature-dependent viscosity along the various sections of capillary, in addition to the effects of reservoir height and tip geometry. Interestingly, the measured voltage drop (reservoir–tip) with electrospray current and material conductivity results in an effective capillary ID, of a smaller value of $40-44 \,\unicode{x03BC} \text{m}$
rather than 50 (and 35 instead of 40 for
$40-44 \,\unicode{x03BC} \text{m}$
rather than 50 (and 35 instead of 40 for $\text{C}(\text{CN})_3$
). Regardless of this disparity, the emitted flow rate has been calculated based on the manufacturer ID. Prior to acquiring time of flight (TOF) spectra for the various liquids studied, the lowest stable current versus backpressure
$\text{C}(\text{CN})_3$
). Regardless of this disparity, the emitted flow rate has been calculated based on the manufacturer ID. Prior to acquiring time of flight (TOF) spectra for the various liquids studied, the lowest stable current versus backpressure $I(P)$
are determined by pre-screening current/voltage conditions producing emissions with stable currents and visually steady menisci. These two indicators of stability are continuously monitored during acquisition
$I(P)$
are determined by pre-screening current/voltage conditions producing emissions with stable currents and visually steady menisci. These two indicators of stability are continuously monitored during acquisition $\sim 20 {\rm \,min}$
. The
$\sim 20 {\rm \,min}$
. The $I(P)$
traces, obtained from high pressure down to 0 and back up can be observed to overlap reasonably, with a small hysteresis at the lowest pressures (likely due to unsteadiness of the spray after flow starvation).
$I(P)$
traces, obtained from high pressure down to 0 and back up can be observed to overlap reasonably, with a small hysteresis at the lowest pressures (likely due to unsteadiness of the spray after flow starvation).
3. Results
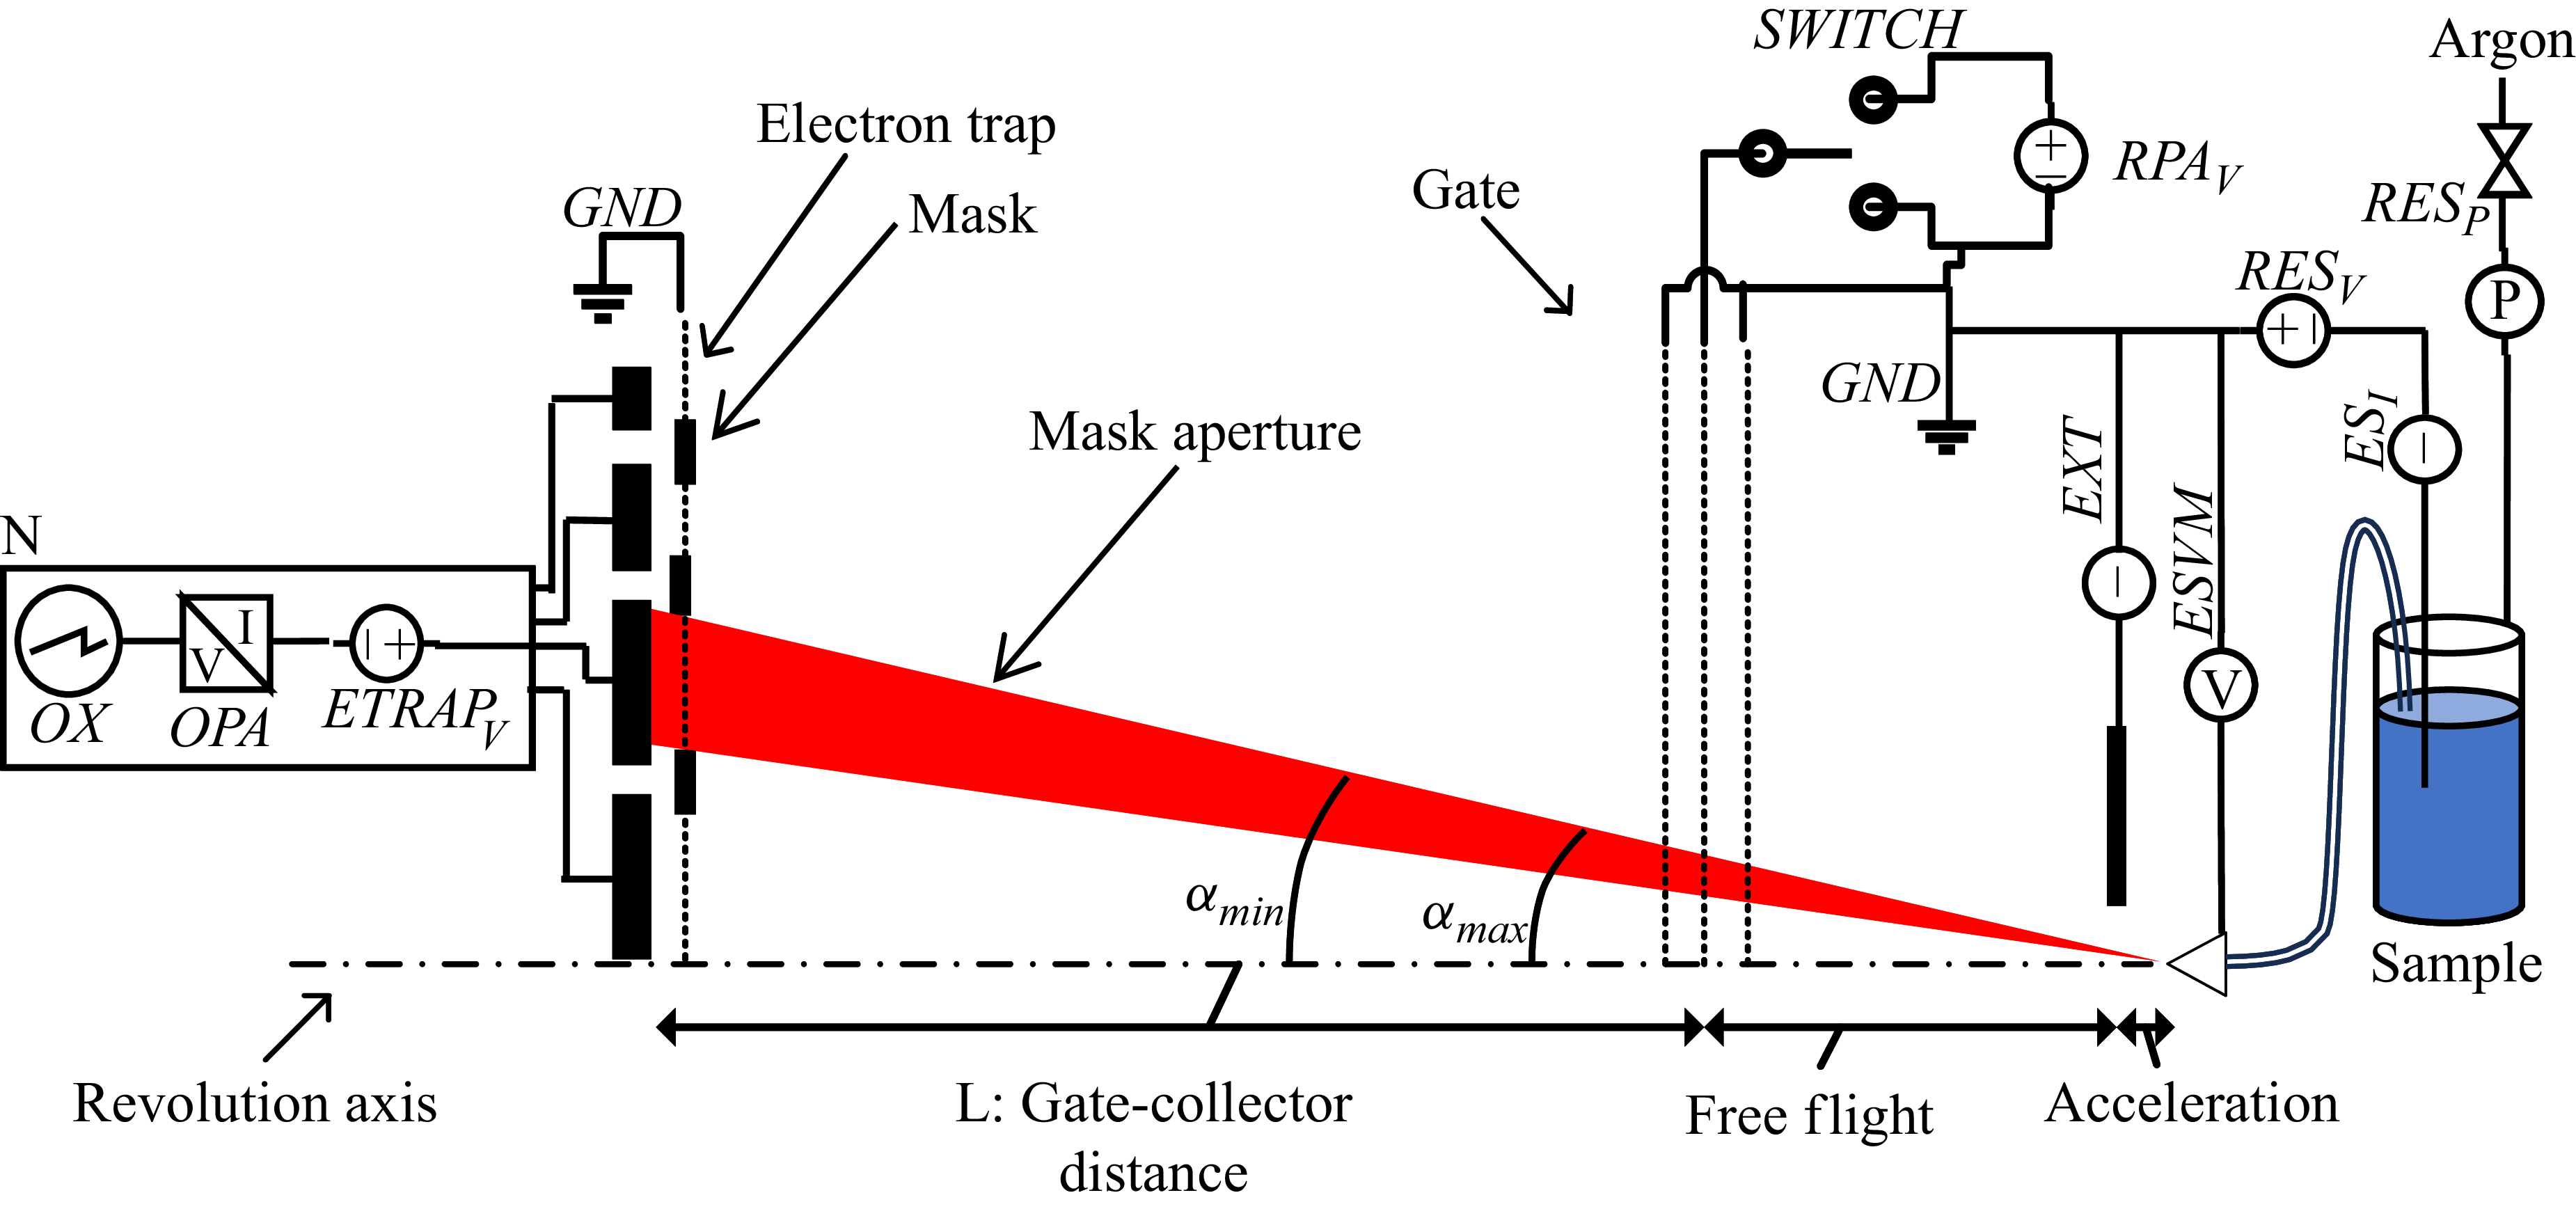
For the 4 substances studied, conditions are found when the majority of the current is emitted as singly charged clusters, including a small number n of anions (n = 1–3, referred to as monomer, dimer and trimer). These clusters are readily identifiable through their narrowly defined energy, close to the capillary potential, and their sharp TOF steps at the expected positions for particles of that energy and the known cluster masses ( $\lt 10\,\unicode{x03BC} \text{s}$
in figure 3).
$\lt 10\,\unicode{x03BC} \text{s}$
in figure 3).
(a) Time of flight traces represented as current over time $\tau = t/ \textrm{cos}\,\alpha$
at the highest stopping potential. The sharp steps on the left are for ions while the broad steps centred at approximately
$\tau = t/ \textrm{cos}\,\alpha$
at the highest stopping potential. The sharp steps on the left are for ions while the broad steps centred at approximately $40 \,\unicode{x03BC} \text{s}$
are for drops. (b) Detail of the TOF curves on the left normalised to the signal value at the largest
$40 \,\unicode{x03BC} \text{s}$
are for drops. (b) Detail of the TOF curves on the left normalised to the signal value at the largest $\tau$
, highlighting the droplet end region. The inset shows that the drop contribution to the current may take values between
$\tau$
, highlighting the droplet end region. The inset shows that the drop contribution to the current may take values between $0.5\,\%$
and
$0.5\,\%$
and $2.5\,\%$
for the lowest cases.
$2.5\,\%$
for the lowest cases.

For some of the cases of BF $_4$
and C(CN)
$_4$
and C(CN) $_3$
, one sees in figure 3 that a significant fraction of the current rises between
$_3$
, one sees in figure 3 that a significant fraction of the current rises between $\sim$
20 and 40
$\sim$
20 and 40 $\,\unicode{x03BC} \text{s}$
, corresponding to droplets emitted from the jet breakup region. Figure 3(b) shows these traces normalised, such that the percentage of drop current is more clearly seen. This small step is confined to flight times larger than 20
$\,\unicode{x03BC} \text{s}$
, corresponding to droplets emitted from the jet breakup region. Figure 3(b) shows these traces normalised, such that the percentage of drop current is more clearly seen. This small step is confined to flight times larger than 20 $\,\unicode{x03BC} \text{s}$
(
$\,\unicode{x03BC} \text{s}$
( $\lt 10 \,\,\unicode{x03BC} \text{s}$
for SCN and N(CN)
$\lt 10 \,\,\unicode{x03BC} \text{s}$
for SCN and N(CN) $_2$
). Accordingly, we evaluate the drop current as that of particles reaching the collector after
$_2$
). Accordingly, we evaluate the drop current as that of particles reaching the collector after $20 \,\,\unicode{x03BC} \text{s}$
. Interestingly, this droplet current fraction may be below
$20 \,\,\unicode{x03BC} \text{s}$
. Interestingly, this droplet current fraction may be below $1\,\%$
, but is apparently never fully eliminated under our operating conditions. We shall subsequently refer to this regime of minuscule drop currents as the QI regime. Interestingly, at the lowest flow rates, the middle of the TOF step for the droplets converges towards
$1\,\%$
, but is apparently never fully eliminated under our operating conditions. We shall subsequently refer to this regime of minuscule drop currents as the QI regime. Interestingly, at the lowest flow rates, the middle of the TOF step for the droplets converges towards $40-60\,\,\unicode{x03BC} \text{s}$
for all four ILs.
$40-60\,\,\unicode{x03BC} \text{s}$
for all four ILs.
Although the drop step accounts for as little as $\sim$ $0.5\,\%$
of the total current, it represents a significant fraction of the total emitted mass, greatly degrading the propulsive efficiency of a truster based on these emissions. To put it in perspective, a step at 50
$0.5\,\%$
of the total current, it represents a significant fraction of the total emitted mass, greatly degrading the propulsive efficiency of a truster based on these emissions. To put it in perspective, a step at 50 $\,\unicode{x03BC} \text{s}$
vs the main ion at
$\,\unicode{x03BC} \text{s}$
vs the main ion at $\sim$
5
$\sim$
5 $\,\unicode{x03BC} \text{s}$
represents a
$\,\unicode{x03BC} \text{s}$
represents a $m/q$
disparity of 100:1 (
$m/q$
disparity of 100:1 ( $m/q \propto \tau ^2$
), therefore
$m/q \propto \tau ^2$
), therefore $\sim$ $0.5\,\%$
of current actually represents 50
$0.5\,\%$
of current actually represents 50 $\,\%$
of the total emitted mass. With thrust being (
$\,\%$
of the total emitted mass. With thrust being ( $T \propto I\sqrt {m/q}$
) then 50
$T \propto I\sqrt {m/q}$
) then 50 $\,\%$
of the mass contributes only
$\,\%$
of the mass contributes only $5\,\%$
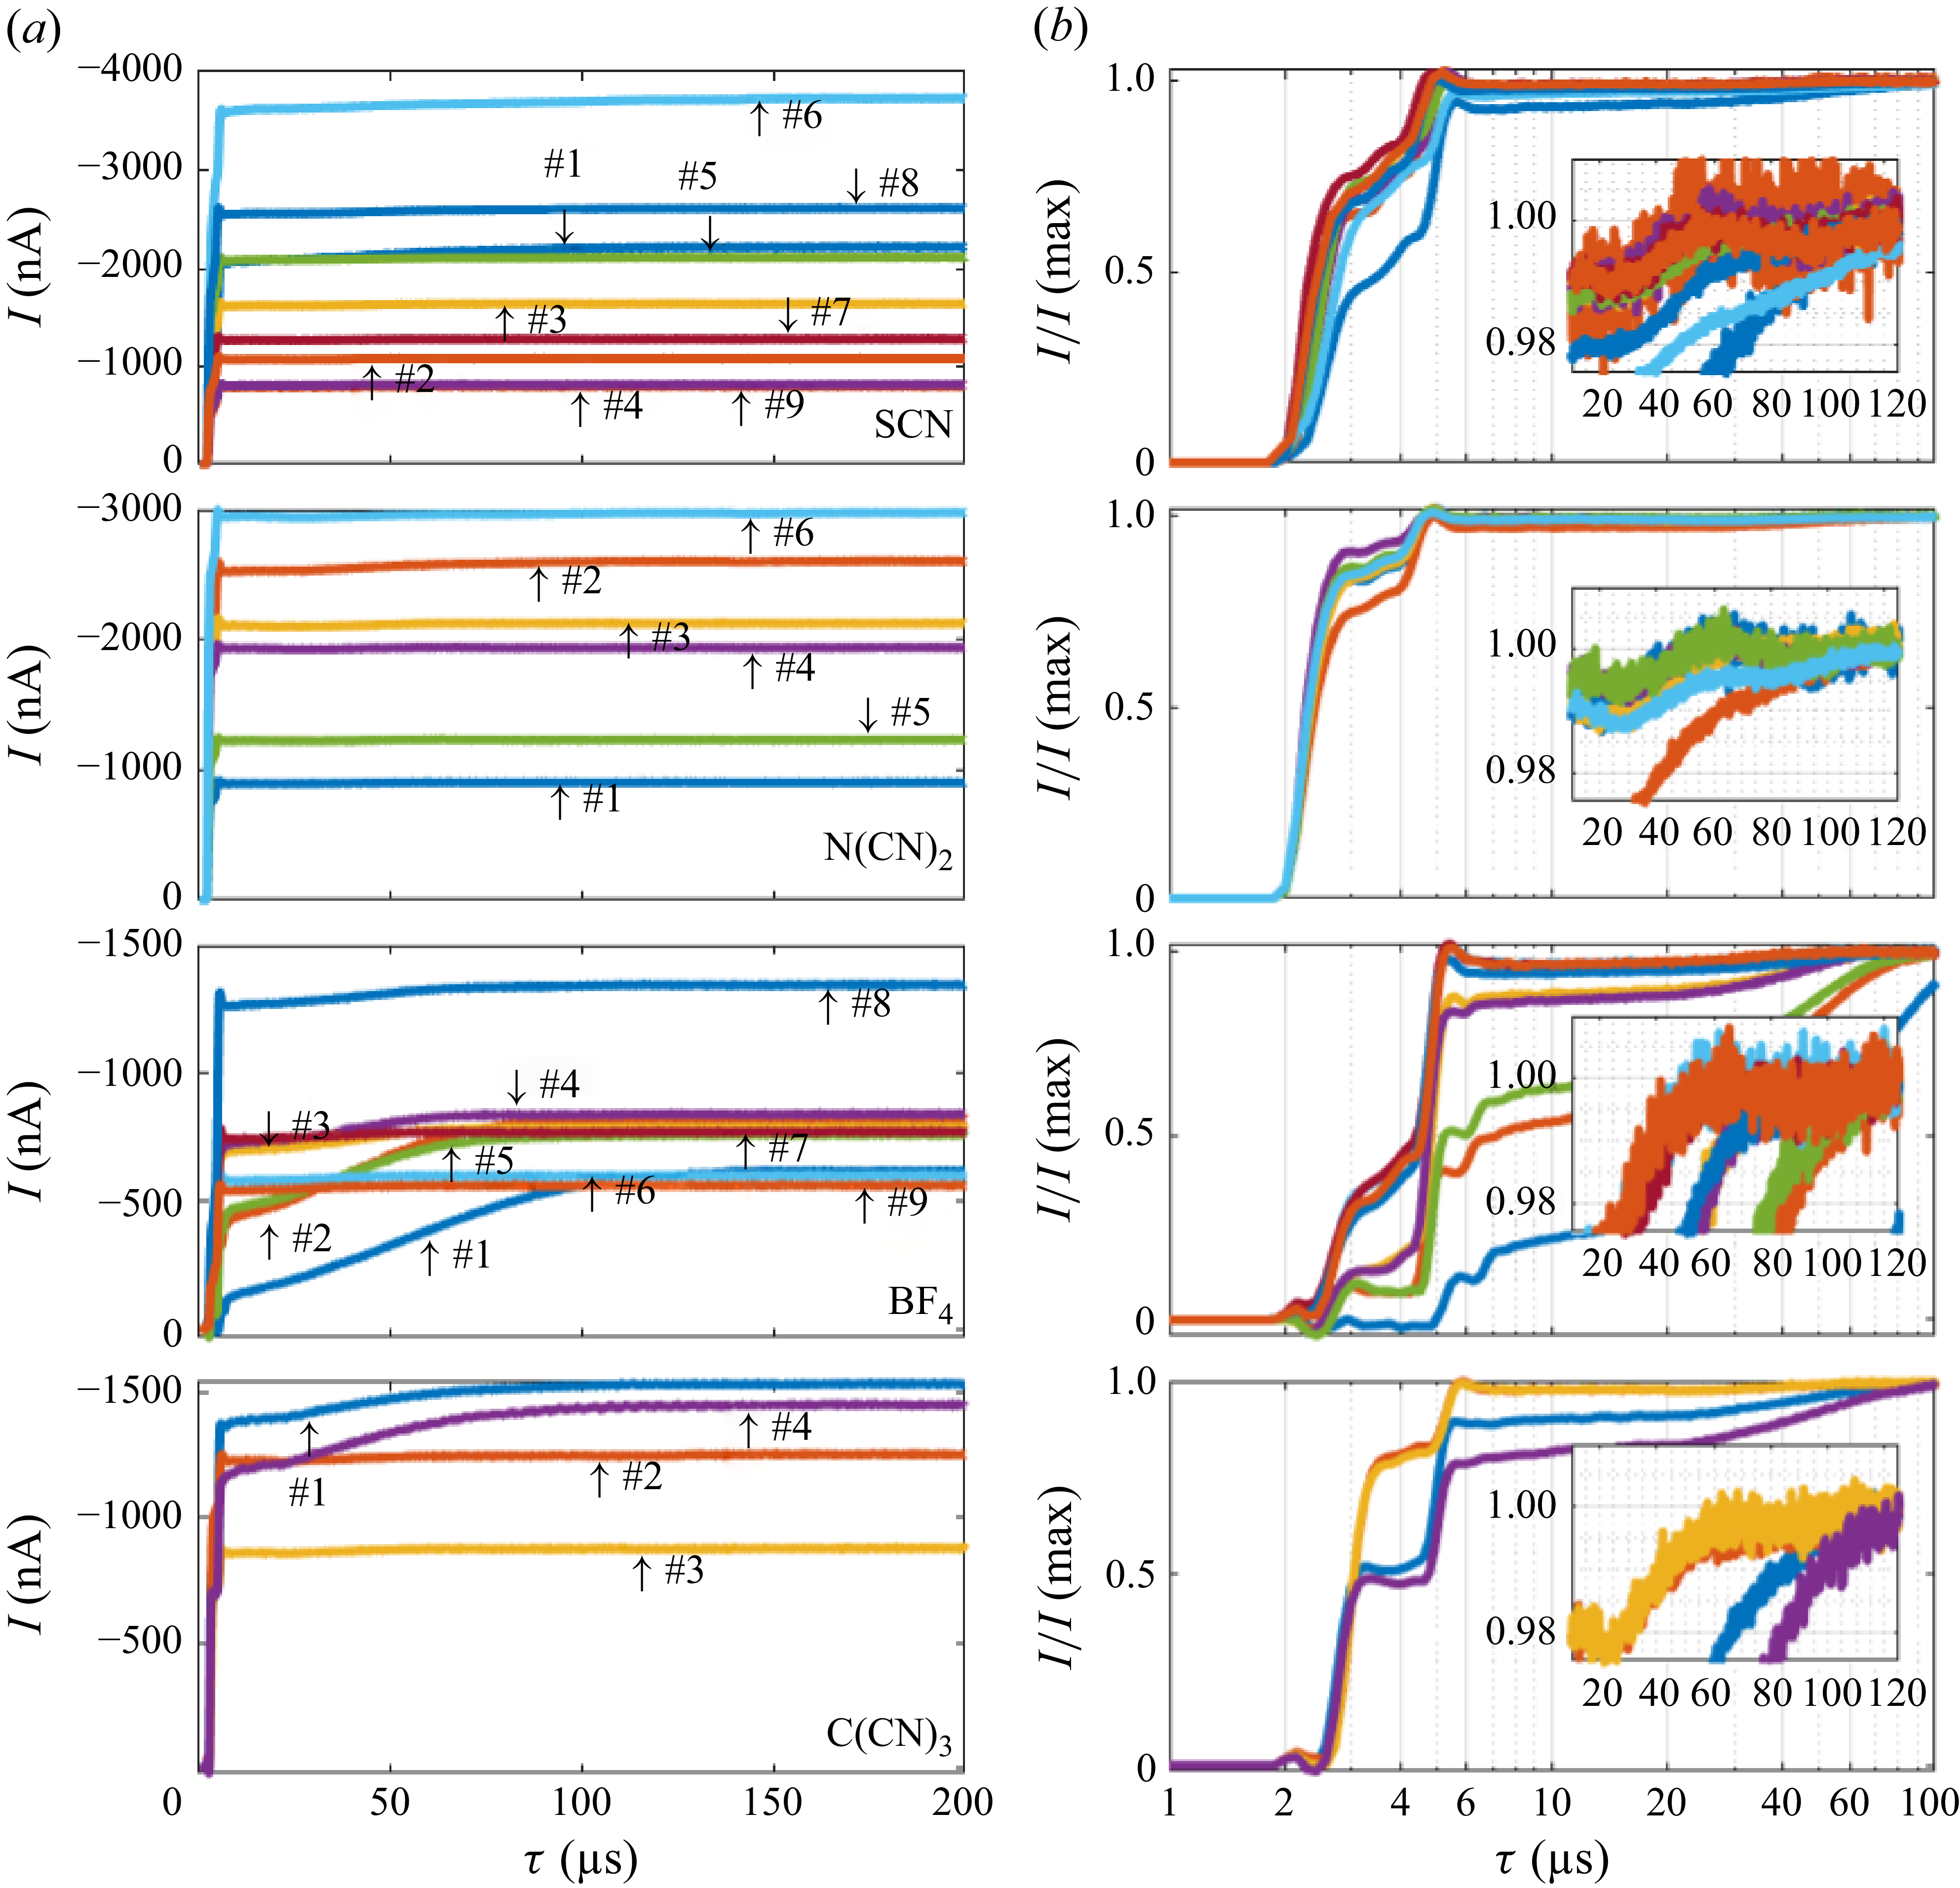
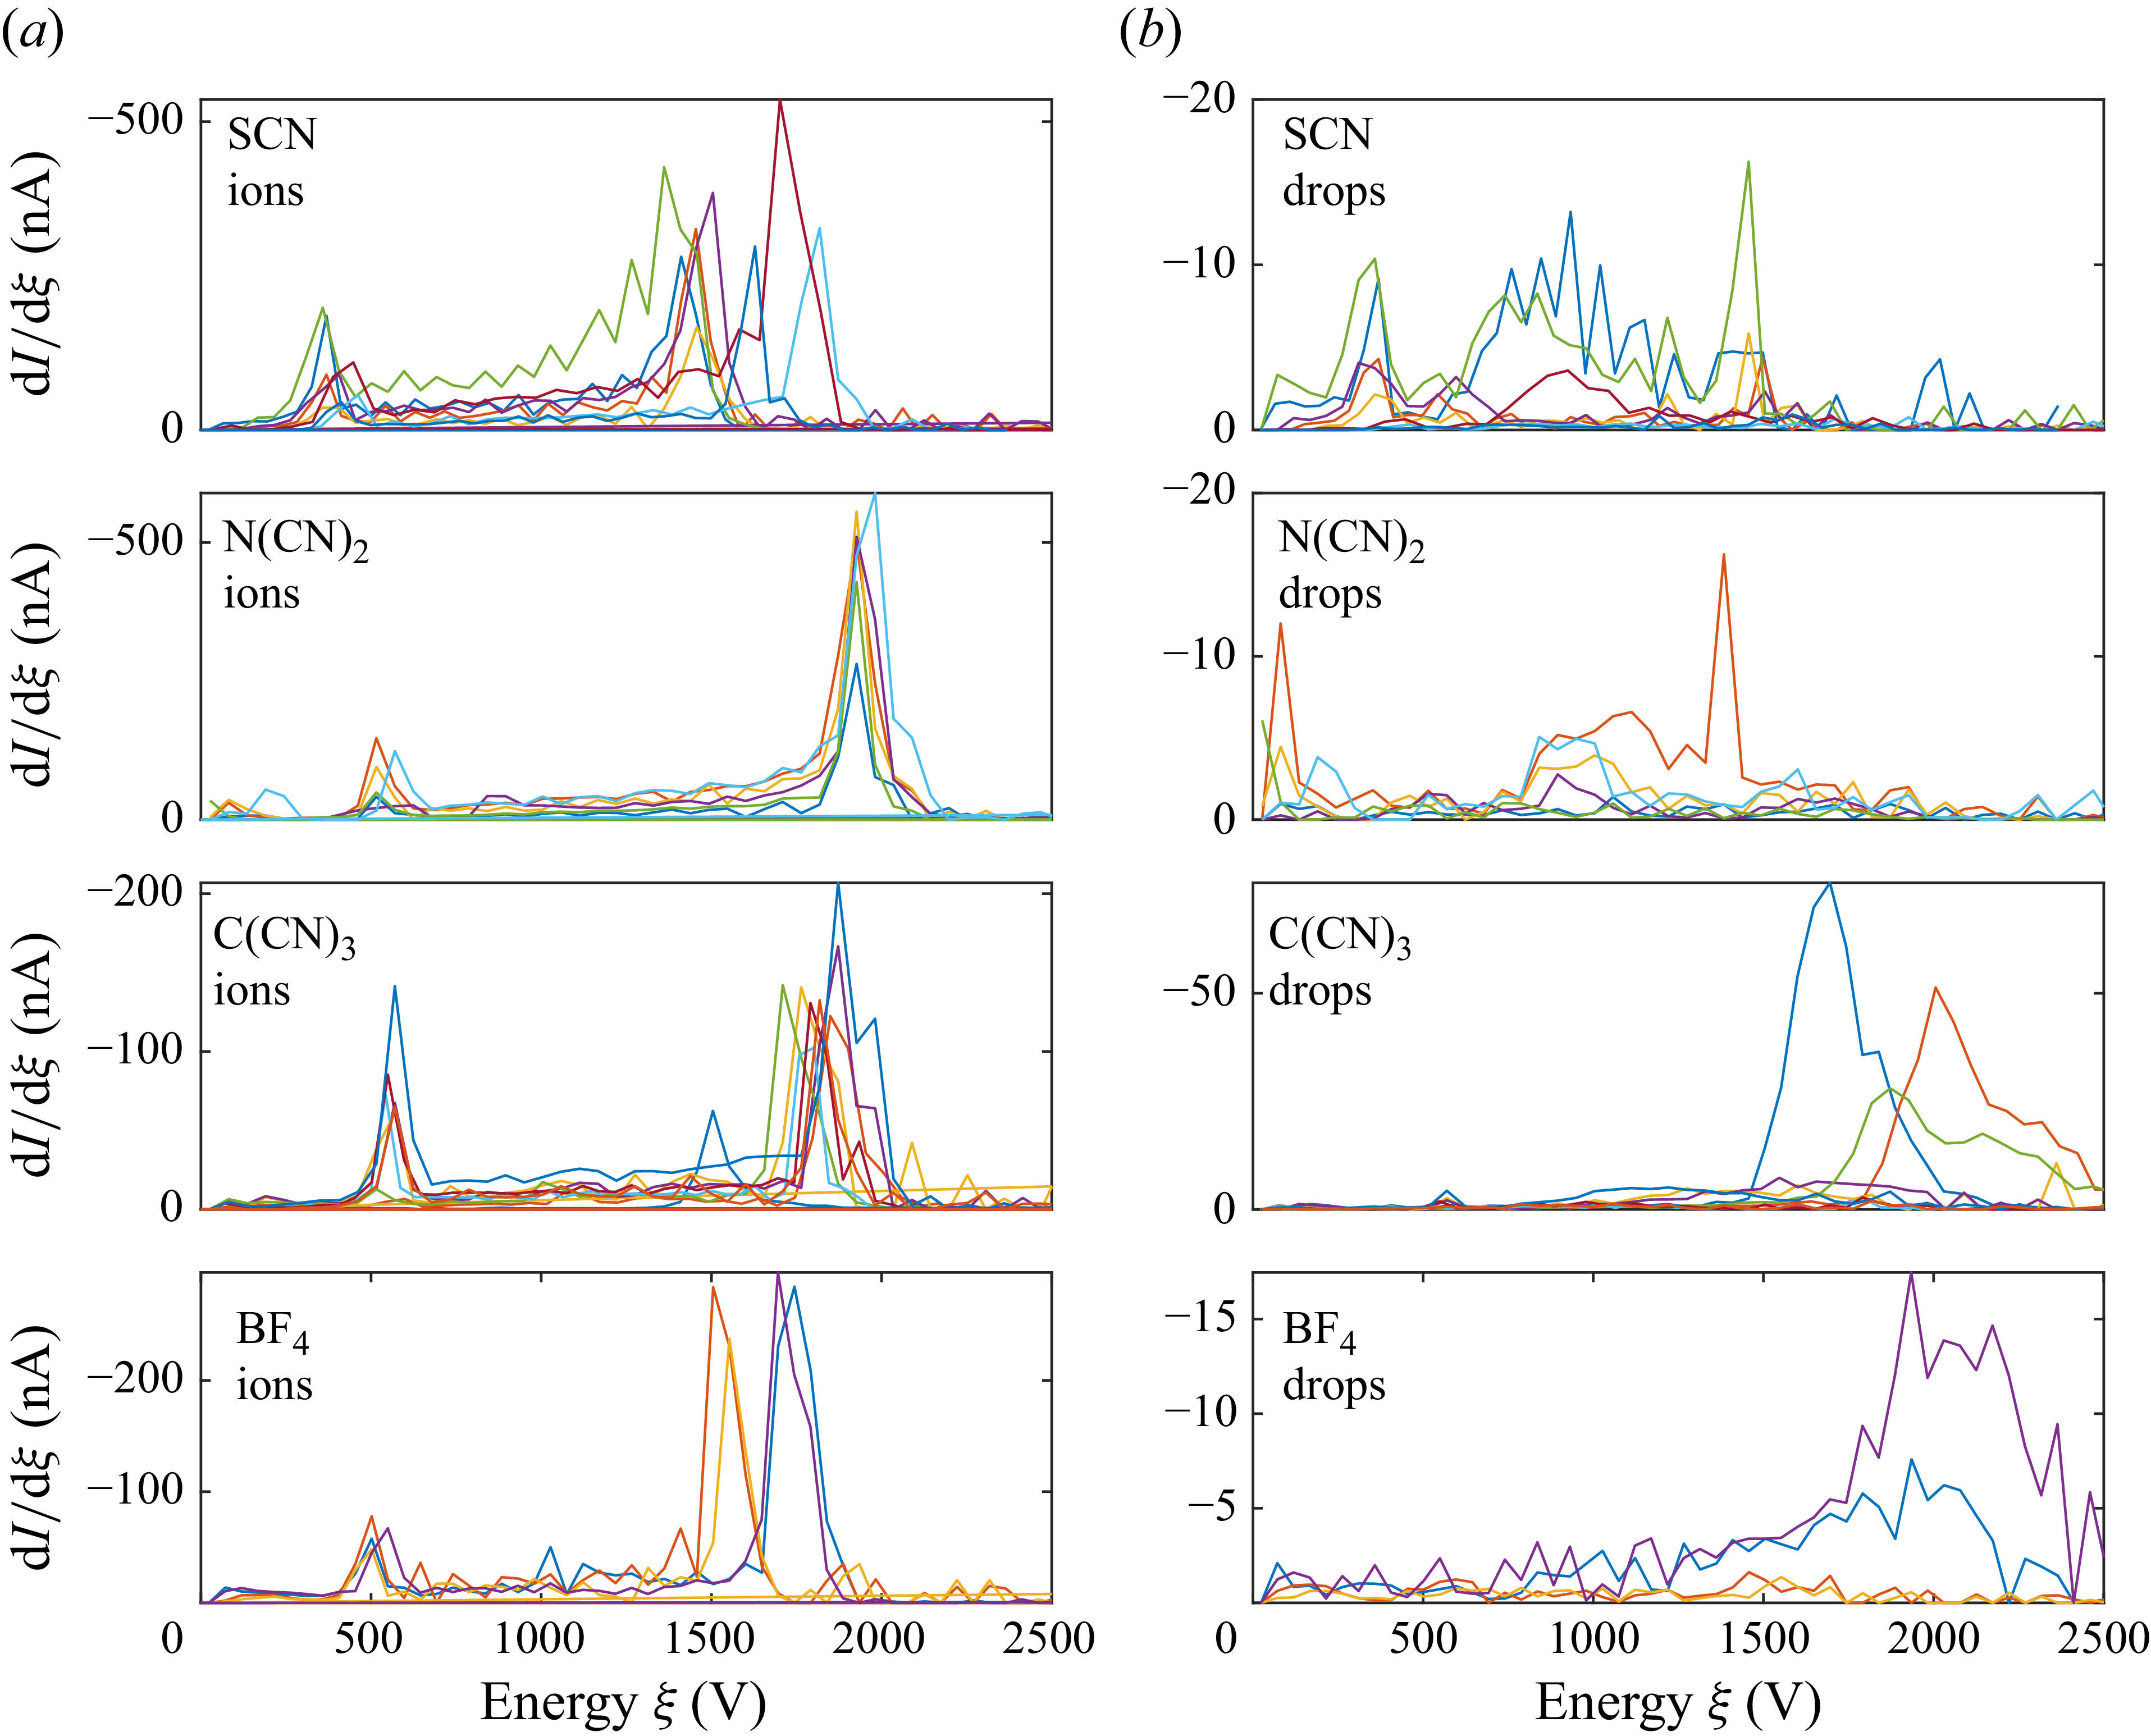
to the thrust, resulting in a degradation of specific impulse with respect to an ideal case. In addition to their long flight times, the presence of drops is confirmed via energy analysis. Surprisingly, most of the drops produced under QI conditions have energies between the emitter voltage and half its value. This is observed for some of the cases in figure 4(b). There is no comparable prior observation of this behaviour, which is hard to rationalise for a steady jet. We will later interpret it as implying that the emission of drops is transient rather than steady, occupying a small fraction of the emission time.
$5\,\%$
to the thrust, resulting in a degradation of specific impulse with respect to an ideal case. In addition to their long flight times, the presence of drops is confirmed via energy analysis. Surprisingly, most of the drops produced under QI conditions have energies between the emitter voltage and half its value. This is observed for some of the cases in figure 4(b). There is no comparable prior observation of this behaviour, which is hard to rationalise for a steady jet. We will later interpret it as implying that the emission of drops is transient rather than steady, occupying a small fraction of the emission time.
Energy analysis of the various experiments separating the contributions of ionic (a) and droplet (b) species. For the cases of $\textrm{SCN}$
and
$\textrm{SCN}$
and $\text{N}(\text{CN})_2$
the drop energy is well below the ion energy, while, for some of the cases with
$\text{N}(\text{CN})_2$
the drop energy is well below the ion energy, while, for some of the cases with $\text{C}(\text{CN})_3$
and
$\text{C}(\text{CN})_3$
and $ \text{BF}_4$
, the energy of the drops exceeds the ion energy.
$ \text{BF}_4$
, the energy of the drops exceeds the ion energy.

3.1. Effect of temperature
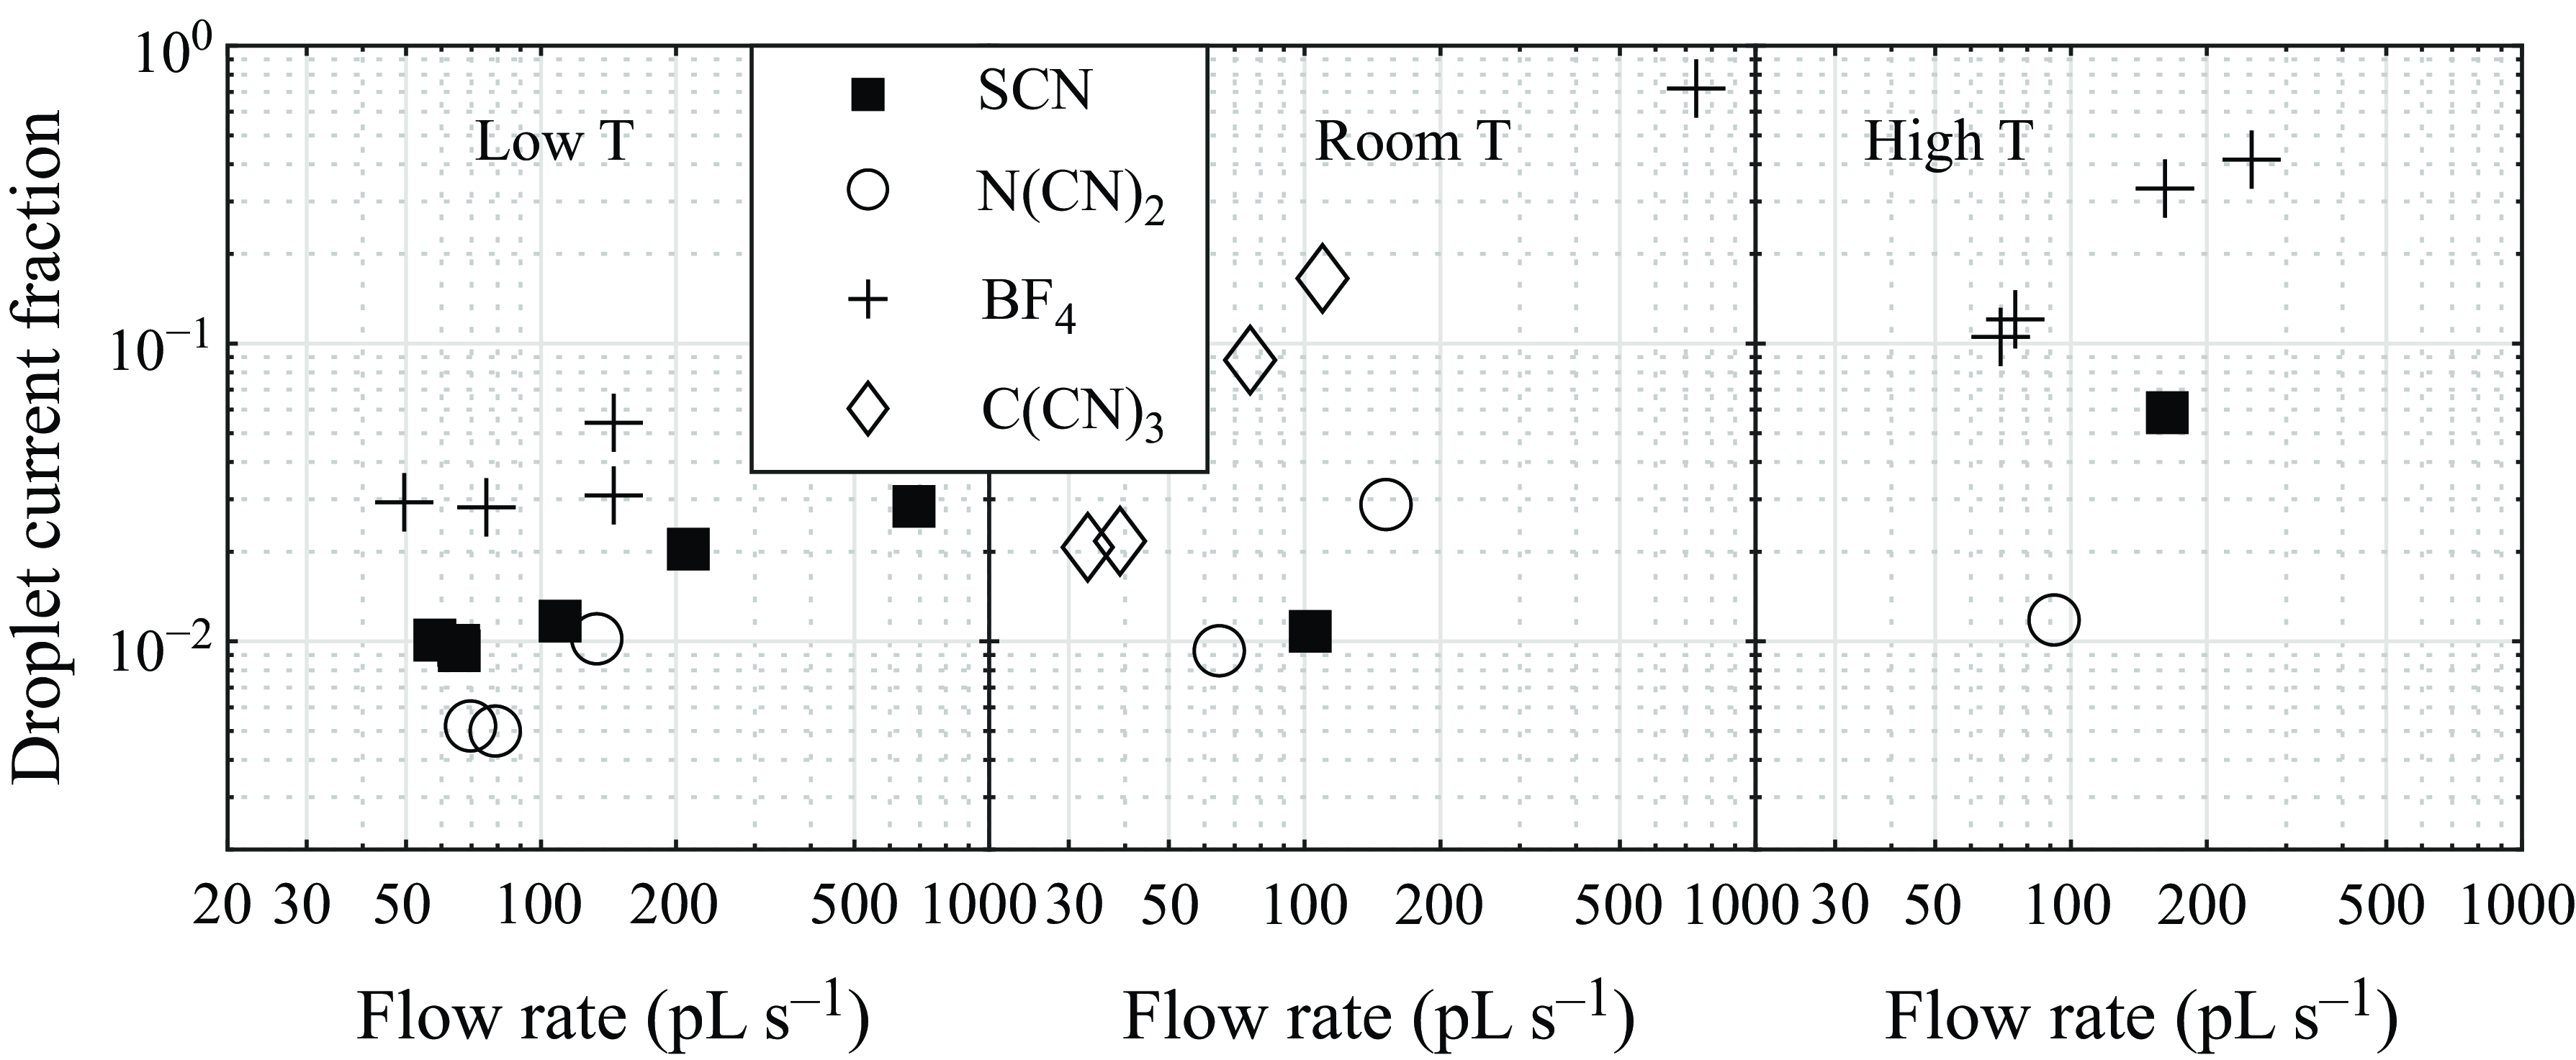
Various emitter temperatures were explored. At each temperature, we aimed to include at least one datum at the lowest achievable flow rate (see table 2). Figure 5 represents the droplet current fraction for the various cases studied divided into 3 panels by emitter temperature ranges. Surprisingly, the lower temperatures not only favour smaller droplet current fractions, but also achieve them over a considerably wider range of flow rates. It is paradoxical that liquids of high conductivity and low viscosity would facilitate reaching the QI regime found here, yet would approach it better under low temperature conditions decreasing the conductivity and increasing the viscosity. A reduction in the drop fraction resulting from lowering the temperature from $50^{\,\circ} \text{C}$
to
$50^{\,\circ} \text{C}$
to $30^{\,\circ} \text{C}$
has been observed also by Villegas-Prados et al. (Reference Villegas-Prados, Cruz, Wijnen, Correyero, Fajardo and Navarro-Cavallé2023) for the IL EMI-Im. (Im = bis(trifluoromethylsulfonyl)imide).
$30^{\,\circ} \text{C}$
has been observed also by Villegas-Prados et al. (Reference Villegas-Prados, Cruz, Wijnen, Correyero, Fajardo and Navarro-Cavallé2023) for the IL EMI-Im. (Im = bis(trifluoromethylsulfonyl)imide).
Droplet current fraction for three different temperature ranges: low T (3 $\,^{\circ} \text{C}$
–15
$\,^{\circ} \text{C}$
–15 $\,^{\circ} \text{C}$
), room T (25
$\,^{\circ} \text{C}$
), room T (25 $\,^{\circ} \text{C}$
–27
$\,^{\circ} \text{C}$
–27 $\,^{\circ} \text{C}$
) and high T (55
$\,^{\circ} \text{C}$
) and high T (55 $\,^{\circ} \text{C}$
–80
$\,^{\circ} \text{C}$
–80 $\,^{\circ} \text{C}$
).
$\,^{\circ} \text{C}$
).

4. Relation between the QI and PI regimes
Details of the transition between QI and PI regimes are illuminated by a remarkable recent study of several ILs electrosprayed in vacuo in positive mode at room temperature (Caballero-Perez et al. Reference Caballero-Perez, Galobardes-Esteban and Gamero-Castaño2025). By finely varying and accurately measuring the flow rate, they cleanly observe the QI $\rightarrow$
PI transition for BMI-C(CN)
$\rightarrow$
PI transition for BMI-C(CN) $_3$
. Unexpectedly, they find that the smallest flow rate at which a steady emission may be stabilised decreases substantially as the capillary tip shrinks. By using decreasing tip diameters down to
$_3$
. Unexpectedly, they find that the smallest flow rate at which a steady emission may be stabilised decreases substantially as the capillary tip shrinks. By using decreasing tip diameters down to $15\,\unicode{x03BC} \text{m}$
Caballero-Perez et al. (Reference Caballero-Perez, Galobardes-Esteban and Gamero-Castaño2025) are able to stabilise their emitters at mass flow rates as small as
$15\,\unicode{x03BC} \text{m}$
Caballero-Perez et al. (Reference Caballero-Perez, Galobardes-Esteban and Gamero-Castaño2025) are able to stabilise their emitters at mass flow rates as small as $2 {\times}10^{-12} \,\textrm{kg}\,\textrm{s}^{- 1}$
, which results in a clear jump in the drop current from a value of approximately
$2 {\times}10^{-12} \,\textrm{kg}\,\textrm{s}^{- 1}$
, which results in a clear jump in the drop current from a value of approximately $2.5\,\%$
of the total current down to zero at a critical mass flow rate of
$2.5\,\%$
of the total current down to zero at a critical mass flow rate of $4 {\times}10^{-12} \,\textrm{kg}\,\textrm{s}^{- 1}$
. No unambiguous jump is visible in the total current I at the transition point, either because there is none, or because it is so small as to be buried in the noise associated with the measurement of the tiny flow rates involved. Nevertheless, there is little ambiguity in the fact that a transition arises at a critical flow rate, because the drop current fraction is almost constant at approximately
$4 {\times}10^{-12} \,\textrm{kg}\,\textrm{s}^{- 1}$
. No unambiguous jump is visible in the total current I at the transition point, either because there is none, or because it is so small as to be buried in the noise associated with the measurement of the tiny flow rates involved. Nevertheless, there is little ambiguity in the fact that a transition arises at a critical flow rate, because the drop current fraction is almost constant at approximately $2.5\,\%$
for a fair range of flows above the critical value, and falls to zero below the critical value. This jump is also clearly manifested in a discontinuity in the thrust efficiency, which is highly sensitive to small drop flow rates. In a previously reported PI transition (Romero-Sanz et al. Reference Romero-Sanz, Bocanegra, Fernandez de la Mora and Gamero-Castaño2003; Romero-Sanz & Fernandez de la Mora Reference Romero-Sanz and Fernandez de la Mora2004), no efficiency or relative drop current data versus flow rate were included, so the existence of a sharply defined critical flow rate for a PI transition cannot be assessed. A PI transition for EMI-Im has been previously reported in a capillary with a tip diameter of
$2.5\,\%$
for a fair range of flows above the critical value, and falls to zero below the critical value. This jump is also clearly manifested in a discontinuity in the thrust efficiency, which is highly sensitive to small drop flow rates. In a previously reported PI transition (Romero-Sanz et al. Reference Romero-Sanz, Bocanegra, Fernandez de la Mora and Gamero-Castaño2003; Romero-Sanz & Fernandez de la Mora Reference Romero-Sanz and Fernandez de la Mora2004), no efficiency or relative drop current data versus flow rate were included, so the existence of a sharply defined critical flow rate for a PI transition cannot be assessed. A PI transition for EMI-Im has been previously reported in a capillary with a tip diameter of $20 \,\unicode{x03BC} \text{m}$
(Caballero-Perez & Gamero-Castaño Reference Caballero-Perez and Gamero-Castaño2024). However, Caballero-Perez et al.(Reference Caballero-Perez, Galobardes-Esteban and Gamero-Castaño2025) could not reproduce this feat in their 2025 study. Other occasional failed attempts by others to achieve PI emissions with EMI-BF
$20 \,\unicode{x03BC} \text{m}$
(Caballero-Perez & Gamero-Castaño Reference Caballero-Perez and Gamero-Castaño2024). However, Caballero-Perez et al.(Reference Caballero-Perez, Galobardes-Esteban and Gamero-Castaño2025) could not reproduce this feat in their 2025 study. Other occasional failed attempts by others to achieve PI emissions with EMI-BF $_4$
suggest similarly that the QI mode and its PI transition are highly unusual creatures, depending on certain peculiarities that are difficult to reproduce experimentally. These peculiarities are evident also in the known effectiveness of externally wetted versus capillary sources to achieve PI operation. They also manifest themselves in porous variants of ILIS, which sometimes operate in QI rather than PI mode (Villegas-Prados et al. Reference Villegas-Prados, Cruz, Wijnen, Fajardo and Navarro-Cavallé2024). One of the unusual features just noted is that the total current is barely changed at the transition. This is particularly significant because the structure of cone jets, when they form, depends greatly on this current. If there is a drastic transition from a PI situation without a jet to another with a jet, one would expect completely different currents. The proximity of the currents in both regimes leads to the suspicion that the corresponding meniscus geometries are close to each other. Because all available calculations of PI menisci (Higuera Reference Higuera2008; Coffman Reference Coffman2016; Gallud & Lozano Reference Gallud and Lozano2022; Magnani & Castaño Reference Magnani and Gamero-Castaño2023) include no jet, the hypothesis that there is really no QI jet offers itself naturally. Another notorious peculiarity is the small value of the QI drop current
$_4$
suggest similarly that the QI mode and its PI transition are highly unusual creatures, depending on certain peculiarities that are difficult to reproduce experimentally. These peculiarities are evident also in the known effectiveness of externally wetted versus capillary sources to achieve PI operation. They also manifest themselves in porous variants of ILIS, which sometimes operate in QI rather than PI mode (Villegas-Prados et al. Reference Villegas-Prados, Cruz, Wijnen, Fajardo and Navarro-Cavallé2024). One of the unusual features just noted is that the total current is barely changed at the transition. This is particularly significant because the structure of cone jets, when they form, depends greatly on this current. If there is a drastic transition from a PI situation without a jet to another with a jet, one would expect completely different currents. The proximity of the currents in both regimes leads to the suspicion that the corresponding meniscus geometries are close to each other. Because all available calculations of PI menisci (Higuera Reference Higuera2008; Coffman Reference Coffman2016; Gallud & Lozano Reference Gallud and Lozano2022; Magnani & Castaño Reference Magnani and Gamero-Castaño2023) include no jet, the hypothesis that there is really no QI jet offers itself naturally. Another notorious peculiarity is the small value of the QI drop current $I_d$
, which is an almost direct measure of the jet current. In our own measurements
$I_d$
, which is an almost direct measure of the jet current. In our own measurements $I_d\sim 0.5\,\%$
of approximately 1000 nA, namely
$I_d\sim 0.5\,\%$
of approximately 1000 nA, namely $\sim 5$
nA. In Caballero-Perez et al. (Reference Caballero-Perez, Galobardes-Esteban and Gamero-Castaño2025), the total current of BMI-C(CN)
$\sim 5$
nA. In Caballero-Perez et al. (Reference Caballero-Perez, Galobardes-Esteban and Gamero-Castaño2025), the total current of BMI-C(CN) $_3$
at the transition point is slightly less than 200 nA, with a drop current estimated also at approximately 5 nA. There is no known precedent for stable cone jets of highly conducting liquids supported on capillaries and carrying such small currents, suggesting again the absence of a QI jet. Even if one did not trust calculations indicating that there is no jet in the PI regime, it would be difficult to imagine a stable jet-like protrusion ejecting so little current from a highly charged meniscus. One is almost forced to conclude that, whatever QI jet is present, it must be very short, and must carry no mass flow most of the time. In this scenario, the QI jet would be so short as to be the mere tip of the meniscus. And whatever part of the incoming liquid flow that is not steadily emitted as ions would accumulate quasi-steadily in the meniscus, and be periodically ejected in a burst of nanodrops. As the total flow rate is decreased, a point would be reached when there is no excess flow, and the PI regime would set in. The issue of stability is apparently key in this hypothetical scenario, because the quasi-steady meniscus would need to be a stable ion emitter through the whole period of being filled and bursting. It makes sense that its stability would depend sensitively on geometric details such as capillary shape and dimensions.
$_3$
at the transition point is slightly less than 200 nA, with a drop current estimated also at approximately 5 nA. There is no known precedent for stable cone jets of highly conducting liquids supported on capillaries and carrying such small currents, suggesting again the absence of a QI jet. Even if one did not trust calculations indicating that there is no jet in the PI regime, it would be difficult to imagine a stable jet-like protrusion ejecting so little current from a highly charged meniscus. One is almost forced to conclude that, whatever QI jet is present, it must be very short, and must carry no mass flow most of the time. In this scenario, the QI jet would be so short as to be the mere tip of the meniscus. And whatever part of the incoming liquid flow that is not steadily emitted as ions would accumulate quasi-steadily in the meniscus, and be periodically ejected in a burst of nanodrops. As the total flow rate is decreased, a point would be reached when there is no excess flow, and the PI regime would set in. The issue of stability is apparently key in this hypothetical scenario, because the quasi-steady meniscus would need to be a stable ion emitter through the whole period of being filled and bursting. It makes sense that its stability would depend sensitively on geometric details such as capillary shape and dimensions.
Additional evidence for the hypothesis that drops are emitted in brief bursts is given by the anomaly already noted that the drop energy falls between the jet voltage and half its value. Typical voltage losses for the formation of a steady jet are a modest fraction of the emitter voltage, not $50\,\%$
of it. This high level of dissipation is difficult to rationalise in a steady situation. However, if a transient jet is briefly formed, it is bound to consume more electrical energy than a steady jet. This is clear from photographs of Taylor cone jets operating in the unsteady mode, where substantial surface and kinetic energy remains in the meniscus immediately after the jet detaches, which cannot be recovered as electrical energy.
$50\,\%$
of it. This high level of dissipation is difficult to rationalise in a steady situation. However, if a transient jet is briefly formed, it is bound to consume more electrical energy than a steady jet. This is clear from photographs of Taylor cone jets operating in the unsteady mode, where substantial surface and kinetic energy remains in the meniscus immediately after the jet detaches, which cannot be recovered as electrical energy.
In conclusion, all available evidence supports the hypothesis that the QI and PI modes involve similar menisci with no substantial protruding jet, and similar steady or quasi-steady PI currents. Their key difference is that QI menisci are fed at flow rates higher than can be ejected as pure ions. The excess QI liquid accumulates in the meniscus through a relatively long part of the cycle, is briefly ejected at the end of the period in the form of nanodrops (probably through a transient jet) and the process is again repeated. In contrast, PI menisci can eject all the incoming flow rate in the form of ions, and therefore operate steadily. In this scenario, ILs capable of reaching the QI regime would similarly attain the PI mode if the flow rate could be reduced sufficiently. The question of the measurability of these hypothetical transients and their frequency is of considerable interest. An upper bound for the time between bursts (the period) could conceivably be defined by analogy to what is observed in conventional electrified cone jets operating slightly above the maximal stable flow rate. In that case the meniscus is seen to slowly grow into an acorn shape, and then suddenly burst. The volume of the bursting meniscus is of the order of twice that of a steady meniscus, $V_{m}$
. Therefore, the period would be
$V_{m}$
. Therefore, the period would be ${V_{m}}/{Q}$
. For a characteristic length of 30
${V_{m}}/{Q}$
. For a characteristic length of 30 $\,\unicode{x03BC} \text{m}$
and a typical small flow rate of 10−12
$\,\unicode{x03BC} \text{m}$
and a typical small flow rate of 10−12 $\textrm {cm}^{3}$
s−1 this time is several ms, too large to have an effect on the observed dynamics. Furthermore, such a meniscus evolution would be visible, but is not observed. We should note here that our TOF measurements can detect current changes at frequencies of 1 MHz, such that any transient phenomenon occurring at frequencies below 10 MHz would be noticeable in our TOF curves. In a forthcoming study, we report on current oscillations observed in TOF spectra at frequencies of the order of 0.1 MHz. These correspond to the natural vibration frequency of a drop some 10
$\textrm {cm}^{3}$
s−1 this time is several ms, too large to have an effect on the observed dynamics. Furthermore, such a meniscus evolution would be visible, but is not observed. We should note here that our TOF measurements can detect current changes at frequencies of 1 MHz, such that any transient phenomenon occurring at frequencies below 10 MHz would be noticeable in our TOF curves. In a forthcoming study, we report on current oscillations observed in TOF spectra at frequencies of the order of 0.1 MHz. These correspond to the natural vibration frequency of a drop some 10 $\,\unicode{x03BC} \text{m}$
in diameter, although they are not visually observable at the tip of our meniscus. They arise first at the onset of ion evaporation from the meniscus neck, under conditions when a large fraction of the emission current is still in the form of drops. The frequency of transient jet formation in the QI regime must be much greater than either the estimated 1 kHz or the observed 100 kHz values, and is unquantifiable in our facility. We note finally that there is no guarantee that any IL held on a capillary source will be able to reach the QI mode. Figure 7 of Caballero-Perez et al. (Reference Caballero-Perez, Galobardes-Esteban and Gamero-Castaño2025) provides three examples of ILs not doing so, even from
$\,\unicode{x03BC} \text{m}$
in diameter, although they are not visually observable at the tip of our meniscus. They arise first at the onset of ion evaporation from the meniscus neck, under conditions when a large fraction of the emission current is still in the form of drops. The frequency of transient jet formation in the QI regime must be much greater than either the estimated 1 kHz or the observed 100 kHz values, and is unquantifiable in our facility. We note finally that there is no guarantee that any IL held on a capillary source will be able to reach the QI mode. Figure 7 of Caballero-Perez et al. (Reference Caballero-Perez, Galobardes-Esteban and Gamero-Castaño2025) provides three examples of ILs not doing so, even from $15\,\unicode{x03BC} \text{m}$
emitter tips. The 4 ILs here discussed that do successfully operate in the QI mode are a special subgroup of the 8 ILs we have studied, four of which produce a substantial drop current under all conditions investigated.
$15\,\unicode{x03BC} \text{m}$
emitter tips. The 4 ILs here discussed that do successfully operate in the QI mode are a special subgroup of the 8 ILs we have studied, four of which produce a substantial drop current under all conditions investigated.
5. Relation between capillary tip diameter and minimal flow rate
The discovery that smaller tip diameters $d_n$
stabilise reduced minimal flow rates
$d_n$
stabilise reduced minimal flow rates $Q_{\textit{min}}$
of ILs (Caballero-Perez et al. Reference Caballero-Perez, Galobardes-Esteban and Gamero-Castaño2025) deserves more discussion, as it greatly facilitates achieving PI emissions from capillary emitters. A rather strong dependence of
$Q_{\textit{min}}$
of ILs (Caballero-Perez et al. Reference Caballero-Perez, Galobardes-Esteban and Gamero-Castaño2025) deserves more discussion, as it greatly facilitates achieving PI emissions from capillary emitters. A rather strong dependence of $Q_{\textit{min}}$
on
$Q_{\textit{min}}$
on $d_n$
has previously been established for electrified glycerol jets, and attributed to its high viscosity (Scheideler & Chen Reference Scheideler and Chen2014). The conventional explanation for why Taylor cone jets are most frequently governed by laws unaffected by the emitter diameter
$d_n$
has previously been established for electrified glycerol jets, and attributed to its high viscosity (Scheideler & Chen Reference Scheideler and Chen2014). The conventional explanation for why Taylor cone jets are most frequently governed by laws unaffected by the emitter diameter $d_n$
is the large disparity between the nozzle and the jet diameters
$d_n$
is the large disparity between the nozzle and the jet diameters $d_j: d_n/d_j\gt \gt 1$
(Fernandez de la Mora & Loscertales Reference Fernandez de la Mora and Loscertales1994). This large scale ratio remains true for the glycerol jets of Scheideler & Chen (Reference Scheideler and Chen2014), and also under conditions typical of IL cone jets. However, for sufficiently viscous fluids, the viscous length
$d_j: d_n/d_j\gt \gt 1$
(Fernandez de la Mora & Loscertales Reference Fernandez de la Mora and Loscertales1994). This large scale ratio remains true for the glycerol jets of Scheideler & Chen (Reference Scheideler and Chen2014), and also under conditions typical of IL cone jets. However, for sufficiently viscous fluids, the viscous length $L_\mu =(\mu Q/\gamma )^{1/2}$
may take values intermediate between
$L_\mu =(\mu Q/\gamma )^{1/2}$
may take values intermediate between $d_n$
and
$d_n$
and $d_j$
. This may create conditions when
$d_j$
. This may create conditions when $d_n$
is not very large compared with
$d_n$
is not very large compared with $L_\mu$
, and therefore
$L_\mu$
, and therefore $d_n$
ceases to be irrelevant. This possibility is illustrated in the image of a glycerol cone jet provided by Scheideler & Chen (Reference Scheideler and Chen2014), where the meniscus structure does not rapidly evolve from a thin jet into the usual conical meniscus expected from Taylor’s static equilibrium (Taylor Reference Taylor1964). Rather, there is an extended concave–convex meniscus evolving from the thin jet to the large capillary support, presumably extending over a characteristic length
$d_n$
ceases to be irrelevant. This possibility is illustrated in the image of a glycerol cone jet provided by Scheideler & Chen (Reference Scheideler and Chen2014), where the meniscus structure does not rapidly evolve from a thin jet into the usual conical meniscus expected from Taylor’s static equilibrium (Taylor Reference Taylor1964). Rather, there is an extended concave–convex meniscus evolving from the thin jet to the large capillary support, presumably extending over a characteristic length $L_\mu$
. This lack of a cone in electrified menisci of glycerol was already prominent in figure 7 of Zeleny (Reference Zeleny1917), as well as in figure 9 of Taylor & Van Dyke (Reference Taylor and Van Dyke1969), although without establishing a connection with
$L_\mu$
. This lack of a cone in electrified menisci of glycerol was already prominent in figure 7 of Zeleny (Reference Zeleny1917), as well as in figure 9 of Taylor & Van Dyke (Reference Taylor and Van Dyke1969), although without establishing a connection with $Q_{\textit{min}}$
. A reduction of
$Q_{\textit{min}}$
. A reduction of $Q_{\textit{min}}$
with capillary diameter has also been observed by Ponce-Torres et al. (Reference Ponce-Torres, Rebollo-Muñoz, Herrada, Gañán-Calvo and Montanero2018) for liquids such as 1-octanol, 1-decanol and 1-butanol, all having substantially less extreme viscosities than glycerol. Their study includes extensive theoretical and numerical considerations.
$Q_{\textit{min}}$
with capillary diameter has also been observed by Ponce-Torres et al. (Reference Ponce-Torres, Rebollo-Muñoz, Herrada, Gañán-Calvo and Montanero2018) for liquids such as 1-octanol, 1-decanol and 1-butanol, all having substantially less extreme viscosities than glycerol. Their study includes extensive theoretical and numerical considerations.
The hypothesis that glycerol and the new IL observations are both related to viscous effects finds further qualitative support in the fact that ILs tend to be substantially more viscous than liquids typically used in electrospray applications.
6. Have we reached the purely ionic regime?
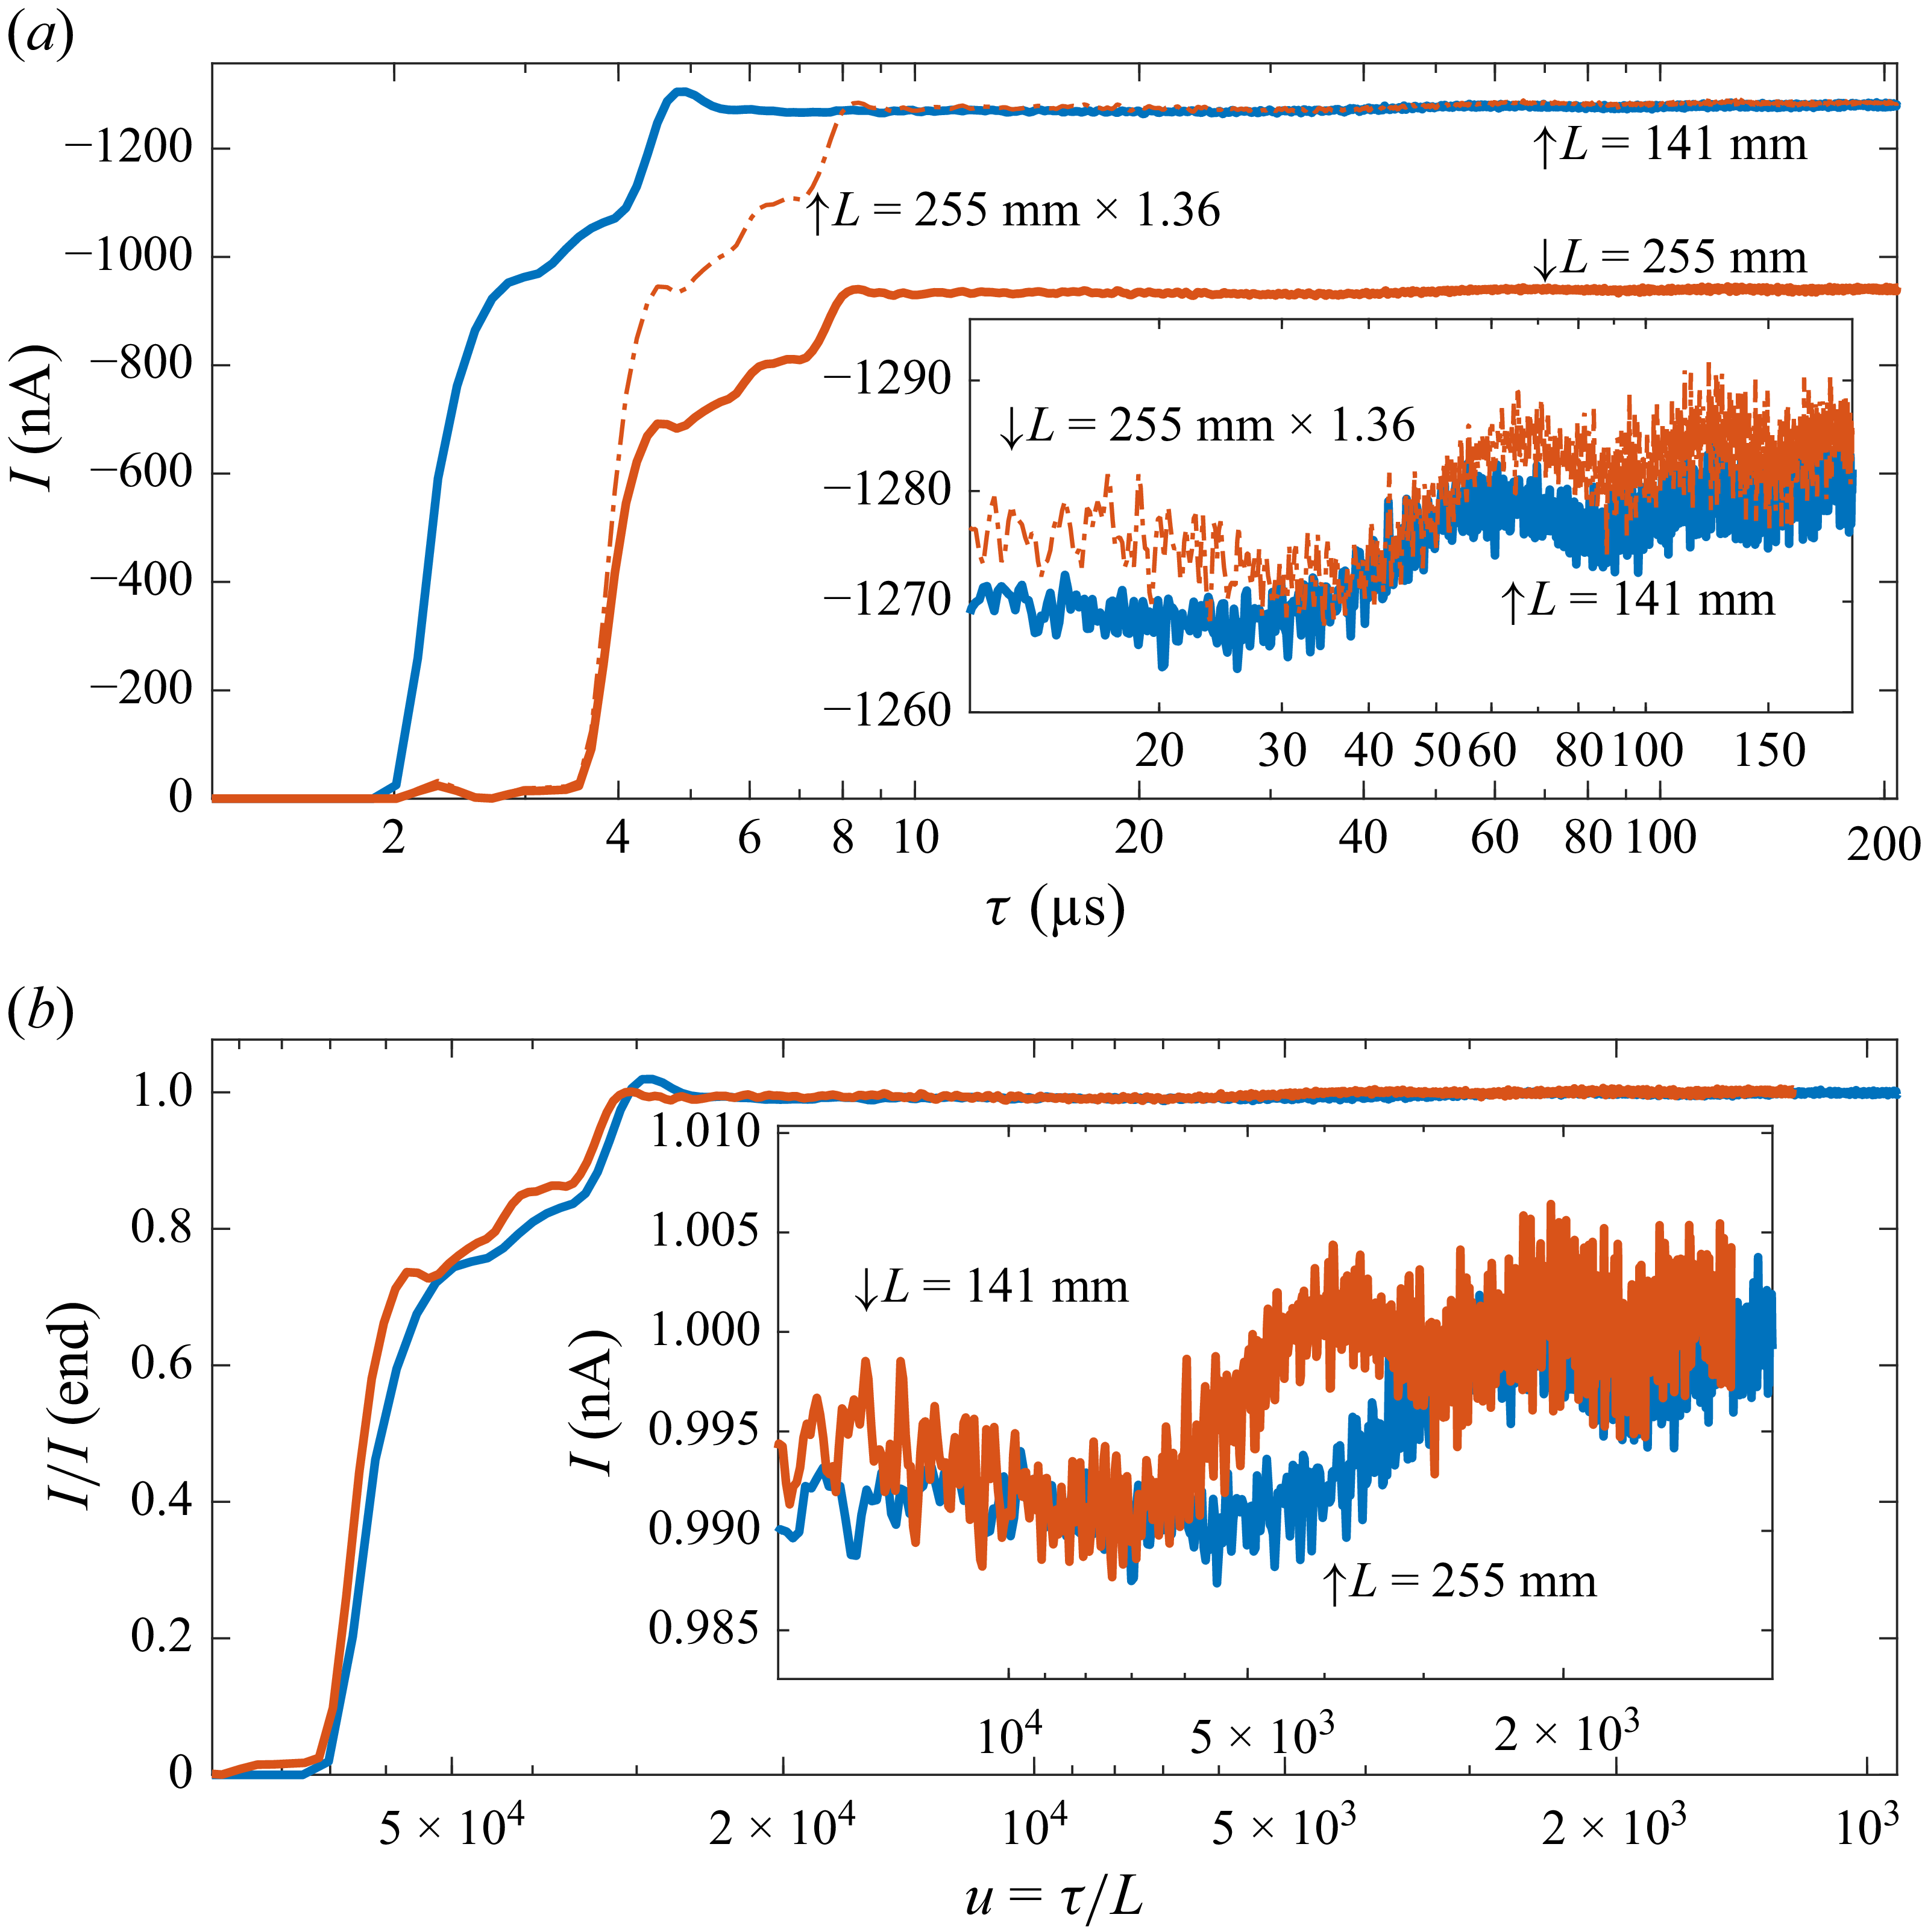
Comparison of two cases of EMI-SCN at fixed current and flow rate, although for two different flight lengths $L$
. The horizontal scale is the flight time (
$L$
. The horizontal scale is the flight time ( $\tau$
) in (a) and the ion velocity (
$\tau$
) in (a) and the ion velocity ( $u= \tau /L$
) in (b). The insets show the detail on the small step associated with the putative QI droplets.
$u= \tau /L$
) in (b). The insets show the detail on the small step associated with the putative QI droplets.

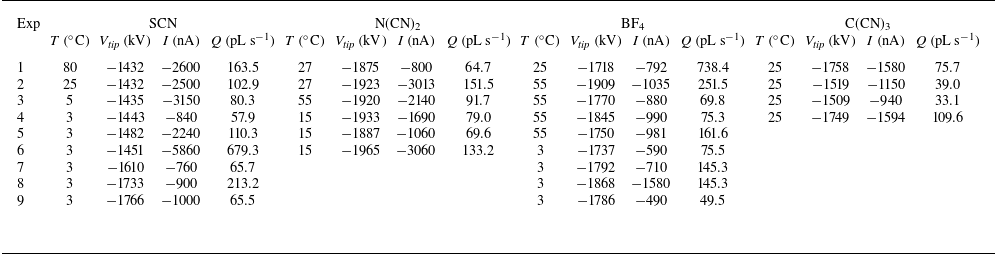
Emitter temperature, voltage, current and calculated flow rate for the various experiments from Figure 3.

During the review process, the peculiar fact that the small particle peak observed in the QI spectra of figure 3
(b) always appears at the same flight time has led one referee to wonder if this minor step might not be an artefact. One plausible explanation of this coincidence would be the fact that the transient jet would tend to have a fixed size, with only its frequency changing as a function of flow rate. Nevertheless, to test the referee’s hypothesis, we have reviewed two existing TOF spectra taken at two different flight distances $L$
under very similar spraying conditions. As shown in figure 6(a), all major features in these spectra coincide when plotted versus
$L$
under very similar spraying conditions. As shown in figure 6(a), all major features in these spectra coincide when plotted versus $t/L$
. However, the two small drop steps appear at exactly the same time in both spectra, and therefore at different
$t/L$
. However, the two small drop steps appear at exactly the same time in both spectra, and therefore at different $t/L$
values (figure 6
b). It is hence quite probable that these drop steps might not be real, in which case we would have reached the PI regime. We have unfortunately no credible hypothesis to explain an artificial step of a few nA at approximately 40
$t/L$
values (figure 6
b). It is hence quite probable that these drop steps might not be real, in which case we would have reached the PI regime. We have unfortunately no credible hypothesis to explain an artificial step of a few nA at approximately 40 $\unicode{x03BC}$
s, nor are we able to carry out new experiments to check if the PI regime had in fact been achieved. Fortunately, this ambiguity forces no revision of our conclusions relating to the QI regime.
$\unicode{x03BC}$
s, nor are we able to carry out new experiments to check if the PI regime had in fact been achieved. Fortunately, this ambiguity forces no revision of our conclusions relating to the QI regime.
7. Conclusions
-
(i) We have selected four ILs of high electrical conductivity and low viscosity in an effort to achieve the PI emission regime from capillaries with diameters of $36\,\unicode{x03BC} \text{m}$
.
$36\,\unicode{x03BC} \text{m}$
. -
(ii) None of these four liquids operates in the PI mode under any of the conditions of flow rate, voltage or temperature tested. Yet, all achieve a peculiar regime referred to as QI, with drop contributions as small as
$0.5\,\%$
of the total current. While the QI regime is inefficient in electrical propulsion applications, a clear transition between the QI and the PI modes has recently been demonstrated for the IL
$ \text{EMI}-C(\text{CN})_3$
when using
$15\,\unicode{x03BC} \text{m}$
capillary tips able to stabilise unusually small liquid flow rates (Caballero-Perez et al. Reference Caballero-Perez, Galobardes-Esteban and Gamero-Castaño2025). -
(ii) Based on characteristics of the QI
$\rightarrow$
PI transition observed by Caballero-Perez et al. (Reference Caballero-Perez, Galobardes-Esteban and Gamero-Castaño2025) and QI mode characteristics found here, we argue that the meniscus in the QI mode is shaped as in the PI mode, involving no jet. The current emission is purely ionic most of the time in both cases, but the excess incoming liquid flow under QI conditions accumulates quasi-steadily in the meniscus, and bursts periodically, releasing the small proportion of drops observed. In this scenario, achieving the QI
$\rightarrow$
PI transition is then just a matter of reducing the flow rate to avoid unsteady meniscus growth and burst. This flow reduction is hopefully attainable by the method of shrinking the capillary tip (Caballero-Perez et al. Reference Caballero-Perez, Galobardes-Esteban and Gamero-Castaño2025), but this point remains to be demonstrated. -
(iv) There are strong indications that the dependence between minimum liquid flow rate and capillary tip diameter found by Caballero-Perez et al. (Reference Caballero-Perez, Galobardes-Esteban and Gamero-Castaño2025) for ILs is due to the same effects previously reported for glycerol by (Scheideler & Chen Reference Scheideler and Chen2014), and for three alcohols by Ponce-Torres et al. (Reference Ponce-Torres, Rebollo-Muñoz, Herrada, Gañán-Calvo and Montanero2018).


Acknowledgements
We are indebted to Professor M. Gamero-Castaño for kindly sharing his notable results with BMI-C(CN) $_3$
prior to their publication.
$_3$
prior to their publication.
Funding
This work was funded by the US AFOSR via contract FA9550-22-1-0097.
Declaration of interests
The authors report no conflict of interest.
Authors contributions
L.J. P.-L. was responsible for all aspects of the experimental apparatus and software for data acquisition and interpretation, has written key parts of the first draft and proposed the notion of a quasi-steady jet-less meniscus. J.F.M. has contributed to the selection of the ILs, written the introduction, contributed to all article sections, developed various aspects of the quasi-steady jet-less meniscus and is responsible for § 5 on viscous effects.
Data availability
Tables of experimental data are available from L.J. P.-L. upon reasonable request.


 Open access