


1 Introduction
With a positive fusion energy output of 3.05 MJ reported at Lawrence Livermore National Laboratory in the United States[ Reference Tollefson and Gibney1, Reference Clery2], this achievement represents the successful ignition of laser inertial confinement fusion. However, the conditions required for successful ignition are extremely stringent. Not only is there a demand for continually increased output capacity, but there is also a need for precise regulation of laser parameters across multiple optical paths. To improve fusion gains and broaden the applications of laser-driven inertial confinement fusion, it is crucial to enhance both the energy output capacity and the repetition rate of laser-driven devices. Accordingly, the development of laser gain materials with high thermal conductivity and large emissive interfaces is essential for increasing ignition success rates and achieving efficient, stable energy gain outputs. New types of laser gain materials, such as Yb:CaF2 crystals, have therefore attracted increasing attention from research teams[ Reference Kessler, Hornung, Keppler, Schorcht, Hellwing, Liebetrau, Körner, Sävert, Siebold, Schnepp, Hein and Kaluza3– Reference Tamer, Keppler, Korner, Hornung, Hellwing, Schorcht, Hein and Kaluza5].
Laser-induced damage to optical components, such as CaF2 crystals, is a critical factor that limits the operational lifetime of high-power laser-driven devices; for example the triplet-frequency fluence of the terminal optical components has nearly reached its laser-induced damage threshold (LIDT)[ Reference Suratwala, Miller, Bude, Steele, Shen, Monticelli, Feit, Laurence, Norton, Carr and Wong6– Reference Zheng, Wei, Zhu, Jing, Hu, Yuan, Dai, Zhou, Wang, Xu, Xie, Feng, Peng, Guo, Chen, Zhang, Liu, Lin, Dang, Xiang, Zhang, Wang, Jia and Deng8]. Numerous studies have examined the laser damage characteristics and mechanisms of CaF2 crystals[ Reference Siebold, Hornung, Boedefeld, Podleska, Klingebiel, Wandt, Krausz, Karsch, Uecker, Jochmann, Hein and Kaluza4, Reference Tamer, Keppler, Korner, Hornung, Hellwing, Schorcht, Hein and Kaluza5, Reference Wang, Wang, Zhang, Zhao, Li, Shai, Qiu, Zhang, Su and Shao9– Reference Lu, Zhang, Jiang, Kou, Zhang, Shan, Li, Xu, Zhao, Wu and Su14]. For example, Wang et al. [ Reference Wang, Wang, Zhang, Zhao, Li, Shai, Qiu, Zhang, Su and Shao9] performed theoretical and experimental analyses of the damage behavior in Er:CaF2 crystals induced by 976 nm continuous-wave pump light, demonstrating that the damage arises from thermal stress effects rather than thermal melting. Moreover, they reported that higher doping concentrations lead to increased absorption and reduced LIDTs. Azumi and Nakahata[ Reference Azumi and Nakahata12] investigated the influence of the laser polarization plane and crystal orientation on the deep ultraviolet damage thresholds of CaF2 crystals, concluding that variations in atomic arrangement and thermal stress associated with laser absorption on different crystallographic planes significantly impact the irradiation resistance of these materials. With the increasing application of CaF2 crystals in high-power laser systems, mitigating laser-induced damage has become essential to extending their service lifetime. Particularly when these crystals function as gain media, damage would trigger cascading failures in subsequent optical components due to additional electric field modulation, thereby posing a significant risk to the entire device. Consequently, the development of non-destructive methods for assessing the laser irradiation resistance of CaF2 is of paramount importance. In particular, with the rapid advancement of artificial intelligence, employing non-destructive evaluation techniques based on neural networks to determine the LIDT for the optical components would substantially extend their service life and lower operating costs for high-power laser-driven devices. However, corresponding research has been unreported.
In this paper, we analyzed the relationship between the photothermal weak absorption of Nd,Y:CaF2 (NYCF) crystal surfaces and their R-on-1 damage thresholds by an in situ testing method, combined with a neural network analysis model, which concluded that this relationship generally satisfied the negative exponential function relationship, but there is considerable dispersion. Furthermore, by adjusting the experimental beam size of the LIDT test, it was found that the dispersions of the corresponding functional relationships were declined by decreasing the experimental beam areas, and it was found that the main reason for this phenomenon was the beam size effect during both test processes. Finally, corresponding relationships between the photothermal weak absorption and the LIDT of the NYCF crystals with different crystals orientations were also examined; the test results demonstrated that under identical photothermal weak absorption conditions, the {111} plane exhibited the lowest LIDT, while the {110} plane had the highest value. By analyzing the difference in the mechanical properties across various crystal axis orientations, the corresponding damage mechanisms were explored. This study not only establishes a series of non-destructive testing techniques for Nd,Y:CaF2 crystals but also provides additional material characteristic information to facilitate their expanded applications in high-power laser-driven devices.
2 Experiment setup
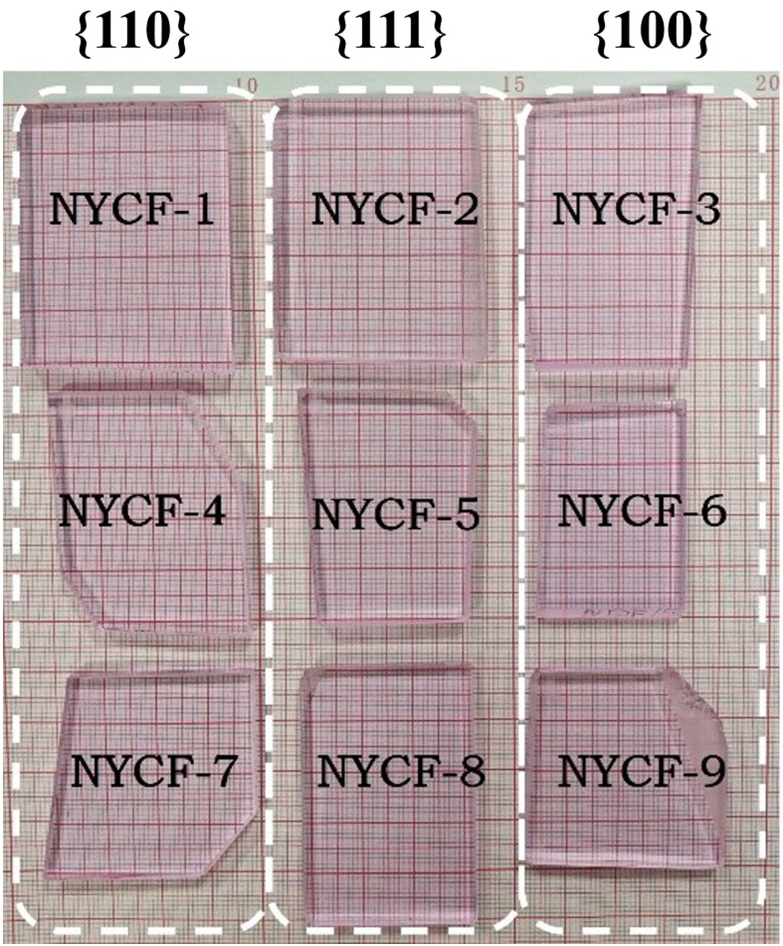
In this study, 0.5% Nd and 5% Y co-doped NYCF crystals prepared via the vertical Bridgman method were selected as test samples. NYCF crystals featuring {100}, {110} and {111} planes were obtained with approximate dimensions of 30 mm × 50 mm × 3 mm (as shown in Figure 1), and the laser irradiation surfaces of all samples were uniformly precision polished. Although the dimensions of each NYCF sample varied, to enhance the reliability of artificial intelligence analysis when utilizing neural networks for evaluating the impact of spot size and crystal orientation on the relationship between weak absorption and damage thresholds, it was necessary to maintain a consistent number of test points and corresponding training volume for each sample under the respective test conditions. The following section provides a detailed description of the test locations and associated requirements.
NYCF crystals with {110}, {111} and {100} planes.

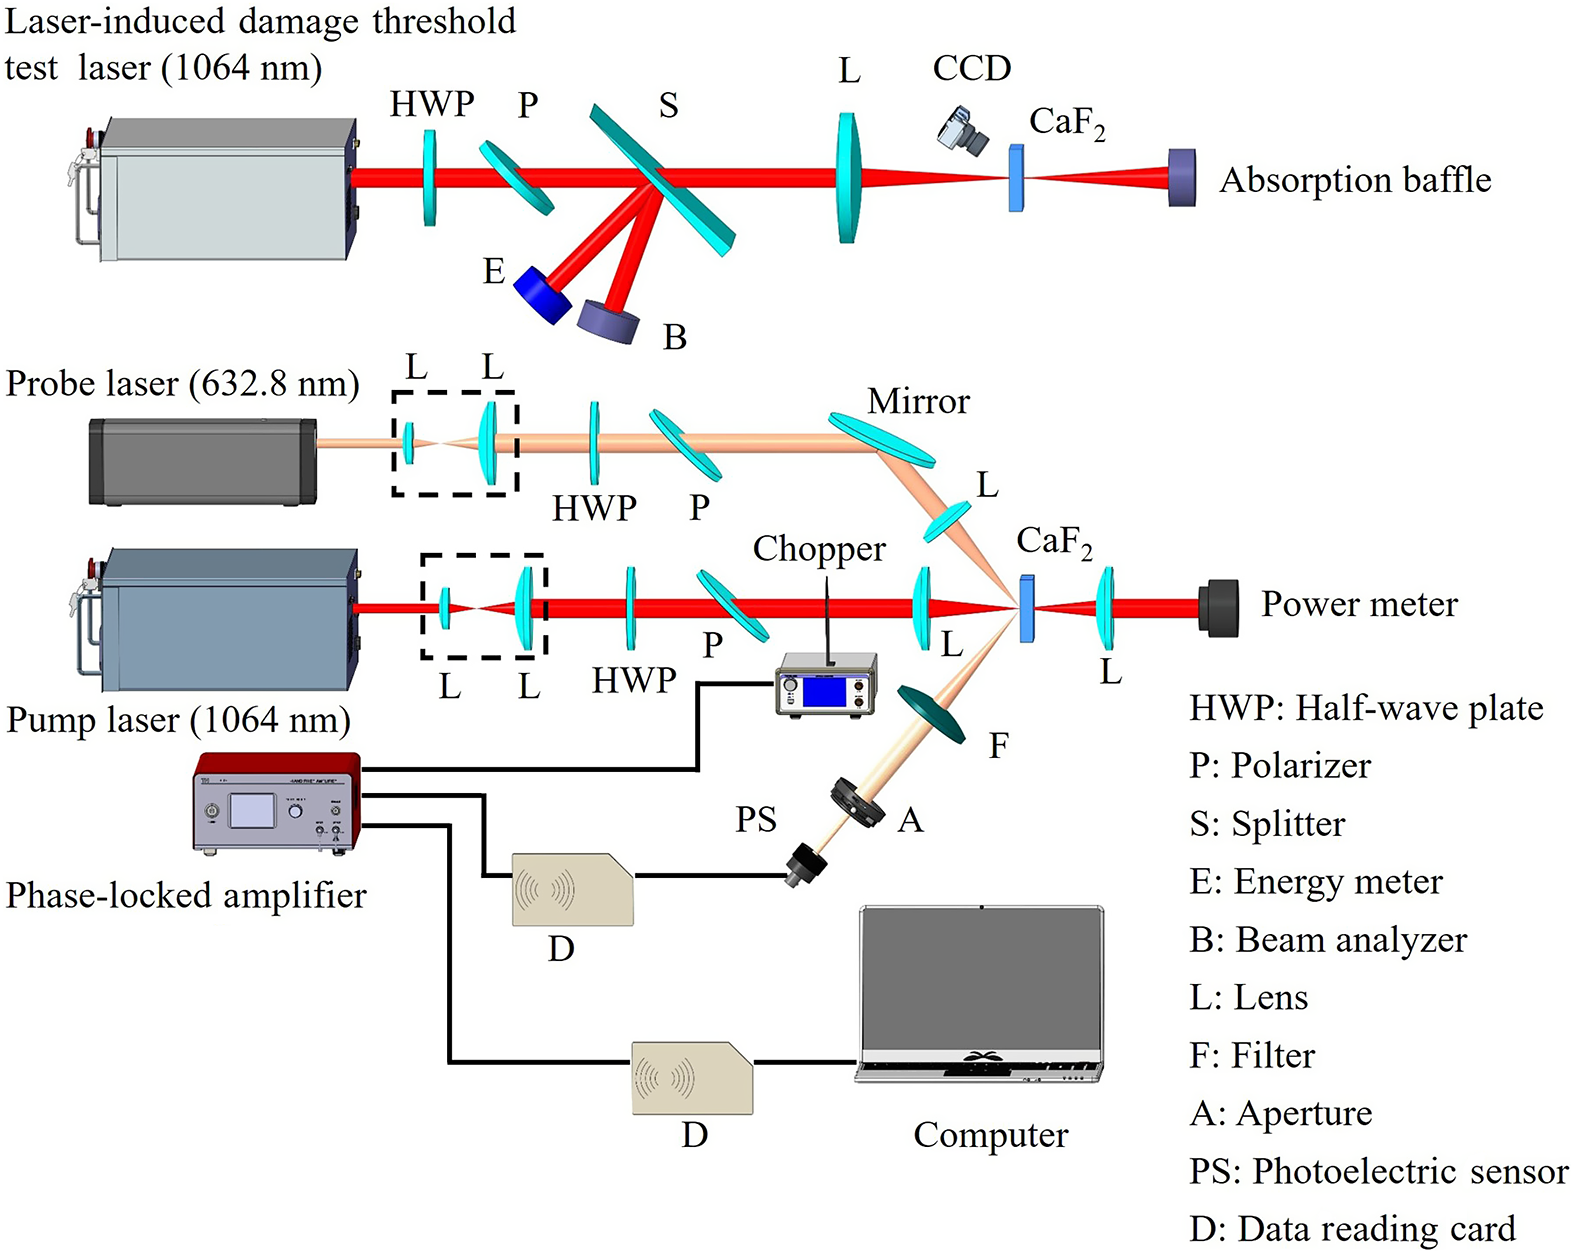
The photothermal weak absorption characteristics of each NYCF crystal were measured using a photothermal weak absorption instrument (ZC Optoelectronic Technologies Ltd, China). The pump laser – a neodymium-doped yttrium aluminum garnet (Nd:YAG) quasi-continuous light source operating at 2.5 W with a beam diameter of 80 μm – interacts with various defects on the test sample’s surface, inducing a localized temperature increase. This thermal effect causes the probe beam (a He-Ne laser with a wavelength of 632.8 nm and a power of 0.6 W) to diverge. The resulting thermal weak absorption values at the detection position were calculated[ Reference Chen, Dong, Zhang and Wu15], as shown in Figure 2.
Schematic diagram of the photothermal weak absorption and laser-induced damage threshold test system.

For the LIDT tests on each NYCF crystal, a TEM00 mode, Q-switched Nd:YAG laser was employed for irradiation (as shown in Figure 2). The laser operated at a wavelength of 1064 nm with a pulse duration of 8 ns (full width at half-maximum). The near-field beam exhibited a Gaussian distribution with a diameter of 7.6 mm at the 1/e intensity level. Incident laser energy was adjustable using a half-wave plate and a polarizer, while both the beam area and energy were simultaneously recorded with a beam analyzer (S-WCD-LCM) and an energy meter (LBPEM45-K). A lens with a focal length of 500 mm focused the incident laser beam, and through adjusting the relative position between the focusing lens and the test sample, the beam diameters at the 1/e position on the input surfaces were set as 0.21, 0.3 and 0.39 mm, respectively. To minimize the influence of internal defects in the NYCF crystal bulks on the test results, both photothermal weak absorption and the LIDT measurements were conducted on the input surface of the crystals. Finally, a charge-coupled device (CCD) camera with 5× magnification was positioned in front of the input surface of each crystal to monitor the laser-induced damage characteristics.
To establish an accurate correlation between photothermal weak absorption and the LIDTs of NYCF crystals, the R-on-1 laser-induced damage testing method was employed to evaluate the crystals’ laser damage resistance[ 16]. Specifically, multiple laser pulses were directed at the same location on the NYCF crystal surfaces, with each subsequent pulse incrementally increasing the incident energy by a fixed fluence step of 0.1 J/cm2 until laser-induced damage was observed. The highest fluence at which no damage occurred was recorded as the LIDT for that test position. This methodology enables the determination of LIDT values for each photothermal weak absorption site on the input surfaces of the NYCF crystals. It was worth noting that the repetition frequency would notably influence test outcomes. In high-repetition-rate laser irradiation, certain defects might be modified, including changes in their photothermal weak absorption characteristics. To address potential variations in photothermal weak absorption induced by defects under high-repetition-rate conditions, which could compromise the accuracy of the relationship between photothermal weak absorption and the LIDT, the R-on-1 laser damage threshold tests described herein utilize single-pulse laser irradiation. Following each pulse, the sample is examined for laser damage, and the laser fluence is then adjusted for subsequent tests.
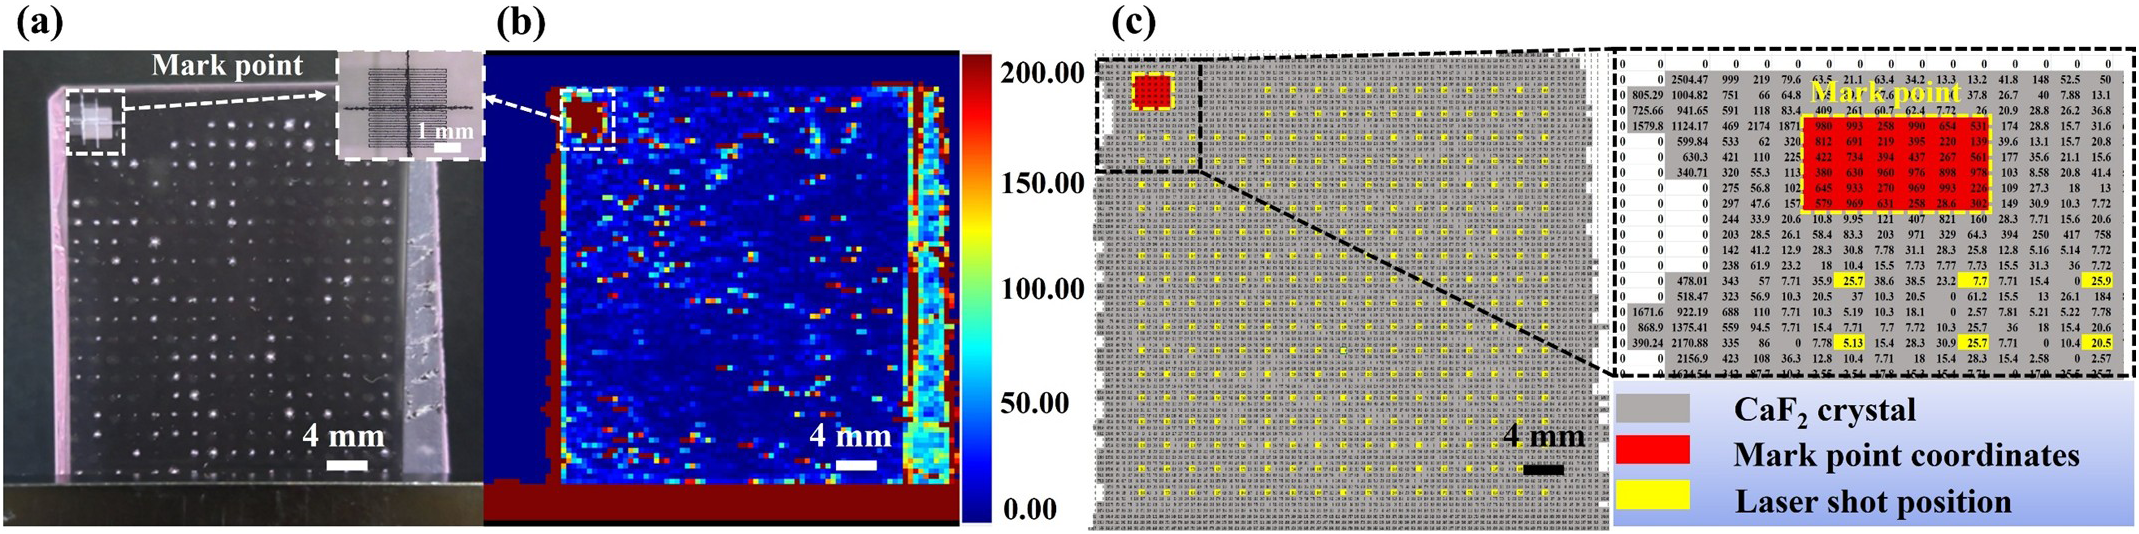
It is noteworthy that during the transition from the photothermal weak absorption measurement to the LIDT test, the NYCF crystals were not repeatedly wiped or subjected to any operations that might induce surface contamination. Instead, each crystal, after completing the photothermal weak absorption measurement, was directly transferred to the laser damage testing platform to undergo in situ LIDT evaluations. Moreover, to ensure that the photothermal weak absorption coordinates aligned with the LIDT test positions, thus allowing for a direct correlation between the photothermal weak absorption data and the LIDT values, a femtosecond pulsed laser (pulse duration: 190 fs, output power: 3 W) was used to mark specific points on the input surfaces of each NYCF crystal, as illustrated in Figure 3. Based on the distribution of photothermal weak absorption characteristics and subsequent LIDT test results, it is evident that the strong absorption points on the surface of NYCF crystals were randomly distributed. The reason for this experimental phenomenon is that the nanosecond pulsed lasers induce damage on the NYCF crystal surfaces primarily by the defect precursor with high absorbance properties. Therefore, accurate characterization of these defects is critical for determining their LIDTs. In this study, conventional mechanical polishing was employed to process the NYCF crystal surfaces, which results in the introduction of two principal defect types. The first type comprises structural defects, such as pits and microcracks, that occur on both the surface and subsurface due to uneven force application and deviations in the polishing machine’s control precision. The second type arises from residual polishing fluid that adheres to the NYCF crystal surface post-polishing[ Reference Reichling, Sils, Johansen and Matthias17]. These different kinds of defects vary in size, display distinct absorption characteristics and exhibit different laser damage thresholds. Moreover, because they were randomly distributed across the crystal surface, in situ measurements reveal that the distribution of photothermal weak absorption and the corresponding damage thresholds were also random.
Photothermal weak absorption and damage threshold test coordinate relationship: (a) test sample (NYCF-2); (b) photothermal weak absorption test results; (c) relative relationship between sample marking points and the irradiation area.

These marker points were simultaneously observed via a CCD camera on the LIDT test platform and by the photothermal weak absorption test (which measures the regions of strong absorption). This simultaneous observation enables the establishment of a relative coordinate system between each test point and the marker points, thereby facilitating the calibration and alignment of the photothermal weak absorption grid coordinates with the laser irradiation positions of the LIDT tests. Finally, to ensure an adequate amount of experimental data for artificial intelligence analysis and to prevent the influence of adjacent beams on the overall LIDT test results, the distance between two adjacent beams in the LIDT test was set to 10 times the test beam size. Notably, during testing, the photothermal weak absorption values and the sizes of laser-induced damages were not directly correlated (see Figures 3(a) and 3(b)). This discrepancy primarily arises because the damage from nanosecond pulsed lasers is predominantly due to defect precursors absorbing laser energy. These precursors not only vary in size and morphology but are also randomly distributed on the surface and within the subsurface of the crystal[ Reference Bataviciute, Sciuka and Melninkaitis18, Reference Laurence, Bude, Ly, Shen and Feit19]. Consequently, some defect precursors with strong absorption properties reside on the sample surface, leading to high photothermal weak absorption values; however, under near-threshold fluence irradiation, the resulting laser-induced damage to these surface defect precursors minimally impacts the surrounding area, yielding relatively small damage sizes. In contrast, defect precursors embedded deep within the crystal’s subsurface exhibit lower photothermal weak absorption values, but once damaged, they can cause irreversible structural damage to the surrounding substrate, resulting in significantly larger damage sizes.
3 Experimental results and discussion
3.1 Regression analysis of the relationship between the photothermal weak absorptions and the LIDTs based on machine learning
The photothermal weak absorption and the LIDT of NYCF crystals were measured using the proposed system to elucidate the mapping relationship between these parameters. Previous work[ Reference Lu, Zhang, Jiang, Kou, Zhang, Xu, Zhao, Wu and Su20] indicated that the relationship between photothermal weak absorption and LIDTs on CaF2 crystal surfaces followed a Chapman function trend. In contrast, the dataset collected in this study is considerably richer, resulting in fitted data that exhibit substantial dispersion. In fact, when handling a large dataset, the limited fitting parameters of the traditional Chapman function become insufficient to capture all the corresponding relationships and nuances between photothermal weak absorption and LIDTs[ Reference Williams and Rasmussen21]. Consequently, this approach does not reliably support the non-destructive assessment of the surface damage threshold of CaF2 crystals. Compared with relying on a specific functional form, machine learning algorithms offer a more robust nonlinear fitting tool for analyzing variable mapping relationships under complex trends[ Reference Breiman22, Reference Tipping23].
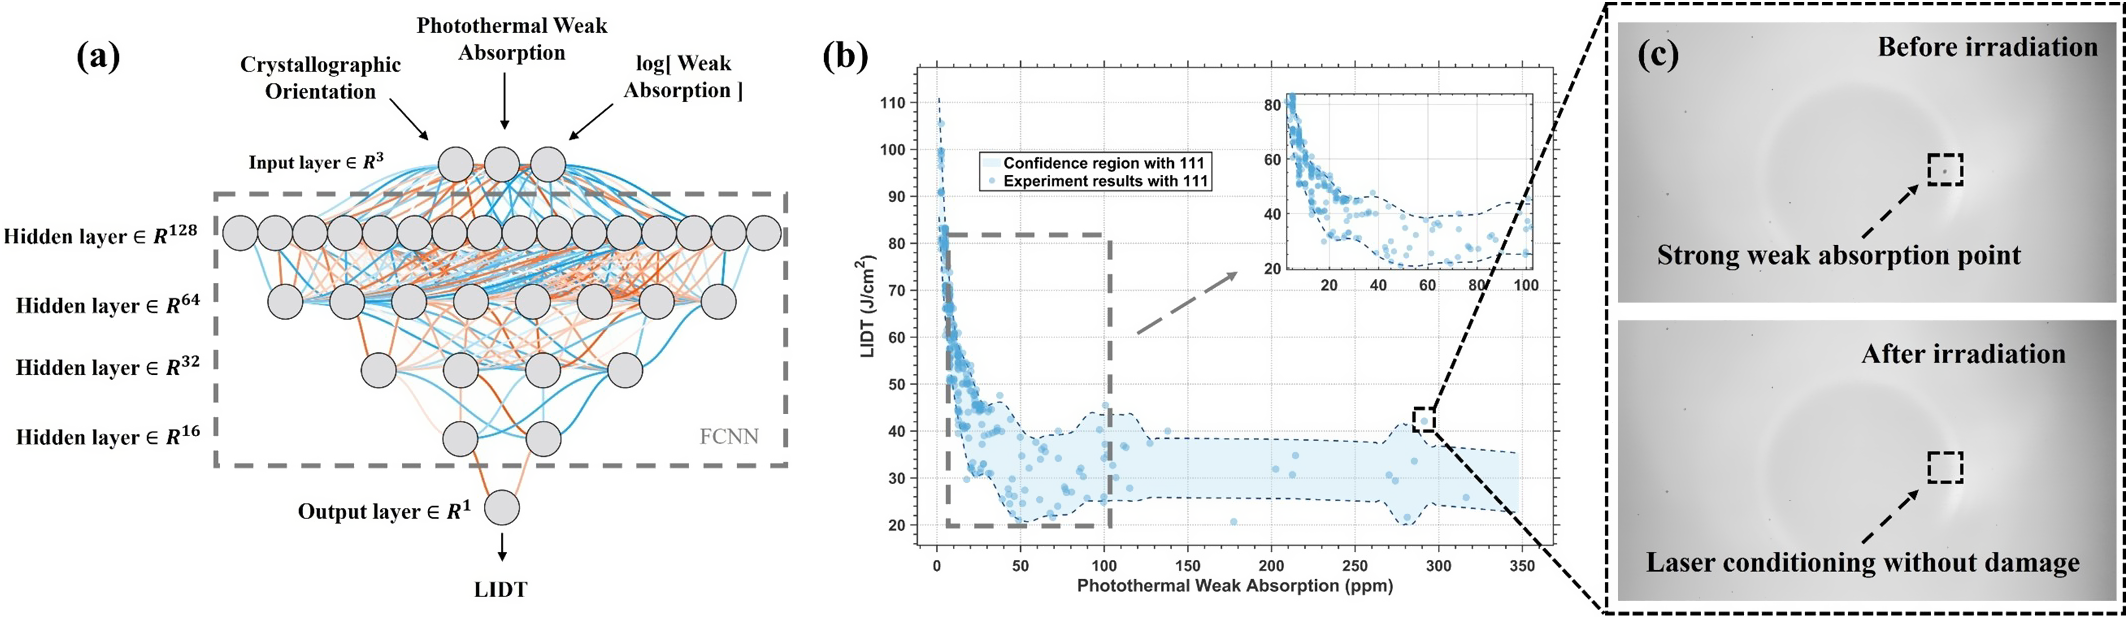
From a machine learning perspective, the mapping between photothermal weak absorption values and LIDTs represents a regression task. Given that the inputs to the machine learning architecture are characterized by diverse data types, intricate nonlinear relationships and supplementary physical prior knowledge, a fully connected neural network (FCNN) – a classical algorithm commonly employed for regression tasks – was selected as the architecture of choice. Figure 4(a) presents a schematic diagram of the FCNN architecture used to establish the mapping between photothermal weak absorptions and LIDTs in an NYCF crystal (111) sample (NYCF-2). The network accepts the experimentally measured photothermal weak absorption values as input and, through iterative computation, outputs a predicted LIDT. A mean squared error (MSE) function, defined between these predicted LIDTs and the experimental LIDT measurements, serves as the loss function. Previous studies[ Reference Williams and Rasmussen21] have indicated an exponential relationship between photothermal weak absorption and LIDTs; therefore, the data were augmented via a logarithmic transformation[ Reference Shorten and Khoshgoftaar24] to reduce the complexity of network training. The hidden layer dimensions were configured as 128, 64, 32 and 16, respectively. It is worth noting that the number of computational layers plays a critical role in determining prediction outcomes. Although increasing the depth of these layers can reduce training loss and yield relatively accurate predictions on the dataset, overly deep architectures run the risk of overfitting. Consequently, indefinitely increasing the number of layers does not necessarily lead to enhanced prediction accuracy. A total of 200 training samples were employed, with an initial learning rate of 0.0005. The Adam optimizer was used to compute gradients and update network parameters. The network implementation was carried out using PyTorch and accelerated with a GeForce RTX 3060 GPU.
(a) Schematic of the FCNN for predicting photothermal weak absorption-LIDT mapping. (b) Predicted LIDT results from models trained on single-crystal CaF2 (111) axes versus experimental data. (c) Removal effect of strong photothermal absorption points after laser irradiation.

Figure 4(b) displays the relationship between the LIDT values of NYCF crystal (111) predicted by the neural network model and the scatter plot data of damage thresholds obtained through empirical testing. The curve indicates that the mapping from photothermal weak absorption to the LIDTs, as predicted by the neural network, does not entirely correspond with the Chapman function. Specifically, in the high photothermal weak absorption region (above 100 parts per million (ppm)), the LIDTs do not continue to decrease indefinitely; rather, they tend to stabilize. Furthermore, there were some distortion points with relatively high LIDT test values. This observation is primarily attributed to the fact that, during photothermal weak absorption testing, the sample surface often accumulates impurities with strong absorption characteristics, such as dust. Although these impurities typically exhibit weak adhesion, they can nonetheless produce significant photothermal weak absorption effects. In contrast, during laser damage testing, such impurities are removed by laser irradiation and therefore do not play a determinative role in the laser-induced damage process of NYCF crystals. This phenomenon is frequently observed in LIDT testing, where impurities visible via CCD imaging prior to irradiation disappear afterward (as shown in Figure 4(c)), a removal effect also exploited in laser conditioning to cleanse the sample surface through the laser shock effect[ Reference Runkel, Neeb, Staggs, Auerbach and Burnham25, Reference Adams, Weiland, Stanley, Sell, Luthi, Vickers, Carr, Feit, Rubenchik, Spaeth and Hackel26]. Although all the NYCF crystal surfaces underwent isopropyl alcohol cleaning before both the photothermal weak absorption and LIDT assessments, not all surface defects were completely removed, indicating that these defects possess a notable degree of adhesion. Following laser irradiation, subsequent CCD observations confirmed the removal of these defects, and no laser-induced damage was detected on the NYCF crystal surfaces. This mechanism demonstrates a viable method for improving the LIDT of optical component surfaces via laser conditioning, specifically, a laser cleaning process. In this process, the laser shock effect generated during laser irradiation effectively removes impurities with strong absorption characteristics, thereby explaining why the removal of such defects results in higher LIDT values at the laser damage tested locations. However, laser conditioning treatment cannot entirely eliminate all surface defects; rather, it primarily removes those with relatively low adhesion and simpler structural characteristics. Notably, the LIDT values maintained a stable dynamic range in regions with higher weak absorption, and these values are critical parameters in determining the sample’s ultimate resistance to laser irradiation.
Furthermore, data acquired from experimental observations exhibit significant oscillatory distribution characteristics across various photothermal weak absorption intervals. Attempts to model all LIDT values using a single curve risk overfitting the prediction model. Accordingly, a more robust approach involves providing a confidence interval for the prediction curve based on the intrinsic characteristics of the data distribution, thereby offering statistically meaningful guidance for predicting the LIDT from photothermal weak absorption. Notably, the recorded photothermal weak absorption values are not uniformly distributed between 0 and 300 ppm but rather follow a random density distribution. In this context, the density of the experimentally acquired weak absorption data, ${\rho}_{\mathrm{data}}(x)$
, is defined using Gaussian kernel density estimation (KDE):
${\rho}_{\mathrm{data}}(x)$
, is defined using Gaussian kernel density estimation (KDE):
 $$\begin{align}{\rho}_{\mathrm{data}}(x)=\frac{1}{N}\sum \limits_N^{i\in N}\exp \left[-{\left(\frac{x_i-x}{\omega}\right)}^2\right],\end{align}$$
where $\omega$
denotes the bandwidth of the photothermal weak absorption interval used for calculation and
$\omega$
denotes the bandwidth of the photothermal weak absorption interval used for calculation and $N$
represents the number of photothermal weak absorption data points within that interval. Here,
$N$
represents the number of photothermal weak absorption data points within that interval. Here, ${x}_i$
indicates the photothermal weak absorption value at the current iteration step
${x}_i$
indicates the photothermal weak absorption value at the current iteration step $i$
in the summation, while
$i$
in the summation, while $x$
corresponds to the photothermal weak absorption value at the center of the current interval. The parameter
$x$
corresponds to the photothermal weak absorption value at the center of the current interval. The parameter $\omega$
was set to 3% of the interpolation between the maximum and minimum photothermal weak absorption values.
$\omega$
was set to 3% of the interpolation between the maximum and minimum photothermal weak absorption values.
After computing ${\rho}_{\mathrm{data}}(x)$
for all photothermal weak absorption values, the envelope width of the network prediction at the current photothermal weak absorption value
${\rho}_{\mathrm{data}}(x)$
for all photothermal weak absorption values, the envelope width of the network prediction at the current photothermal weak absorption value $x$
, denoted as
$x$
, denoted as ${W}_{\mathrm{envelop}}(x)$
, is defined as follows:
${W}_{\mathrm{envelop}}(x)$
, is defined as follows:
 $$\begin{align}{W}_{\mathrm{envelop}}(x)=\frac{1}{2}+\frac{1}{2}\left[1-{\tilde{\rho}}_{\mathrm{data}}(x)\right]\times \mathrm{std}\left(x,\omega \right),\end{align}$$
where $\tilde{\rho}_{\mathrm{data}}$
represents the normalized data density and
$\tilde{\rho}_{\mathrm{data}}$
represents the normalized data density and $\omega$
represents the bandwidth of the interval for the current photothermal weak absorption value.
$\omega$
represents the bandwidth of the interval for the current photothermal weak absorption value.
The region bounded by the dashed lines in Figure 4(b) indicates the fluctuation range of the LIDT predicted by the trained model for the NYCF crystal. This signifies that the objective of the current model is not to provide a one-to-one mapping from photothermal weak absorption to the LIDT test results, but rather to provide a confidence interval. Consequently, the model achieves sufficient prevention and suppression of overfitting[ Reference Barber, Candes, Ramdas and Tibshirani27, Reference Gal and Ghahramani28]. Moreover, as Figure 4(b) demonstrates, the discrete points near 175 and 275 ppm, which fall outside the predicted confidence interval, strongly validate the efficacy and rationale of our confidence interval approach based on data density. These outliers result from the uneven distribution of data across intervals. Specifically, the outlier near 175 ppm is situated in a sparsely populated region, where insufficient neighboring data lead the model to assign a narrower confidence interval, causing the observation to fall outside this interval. This behavior illustrates that the proposed method does not force a fit for extreme fluctuations in regions with inadequate data support; rather, it authentically signals such risks through the confidence interval. In contrast, the anomaly near 275 ppm is found in a densely populated region, prompting the model to assign a wider confidence interval that effectively encompasses most data fluctuations, including the anomaly itself.
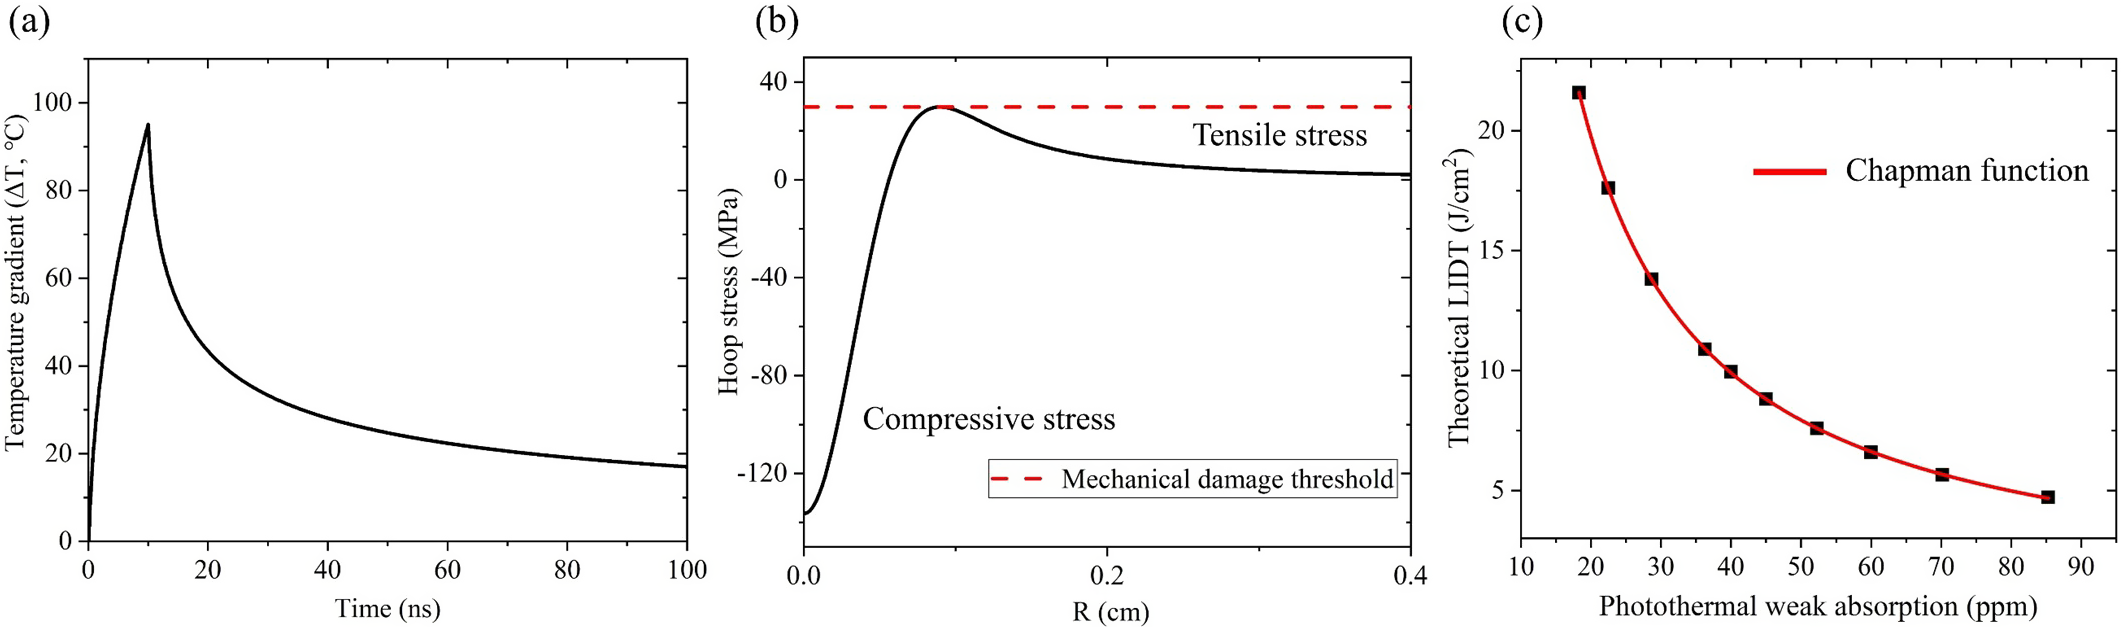
To analyze the underlying physical mechanisms of damage and to validate the accuracy of our artificial intelligence analysis model, we conducted a theoretical analysis of the relationship between photothermal weak absorption and the LIDT. Laser-induced damage in CaF2 primarily arises from temperature elevation due to surface defects that absorb laser energy. This absorption leads to the formation of temperature gradients, which in turn create thermal stresses resulting in mechanical damage[ Reference Li, Kang, Han, Zheng and Su29]. Consequently, we integrated the photothermal weak absorption data obtained from the damage threshold test sites into our damage theory analyses and computational models. Initially, the material heating process during laser irradiation of the NYCF crystal was analyzed using the Fourier heat conduction differential equation with appropriate boundary and initial conditions. By employing Green’s function method, we derived the analytical solution to this differential equation as follows:
 $$\begin{align}&\Delta T\left(\overrightarrow{r},t\right)=\frac{A_i\left(1-{r}_f\right){I}_0{R}^2}{k}\nonumber\\& \quad \times\sqrt{\frac{\alpha }{\pi }}{\int}_{\tau =0}^t \frac{\mathrm{exp}\left[-\frac{x^2+{y}^2}{4\alpha \left(t-\tau \right)+{R}^2}\right]\mathrm{exp}\left[-\frac{z^2}{4\alpha \left(t-\tau \right)}\right]}{\sqrt{t-\tau}\times \left[4\alpha \left(t-\tau \right)+{R}^2\right]}f\left(\tau \right)\mathrm{d}\tau,\end{align}$$
where ${A}_i$
,
${A}_i$
, ${r}_f$
,
${r}_f$
, ${I}_0$
,
${I}_0$
, $R$
and
$R$
and $\tau$
represent the absorption coefficient, reflectance, incident laser intensity, radius of incident laser beam and the pulsed duration, respectively;
$\tau$
represent the absorption coefficient, reflectance, incident laser intensity, radius of incident laser beam and the pulsed duration, respectively; $f\left(\tau \right)$
represents the temporal function of incident laser and
$f\left(\tau \right)$
represents the temporal function of incident laser and $\alpha =k/\rho c$
denotes the thermal diffusivity (where
$\alpha =k/\rho c$
denotes the thermal diffusivity (where $k$
,
$k$
, $\rho$
and
$\rho$
and $c$
represent the thermal conductivity, density and specific heat, respectively). From this, we can derive the temperature gradient induced under fixed incident laser fluence conditions, as illustrated in Figure 5(a).
$c$
represent the thermal conductivity, density and specific heat, respectively). From this, we can derive the temperature gradient induced under fixed incident laser fluence conditions, as illustrated in Figure 5(a).
(a) Laser-induced temperature variation in NYCF crystals. (b) The associated variation in thermal stress within these crystals. (c) The relationship between photothermal weak absorption and the theoretical laser-induced damage threshold.

Subsequently, we substitute the temperature gradient $\Delta T$
into the thermal-elastic theory, enabling the calculation of thermal stresses induced by the thermal gradient:
$\Delta T$
into the thermal-elastic theory, enabling the calculation of thermal stresses induced by the thermal gradient:
 $$\begin{align}\sigma =\frac{\beta E}{1-\upsilon}\left(\frac{1}{R^2}{\int}_0^R\Delta T\times r\mathrm{d}r+\frac{1}{r^2}{\int}_0^r\Delta T\times r\mathrm{d}r-\Delta T\right),\end{align}$$
where $\beta$
,
$\beta$
, $E$
and
$E$
and $\upsilon$
are the thermal expansion coefficient, Young’s modulus and Poisson’s ratio, respectively. This enables us to obtain the specific numerical values for the thermal gradient induced by the incident laser intensity converted into thermal stress, as illustrated in Figure 5(b).
$\upsilon$
are the thermal expansion coefficient, Young’s modulus and Poisson’s ratio, respectively. This enables us to obtain the specific numerical values for the thermal gradient induced by the incident laser intensity converted into thermal stress, as illustrated in Figure 5(b).
Because the tensile strength (34 MPa) of the CaF2 crystal is significantly lower than its compressive strength (300 MPa), the hoop stress is the most critical factor likely to initiate mechanical failure. Accordingly, by using the hoop stress threshold (34 MPa) as a reference and accounting for the spatial variations in photothermal weak absorption, the corresponding LIDT can be theoretically derived via inverse calculation. It is important to note that the photothermal weak absorption testing method employed in this study is a relative measurement technique. Initially, the theoretical absorption coefficient ( $T={e}^{- Ad}$
) for the NYCF crystal is calculated based on its previously recorded transmission spectrum. The photothermal weak absorption values measured at the transmission position of the NYCF sample serve as the standard reference. Under identical testing conditions – using a 2.5 W Nd:YAG quasi-continuous pump beam and a 0.6 W He-Ne probe beam at 632.8 nm – the photothermal weak absorption values obtained from different positions on other NYCF crystal samples are scaled proportionally against the standard. This process yields the corresponding absorption coefficients (
$T={e}^{- Ad}$
) for the NYCF crystal is calculated based on its previously recorded transmission spectrum. The photothermal weak absorption values measured at the transmission position of the NYCF sample serve as the standard reference. Under identical testing conditions – using a 2.5 W Nd:YAG quasi-continuous pump beam and a 0.6 W He-Ne probe beam at 632.8 nm – the photothermal weak absorption values obtained from different positions on other NYCF crystal samples are scaled proportionally against the standard. This process yields the corresponding absorption coefficients ( ${A}_i$
) for each test position[
Reference Welsch and Ristau30], which are then incorporated into the calculation formula. In this study, 10 distinct positions from the same NYCF crystal sample were selected to convert the photothermal weak absorption values into theoretical laser damage thresholds (
${A}_i$
) for each test position[
Reference Welsch and Ristau30], which are then incorporated into the calculation formula. In this study, 10 distinct positions from the same NYCF crystal sample were selected to convert the photothermal weak absorption values into theoretical laser damage thresholds ( $\mathrm{LIDT}_{\mathrm{theory}}$
), as illustrated in Figure 5(c).
$\mathrm{LIDT}_{\mathrm{theory}}$
), as illustrated in Figure 5(c).
It could be observed that higher photothermal weak absorption values correspond to lower theoretical fluences ( $\mathrm{LIDT}_{\mathrm{theory}}$
) required to induce laser damage. Furthermore,
$\mathrm{LIDT}_{\mathrm{theory}}$
) required to induce laser damage. Furthermore, $\mathrm{LIDT}_{\mathrm{theory}}$
approximates the Chapman function with respect to photothermal weak absorption (
$\mathrm{LIDT}_{\mathrm{theory}}$
approximates the Chapman function with respect to photothermal weak absorption ( $\mathrm{LIDT}_{\mathrm{theory}}=a{\left(1-{e}^{-b\times x}\right)}^c$
, where
$\mathrm{LIDT}_{\mathrm{theory}}=a{\left(1-{e}^{-b\times x}\right)}^c$
, where $\mathrm{LIDT}_{\mathrm{theory}}$
is the theoretical laser damage threshold,
$\mathrm{LIDT}_{\mathrm{theory}}$
is the theoretical laser damage threshold, $x$
is the photothermal weak absorption,
$x$
is the photothermal weak absorption, $a$
,
$a$
, $b$
and
$b$
and $c$
represent the fitting parameters), a trend that aligns closely with experimental findings. It was worth noting that the theoretical calculations yield values of the LIDTs slightly lower than those obtained by experiments. This discrepancy primarily arises because the theoretical model pertains to single-pulse laser damage (i.e., a one-on-one test method where each test position is irradiated by a single shot), whereas the experimental results employed the R-on-1 test method, which incorporates laser conditioning effects[
Reference Runkel, Neeb, Staggs, Auerbach and Burnham25,
Reference Adams, Weiland, Stanley, Sell, Luthi, Vickers, Carr, Feit, Rubenchik, Spaeth and Hackel26]; meanwhile, the theoretical calculations for single-pulse laser damage thresholds assume that the laser damage occurs at the center of the incident laser beam with a peak fluence. In practical LIDT testing, defect damage occurs randomly within the laser beam, with some defects manifesting at the beam periphery where the fluence is lower. Inducing such peripheral defects requires a higher incident laser fluence, thereby leading to an overestimated laser damage threshold in practical testing. In Ref. [Reference Lu, Zhang, Jiang, Kou, Zhang, Xu, Zhao, Wu and Su20], a similar experimental phenomenon was observed, indicating that the photothermal weak absorption characteristics of NYCF play a pivotal role in determining its LIDT. This paper further elucidates the physical processes and mechanisms by which photothermal weak absorption influences LIDT test results.
$c$
represent the fitting parameters), a trend that aligns closely with experimental findings. It was worth noting that the theoretical calculations yield values of the LIDTs slightly lower than those obtained by experiments. This discrepancy primarily arises because the theoretical model pertains to single-pulse laser damage (i.e., a one-on-one test method where each test position is irradiated by a single shot), whereas the experimental results employed the R-on-1 test method, which incorporates laser conditioning effects[
Reference Runkel, Neeb, Staggs, Auerbach and Burnham25,
Reference Adams, Weiland, Stanley, Sell, Luthi, Vickers, Carr, Feit, Rubenchik, Spaeth and Hackel26]; meanwhile, the theoretical calculations for single-pulse laser damage thresholds assume that the laser damage occurs at the center of the incident laser beam with a peak fluence. In practical LIDT testing, defect damage occurs randomly within the laser beam, with some defects manifesting at the beam periphery where the fluence is lower. Inducing such peripheral defects requires a higher incident laser fluence, thereby leading to an overestimated laser damage threshold in practical testing. In Ref. [Reference Lu, Zhang, Jiang, Kou, Zhang, Xu, Zhao, Wu and Su20], a similar experimental phenomenon was observed, indicating that the photothermal weak absorption characteristics of NYCF play a pivotal role in determining its LIDT. This paper further elucidates the physical processes and mechanisms by which photothermal weak absorption influences LIDT test results.
However, the experimental results presented in this study indicate that the relationship between the photothermal weak absorption of the NYCF crystals and the LIDT does not fully adhere to the predictions of the Chapman function, and the research paradigm adopted in this study differs fundamentally from that of Ref. [Reference Laurence, Bude, Ly, Shen and Feit19]. By employing our well-established in situ photothermal weak absorption and LIDT testing system, we extracted over 200 one-to-one corresponding data points from a single test specimen. This enabled an in-depth investigation of the statistical distribution patterns of the LIDT within a fixed material system. We utilized an FCNN as a robust, data-driven tool to perform machine learning regression analysis on the customized dataset. Unlike the predefined functional forms used in Ref. [Reference Laurence, Bude, Ly, Shen and Feit19], our neural network autonomously learned the mapping relationships from the data through complex, nonlinear transformations. Moreover, the network’s input layer incorporated three critical features to comprehensively characterize the physical state: the measured photothermal weak absorption values ( $x$
), their logarithmic transformation (
$x$
), their logarithmic transformation ( $\log \left(x\right)$
) and the crystal orientation (encoded as a categorical variable). The network architecture consists of input, hidden and output layers:
$\log \left(x\right)$
) and the crystal orientation (encoded as a categorical variable). The network architecture consists of input, hidden and output layers:
 $$\begin{align}{\boldsymbol{x}}_{\mathrm{input}}={\left[x,\log (x),\mathrm{OneHot}\left(\mathrm{Orientation}\right)\right]}^{\mathrm{T}}.\end{align}$$
The input vector ${\boldsymbol{x}}_{\mathrm{input}}\in {\mathbb{R}}^{{3}}$
comprises four hidden layers:
${\boldsymbol{x}}_{\mathrm{input}}\in {\mathbb{R}}^{{3}}$
comprises four hidden layers:
 $$\begin{align}\begin{array}{@{}lll@{}}{\boldsymbol{h}}^{(1)}=\mathrm{Relu}\left({\boldsymbol{W}}^{(1)}{\boldsymbol{x}}_{\mathrm{input}}+{\boldsymbol{b}}^{(1)}\right),& {\boldsymbol{W}}^{(1)}\in{\mathbb{R}}^{128\times 3},& {\boldsymbol{b}}^{(1)}\in{\mathbb{R}}^{128},\\ {\boldsymbol{h}}^{(2)}=\mathrm{Relu}\left({\boldsymbol{W}}^{(2)}{\boldsymbol{h}}^{(1)}+{\boldsymbol{b}}^{(2)}\right),& {\boldsymbol{W}}^{(2)}\in{\mathbb{R}}^{64\times 128},& {\boldsymbol{b}}^{(2)}\in{\mathbb{R}}^{64},\\ {\boldsymbol{h}}^{(3)}=\mathrm{Relu}\left({\boldsymbol{W}}^{(3)}{\boldsymbol{h}}^{\left({2}\right)}+{\boldsymbol{b}}^{(3)}\right),& {\boldsymbol{W}}^{(3)}\in{\mathbb{R}}^{32\times 64},& {\boldsymbol{b}}^{(3)}\in{\mathbb{R}}^{32},\\ {\boldsymbol{h}}^{(4)}=\mathrm{Relu}\left({\boldsymbol{W}}^{(4)}{\boldsymbol{h}}^{(3)}+{\boldsymbol{b}}^{(4)}\right),& {\boldsymbol{W}}^{(4)}\in{\mathbb{R}}^{16\times 32},& {\boldsymbol{b}}^{(4)}\in{\mathbb{R}}^{16}.\end{array}\end{align}$$
Here, $\boldsymbol{h}$
denotes the intermediate layer output and
$\boldsymbol{h}$
denotes the intermediate layer output and $\mathrm{Relu}(.)$
represents the nonlinear activation function. In addition,
$\mathrm{Relu}(.)$
represents the nonlinear activation function. In addition, $\boldsymbol{W}$
and
$\boldsymbol{W}$
and $\boldsymbol{b}$
correspond to the weighting factors and bias, respectively, for the network under training. Finally, the output layer is defined as follows:
$\boldsymbol{b}$
correspond to the weighting factors and bias, respectively, for the network under training. Finally, the output layer is defined as follows:
 $$\begin{align}\mathrm{LIDT}=\mathrm{Relu}\left({\boldsymbol{W}}^{(5)}{\boldsymbol{h}}^{(4)}+{\boldsymbol{b}}^{(5)}\right),{\boldsymbol{W}}^{(5)}\in{\mathbb{R}}^{1\times 16},\ {\boldsymbol{b}}^{(5)}\in{\mathbb{R}}^1.\end{align}$$
The network is trained by minimizing the MSE between the predicted LIDT values and the corresponding measured values. Through model training and analysis of an experiment-specific customized dataset, we found that the resulting relationship is far more complex than the simple Chapman function described in Ref. [Reference Laurence, Bude, Ly, Shen and Feit19]. Instead, it manifests as a complex nonlinear mapping function, ${\mathbf{\mathcal{F}}}_{\mathrm{NN}}$
:
${\mathbf{\mathcal{F}}}_{\mathrm{NN}}$
:
 $$\begin{align}\mathrm{LIDT}={\mathbf{\mathcal{F}}}_{\mathrm{NN}}\left\{x,\log (x),\mathrm{Orientation};\left[{\boldsymbol{W}}^{\left({i}\right)},{\boldsymbol{b}}^{\left({i}\right)}\right]\right\}.\end{align}$$
It is evident that the relationships learned by this complex nonlinear model surpass the Chapman function in both form and statistical substance. Rather than yielding a deterministic value, the model produces a conditional distribution that accounts for the inherent discreteness of the data. Consequently, the neural network analysis enables a more efficient and accurate non-destructive assessment of a crystal’s resistance to laser damage, while also providing deeper insights into crystal defect information through residual prediction analysis. This approach offers direct empirical support and theoretical guidance for developing suppression defect methods and enhancing crystal fabrication quality.
3.2 The effect of test beam size on non-destructive evaluation results
The previous discussion employed machine learning algorithms to systematically analyze the relationship between the photothermal weak absorption and the LIDTs. However, during practical LIDT testing, the incident beam size would significantly influence the experimental outcomes[ Reference Foltyn31]. Thus, to achieve a relatively accurate non-destructive prediction of the laser damage resistance of NYCF crystal surfaces, it is essential to analyze the characteristics and underlying mechanisms by which the beam size affects the evaluation results.
Photothermal weak absorption was used to characterize the absorption properties of individual defects within materials. Consequently, a smaller detection spot more accurately reflects the absorption values of these unit defects, yielding more precise test results. Therefore, the spot size for photothermal weak absorption testing in this study is set at 80 μm, ensuring that the test data accurately records the absorption behavior of defects within an 80 μm detection spot. In LIDT testing, an excessively small test spot size results in low sampling rates that lead to deviations in the test results, preventing an accurate reflection of the sample’s LIDT. Conversely, an overly large test spot size hinders the establishment of a dimensional correlation with weak photothermal absorption. To objectively elucidate the relationship between weak photothermal absorption and the LIDT while considering the testing characteristics inherent to both, this study employs LIDT test spot sizes of 210, 300 and 380 μm. This methodology effectively balances the requirements of weak photothermal absorption and LIDT testing.
In the LIDT test platform, the distance between the lens and the test sample was adjusted by modifying the position of the focused lens, thereby controlling the beam size of the laser irradiation on the NYCF crystal input surface. The incident beam diameters at 1/e were set to 0.3 and 0.38 mm, respectively. By correlating the calibration relationship between the photothermal weak absorption of the marked point and the LIDT test position, the relationship between the photothermal weak absorption and the LIDT under different damage beam size conditions could be established. Furthermore, the trained FCNN was employed to predict the LIDT outcomes, as illustrated in Figure 6(a). It could be observed that under identical photothermal weak absorption conditions, the overall LIDT test results decrease as the experimental beam size increases. Specifically, for the same photothermal weak absorption value, a larger beam size in LIDT testing is associated with a correspondingly lower LIDT outcome. Moreover, an increase in the beam size during the damage threshold test results in a broader dynamic range between the weak absorption and the LIDT test results.
(a) Relationship between photothermal weak absorption and the LIDT for different test beam sizes. (b) The beam size effect during the damage testing process.

Mainly because the LIDT test spot is larger than the photothermal weak absorption test spot, defects not exposed by the photothermal weak absorption measurement may be included within the LIDT test area (see Figure 6(b)). If these defects exhibit high-absorption characteristics and a low laser damage threshold, and no corresponding high-absorption defects are present in the photothermal weak absorption test spot, then both a lower photothermal weak absorption value and a lower LIDT result will be observed. Meanwhile, during the R-on-1 LIDT testing process, laser conditioning treatment would effectively eliminate defects characterized by high-absorption and poor adhesion properties. These defects subsequently exhibited pronounced photothermal weak absorption while concurrently maintaining a high LIDT. These experimental phenomena constitute a wide variation in the test results, occurring outside the primary relationship between photothermal weak absorption and LIDT, as illustrated in Figure 6(a). Moreover, because the photothermal weak absorption test spot size is fixed, an increase in the LIDT test spot size corresponds to a greater probability of this phenomenon occurring.
Meanwhile, the various kinds of defects present on crystal surfaces exhibit variable damage threshold characteristics and are distributed nonuniformly in both lateral and longitudinal directions. Consequently, during photothermal weak absorption and LIDT testing, multiple defects with markedly different properties are encompassed within the test spot, thereby introducing randomness into the results. Furthermore, as the spot size in LIDT testing increases, it encompasses a greater variety and number of defects, leading to enhanced variability in the outcomes. This trend is consistent with the experimental findings (Figure 6(a)).
For the above reasons, studies investigating the relationship between photothermal weak absorption and LIDT test spot sizes may encounter significant discrepancies due to inconsistencies in the dimensions of photothermal weak absorption and LIDT test spots, compounded by the diverse and randomly distributed crystal surface defects. Moreover, these random effects become more pronounced as the LIDT test spot size increases.
For cases where the measured data fall below the predicted confidence interval of the LIDT, this discrepancy is primarily attributable to the effect of the spot size in both test methods. Specifically, the photothermal weak absorption test employs a smaller spot size compared to that used in the LIDT test. In instances where no strong absorption defects exist within the photothermal weak absorption spot, but critical defects with lower damage thresholds are present outside it yet within the LIDT test spot, damage to these defects can result in data values that fall below the neural network’s predicted LIDT. This effect becomes more pronounced as the LIDT test spot increases in size, thereby amplifying the disparity with the photothermal weak absorption spot. These data points are considered outliers. The neural network learning process autonomously classifies such anomalies based on the number of occurrences, recognizing that these outliers do not accurately reflect the intrinsic relationship between the material’s photothermal weak absorption characteristics and its LIDT. Consequently, they are excluded from the confidence interval.
From a neural network algorithm perspective, the data sparsity is evident in Figure 6(a), specifically the concentration of data points below the predicted envelope, which originates from the data-driven operational logic of the neural network model. During training, the model learns the sampling density across various photothermal weak absorption intervals, thereby forming a priori judgments regarding prediction reliability. In regions with dense data sampling, the model has sufficient statistical information to generate highly confident predictions, resulting in stable and robust outputs (i.e., the principal section of the envelope). Conversely, in sparsely sampled regions or with isolated data points that markedly deviate from the main cluster, the model identifies their atypical characteristics. Drawing on patterns acquired from extensive data, the model does not compel the prediction envelope to accommodate these outliers, which may arise from experimental noise, unidentified extreme defects or transient measurement fluctuations. Consequently, data points appearing below the envelope do not signify model failure but rather illustrate the robustness of the proposed model in avoiding overfitting to potential noise. This envelope more accurately reflects the statistically reliable LIDT performance trend of the material, once random disturbances are excluded. Simultaneously, the outliers provide valuable diagnostic information, indicating potential anomalous damage mechanisms under specific conditions, and offering crucial insights for subsequent research aimed at enhancing the laser damage resistance of crystals.
3.3 The influence of crystal orientations on experimental results
In crystalline materials, the crystal orientation significantly influences damage characteristics[ Reference Yoshida, Jitsuno, Fujita, Nakatsuka, Yoshimura, Sasaki and Yoshida32]. Accordingly, this study investigates the relationship between photothermal weak absorption and the LIDT of NYCF crystals with different orientations. CaF2 crystals possess a fluorite structure characterized by {111} cleavage plane and {100} <110> slip systems[ Reference Muntoz, Rodriguez and Castaing33]. Moreover, the anisotropy of the crystal would influence its mechanical and other physical properties[ Reference Muntoz, Rodriguez and Castaing33– Reference Chen, Hu, Xiao, Qi, Yu and Qian35]. These features were essential not only for employing NYCF crystals as the host lattices for the laser-active ions, but also for determining the resistance of each crystal to laser-induced damage[ Reference Shao, Liang, Lin, Wang, Deng, Meng and Fang10, Reference Li, Kang, Han, Zheng and Su29].
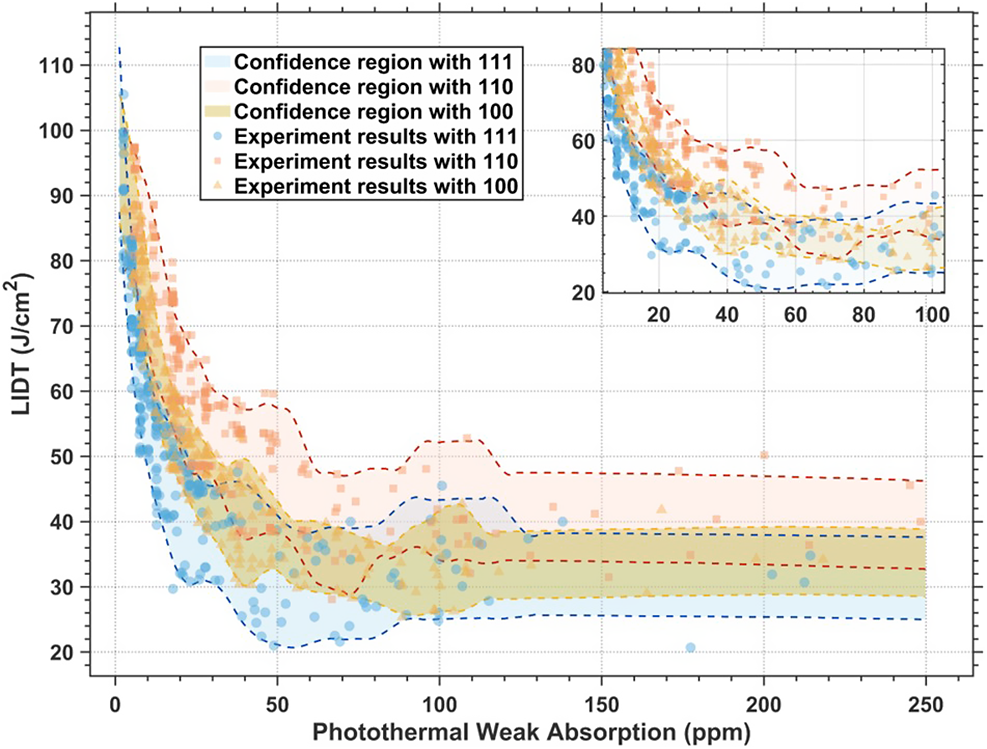
To optimize the testing system for non-destructive evaluation of NYCF crystal surface damage thresholds based on machine learning algorithms, the experiments on the photothermal weak absorption and LIDTs of NYCF crystal with {100}, {110} and {111} planes were conducted. Utilizing an FCNN, the relationship between the photothermal weak absorption and LIDT in the NYCF crystal with different orientations under the identical beam condition (D = 0.21 mm) was analyzed, as illustrated in Figure 7. It was observed that the relationship between photothermal weak absorption and the LIDT on the surfaces of NYCF crystals with three distinct crystal orientations remains largely consistent. Within the 0–75 ppm range, the LIDT decreased sharply as photothermal weak absorption increased. However, beyond 75 ppm, further increases in weak absorption did not cause the LIDT to decline indefinitely; instead, it approached a stable plateau. These findings indicate that the photothermal weak absorption properties of NYCF surfaces across different crystal orientations also play a pivotal role in determining their resistance to laser-induced damage. However, the variation in LIDT with respect to weak absorption values differs among crystal orientations. Specifically, as the photothermal weak absorption value increases, the reduction in LIDT is most pronounced in the {111} plane, followed by the {100} plane and then the {110} plane. Furthermore, when the photothermal weak absorption value exceeds 75 ppm, the damage thresholds for all three orientations tend to stabilize, with the {111} plane exhibiting the lowest LIDT and the {110} plane the highest. Furthermore, the application of neural network analysis in this study has led to the identification of novel experimental phenomena and underlying mechanisms. For instance, there was significant variation in the dispersion of data points among the crystal orientations as the LIDT shifted with the photothermal weak absorption ({111} plane > {100} plane > {110} plane). These findings suggest that even when some defects exhibit identical photothermal weak absorption values, their corresponding laser damage thresholds differ. Notably, the {111} plane demonstrated the greatest data dispersion, indicating that defect precursors on the {111} plane not only have lower damage thresholds compared to those on the other two crystal orientations but also encompass a wider variety of defect types with varying thresholds. Consequently, more stringent defect control is required during the growth and processing of {111} planes. The underlying physical mechanisms are analyzed below.
The relationship between the photothermal weak absorption and LIDT of NYCF crystals with different crystal orientations.

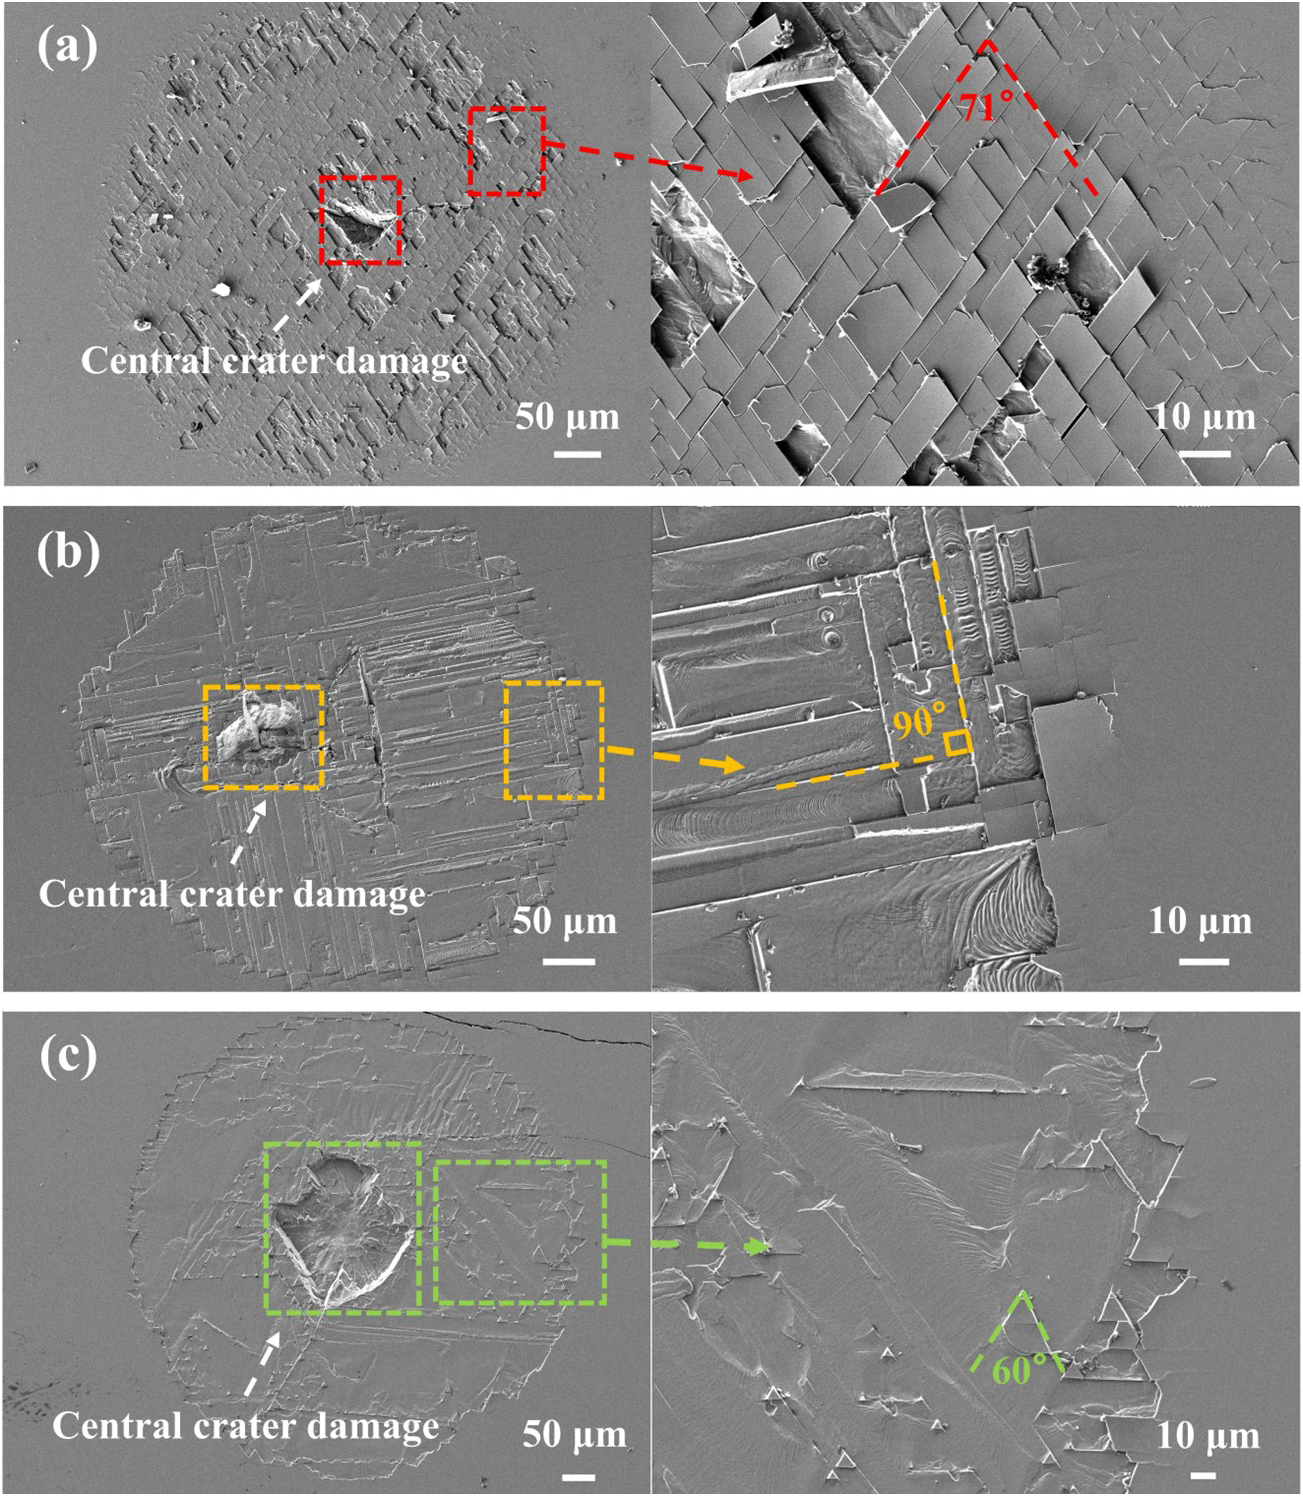
The damage morphology characteristics of NYCF crystals with three distinct crystal orientations were systematically analyzed. Figure 7 illustrates the damage morphology of NYCF crystals across various orientations under laser irradiation at positions with similar photothermal weak absorption (approximately 86.5 ppm) and identical laser fluence (53.6 J/cm2). Notably, all crystal surfaces exhibited features of crater damage and peeling damage[ Reference Lu, Zhang, Jiang, Kou, Zhang, Xu, Zhao, Wu and Su20].
The crater damage primarily arises when surface and subsurface defect precursors absorb laser energy during irradiation. These precursors rapidly increase in temperature, establishing a thermal gradient relative to the adjacent substrate and generating thermal stresses. When these stresses exceed the crystal’s bending strength and thermal shock resistance, the NYCF crystals manifest mechanical removal-type crater damage[ Reference Lu, Zhang, Jiang, Kou, Zhang, Shan, Li, Xu, Zhao, Wu and Su14]. In contrast, peeling damage predominantly results from mechanical cleavage stresses on the crystal’s surface, with each instance exhibiting distinct morphological characteristics. The peeling damage on the {110} plane is primarily distributed along the <110> and <112> directions. Given that the angle between these axes is 71°, the damage morphology manifests as parallelograms with a 71° angle, as shown in Figure 8(a). In contrast, the peeling damage on the {100} plane predominantly aligns along mutually perpendicular <110> directions, resulting in morphologies that are mutually perpendicular, as illustrated in Figure 8(b). On the {111} crystal plane, cleavage damage is oriented primarily along two <110> directions that form a 120° angle relative to each other along the slip direction of the (111) plane. Consequently, cleavage damage exhibits triangular flake structures with exfoliation angles of 60°, as depicted in Figure 8(c).
The laser-induced damage morphology at the approximate weak absorption position (approximately 86.5 ppm) on NYCF crystal surfaces with different crystal orientations by identical incident laser fluence (53.6 J/cm2): (a) {110} plane; (b) {100} plane; (c) {111} plane.

Although the damage morphology of NYCF crystals varies with crystal orientation, the primary laser damage mechanism in CaF2 crystals is mechanical stress-induced damage. In addition, the tensile strength of CaF2 crystals (34 MPa) is significantly lower than their compressive strength (300 MPa)[ Reference Chen, Hu, Xiao, Qi, Yu and Qian35], emphasizing the importance of tensile strength in determining the fracture resistance and laser damage threshold. For NYCF crystals, the {110} plane exhibits the highest flexural strength and thermal shock resistance[ Reference Lu, Zhang, Jiang, Kou, Zhang, Xu, Zhao, Wu and Su20], which enhances its laser damage resistance relative to the {100} and {111} planes. Conversely, the {111} plane shows the lowest thermal shock resistance and a tendency toward cleavage, resulting in the lowest LIDT. The laser damage behavior of the {100} plane is intermediate between that of the {111} and {110} planes. These observations are consistent with the experimental results reported here, which demonstrate that, under similar photothermal weak absorption conditions, the {110} plane achieves the highest LIDT while the {111} plane records the lowest.
Meanwhile, the underlying mechanism of this phenomenon could also be elucidated by examining the morphological characteristics of the laser-induced damage. Under identical laser fluence, laser irradiation on the similar photothermal weak absorption regions of the three crystal orientations in NYCF resulted in crater damage in the central surface damage zones across all crystal orientations. This damage arises from laser absorption by sub-substrate defect precursors, which leads to mechanical delamination driven by elevated temperatures and induced thermal stresses. Consequently, the extent of the crater damage is directly correlated with the crystal’s thermal shock resistance and bending strength. As shown in Figure 7, the crater damage size is largest on the {111} plane. Notably, the damage caused by the defect precursor on the substrate has resulted in the complete removal of the surrounding material; however, no evidence of thermal melting damage was observed. In contrast, for the {100} plane of the NYCF crystal, the crater damage dimensions are intermediate, with the substrate defect precursor just beginning to mechanically induce delamination of the adjacent substrate. Conversely, the crater damage on the {110} plane is the smallest, and the defect-induced damage did not inflict significant mechanical damage on the surrounding substrate. This observation aligns with the previously discussed relationship between thermal shock resistance and bending strength across different crystal orientations, which accounts for the varying photothermal absorption and the LIDTs observed. Therefore, when developing non-destructive evaluation thresholds for CaF2 crystals of various orientations, it is essential to implement corresponding algorithms based on the crystal orientation of the test sample to achieve a more precise assessment of its laser damage resistance.
4 Conclusion
In this paper, an in situ testing method for photothermal weak absorption and the LIDT test was employed to investigate the relationship between weak absorption and the damage threshold for NYCF crystal surfaces. Furthermore, an FCNN neural network was utilized to analyze the intrinsic data relationship between the photothermal weak absorption characteristics of NYCF crystals and their LIDT. The test results indicate that photothermal weak absorption at the surface of the NYCF crystals exhibits a subexponentially relationship with the LIDT. Specifically, as photothermal weak absorption increases, the LIDT would rapidly decrease; however, once the weak absorption exceeds 75 ppm, entering the high-absorption regime, the rapid decline in the LIDT would be stabilized. Meanwhile, extensive data analysis indicates that photothermal weak absorption does not correlate with the LIDT on a one-to-one basis but rather within a defined confirmation interval. Subsequently, various beam sizes were employed in damage threshold testing to assess their impact on non-destructive evaluation outcomes. The results reveal that, for identical weak absorption test inputs, larger beam sizes would produce lower confirmation interval values along with a broader confirmation interval range. Furthermore, the relationship between photothermal weak absorption and LIDT test beam sizes, in conjunction with the testing procedure, suggests that diverse, randomly distributed defect precursors are the critical factors inducing beam size effects during testing. Finally, an artificial intelligence-based non-destructive evaluation of NYCF crystals with various crystal orientations was performed. By analyzing the thermomechanical properties and damage morphology across these orientations, the underlying physical mechanisms governing the distinct relationship between photothermal weak absorption and the LIDT were elucidated. This study not only leverages artificial intelligence to examine the relationship between photothermal weak absorption and laser-induced damage in NYCF crystals but also provides valuable insights for enhancing crystal growth and preparation quality.
Acknowledgements
This work was supported by the CAS Project for Young Scientists in Basic Research (Grant No. YSBR-024) and the National Natural Science Foundation of China (Grant Nos. 62505338 and W2412088).

 Open access