1. Introduction
High-latitude and high-altitude volcanoes present increased danger to those who live within reach of meltwater-induced lahars during and after volcanic eruptions (Reference PiersonPierson, 1985; Reference Major and NewhallMajor and Newhall, 1989). The development of lahars or outburst floods may occur with or without significant eruptive activity due to meltwater produced by enhanced but localized geothermal flux (e.g. Reference BjörnssonBjörnsson, 2002).
Mt Veniaminof is located on the Alaska Peninsula (56.28 N, 159.398 W) about 320 km southwest of King Salmon and 240 km northeast of Cold Bay (Fig. 1). The volcano is a large glaciated stratovolcano of Quaternary age whose summit (2495 m) is truncated by a circular caldera structure about 8 km×10km in diameter. The volcano has erupted explosively several times over the past 25 000 years including two major eruptions during the Holocene that enlarged the caldera and formed extensive pyroclastic flow and lahar deposits on all flanks of the volcano. Coastal villages and salmon spawning streams below the mountain may be at risk from lahars and outburst floods. A primary goal of this study is to determine the likely routes of meltwater produced within the intra-caldera icefield at the summit of the volcano.
Location of Mt Veniaminof on the Alaska Peninsula.

An icefield (mean surface elevation 1860 m) occupies much of the modern caldera and there are two cinder cones that rise above the icefield (Fig. 2). A dormant cinder cone in the north-central region of the caldera is nearly buried by ice, but the active cone near the head of Cone Glacier rises nearly 250m above the surrounding ice. The top of the active cone is ice-free and has several active fumaroles. Photographs taken in late summer indicate that the equilibrium line altitude (ELA) of the glaciers draining the icefield is roughly 1300m above sea level, about 200m below the caldera icefield. The major drainages that head on the volcano have been extensively inundated several times by lahars and floods associated with large eruptions and thus future such events are likely to produce similar sized flows. It is not known how smaller eruptions, similar to those that have occurred historically, would perturb the intra-caldera icefield and what the likely flood or lahar hazard would be.
Oblique photograph of Mt Veniaminof taken from the International Space Station on 25 September 2005, two months after the field study. Approximate location of the 2005 RES survey is shown in red. View is to the north. (Image Science and Analysis Laboratory, NASA-Johnson Space Center, http://eol.jsc.nasa.gov/scripts/sseop/photo.pl?mission=ISS011&roll=E&frame=13577).

1.1. Recent eruption history
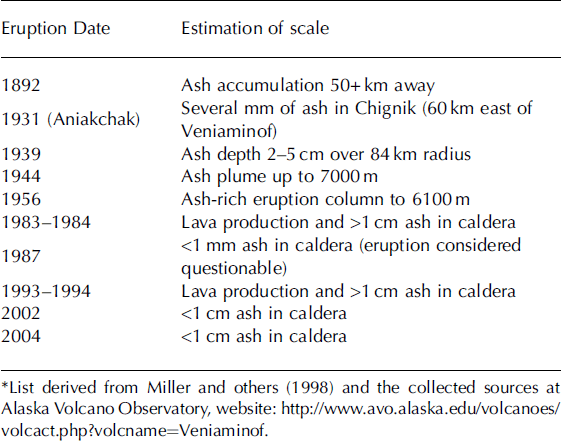
The active intra-caldera cinder cone has erupted at least 10 times in the past 200 years (Table 1), although some eruptions prior to 1950 may be missing from the record as the area is sparsely populated and the volcano is often obscured by cloud and fog (Reference Yount, Wood and KienleYount, 1990; Reference Miller, McGimsey, Richter, Riehle, Nye, Yount and DumoulinMiller and others, 1998). Historical eruptions are mainly Strombolian events with small amounts of ash that fall on the surrounding icefield. Airborne photographs and satellite images as well as field observations of post-1980 events show that even smaller (VEI 1) eruptions tend to blanket most of the icefield with at least a dusting (<1mm) of ash, while the larger (VEI 3) eruptions may deposit more than 1 cm of ash and produce occasional lava flows (Reference Miller, McGimsey, Richter, Riehle, Nye, Yount and DumoulinMiller and others, 1998).
Historical eruptions at and near Mt Veniaminof from anectdotal and scientific accounts. Largest eruptions are included here for use in numerical modeling study*

Ash deposits on the icefield may lower the surface albedo and affect the annual mass balance of the icefield depending on the amount of ash fall and the time of year of the eruption. An eruption during April–September 2004 (VEI 1) deposited a light dusting (<1 mm) of ash over much of the icefield, and resulted in significant surface melt and formation of ice lenses seen in shallow snow pits (personal communication from K. Wallace, 2004). Ash fall from a later eruption (December 2004 to February 2005) of similar size was observed to cover the caldera icefield, but was buried by subsequent winter accumulation. Shallow snow pits (∽2m) dug in July 2005 revealed no ash layers or ice lenses near our base camp (Fig. 3), despite significant softening of the snow surface during the afternoon hours. Thin ash deposits from the 2004–05 winter eruption did melt out closer to the cinder cone in July 2005, possibly as a result of lower local accumulation rates due to topography near the melt hole edge where ash accumulation was likely higher close to the erupting cinder cone. The latitude and altitude of the icefield indicate that the ice is likely temperate.
Map of the Mt Veniaminof caldera icefield. Two cinder cones are present within the main caldera; the older cone is mostly ice covered, while the other is historically active. Drainage basins are delineated (blue lines) based on SRTM surface topography. The melt hole south of the active cinder cone formed during eruptions in 1983–84 and 1993–94. The geophysical survey profiles are highlighted in red. Exposed rock is shaded in brown. Site of numerical model noted with black star.

Two lava-producing eruptions at the active cinder cone occurred in 1983–84 and 1993–94. The 1983–84 eruption melted roughly 0.17 km3 of ice along the south flank of the cinder cone (Reference Yount, Miller, Emanuel and WilsonYount and others, 1985). The ponded water was observed in the melt hole, but the water level remained more than 50m below the ice surface. The 1993–94 lava flow enlarged the eastern end of the melt hole, but no standing water was observed (Reference Neal, Doukas and McGimseyNeal and others, 1995). The low water level in the first eruption and lack of ponded water in the second indicate rapid coincident water drainage from the melt hole. The outlet for the water was unknown at the time, although Reference Yount, Miller, Emanuel and WilsonYount and others (1985) observed what they described as ‘melt water tunnels’ in the northwest and east walls of the 1983–84 melt hole.
2. Field Observations
A geophysical survey of the intra-caldera icefield was conducted in early July 2005 using deep-penetrating radio-echo sounding (RES) and synchronous global positioning system (GPS) measurements (Fig. 3). The aim of the survey was to map the ice thickness, identify the southern rim of the caldera and determine probable subglacial meltwater paths. The daily surveys began before dawn and ended around midday to avoid soft snow conditions in late afternoon.
2.1. GPS measurements
The radar profiles were geolocated with concurrent GPS measurements.We used a pair of altimeter-equipped,WAAS (Wide Area Augmentation System)-enabled, consumer-grade GPS units. One functioned as an altimeter base station while the other traveled with the radar sled. The rover unit used an external antenna for a 20 dB gain in GPS signal strength. The base-station altimeter data corrected barometric pressure drifts in the rover altimeter data due to meteorological activity (Fig. 4). Tests prior to the field campaign showed that the corrected altimeter data are accurate to ±3m, similar to the resolution of WAAS-corrected horizontal coordinates.
(a) The raw roving GPS altimeter data recorded during a single survey day. Note that the altitude at the end of the survey day does not return to the base camp elevation (dashed line). (b) The base station altimeter correction relative to the base camp elevation. (c) The corrected rover altimeter data (the corrected altitude at the end of the survey day now matches the base camp elevation).

A grid of the ice surface was created from the altimeter data using a kriging algorithm that was constrained by a boundary polygon. This surface shows close agreement with the Shuttle Radar Topographic Mission (SRTM) surface generated from data collected in 2000 (EROS Data Center, 2004, US Geological Survey, Sioux Falls, http://seamless.usgs.gov/ ). Differences between the two ice surface grids are greatest near the melt hole (up to 10 m) and are most likely due to localized accumulation (drifting) and ice flow during the intervening years.
The most notable feature in the ice field topography is the extremely flat surface (<18) over a roughly 5 km2 region of the Southern Basin (Fig. 3). Any ice flow in this area must be driven entirely by longitudinal stresses due to ice flowing into and out of the basin.
2.2. Radio-echo sounding survey
The radar survey recorded profile data over 120 km and covered more than 30 km2 of the caldera ice field (Fig. 3). The radar system, an updated version of a lightweight system described in Reference Fountain and JacobelFountain and Jacobel (1996), utilized an impulse transmitter (Reference Welch and JacobelWelch and Jacobel, 2003), the center frequency of which is determined by the length of matched dipole antennas. The center frequency for this survey was 8 MHz. A portable Tektronix THS720A oscilloscope recovered the radar pulses, which were then stored on a laptop computer. The system collected one trace every second providing an average trace spacing of approximately 2.5 m, less than one-fifth of the dominant wavelength of the system, 21.125 m. This minimized the effects of spatial aliasing of reflector slopes less than 458. The system was ruggedized to be towed by a snow machine.
Post-processing steps include a bandpass filter (corner frequencies 5 and 15 MHz) to remove ambient and system noise, and normal move-out correction to accommodate the constant 60m antenna separation. The traces were geolocated using the GPS data and then interpolated to a constant spacing prior to migration to correct for the finite beamwidth of the signal (Fig. 5). Normal move-out, migration and time-to-depth correction all assume a constant velocity of 169 mms–1 since the density profile is unknown. The complete collapse of nearly all pre-migration reflection hyperbolae indicate that any variations in the RMS velocity are minor and will not greatly affect the calculated depths of bed and internal reflectors. The bedrock reflector and prominent internal layers were digitized to generate maps of reflector topography, ice thickness and extent of ash deposits.
Elevation-corrected and migrated radar profile A-A’. A time-varying gain function (Gain = t 0:8) was applied to emphasize the deep reflectors relative to shallow layers. The upper 40 m of ice are masked by ‘ringing’ in the antennas. Layers 1–4 were assigned dates of local eruptions as a preliminary attempt to recover approximate annual accumulation and basal melt rates.

3. Results
The Southern Basin consists of very clear ice (very few point diffractors) with numerous bright, nearly parallel, sub-horizontal internal reflectors (Fig. 5), the brightest of which (at roughly 50% of the ice thickness) can be traced throughout most of the caldera. Elsewhere the ice also contains internal scatterers that may result from pockets of water, avalanche debris or healed crevasses, depending upon the location within the caldera.
Figure 5 is a processed radar profile (line A–A’ in Fig. 3) across the southern basin of the caldera showing the thickest ice (∽475 m) within the caldera. Numerous profiles ended at exposures of bedrock where the identification of the bed reflector was verified. The caldera floor is quite smooth with only a few bumps that would not be expected within internal layers (at around distance 2.4 km in Fig. 5). Except for the steep caldera walls, the bed morphology was more similar to the scoria-covered active spatter cone than the rugged walls of the main caldera. There is no evidence of ponded subglacial water (e.g. bright planar basal reflectors). Based on these observations, we interpret the caldera floor to be covered by a thick layer of permeable scoria and ash.
Figure 6 shows a map of ice thickness interpolated from the digitized radio-echo sounding survey. The identity of the bed reflector was verified by profiles terminating at exposed bedrock and volcanic deposits near the inactive cinder cone, the active cinder cone and the western caldera wall. The average ice thickness of the surveyed portion of the ice field was roughly 256m resulting in a surveyed ice volume of over 8 km3.
(a) Ice thickness grid based on the RES survey profiles (white lines) and contoured SRTM surface topography. (b) Elevation of the subglacial caldera floor showing the deep southern basin. (c) Static subglacial hydraulic head surface relative to elevation above sea level.

3.1. Stratigraphic modeling
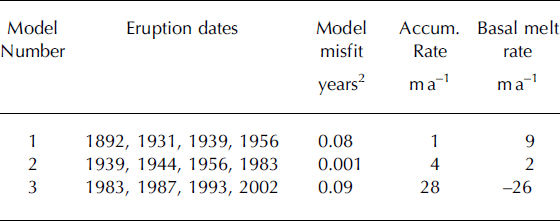
Volcanic ash deposits provide useful chronological markers in glaciers and ice sheets (Reference Welch and JacobelWelch and Jacobel, 2003). We interpret the internal stratigraphy seen in the southern basin of the ice field as deposits of volcanic ash from eruptions of the active cinder cone of Mt Veniaminof and possibly other nearby volcanoes. Ash from a 1931 eruption of Aniakchak volcano appears to be the only significant historical source of non-Veniaminof ash deposited on the Veniaminof icefield (Reference Neal, McGimsey, Miller, Riehle and WaythomasNeal and others, 2001). To obtain preliminary estimates of the age-depth profile for Veniaminof, we use the one-dimensional steady-state Nye model to calculate the time-averaged ice accumulation and basal melt rates (Reference PatersonPaterson, 1994; Reference Fahnestock, Abdalati, Joughin, Brozena and GogineniFahnestock and others, 2001a, Reference Fahnestock, Abdalati, Luo and Goginenib). Without an age-depth record from an ice core or accumulation measurements to calibrate the model, we test the quality of model results by assigning different eruption dates to prominent internal ice reflectors from the RES survey. The historical record for eruptions of the active cinder cone of Mt Veniaminof covers most of the last century (Table 1), although the quality of the earlier records is mostly anecdotal (Reference Miller, McGimsey, Richter, Riehle, Nye, Yount and DumoulinMiller and others, 1998).
Using an approach similar to Reference Fahnestock, Abdalati, Joughin, Brozena and GogineniFahnestock and others (2001a, Reference Fahnestock, Abdalati, Luo and Goginenib) we use the Nye equation for steady-state one-dimensional flow to calculate the age of the ice tm as a function of height z above the bed:

where H is the total ice thickness, λH is the ice accumulation rate, and m _ is the basal ice melt rate. The Nye equation is not really appropriate for a non-divide location as used here, but given the number of unknowns (age–depth profile, accumulation rate, presence of basal melt, summer melt rates, etc.), our intent here is primarily to test the extreme limits of the eruption history to obtain limits on possible annual accumulation.
An ice core is not available for an age–depth record, and thus we cannot assign dates to all of the radar stratigraphy as done by Reference Fahnestock, Abdalati, Joughin, Brozena and GogineniFahnestock and others (2001a, Reference Fahnestock, Abdalati, Luo and Goginenib). Instead, we test the response of the model to three stratigraphic dating scenarios. The dates of four of the known local eruptions are assigned to four prominent internal layers (Fig. 5). Equation 1 is then applied to those dated depths using a simplex method to determine the optimal accumulation and basal melt rates to match all of the internal stratigraphy (Reference Fahnestock, Abdalati, Joughin, Brozena and GogineniFahnestock and others, 2001a). Three date combinations from the local eruption record were modeled to determine limiting conditions (Table 2). Model 1 is a low accumulation ‘old ice’ scenario, while Model 3 is a high accumulation ‘young ice’ scenario. Both yield poor fits relative to Model 2, a ‘middle-ground’ scenario.
Assignment of local eruption dates to RES layers 1–4 in Figure 5 and results of model runs. Model 2 provides the best fit to the data

Models 1 and 2 present accumulation rates that are reasonable for southern coastal Alaska, but the very high basal melt value for Model 1 is the result of a poor fit to the assigned layers due to the presence of the 1892 assignment to Layer 1. Without records of local eruptions between 1892 and 1931 there is no combination of ‘old’ eruption dates that can improve the fit. Similarly, Model 3 cannot produce a fit comparable to Model 2 with the known eruption history. The fit of Model 3 causes the singularity in Equation 1 to be located above the bed. This results in the negative basal melt rate (indicating basal accretion) of Model 3, a scenario that we deem unlikely in a volcanic environment.
3.2. Geothermal flux calculations
Geothermal flux G is determined by assuming that the entire ice thickness is at the pressure melting point and calculating the energy required to produce the basal melting rate calculated for the Model 2 scenario i.e. 19Wm–2. All geothermal heat is assumed to go into melting so the energy flux is simply the melt rate multiplied by the latent heat of fusion for ice (3.34×10⁵ J kg–1).
With no local measurements of geothermal flux available we try to put these estimates into the context of other glacial and volcanic locations. Subglacial geothermal flux values in central Greenland, a non-volcanic location, are of the order 50 mWm–2 (e.g. Reference Tarasov and PeltierTarasov and Peltier, 2003). Subglacial geothermal flux on volcanoes can be higher if the volcano is historically active e.g. 1.8Wm–2 beneath Gorshkov ice cap on Ushkovsky volcano in Kamchatka (Reference Salamatin, Murav’yev, Shiraiwa and MatsuokaSalamatin and others, 2000) and 7Wm–2 on Mt Wrangell, Alaska (Reference Clarke, Cross and BensonClarke and others, 1989). Localized melting of snow and ice at Mt Baker in 1975 was due to geothermal flux values as high as 180Wm–2 (Reference Frank, Meier and SwansonFrank and others, 1977). Ongoing subglacial volcanic activity that creates outburst floods in Iceland generates localized geothermal flux values as high as 5–6× 10⁵Wm–2 (Reference BjörnssonBjörnsson, 2002). Active hydrothermal activity in volcanic lakes can generate crater-wide average flux values of the order 29–36Wm–2 (Reference Shikano, Kikuchi, Takagi and DoiShikano and others, 2004).
A snowstorm observed during the 2005 field season provides a qualitative indication of geothermal flux values at the summit of the active cinder cone. Roughly 20 cm of wet light snow fell over a 12 hour period. The cone was observed to be free of snow prior to the storm and immediately after the clouds cleared. Without direct measurements of the new snow density we can use a conservative estimate of 1 cm of water equivalent precipitation total to calculate an estimated heat flux of 79 Wm–2 for the active cinder cone summit. This value is roughly double the estimated subglacial flux in the southern basin and is likely lower since we have not accounted for solar input. However, we believe the flux at the cinder cone is considerably higher than this estimate as there are active fumaroles present in numerous locations on the outcrop.
The modeling results provide an order of magnitude estimate of annual accumulation, basal melt and geothermal flux in the southern basin. The accuracy of the modeling results are limited by the possibility of a thick firn layer in the accumulation zone as well as the possibility of horizontal flow through the southern basin. Future field observations (ice cores, meteorological data and ice flow measurements)
are necessary to clarify the boundary conditions that would make a more comprehensive flow model possible.
3.3. Analysis of subglacial melt water flow
We now assess the possible drainage routes of the meltwater created during the 1983–84 and 1993–94 eruptions that formed the melt hole seen along the southern flank of the active cinder cone (Figs 2 and 3). Four possible drainage mechanisms are considered below: (1) subglacial outburst floods through Röthlisberger-type channels; (2) englacial flow through the southern basin; (3) percolation through subglacial sediments; and (4) flow through fractured ice into Cone Glacier.
We consider flow through subglacial Röthlisberger-type channels where the flowing water melts a channel in the basal ice as unlikely because neither large (5+m wide) subglacial channels, nor deformed internal stratigraphy (as would be expected from a large outburst flood) are evident in the RES data. While discharge through subglacial channels smaller than the λ/4 (∽5m) horizontal resolution of the radar is quite possible, such a mechanism would result in low discharge rates and would be unlikely to present a danger to nearby communities.
There is also no evidence of significant deformation of internal stratigraphy that would be expected of high discharge rates through englacial conduits or crevasses into the southern basin (Reference Fountain, Jacobel, Schlichting and JanssonFountain and others, 2005). The holes seen in the eastern wall of the melt hole formed by a lava flow during the 1983–84 eruption (Reference Yount, Miller, Emanuel and WilsonYount and others, 1985) were likely ice-cliff collapse features or crevasses that were not related to significant englacial water flow.
Percolation through subglacial sediments is possible, but cannot be verified by a radar survey as we have no observations of subglacial permeability. However, we can calculate the limiting case of the ice overburden pressure of the surrounding ice on the initiation of subglacial drainage from the melt hole into a subglacial aquifer. Figure 6c shows the calculated static subglacial hydraulic head assuming that the sediment is saturated and the overlying ice is impermeable. The hydraulic head field represents a conservative indication of the hydraulic barriers to flow out of the melt hole. Under these conditions the melt hole would have to fill to the 1825m elevation contour to overcome the lowest ice overburden pressure found at the southwest wall of the melt hole. Reference Yount, Miller, Emanuel and WilsonYount and others (1985) indicate that the water level remained significantly lower, near the elevation of the present-day bottom of the melt hole at 1750 m, or roughly 100 m below the surface of the surrounding icefield and the related hydraulic barrier to flow. Therefore, any water flow through subglacial sediments cannot be driven by the hydraulic gradients derived from the overlying ice. Rather, the subglacial sediments would have to be unsaturated and form an unconfined aquifer with its own hydraulic gradient to pass beyond the caldera rim. As in the case of small Röthlisberger-type channels, discharge through such a system would be too low to be a danger to nearby communities.
While no englacial or subglacial channels were found in the RES profiles to the south and east of the melt hole, the profiles recorded between the northwest end of the melt hole and Cone Glacier were difficult to interpret due to englacial scattering in the radar data. We cannot rule out the presence of subglacial or englacial conduits and the internal stratigraphy is largely obscured so we cannot determine whether the stratigraphy are deformed. We note that contemporary airborne photography shows that the ice in this region was heavily crevassed during the 1983–84 eruption due to increased ice flow towards the melt hole (Alaska SAR Facility, 2004). The ‘drainage tunnel’ seen in the northwest wall of the melt hole by Reference Yount, Miller, Emanuel and WilsonYount and others (1985) could have been a route for meltwater to drain into Cone Glacier. However, there are no known reports of increased water flow in the drainage at the terminus of Cone Glacier, nor are there any obvious features or deposits indicative of outburst floods or unusually high water.
4. Conclusions
We present a preliminary geophysical survey and analysis of the intra-caldera icefield of Mt Veniaminof, Alaska. The 475 m deep southern basin and the build-up of the two intra-caldera cinder cones since the last caldera-forming eruption at 3700 BP define the topography of the caldera floor. In general, the caldera floor is characterized by steep side walls and relatively smooth surface, perhaps indicative of a layer of scoria covering much of the caldera basin.
Modeling the englacial stratigraphy to match the local eruption history provides estimates of the accumulation and basal melt rates and subsequently geothermal flux. The geothermal flux values (19Wm–2) are consistent with those found in hydrothermally active caldera lakes. We consider this value to be an upper limit of the likely geothermal flux under much of the icefield. Based on the high accumulation rates, an ELA of a few hundred meters below the icefield surface elevation and the high value of the calculated geothermal flux, the icefield is likely temperate.
The accumulation and basal melt estimates of the modeling exercise are, at best, approximations since the flow conditions in the southern basin are not likely to meet the ice flow assumptions of the Nye model, in particular, there is no vertical strain due to ice flow. Direct measurements of the heat flux or observations of ice flow velocity and a more rigorous flow-line model are necessary to validate the age–depth relationship and the geothermal conditions at the bed (cf. Reference Salamatin, Murav’yev, Shiraiwa and MatsuokaSalamatin and others, 2000).
If the high basal melt rates calculated from the stratigraphic model are shown to be valid through future research, this would indicate significant subglacial water flow. Since ponded water is not seen in the radar survey there would have to be an efficient mechanism to drain the water. The permeability of the subglacial sediments is likely to be similar to that of the large deposits of coarse scoria seen at exposures on both the old and active cinder cones.
The formation of the lakes in 1983 and 1993 indicates that any subglacial drainage systems that might be present are overwhelmed by the volume of meltwater produced during lava-forming eruptions. We conclude that most of the meltwater formed during the 1983 eruption probably drained into the crevasses on the northwest side of the melt hole where it then flowed into the Cone Glacier drainage.
Acknowledgements
The authors would like to thank T. Plucinski of the USGS Alaska Volcano Observatory for valuable support during the field campaign. This research was funded through US National Science Foundation grant 0423424 and support from the USGS Alaska Volcano Observatory. The authors would also like to thank the editor, Garry Clarke and Martin Lüthi, and Guðfinna Aðalgeirsdóttir and an anonymous reviewer for their helpful comments regarding the manuscript.