


Introduction
Humans, environments and ecosystems are intimately interconnected. Recognising this, archaeologists increasingly incorporate the environmental and ecological contexts of societies to investigate human relationships with climate, geography and other species. This approach enables a richer examination of the direct/indirect and temporally/spatially varying effects of people on the places that they inhabit, and the effects of those places on cultural structure and dynamics. Nonetheless, there is room for growth both in basic science and in applications to questions of past, current and future sustainability. In their thoughtful paper ‘Grand challenges for archaeology’, Kintigh et al. (Reference Kintigh2014a & Reference Kintighb) identify human-environment interactions as a core research agenda, focusing on how ecological opportunities and constraints can affect everything from hominin migration to the domestication of plants and animals. Similarly, Armstrong et al.'s (Reference Armstrong2017) review of ‘Anthropological contributions to historical ecology’ identifies unanswered questions, including how we constitute humans as integral parts of ecosystems and how we conceptualise humans as one of many species in an ecosystem.
It is challenging to encapsulate the complex relationship between humans and environments via single specialities (e.g. lithic analysis, palynology) that often only account for a few variables and rarely explain the ways that these variables are interconnected. To understand how, where and why societies developed, we need to understand the complex ways in which ecosystems shape societies and humans shape ecosystems. Moving beyond research that views environments and ecosystems as static backdrops upon which societies act, and towards conceptualising them as integrated, active, dynamic systems within which human societies live, will enable a more parsimonious understanding of the place of humans in their environment (Crumley Reference Crumley1994; Briggs et al. Reference Briggs, Spielmann, Schaafsma, Kintigh, Kruse, Morehouse and Schollmeyer2006). To address these challenges, we focus on emerging research opportunities at the interface of archaeological and ecological research.
Here, we introduce human-inclusive ecological networks as a concept for uniting ecological and archaeological data in order to answer pressing questions concerning the sustainability of human-ecosystem interactions. Both ecologists and archaeologists have suggested that collaboration and interdisciplinarity will provide unique insights into our place both in the past and in today's world (e.g. Jackson et al. Reference Jackson2001; Briggs et al. Reference Briggs, Spielmann, Schaafsma, Kintigh, Kruse, Morehouse and Schollmeyer2006; Rick & Erlandson Reference Rick and Erlandson2008; d'Alpoim Guedes et al. Reference d'Alpoim Guedes, Crabtree, Bocinsky and Kohler2016). Archaeologists, as curators of knowledge of past human ‘experiments’, can enable a richer, more comprehensive understanding of our present and future than can modern ecological studies alone (Crumley Reference Crumley1994; Swetnam et al. Reference Swetnam, Allen and Betancourt1999; Jackson et al. Reference Jackson2001; Briggs et al. Reference Briggs, Spielmann, Schaafsma, Kintigh, Kruse, Morehouse and Schollmeyer2006; Rick & Erlandson Reference Rick and Erlandson2008; Maschner et al. Reference Maschner2009; Dunne et al. Reference Dunne, Maschner, Betts, Huntly, Russell, Williams and Wood2016; Dugmore et al. Reference Dugmore and Sheets2020). By using data from the past to build models of societal, ecological and environmental trajectories, we can better understand how our actions and interactions can lead to more robust or fragile ecosystems and “bring a deep-time perspective that stands to make significant contributions to understanding how humans have shaped the Earth” (Kintigh et al. Reference Kintigh2014a: 5).
Ecological networks are a useful tool for understanding the structure and function of ecological communities that consist of a complex, interconnected system of actors. Food webs are one type of ecological network that represent consumption pathways within the community. Food-web approaches can help to address archaeological questions in a variety of ways, including:
1) Demonstrating whether or not human subsistence patterns affect a given ecosystem.
2) Where there is impact, demonstrating when and where humans will have the greatest influence.
3) Elucidating how and why human subsistence decisions affect ecosystems over time.
4) Providing quantitative results that can be compared across populations worldwide.
The archaeological perspective also greatly extends the scope of ecological research by directly integrating into ecological networks the most widely distributed and impactful species: Homo sapiens. This article aims to encourage the use of ecological networks generally, and food webs specifically, as a tool for studying past and present human societies. It is only through close collaboration and integration across disciplines—in this case ecology and archaeology—that the focus can shift away from intellectual and methodological silos to focus on important intersecting questions related to the place of humans in local to global ecologies.
Ecological networks in archaeology
Network approaches have become increasingly popular in archaeology, driven by a need to understand complex interactions of past societies across space and time. High-profile publications employing social networks (e.g. Mills et al. Reference Mills2013; Peeples Reference Peeples2018; Lulewicz Reference Lulewicz2019) have raised awareness of the methods. The appeal of network approaches for archaeology lies in the ability to capture relationships at multiple scales of analysis, from individuals to sites and landscapes (Crabtree & Borck Reference Crabtree, Borck and Smith2019). This facilitates characterisation of the ways in which interactions among individuals and societies laid the foundations for the complex archaeological record we know today. The massive growth in recent years of social network analyses in archaeology (Brughmans & Peeples Reference Brughmans and Peeples2017) speaks to their value in illuminating key aspects of the past that cannot be captured by analyses of single, isolated variables.
In social network studies, researchers characterise how social or technological units interact, thus creating a web of their connections (Crabtree & Borck Reference Crabtree, Borck and Smith2019). Following the standard terminology of network science, the basic units of analysis are represented as nodes and the connections between them are represented as links/edges. In social networks, nodes can represent individual humans, houses, settlements, artefacts or any other basal unit of study. The links represent the interactions among nodes, such as friendship, exchange and similarity.
As with social networks, ecological networks are collections of nodes and edges, in this case linking multiple taxa—species or functionally similar groups of species—according to their interactions. Food webs are a type of ecological network that focuses on consumer-resource (‘trophic’) interactions. Other types of ecological networks exist, such as plant-animal mutualistic networks (e.g. Bascompte & Jordano Reference Bascompte and Jordano2007). Food webs ideally represent all co-occurring taxa in a defined habitat, including plants, bacteria, fungi, invertebrates and vertebrates, and their feeding links. The feeding links represent transfers of biomass, and encompass various trophic strategies, including detritivory (eating of detritus), herbivory, predation, cannibalism and parasitism. At the base of every food web are one or more autotrophic taxa, such as plants or chemoautotrophic bacteria, as well as dead organic matter. Trophic transfers of organic material provide the energy, organic carbon and nutrients necessary to fuel metabolism in all heterotrophic organisms in the food web. Tracing the food chains that link consumers to basal nodes allows for the calculation of a taxon's trophic level.
Food webs can be described using similar metrics as those employed for social networks, allowing for shared concepts and approaches to interpretation, interlinked theories and the transfer of methods for analysis. Patterns in the connectivity of nodes and networks, from sparsely to highly connected, can, for example, provide useful information about both social and ecological systems. In social networks, patterns of connectivity can help us to understand the functionality of connected systems, such as how certain communities leverage their physical location as brokers of power (Peeples & Haas Reference Peeples and Haas2013). In ecological networks, the loss of highly connected nodes may help us to understand the potential for secondary extinctions, or ways that high connectance (number of links per species) may make ecological communities more robust to species loss (Dunne et al. Reference Dunne, Williams and Martinez2002; Pocock et al. Reference Pocock, Evans and Memmott2012).
While food webs have been the subject of scientific study for well over 100 years (Camerano Reference Camerano1880), few ecological networks include humans. There is an extensive body of ecological network research that employs empirical, experimental, theoretical and comparative approaches, and many syntheses, perspectives and histories cover aspects of this area of ecological inquiry (Dunne Reference Dunne, Pascual and Dunne2006; Bascompte & Jordano Reference Bascompte and Jordano2007, Reference Bascompte and Jordano2013; Gray et al. Reference Gray2014). There are, however, few deep-time ecological network studies. One recent article (Yeakel & Dunne Reference Yeakel and Dunne2015: 188) suggests that “integrating contemporary ecology with observations of the past will provide key insights into the future risks and uncertainties facing the multitude of species with which we share the planet”. Combining ecological and archaeological data provides an exciting new area of inquiry for understanding the sustainability of coupled natural-human systems.
Archaeological food-web case studies
Two studies offer examples of how rich ecological, historical and archaeological data can place humans within highly detailed trophic networks. These studies demonstrate methods for compiling and analysing integrated archaeological and ecological data to understand human-ecosystem interactions. Furthermore, they demonstrate approaches to question about the position of humans within changing environments. These approaches not only provide insights into direct interactions between humans and other taxa, but can also elucidate how diachronic shifts in strategies (e.g. subsistence strategies) can affect our environments and ourselves. Our goal in reviewing these cases is to demonstrate how food-web studies can elucidate resilience and vulnerability of past societies in new ways, thereby providing lessons for the past, present and future.
Sanak Archipelago, Aleutian Islands, Alaska
The first publication of highly resolved food webs to include humans focused on the Sanak Archipelago off the Alaskan Peninsula, and the Aleut fisher-hunter-foragers who have occupied this region for the past 7000 years (Reedy-Maschner & Maschner Reference Reedy-Maschner and Maschner2013). Building on zooarchaeological and anthropological evidence of pre-modern Aleut subsistence choices (Maschner et al. Reference Maschner2009), researchers compiled comprehensive, detailed intertidal and nearshore food webs (Figure 1; Wood et al. Reference Wood, Russell, Hanson, Williams and Dunne2015; Dunne et al. Reference Dunne, Maschner, Betts, Huntly, Russell, Williams and Wood2016). Prior to Dunne et al. (Reference Dunne, Maschner, Betts, Huntly, Russell, Williams and Wood2016), only a few published food webs included humans as a node (e.g. Link Reference Link2002), and these lacked the detail necessary to assess network structure and other food-web features with confidence.
Sanak nearshore food web (Dunne et al. Reference Dunne, Maschner, Betts, Huntly, Russell, Williams and Wood2016). Vertical axis indicates ‘short-weighted’ trophic level. Sphere colour indicates type of taxon: green = algae; blue = miscellaneous (e.g. detritus, protozoa, bacteria, biofilm, lichen, seagrass); yellow = invertebrates; orange = fishes; red = mammals; purple = birds; red arrow indicates Homo sapiens (images created by the authors with Network3D) (Yoon et al. Reference Yoon, Williams, Levine, Yoon, Dunne and Martinez2004; Williams Reference Williams2010).

The Sanak Archipelago food webs were designed to address two primary questions. First, what trophic roles did humans play in the marine ecosystem? Second, what, if anything, do human roles and behaviours within complex food webs tell us about potential impacts of human presence (Dunne et al. Reference Dunne, Maschner, Betts, Huntly, Russell, Williams and Wood2016)? The results demonstrate that pre-modern Aleut people were highly omnivorous and super-generalist feeders compared with other species. They fed on 30 per cent of the taxa in the intertidal food webs and 24 per cent of the taxa in the nearshore food webs, making them more generalist than any other species, except Pacific cod. Aleut people fed at all trophic levels, consuming everything from algae and intertidal molluscs to high trophic-level species, such as Steller sea lions. Within food webs, mean path length is a simple measure of how quickly effects can spread through a network. The Aleut had some of the shortest paths to other species in the Sanak marine food webs and therefore potentially the greatest capacity to affect other species (Dunne et al. Reference Dunne, Maschner, Betts, Huntly, Russell, Williams and Wood2016).
The central position of Sanak Aleut people within the food web indicates that they could have depressed prey abundance, reorganised ecological community structure and function and contributed to short- and long-term local extinctions; yet, they did not. To explore why, Dunne et al. (Reference Dunne, Maschner, Betts, Huntly, Russell, Williams and Wood2016) used in silico (computer simulation) experiments to simulate the invasion of food webs by a species with structural roles similar to those of Aleut people. Using a non-linear dynamic food-web-modelling framework, the study explored the probability of secondary extinctions as a result of introducing a highly omnivorous, super-generalist species. The introduced species practised ‘prey-switching’ behaviour: as the abundance of a preferred prey species decreased, the predator switched to some other, now more abundant or easy-to-access prey. The introduced species also made use of ‘hunting technology’ behaviour that allowed it to feed at a rate ‘stronger’ than expected for a forager of its body size.
Humans globally, and Aleut people specifically, engage in prey-switching behaviour and use technology to hunt, gather and process some of their resources (Dunne et al. Reference Dunne, Maschner, Betts, Huntly, Russell, Williams and Wood2016). The results of the simulations suggest that while the introduction of a prey-switching, omnivorous super-generalist into a food web will probably lead to an initial, small number of secondary extinctions, very few additional extinctions will occur, as long as ‘strong’ feeding focuses on a small fraction of the available prey. In other words, a highly omnivorous, super-generalist species, like a human population, can invade and fit into an existing food web with few secondary extinctions, as long as they prey-switch and make only occasional use of ‘strong’ feeding practices.
The Ancestral Pueblo Southwest
To compile the first highly resolved terrestrial food web featuring humans, Crabtree et al. (Reference Crabtree, Vaughn and Crabtree2017) turned to the American Southwest, due to the region's unique preservation of the archaeological deposits and long tradition of archaeological inquiry. Working in the most densely populated region of the Ancestral Pueblo homeland, the study examined how Pueblo farming populations were affected by their ecosystem and how these farmers affected food webs. Researchers assembled three food webs: one each for the Pueblo I (AD 750–900), Pueblo II (AD 900–1150) and Pueblo III periods (AD 1150–1300), with each food web based on data from different archaeological sites.
Data from the Ancestral Pueblo Southwest were used to examine two main questions. First, can we understand farming populations as integral to food webs? Second, can changes in food webs help account for the abandonment of the region by Ancestral Pueblo peoples by AD 1300? The results indicate that in Pueblo I times, Ancestral Pueblo farmers had embedded themselves within the Four Corners ecosystem, as evident by the important position of several domesticated taxa in the structure of the food web. Recreating food webs highlights how Pueblo peoples had large impacts on the overall ecosystem: through direct predation, by the introduction of new taxa into the region and by niche construction. While previous research (e.g. Matson Reference Matson2016) indicated the importance of maize to Pueblo peoples, Crabtree et al. (Reference Crabtree, Vaughn and Crabtree2017) demonstrate how important maize became for the entire ecosystem of the Four Corners region.
To examine how changing abundances of both maize and wild taxa affected the Ancestral Pueblo peoples and the food web as a whole, Crabtree et al. (Reference Crabtree, Vaughn and Crabtree2017) performed node-knockout simulations to examine how years of drought might have affected taxa that were directly or indirectly reliant on maize. The simulations show that human vulnerability increased when maize was removed from the system, as it was used both as a key crop for humans and as fodder for domestic turkey—the primary source of protein after AD 900 (Rawlings & Driver Reference Rawlings and Driver2010). The loss of maize also affected other taxa, creating cascading pressures on wild grains. In light of research showing that many drought years occurred at the end of Pueblo II and during Pueblo III (Bocinsky et al. Reference Bocinsky, Rush, Kintigh and Kohler2016), the results suggest that increasing reliance on maize as both a direct and indirect food, coupled with periods of drought, exacerbated food insecurity for the Ancestral Pueblo peoples. Furthermore, with crops failing during drought years, pressure on stored maize may have grown, due to theft by other taxa who were also affected by drought-driven loss of wild cereals.
While previous research (Matson Reference Matson2016) demonstrated that up to 80 per cent of the diet of Ancestral Pueblo peoples comprised maize, Crabtree et al. (Reference Crabtree, Vaughn and Crabtree2017) show that Pueblo peoples still consumed many wild plants, although less frequently than maize. The choice to intensify maize agriculture had impacts on the plants cleared for maize fields, effectively removing the option to consume those plants. The act of clearing fields helped to transform parts of the Four Corners from a piñon-juniper woodland into a maize grassland. As noted by Wyckoff (Reference Wyckoff1977), arboreal pollen became as distant as 8km away. This created opportunities for taxa that preferred shrub-steppe habitat, such as Scaled quail, which is present in the Pueblo III archaeological food web, but not in earlier or current ecosystems. Node-knockout simulations suggest that decisions by households to intensify maize farming led to cascading ecological and environmental changes, which, in aggregate, may have made Ancestral Pueblo peoples more vulnerable to exogenous pressures, ultimately influencing their decisions to abandon the region (Crabtree et al. Reference Crabtree, Vaughn and Crabtree2017).
The added value of food-web approaches for archaeology
The two case studies presented above demonstrate that it is possible to compile detailed food webs that use archaeological data to integrate humans into the analysis. Moreover, they show that such networks provide insights into the position and effects of humans within ecosystems. We propose that multiple questions about humans and ecosystems can be informed using food-web approaches, such as those presented in the two case studies (Table 1). Additionally, as the number of studies of humans in modern and ancient food webs increases, we expect there will be value in comparative analyses and syntheses (Dunne et al. Reference Dunne, Williams and Martinez2004), allowing for assessments of the generalities and specificities of the place of humans in global ecosystems and at different points in time.
Examples of how food webs and other ecological models can inform various questions about human-ecosystem interactions. This list is not exhaustive; rather, it is meant to demonstrate the utility of this approach.

Practical guidance for assembling archaeo-ecological networks
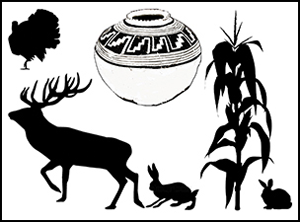
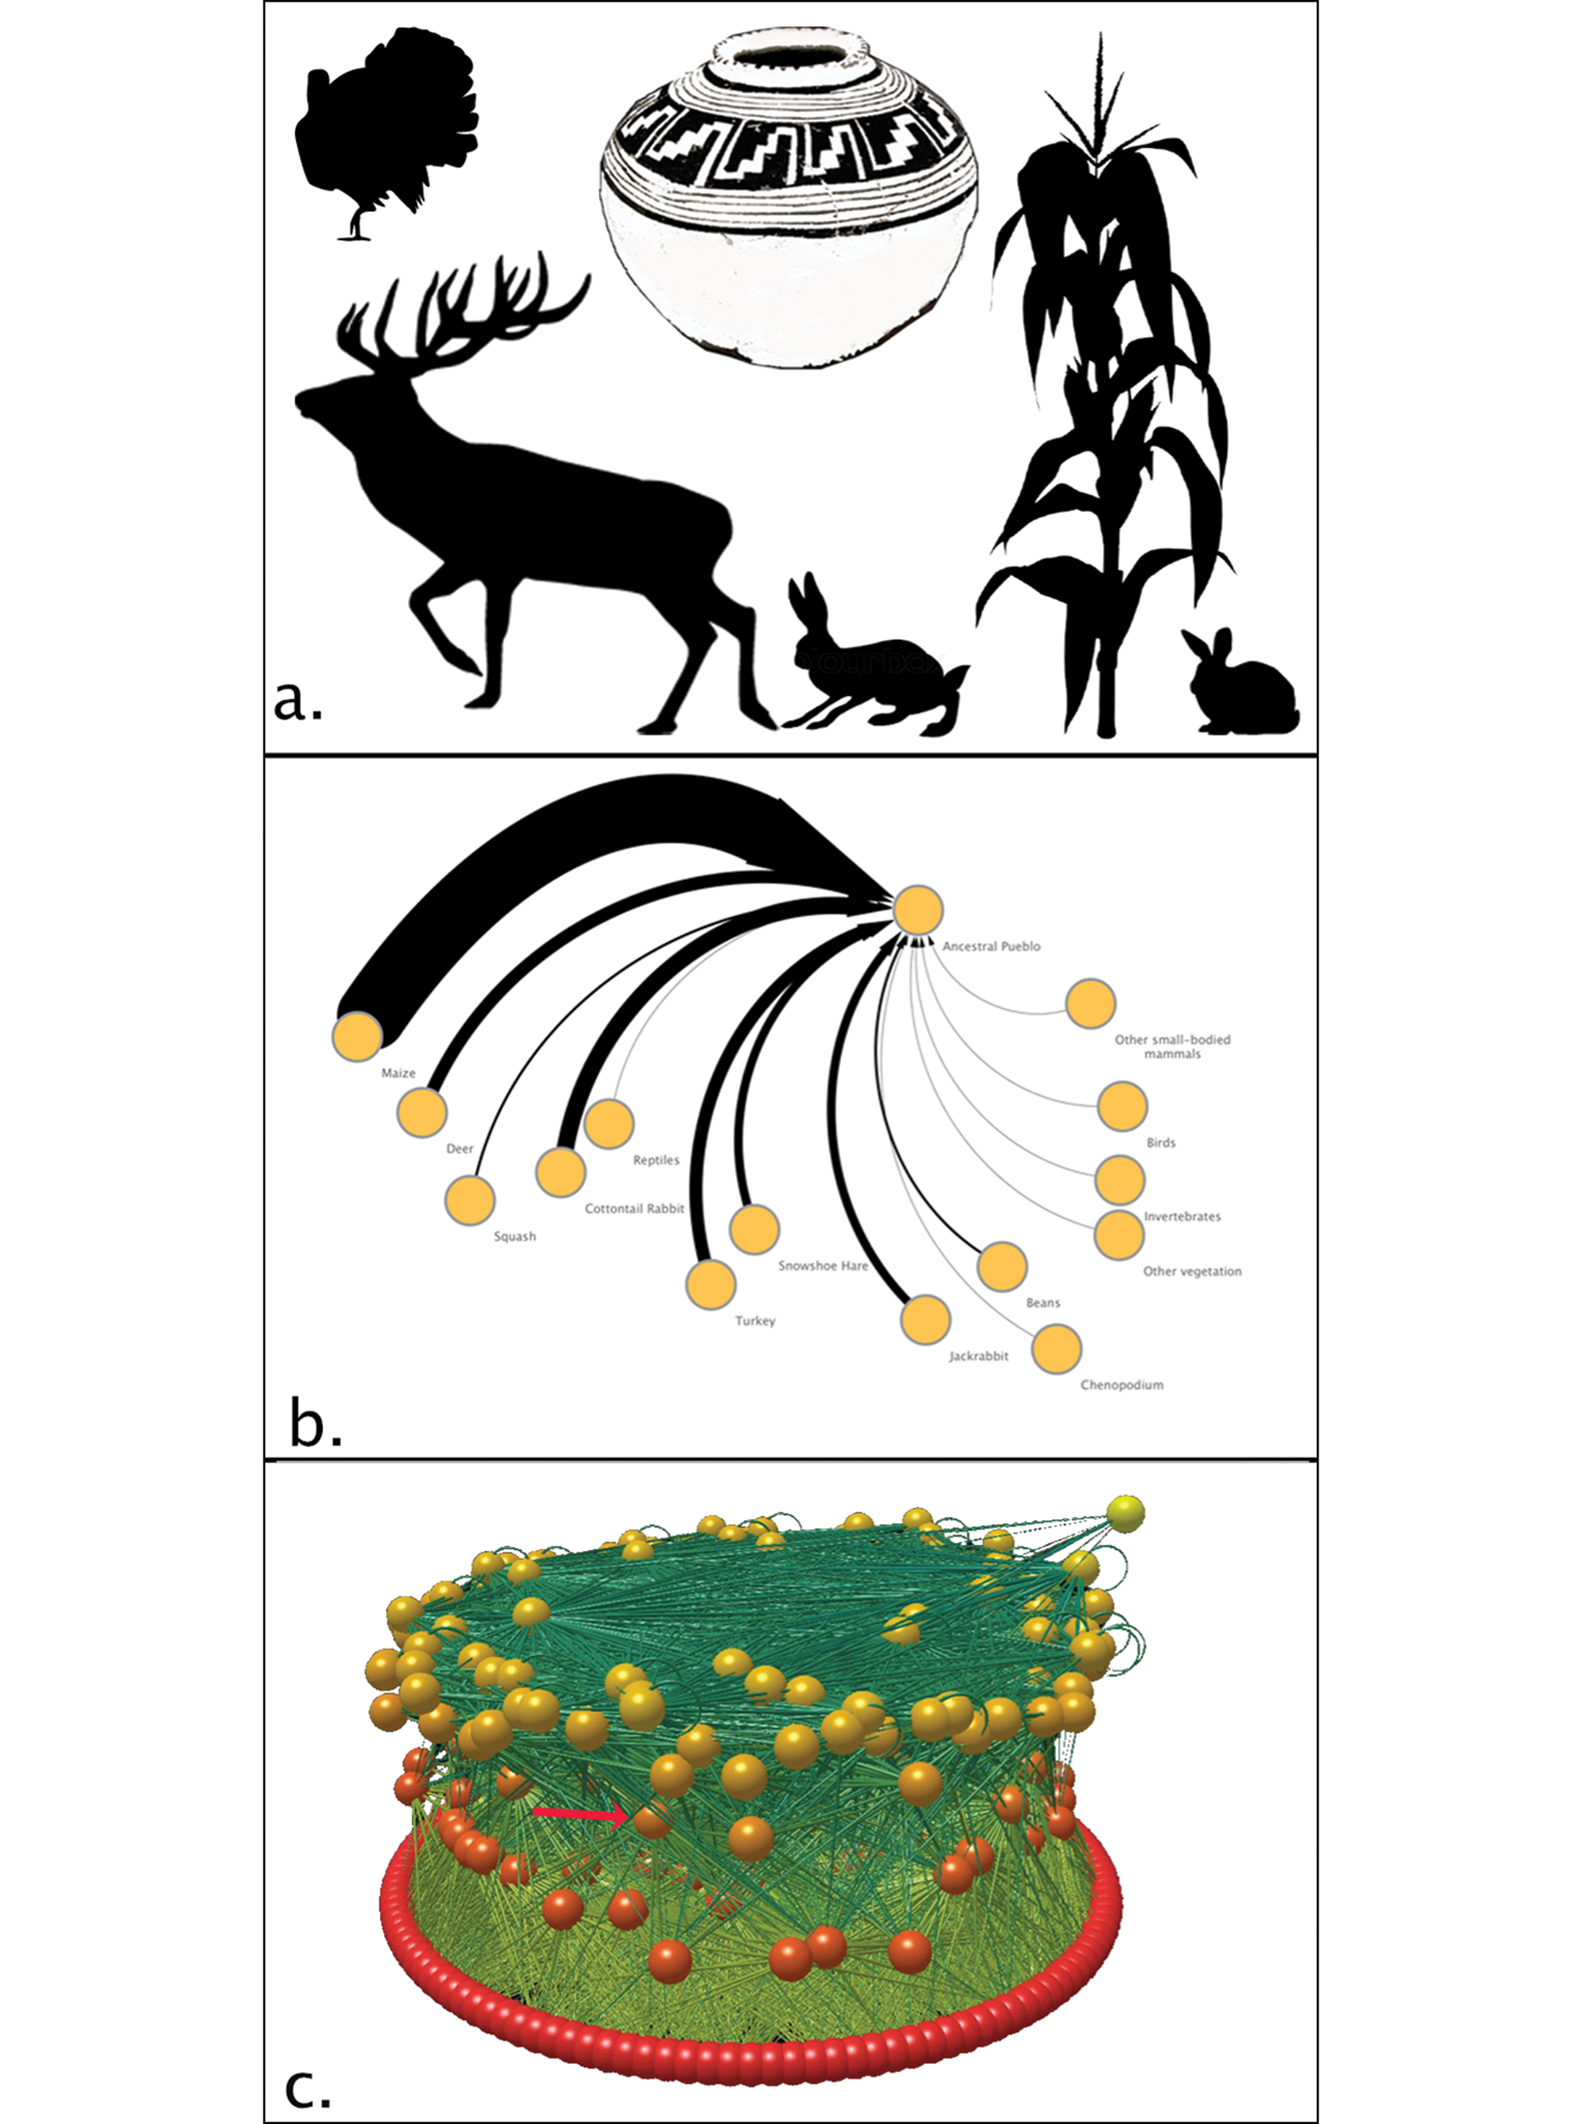
Several points of best practice are beginning to emerge from these studies that have compiled trophic information to examine human-inclusive food webs. In an effort to provide practical guidance, we highlight key considerations for assembling high-quality food-web datasets that incorporate archaeo-ecological information. We also identify several challenges that researchers should be aware of as they compile their own interaction networks to address questions about socio-ecological systems (Figure 2).
The development and analysis of the food web from Crabtree et al. (Reference Crabtree, Vaughn and Crabtree2017): a) identifying taxa from archaeological contexts; b) connecting taxa to the human node. Additional information can be added, such as proportion of remains recovered; c) full food web comprising 334 species joined by 11 344 links. The red arrow indicates Homo sapiens; their non-integer trophic level of 2.52 indicates that they are omnivores. Sphere colour corresponds to trophic level: red = primary producers; orange = primary consumers; light orange = omnivores; yellow = carnivores.
Compiling taxonomic catalogues that capture ecological diversity
Catalogues of extinct and extant taxa are a useful and familiar starting point for the creation of ecological networks. Beginning with the archaeological record, lists of recovered taxa are a record of species that potentially interacted in the past. As evidence for only some taxa will be preserved in the archaeological record, it may be necessary to integrate knowledge of contemporary species. If the modern-day environment is similar to the archaeological environment, knowledge of the present ecosystem can be used to enhance taxonomic diversity. Field guides, ethnographic and ecological studies, and local experts are valuable sources of information for the compilation of a more complete catalogue of the local taxa that may have existed in the past.
Compiling known feeding links from multiple sources
The catalogue of taxa inhabiting a region can guide the search for information on known consumers of and prey (also known as resources) for each taxon. Often, the most thorough and taxonomically resolved information is found in primary and grey ecological literature and databases. Research on feeding ecology usually involves directly observing and recording predation events, or dissecting and cataloguing gut contents, particularly of mammals, fish and other relatively large-bodied predators. Traditional knowledge-holders and naturalists can also provide detailed descriptions of some trophic links. We have found that expert knowledge of local taxa and their interactions is often much richer than documented in the published record. In a third, human-centred food web, for example, researchers interviewed Aboriginal people living in the Western Desert of Australia to compile feeding behaviours of now extinct taxa, thereby leveraging traditional ecological knowledge (e.g. see Crabtree et al. Reference Crabtree, Bird and Bird2019). Additionally, multiple observations of the same interaction—in different locations or times—can be valuable.
Specifying the spatio-temporal extent and resolution of the study
Food webs change over space and time, and it is therefore critical to define the target region and time periods. Depending on the goals of the research, one must also consider the spatial extent of the network, how resolved the network needs to be in order to answer the research questions, and the availability of published taxonomic information and known feeding links. If, for example, the goal is to understand changes over time, then data from a region with detailed knowledge of the dates of local extinctions could be used to construct food webs that aggregate across multiple archaeological sites to provide the most robust diachronic view of the ecosystem.
Addressing varying taxonomic resolutions
Taxonomic catalogues and known feeding links are always resolved at different and often overlapping taxonomic levels. Generally, lower trophic-level taxa, such as insects or plankton, are aggregated into higher-order groups due to difficulties in distinguishing taxa with overlapping characteristics and habits (Potapov et al. Reference Potapov, Scheu and Tiunov2019). We recommend cataloguing data at the finest possible taxonomic level, and then aggregating it in an interaction network that maintains the integrity and assumptions of the underlying datasets.
Collaborating with data and domain experts
Just as expertise in local cultural history is important for understanding the past, expertise in the ecology and natural history of a study region is invaluable when determining the many assumptions that are required to construct interaction networks. When, for example, is it reasonable to assume that a feeding link observed elsewhere in the world will also exist between the same taxa within a specific study region? When can data limitations be overcome by aggregating taxa into higher-order groups, and when does taxonomic aggregation mask important ecological detail? Every ecological community, for example, has some proportion of ‘specialist’ taxa that subsist entirely on one or a few specific resource taxa. Without knowledge of their natural history, it would be difficult to distinguish specialist taxa from ones that are simply understudied. Collaborations with data experts are similarly important for managing the scope and complexity of data, which are in turn necessary to apply network analysis and modelling approaches. There are extant procedures and tools that have been widely adopted as best practice by both archaeology and other disciplines for improving data quality, usability and reproducibility for open science (e.g. Marwick et al. Reference Marwick2017). These will enable better archaeo-ecological research.
Conclusions
A deep understanding of the role of humans within ecosystems is essential as we endeavour to understand the place of humans in modern ecosystems, and as we confront the ways in which anthropogenic changes affect the planet. Ecological networks built from archaeological data provide one way to study ecological changes, such as human-mediated invasions and extinctions, and to add nuance to our understanding of humanity's past. While there are practical barriers to creating food webs in the past, the challenges are surmountable and the approach is ripe for archaeological inquiry. Furthermore, archaeological data can provide insights into modern ecological dynamics, allowing us to calibrate our understanding of our place in the modern world based on the archaeological past.
Ecological networks add value to our understanding of the past by recreating both the biotic and abiotic environments in silico, thereby facilitating quantitative research on questions related to the ecological consequences of human action, the extirpation/introduction of other species and the impacts of removing humans from a system. Network approaches may help to answer questions that have confounded archaeologists for decades. How, for instance, does the intensification of farming affect resident populations of both humans and animals, and how do catastrophic events, such as flooding events coupled with intensive agriculture, affect ecosystems (e.g. Benson et al. Reference Benson, Pauketat and Cook2009)? Furthermore, food webs offer ways to integrate zooarchaeological and archaeobotanical remains with environmental reconstructions to generate and test hypotheses about how ecosystems respond to these changes. They can demonstrate not only how past environments were more mesic or xeric, but also can indicate how corresponding ecological changes would have created opportunities or pressures for human inhabitants. Finally, it is important to emphasise that the creation of ecological networks should not be conceived as a stage that follows the completion of fieldwork. Rather, they should be integral to projects from the outset and developed in tandem with field methods and theory. With thought given to computational methods early on in a study, it is possible to refine hypotheses, ask more nuanced questions and advance a better understanding of the past.
Archaeology as a field is built on data acquired from excavations and field surveys. After over 100 years as a formal discipline, we are now able to embrace landscape-level, data-driven syntheses of past human societies. It is becoming more typical to use transdisciplinary research, approaches and computational modelling methodologies to ask and answer the types of questions upon which archaeology is founded (d'Alpoim Guedes et al. Reference d'Alpoim Guedes, Crabtree, Bocinsky and Kohler2016; Rogers & Cegielski Reference Rogers and Cegielski2017; Marwick et al. Reference Marwick2017). The food-web approaches discussed here will likely be most useful when they are developed in conjunction with broader archaeological research projects, and particularly when there is a dialogue between fieldwork, data compilation and analysis, and computational modelling. With the adoption of network tools and familiarity with the opportunities and limitations of these approaches, researchers can build on this toolkit to address new avenues of research.
We propose that food-web research, and ecological network approaches more broadly, will be valuable for uniting archaeology and ecology. In our collective efforts to understand the long trajectory of humanity, food webs can provide a common language for posing and addressing questions about how humans are embedded in ecosystems. They can also serve as a valuable framework for integrating archaeological and ecological data and models. The disciplines of archaeology and ecology are both attempting to answer questions about the long-term transformation of the Earth to understand the trajectory of our planet's diverse ecosystems. By bringing together knowledge of past societies with food-web research, we are poised to gain a greater understanding of how humanity shapes, and is shaped by, environments. Combining these two complementary fields will enable us to calibrate our understanding of the present and future on the rich and varied past.
Acknowledgements
We particularly thank J. Kahn and R. Bird, along with the rest of the ArchaeoEcology Project Working Group, for conversations that helped shape this article.
Funding statement
This research was supported by the Coalition for Archaeological Synthesis, the National Science Foundation (CNH-1313830) and the Santa Fe Institute.


 Open access