


Introduction
In all types of modern poultry husbandry, coccidiosis is one of the most economically important infectious diseases (Chapman et al., Reference Chapman, Barta, Blake, Gruber, Jenkins, Smith, Suo and Tomley2013; Blake and Tomley, Reference Blake and Tomley2014; Witcombe and Smith, Reference Witcombe and Smith2014). The disease is caused by obligate intracellular protozoan parasites of the genus Eimeria, phylum Apicomplexa, and seven different Eimeria species can infect domestic fowl. The life cycle of Eimeria is monoxenous and involves three phases: sporulation of oocysts that occur outside the host, schizogony (repeated asexual replication over several generations) and gametogony (sexual replication) that occur inside the host. The oocyst stage is extremely resilient in the environment and to chemical disinfectants and the infection is therefore very difficult to eliminate solely with hygienic measures. Currently, disease control in poultry relies on either routine chemoprophylaxis using so-called coccidiostats or vaccination with live virulent or attenuated Eimeria parasites (Witcombe and Smith, Reference Witcombe and Smith2014; Soutter et al., Reference Soutter, Werling, Tomley and Blake2020). Both methods work satisfactory but are not sustainable due to several reasons including the development of parasite resistance against coccidiostats, difficulties in scaling up production of live vaccines, costs and ethics. The demand for new control measures such as a subunit vaccine is therefore high. However, in order to effectively develop and evaluate new prophylactic methods more knowledge on infection biology and parasite–host interaction between Eimeria and the chicken is needed. It is known that Eimeria infection results in robust Eimeria species-specific immunity in chickens and that features associated with Th1-type responses such as cytotoxic T-cells and IFN-γ production rather than specific antibody development are important in protective immunity (McDonald and Shirley, Reference McDonald and Shirley2009; Kim et al., Reference Kim, Chaudhari and Lillehoj2019; Soutter et al., Reference Soutter, Werling, Tomley and Blake2020). Nonetheless, information on the early recognition of Eimeria infection by host cells and initiation of ensuing immune responses as well as on parasite activities during this stage is very limited. For example, a crucial event in the initiation of protective immune responses is the correct recognition of pathogen-associated molecular patterns (PAMPs) by pathogen recognition receptors (PRR) of the innate immune system. While PRR recognition of bacterial and viral infections (Kawai and Akira, Reference Kawai and Akira2009) has been more intensely studied, their involvement in recognition of Apicomplexan protozoa has also been described (Denkers, Reference Denkers2010). Also, protozoan PAMPs (Egan et al., Reference Egan, Sukhumavasi, Butcher and Denkers2009; Ghosh and Stumhofer, Reference Ghosh and Stumhofer2013; Dos-Santos et al., Reference Dos-Santos, Carvalho-Kelly, Dick and Meyer-Fernandes2016), e.g. glycosylphosphatidylinositol (GPI)-anchored surface antigens (SAGs), including those from E. tenella (Chow et al., Reference Chow, Wan, Blake, Tomley and Nathan2011) have been suggested. There are also studies that indicate expressional changes for some PRR during acute Eimeria infections of chickens (Sumners et al., Reference Sumners, Miska, Jenkins, Fetterer, Cox, Kim and Dalloul2011; Zhang et al., Reference Zhang, Liu, Ma, Wang, Pan, Cai and Wang2012) and in Eimeria stimulated chicken cells in vitro (Zhou et al., Reference Zhou, Wang, Cao, Hu, Zhang, Qin, Guo and Nie2013). However, no real consensus on PRR that are involved in the recognition of Eimeria parasites nor on the ligands involved has yet been reached.
Host–pathogen interactions during an infection are dependent on complex and interlinked alterations in the gene expression patterns of both parties. Dual RNA-Seq refers to high-throughput sequencing of the transcriptome of both an infected host and a pathogen in the same sample and allows for precise and sensitive characterization of such gene expression pattern changes. Among intracellular parasites, the methodology has been used to study parasite and host cell transcriptomes of e.g. Trypanosoma cruzi (Li et al., Reference Li, Shah-Simpson, Okrah, Belew, Choi, Caradonna, Padmanabhan, Ndegwa, Temanni, Corrada Bravo, El-Sayed and Burleigh2016) and Leishmania spp (Dillon et al., Reference Dillon, Suresh, Okrah, Corrada Bravo, Mosser and El-Sayed2015; Fernandes et al., Reference Fernandes, Dillon, Belew, Bravo, Mosser and El-Sayed2016) in vitro. In vivo transcriptional responses of E. falciformis (Ehret et al., Reference Ehret, Spork, Dieterich, Lucius and Heitlinger2017) and Toxoplasma gondii (Pittman et al., Reference Pittman, Aliota and Knoll2014) and their murine hosts have also been studied using dual RNA-Seq. We wanted to explore this approach to obtain a comprehensive view of parasite and host events during the early phase of Eimeria infection of chicken cells in vitro. Eimeria parasites are not readily propagated to perform their full life cycle in cell-line culture but cell-line systems where the first generation schizogony of E. tenella takes place have been described (Patton, Reference Patton1965; Crane et al., Reference Crane, Schmatz, Stevens, Habbersett and Murray1984; Heriveau et al., Reference Heriveau, Dimier-Poisson, Lowenthal, Naciri and Quéré2000; Tierney and Mulcahy, Reference Tierney and Mulcahy2003; Bussière et al., Reference Bussière, Niepceron, Sausset, Esnault, Silvestre, Walker, Smith, Quéré and Laurent2018). Eimeria tenella is one of the most pathogenic Eimeria species that infects chickens and it replicates exclusively in the chicken caecal tissues (Chapman and Shirley, Reference Chapman and Shirley2003). Several cell types, mammalian and avian, can sustain E. tenella replication in vitro to a degree, but with varying success with respect to the production of free first-generation merozoites. Madin-Darby bovine kidney (MDBK) cells are often referred to as a ‘gold standard’ (Patton, Reference Patton1965; Crane et al., Reference Crane, Schmatz, Stevens, Habbersett and Murray1984; Heriveau et al., Reference Heriveau, Dimier-Poisson, Lowenthal, Naciri and Quéré2000; Tierney and Mulcahy, Reference Tierney and Mulcahy2003; Bussière et al., Reference Bussière, Niepceron, Sausset, Esnault, Silvestre, Walker, Smith, Quéré and Laurent2018). Of the immortal chicken cell lines available to us we found that the retrovirus transformed chicken macrophage cell-line HD11 (Beug et al., Reference Beug, Von Kirchbach, Döderlein, Conscience and Graf1979) sustained E. tenella replication to the same degree or better than MDBK cells (unpublished data). In this system, we observed first-generation schizonts and some free merozoites by light microscopy at 48–50 h post-infection (hpi), while the major number of free merozoite clusters appeared at 60–72 hpi. This agrees with how this E. tenella strain (Houghton) behaves in vivo where first-generation schizonts start to appear 48 hpi and are present at maximum numbers at 60 hpi (Chapman and Shirley, Reference Chapman and Shirley2003).
Thus, to gain more insight into the Eimeria–chicken interaction during the first phase of parasite infection we used the in vitro E. tenella infection model in HD11 for dual RNA-Seq analysis. The study aimed to monitor the kinetics of the early transcriptional events of the parasites and the chicken host cells with special focus on potential mechanisms of host recognition of parasite infection.
Materials and methods
Maintenance of the E. tenella isolate and generation of sporulated oocysts
The authors assert that all procedures contributing to this work comply with the ethical standards of the relevant national and institutional guides on the care and use of laboratory animals. A pure E. tenella Houghton strain isolate (Chapman and Shirley, Reference Chapman and Shirley2003) was maintained by twice-yearly passage in chickens, which was approved by the Uppsala Regional Ethical Committee for Animal Experiments, permit no. C44/16, and sporulated oocysts were prepared from feces as previously described (Wattrang et al., Reference Wattrang, Magnusson, Näslund, Thebo, Hagström, Smith and Lundén2016).
Isolation and purification of E. tenella sporozoites
Sporozoites were purified from sporulated E. tenella oocysts stored for a maximum of 1-month at 4°C using a protocol described by Schmatz et al. (Reference Schmatz, Crane and Murray1984). In brief, sporulated oocysts were surface sterilized by NaClO solution, washed, mechanically disrupted with glass beads after which sporocysts were opened using taurocholic acid and trypsin. Sporozoites were purified using DE-52 anion exchange chromatography matrix (Whatman®, Sigma–Aldrich Merck; this is a discontinued product) and counted in 0.4% trypan blue solution and suspended in fetal calf serum (FCS; Gibco® #10082147, ThermoFisher Scientific) with 10% dimethyl sulfoxide and cryopreserved in liquid nitrogen until used for infections in cell culture.
Infection of HD11 cells with E. tenella sporozoites
The immortalized chicken macrophage cell-line HD11 (Beug et al., Reference Beug, Von Kirchbach, Döderlein, Conscience and Graf1979) was maintained in the growth medium, i.e. RPMI 1640 (National Veterinary Institute) supplemented with 200 IU penicillin mL−1, 100 μg streptomycin mL−1, 2 mm L-glutamine, and 5% FCS. Before infection HD11 cells were trypsinised and live cells were counted by trypan blue exclusion. Cells were seeded at 5.6 × 10⁵ cells per well in flat-bottomed 6-well tissue culture plates (Nunc™, ThermoFisher Scientific) in 2 mL of growth medium and at 0.35 × 10⁵ cells per well in flat-bottomed 96-well tissue culture plates (Nunc™, ThermoFisher Scientific) in 100 μL of growth medium. Plates were incubated at 40°C, 5.2% CO2 in air at a humid atmosphere for 24 h after which the HD11 cells were approximately 50–70% confluent in the wells. Cryopreserved E. tenella sporozoites were thawed into RPMI 1640 medium with 15% FCS, centrifuged down at 910 × g for 7 min, resuspended in growth medium and viable sporozoites were counted by trypan blue exclusion. At infection, 4.5 × 10⁶ sporozoites per well in 6-well plates and 0.28 × 10⁶ sporozoites per well in 96-well plates were added to the cultures aiming at a ratio of 4 sporozoites per HD11 cell. The same volume of growth medium without parasites was added to uninfected control cultures. Plates were then cultured until RNA harvest at 2, 4, 12, 24, 48 and 72 hpi. For plates cultured longer than 24 h, growth medium was removed at 24 h, cultures washed with phosphate-buffered saline (PBS; without Ca2+ and Mg2+ at pH 7) to remove loose sporozoites and fresh growth medium was added to the wells before culture was continued. At RNA harvest in 6-well cultures, the growth medium was removed, and cultures were washed gently with PBS, where after 1 mL TRIzol® Reagent (ThermoFisher Scientific) was added to the well. The cells were detached and dissolved by pipetting up and down and the suspension was subsequently frozen at −70°C and stored until RNA isolation. For each time point, both infected and uninfected cultures were harvested in parallel. Pure sporozoites were used as a control for parasites. All controls and samples, except for the pure sporozoite sample, were harvested in triplicates for biological replicates. All sporozoites used in the present study were isolated at one occasion from the same batch of oocysts. For each thawed aliquot of sporozoites 96-well cultures of infected HD11 cells were set up in parallel to the 6-well cultures for RNA harvest and these were monitored by light microscopy for 72 h to observe schizont development and appearance of clusters of live merozoites to ensure that the first schizogony was completed in the cultures.
RNA isolation
For RNA isolation 1 mL of HD11 cell lysate in TRIzol was used and total RNA was extracted according to the TRIzol manufacturer's protocol. The isolated RNA was subsequently treated with DNase (TURBO™ DNase, 2 U μL−1, ThermoFisher Scientific) according to the manufacturers' protocol and further purified using reagents and the ‘RNA clean-up’ protocol of the RNeasy Mini kit (Qiagen). RNA concentration and quality were then assessed using the Agilent RNA 6000 Nano kit on a 2100 Bioanalyzer Instrument (Agilent) and the RNA stored at −70°C until further analysis.
Sequencing
The dataset consisted of samples taken from infected and uninfected chicken cell cultures at 2, 4, 12, 24, 48 and 72 hpi, each in triplicate cultures. The sequencing libraries were prepared from 120 ng and 500 ng total RNA using the TruSeq stranded mRNA library preparation kit (Illumina) including poly-A selection. The sequencing was done with a HiSeq 2500 machine (Illumina) with 125 bp reads using v4 sequencing chemistry. A pilot sequencing of one pair of samples from 2 hpi and two pairs from 4 and 24 hpi were prepared from 500 ng RNA and the rest from 120 ng. The resulting data were deposited in the Gene Expression Omnibus under accession number GSE154393 and the Sequence Read Archive under accession number SRP271757.
Read counting
The data were quality checked using FastQC v 0.11.8 (Andrews, Reference Andrews2010) with default settings. MultiQC v 1.8 (Ewels et al., Reference Ewels, Magnusson, Lundin and Käller2016) was used to collate reports. The raw read data were trimmed using Trimmomatic v 0.36 (Bolger et al., Reference Bolger, Lohse and Usadel2014), with a sliding window of length four and an average quality threshold of 20, removing Illumina adapter sequences and removing any reads shorter than 50 bp after trimming. The read mapping was done using the STAR mapper v 2.7.2b (Dobin et al., Reference Dobin, Davis, Schlesinger, Drenkow, Zaleski, Jha, Batut, Chaisson and Gingeras2013) using default settings. The reads were mapped to the concatenated reference genomes for Gallus gallus (GCF_000002315.6_GRCg6a) and Eimeria tenella (GCF_499545.2_ETH001). The reads mapping to features were counted using HTSeq v 0.9.1 (Anders et al., Reference Anders, Pyl and Huber2015), with strandedness set to reverse and otherwise default settings. The computations were performed on resources provided by SNIC through Uppsala Multidisciplinary Centre for Advanced Computational Science (UPPMAX) under Project SNIC 2020/15–16.
Differential expression analysis
Differential expression (DE) analysis was run in edgeR v 3.28.1 (Robinson et al., Reference Robinson, Mccarthy and Smyth2010) using the Quasi-likelihood F-test (glmQLFTest). The thresholds used for DE was a |log2 fold change| >1 and an FDR, i.e. P value adjusted for multiple hypothesis testing using the Benjamini-Hochberg method, of <0.05. The comparisons made were infected vs uninfected at each sampling time for chicken data and parasites at the infection timepoints vs a pure sporozoite sample for E. tenella data. Gene Ontology (GO) and Kyoto Encyclopaedia of Genes and Genomes (KEGG) enrichment analysis of the chicken data was accomplished using the R packages GO.db (Carlson, Reference Carlson2019a), org.Gg.eg.db (Carlson, Reference Carlson2019b), and the KEGGrest API (Tenenbaum, Reference Tenenbaum2020), along with edgeR functions. Due to a lack of available annotation packages for E. tenella, the GO and KEGG annotations were taken from ToxoDB (Gajria et al., Reference Gajria, Bahl, Brestelli, Dommer, Fischer, Gao, Heiges, Iodice, Kissinger, Mackey, Pinney, Roos, Stoeckert, Wang and Brunk2008) and generated through KEGG's BlastKOALA tool, respectively. The enrichment analysis was done using ad hoc scripts, available from the authors on request. Visualization of the results was done using the following R packages: EnhancedVolcano (Blighe et al., Reference Blighe, Rana and Lewis2020), ggbiplot (Vu, Reference Vu2011), ggplot2 (Wickham, Reference Wickham2016), ClassDiscovery (Coombes, Reference Coombes2019), RColorBrewer (Neuwirth, Reference Neuwirth2014) and functions that are part of edgeR. The data used as input were CPM (Counts Per Million) normalized count data from both organisms that had been filtered to exclude genes with low expression across samples.
Results
Sequencing and read counting
Sequencing was performed on 39 RNA samples from E. tenella infected and uninfected chicken HD11 macrophage cells at 2, 4, 12, 24, 48 and 72 hpi and a pure sample of E. tenella sporozoites, all in triplicates except the sporozoite sample. A minimum of 10 million reads was generated from each sample. Read counting was subsequently performed, the reads were mapped to both the chicken and E. tenella genomes simultaneously and the number of reads mapping to genes counted. Supplementary Table S1 shows the information on the samples and the fraction of reads mapping to features, i.e. any expressed parts of the genome. The mapping rate to features was generally high for HD11 samples, ~80–85%, but much lower for the pure E. tenella sample, ~65%.
The fraction of reads mapping to the E. tenella genome varied considerably (min of 0.466% at 2 hpi and max of 5.936% at 48 hpi) over time (Fig. 1). There was also a considerable variance between samples at certain time points. The average fraction of E. tenella reads was only ~0.5% at 12 hpi but reached an average of 5.4% at 48 hpi. It then decreased to approximately 3% at 72 hpi. A potential explanation for this pattern is that at 12 hpi, the parasite is in the early stages of the trophozoite form, where it is not yet dividing. At 48 hpi, the parasite has likely finished several rounds of asexual replication within the first merogony, resulting in a large number of merozoites. At 72 hpi, the first merogony is most likely finished in a large proportion of the infected cells resulting in the release of merozoites, some of which were probably washed away and lost when the RNA was harvested.
The proportion of E. tenella read counts in mRNA samples from chicken HD11 cells infected in vitro with purified E. tenella sporozoites at 0 h. Black dots represent individual sample values and the line represents mean values at the indicated time points post-infection.

Multidimensional scaling and DE analysis
A multidimensional scaling (MDS) analysis was performed on the count data (Fig. 2), revealing a more scattered distribution for the chicken data compared to the E. tenella data. For the chicken gene expression, infected and uninfected samples were not clearly separated but had a trend of separation along the axis of leading log fold change 1. A weak trend of separation of early and late time points was evident along the axis of leading log fold change 2. This contrasted dramatically with the E. tenella data where the MDS plot showed samples from close time points clustering, with three main clusters forming for 2/4, 12/24 and 48/72 hpi samples. This clustering indicates that E. tenella has three distinct stages during the experiment: sporozoite-like at 0–4 hpi, trophozoite-like at 12–24 hpi and merozoite-like at 48–72 hpi.
Multidimensional scaling plots for the normalized count data in mRNA samples collected at the indicated time points from uninfected chicken HD11 cells or HD11 cells infected in vitro with purified E. tenella sporozoites at 0 h. Panel A shows individual sample values for chicken data with infected samples in black and uninfected in grey. Panel B shows individual sample values for E. tenella data.

DE analysis was conducted for chicken gene expression at each time point, comparing samples from infected cells to samples from uninfected ones collected at the same time point. For E. tenella, gene expression from each time point was instead compared to that in the pure sporozoite sample. The volcano plots (Figs 3 and 4) show the changing expression profile of each organism as the infection progressed. For the chicken (Fig. 3), the number of upregulated genes increased up to 24 hpi, where it peaked and then decreased slightly at 48 and 72 hpi. The number of downregulated genes increased in a slower fashion and peaked at 24 hpi. A far smaller number of genes were significantly downregulated in the last two time points. For E. tenella (Fig. 4), a large number of genes were either up- or downregulated across the different time points, with both categories quickly increasing from 2 hpi and showing similarities between 12 and 24 hpi and 48 and 72 hpi, respectively. A relatively small number of genes were differentially expressed at 2 hpi, showing that expression remained fairly similar to the sporozoites.
Volcano plots of the differential expression, mRNA from E. tenella infected vs uninfected cells, of all chicken genes at the indicated time points in mRNA samples from chicken HD11 cells infected in vitro with purified E. tenella sporozoites at 0 h. The significance thresholds were set at log2 fold change of ±1 and a false discovery rate of 0.05. NS stands for non-significant.

Volcano plots of the differential expression, E. tenella mRNA from infected HD11 cells vs E. tenella mRNA from sporozoites, of all E. tenella genes at the indicated time points in mRNA samples from chicken HD11 cells infected in vitro with purified E. tenella sporozoites at 0 h. The significance thresholds were set at log2 fold change of ±1 and a false discovery rate of 0.05. NS stands for non-significant.

GO and KEGG analysis
In order to elucidate the broad function of the differentially expressed genes in each organism, both GO category and KEGG pathway enrichment analyses were run on both datasets. The top 10 most significantly enriched categories at each time point can be found in Supplementary Tables S2–S5 with the main results presented here.
At the earliest two time points, the top GO categories for the chicken indicated a response to environmental stimuli, an upregulation of transcription and a general upregulation of metabolism. This includes categories such as ‘Response to chemical’ (GO: 0042221) and ‘Positive regulation of transcription by RNA polymerase II’ (GO: 0045944). At 12 hpi, the top categories had shifted towards signalling, such as ‘Cell communication’ (GO: 0007154), and developmental processes. For the earlier time points, the categories were generally upregulated but at 12 hpi there was a mix of up- and downregulated genes within each category. At 24 hpi, the largest number of significantly differentially expressed genes were observed, both up- and downregulated, the majority of which were involved in developmental processes. At 48 and 72 hpi, the top categories shifted back to cellular response, signalling and sensing but with more of a mix of up- and downregulation than in the early time points.
In the KEGG pathway enrichment for the chicken, a clearer pattern emerged. At 4 hpi, there was a general upregulation of a variety of signalling pathways, such as ‘NOD-like receptor signalling pathway’ (KO: 04621) and ‘Toll-like receptor signalling pathway’ (KO: 04620), likely to be partly due to shared genes across these pathways but also indicating a response to infection. The upregulation of signalling pathways continued at 12 hpi, although there were several downregulated genes within most pathways. A significant downregulation of the ‘Metabolic pathways’ (KO: 01100) also indicated that the metabolism of the cells was being affected. For the remaining time points, the ‘Lysosome’ (KO: 04142) and ‘Phagosome’ (KO: 04145) pathways were the two with most significantly altered expression. Within both pathways, genes were significantly downregulated, with the strongest downregulation at 24 hpi. The ‘Metabolic pathways’ remained significantly downregulated as a whole, but also several upregulated genes, indicating that the general metabolism was strongly affected by the infection. At 48 hpi and continuing at 72 hpi, signalling pathways returned to the top 10 most significant categories but the pathways that were upregulated during early time points were downregulated here.
For the E. tenella GO analysis, two categories were consistently affected across all time points: ‘Dephosphorylation’ (GO: 0016311) and ‘mRNA splicing via spliceosome’ (GO: 0000398), both significantly downregulated. Another category, ‘Translation’ (GO: 0006412), was significantly upregulated from 12 hpi onwards. More generally, a variety of RNA and DNA processing and regulation of processing categories were among the top significant categories, generally downregulated. At 12 hpi, ‘Glycolytic process’ (GO: 0006096) also became significantly upregulated and remained among the top categories from there onwards, likely due to the growth and replication occurring at the later time points.
For the KEGG pathways, the ‘Spliceosome’ (KO: 03040) pathway was the most significantly enriched at all time points, always downregulated. The ‘Ribosome’ (KO: 03010) and ‘Proteasome’ (KO: 03050) also appear at all but the first time point, always upregulated. Otherwise, there was a clearer signal from expression in metabolic gene categories at 12 hpi onwards, with both ‘Glycolysis / Gluconeogenesis’ (KO: 00010) and ‘Citrate cycle (TCA cycle)’ (KO: 00020) pathways being significantly upregulated, among others.
Expression of chicken immune genes and E. tenella invasion/infection genes
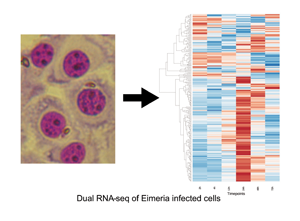
Separate analyses of genes putatively involved in host immune responses and parasite invasion/infection processes were also undertaken. In order to examine the immune response in the chicken cells, all genes that were associated with GO:0002376, ‘Immune systems process’ including all subcategories, as well as immune system-related KEGG pathways were identified. Of these genes, those that showed significant DE in at least one-time point were then plotted in a heatmap (Fig. 5) together with a hierarchical clustering dendrogram, showing which genes had similar expression patterns. This analysis showed a few dominant patterns of expression. A majority of genes were heavily downregulated at 24 hpi, especially those that were upregulated at 2 and 72 hpi. A smaller number of genes depicted at the top of Fig. 5 showed the opposite pattern.
The heatmap depicts the expression profile of 241 immune-related chicken genes in mRNA samples from chicken HD11 cells infected in vitro with purified E. tenella sporozoites at 0 h. Blue represents upregulation and red downregulation. Expression is normalized within each row. For details on the selection of immune-related genes see Materials and Methods.

In order to further elucidate the expressional patterns of specific host immune genes over the course of the infection, the profiles of some immune gene groups were manually curated and studied separately. Only genes that had an FDR <0.05 and a log2 fold change of at one or more in at least one time point were included in this analysis. Among these genes the mannose receptors (Fig. 6A) show a relatively clear pattern with all mannose receptors except for MRC2 downregulated across all time points, most significantly at 24 hpi. On the contrary, MRC2 was downregulated at 2 hpi but was subsequently increasingly upregulated with time, though not significantly so until at 48 and 72 hpi.
Differential expression, mRNA from E. tenella infected vs uninfected cells, of chicken (A) mannose receptors and (B) pattern recognition receptors in mRNA samples from chicken HD11 cells infected in vitro with purified E. tenella sporozoites at 0 h. Point shapes indicate significance, filled triangles for FDR < 0.05 and circles for FDR > 0.05, at the indicated time point.

For the other PRR genes identified in this analysis (Fig. 6B) the majority were also downregulated with highest significance at 24 hpi. Two genes were significantly upregulated, TLR15 at 4 hpi and NLRC5 from 24 hpi onwards. TLR15 was also upregulated, though non-significantly at 2 and 12 hpi and the same applied to CLEC17A at 4 hpi.
For chicken chemokines (Fig. 7A) a pattern of early upregulation, with most being significantly upregulated at 4 and 12 hpi was observed. Their expression then decreased and reached a minimum at 48 hpi and subsequently increased again at 72 hpi. A few chemokine genes did not follow this pattern: CX3CL1 remained significantly upregulated from 4 hpi onwards and its expression only decreased at 72 hpi and CCL1 had a similar pattern. ATRN and CXCL12 were both downregulated across the time points, most significantly at 24 hpi. For the more heterogeneous group of chicken cytokines (Fig. 7B) a general expression pattern was not clearly observed. However, an early rise in significant upregulation could be observed in several genes with a peak at 12 hpi rather than at 4 hpi, as observed for the chemokines. This applied to CSF1, CSF3 and IL1B. In contrast to most other immune-related genes, TGFA showed a peak of upregulation at 24 hpi. Finally, IFNW1, i.e. the gene for interferon-β (IFN-β) and IL11 showed high and significant upregulation at 48 and 72 hpi but no significant DE at earlier time points.
Differential expression, mRNA from E. tenella infected vs uninfected cells, of chicken (A) chemokines and (B) cytokines in mRNA samples from chicken HD11 cells infected in vitro with purified E. tenella sporozoites at 0 h. Point shapes indicate significance, filled triangles for FDR <0.05 and circles for FDR >0.05, at the indicated time point.

For E. tenella we specifically studied genes with putative involvement in host cell invasion and infection such as SAG genes, rhoptry kinase (ROPK) genes, rhoptry neck protein (RON) genes, dense granule (GRA) genes and microneme (MIC) genes. All annotated genes associated with each of these categories in the E. tenella genome that had an FDR <0.05 and a log2 fold change of at least one in at least a single time point were included in the analysis.
Most of the SAG genes (Fig. 8) showed a consistent pattern: non-significance until 48 hpi, at which point they were strongly and significantly upregulated, remaining at a similar level at 72 hpi. In contrast, SAG13, SAG14 and SAG4 were downregulated across all time points.
Differential expression, E. tenella glycosylphosphatidylinositol-anchored surface antigens mRNA from infected HD11 cells vs E. tenella mRNA from sporozoites, of E. tenella surface antigens in mRNA samples from chicken HD11 cells infected in vitro with purified E. tenella sporozoites at 0 h. Point shapes indicate significance, filled triangles for FDR <0.05 and circles for FDR >0.05, at the indicated time point.

The rhoptry kinases were annotated according to the results of Talevich and Kannan (Reference Talevich and Kannan2013), who examined and annotated ROPK genes in several important Apicomplexans. Multiple genes belong to some of the annotated subfamilies and these are specified with arbitrary numbering at the end of the name. The ROPK genes in E. tenella (Fig. 9A) clustered in two distinct expression profiles: general upregulation, especially from 24 hpi and onwards, and general downregulation.
Differential expression, E. tenella mRNA from infected HD11 cells vs E. tenella mRNA from sporozoites, of E. tenella (A) rhoptry kinases and (B) rhoptry neck proteins in mRNA samples from chicken HD11 cells infected in vitro with purified E. tenella sporozoites at 0 h. Point shapes indicate significance, filled triangles for FDR <0.05 and circles for FDR >0.05, at the indicated time point.

The RONs are another set of rhoptry proteins present in Apicomplexans, including E. tenella (Oakes et al., Reference Oakes, Kurian, Bromley, Ward, Lal, Blake, Reid, Pain, Sinden, Wastling and Tomley2013). They were identified by taking the best hits from Oakes et al. (Reference Oakes, Kurian, Bromley, Ward, Lal, Blake, Reid, Pain, Sinden, Wastling and Tomley2013) for each gene. In the present study, these genes were generally upregulated at 48 and 72 hpi, with only RON3L1 being downregulated across all time points (Fig. 9B). RON8 and RON4L1 had a significant peak in upregulation at 12 hpi. The overall pattern resembled that of the SAGs and MICs.
Figure 10A and B show the expression patterns of E. tenella GRA genes and MIC genes, respectively. For E. tenella GRAs only three genes were identified here, only two GRAs were annotated in the E. tenella genome and only one significant homologue was found in the T. gondii genome. Our analysis showed that all GRAs were downregulated across time points (Fig. 10A). For MIC, several genes have been identified in E. tenella. Those with the Et prefix were annotated in the E. tenella genome but had no significant match in T. gondii, those with the Tg prefix were identified as homologues to T. gondii MIC genes but were not annotated as MIC genes in E. tenella and those without a prefix matched between the two organisms (Fig. 10B). Most of the MIC genes were downregulated across the time points. Four MIC genes were however significantly upregulated: EtMIC3 and TgMIC8/9 were both significantly upregulated at 48 and 72 hpi, EtMIC13 was significantly upregulated from 24 hpi and onwards and EtMIC 8 had a significant but low upregulation at 12, 48 and 72 hpi.
Differential expression, E. tenella mRNA from infected HD11 cells vs E. tenella mRNA from sporozoites, of E. tenella (A) dense granule genes and (B) micronemes in mRNA samples from chicken HD11 cells infected in vitro with purified E. tenella sporozoites at 0 h. Point shapes indicate significance, filled triangles for FDR <0.05 and circles for FDR >0.05, at the indicated time point.

Discussion
In the present study, host and gene transcription during the first merogony of E. tenella infection of chicken macrophages was monitored using dual RNA-Seq analysis. The read mapping step of the analysis elucidated that the fraction of reads mapping to features in the pure E. tenella sample was only ~65% compared to ~85% for the macrophage samples, while ~90% of reads mapped to the reference genomes in both cases. This indicates high levels of transcriptional activity in regions outside of annotated features in the E. tenella genome. A possible explanation for this lies in the E. tenella reference genome (GCF_000499545.2), which is fragmented into over 4000 contigs. The structural annotation covers over 8600 genes, only a small fraction of which has annotated alternative splicing. Functionally, the annotation is also relatively poor, with a large fraction of genes being annotated with a generic function or as hypothetical. With such a relatively poor annotation, it remains possible that there are exons or entire genes missing. It is therefore imperative that the structural annotation of the E. tenella reference genome is improved in order to facilitate further research. The data from this study can be useful for such efforts, especially as it is collected across multiple stages of the infection process. The functional annotation also needs improvement in order to allow for a more accurate interpretation of results from transcriptional experiments. Studies such as the one by Talevich and Kannan (Reference Talevich and Kannan2013), where they improved the annotation of ROPK genes in the E. tenella genome by building a general HMM profile of ROPK genes in Apicomplexans and used it to identify novel ones in both E. tenella and other Apicomplexans, show that this is quite feasible. Long-read technology may aid in building a less fragmented reference genome, which would also aid in improving the reference genome.
For the E. tenella reads from the infected macrophage samples, the fraction of these reads varied greatly between samples, both in time and within each time point between the biological replicates. As expected, the early samples contained a relatively small fraction of E. tenella reads, which grew as the parasite began to replicate. The variance of the fraction of E. tenella reads in each time point also differed. It appears to be similar for the samples from 4, 24, 48 and 72 hpi whereas the ones from 2 and 12 hpi show barely any variance.
Given that only a small fraction of each infected sample was made up of reads from the E. tenella, considerably deeper sequencing was needed compared to standard RNA-Seq in order to achieve a good representation of the parasite's gene expression. The produced depth ranged from 10 to 35 million reads, with most samples having a depth of 10–20 million reads. However, at some of the early time points, only >105 reads were from E. tenella giving less data on the earliest behaviour of the parasite and potentially missing low-expressed genes. A similar study carried out on the T. gondii infection of porcine kidney cells had about twice the read depth used here but also had a larger fraction of parasite reads, especially at later time points, giving more information on parasite expression (Zhou et al., Reference Zhou, Elsheikha, Zhou, Liu, Zhu and Suo2016). This showcases the importance of pilot studies to gauge the required depth of sequencing at each time point while keeping costs down.
The GO category and KEGG pathway enrichment analysis indicated an overall upregulation of signalling pathways in the chicken macrophage cells at 2–4 hpi and downregulation at 48–72 hpi. A mix of up- and downregulation was observed for metabolic pathways at 12–72 hpi. Of particular note here are the ‘Lysosome’ and ‘Phagosome’ KEGG pathways, which were strongly downregulated from 12 hpi onwards. These pathways are important in autophagy, which has been shown to have a role in the immune response against other Apicomplexans, for example against T. gondii in humans (Krishnamurthy et al., Reference Krishnamurthy, Konstantinou, Young, Gold and Saeij2017). Their downregulation here may indicate that they also have an important role in the immune reaction to E. tenella and that the parasite may be defending itself by causing a downregulation of these pathways.
In E. tenella, the downregulation of various DNA and RNA processing categories was prevalent across the different time points. Of particular note is the ‘Spliceosome’ KEGG pathway, highly downregulated across all time points, and the ‘Ribosome’ and ‘Proteasome’ pathways, highly upregulated across all but the first time point. These same pathways, except for ‘Proteasome’, are also among the most significantly enriched in a comparison of merozoites and sporulated oocysts in E. maxima (Hu et al., Reference Hu, Wang, Wang, Tang, Duan, Zhang, Suo, Deng, Lv, Suo and Liu2018), indicating that a lower level of splicing and increased protein expression may be a general feature of Eimeria merozoites compared to sporozoites. The GO categories tell much the same story, with the downregulation of ‘mRNA splicing, via spliceosome’ and upregulation of ‘translation’. The second pattern of interest is that from 12 hpi onwards, categories associated with energy metabolism are upregulated. This coincides with a growth in the fraction of parasite reads and therefore likely linked with trophozoite formation and growth and the asexual replication phase of the first merogony.
Recognition of infectious agents by PRR is an important step in the initiation of effective immune responses to infection. In the present study we found that the genes of several PRR were differentially expressed during the E. tenella infection and three PRR stand out in our analysis; MRC2 (also known as uPARAP/Endo180 or CD280), TLR15 and NLRC5. Among the differentially expressed genes of the mannose receptor family, all except MRC2 shared a common expression profile with significant downregulation at 24 hpi, while MRC2 was progressively upregulated throughout the experiment. In mammals, it has been shown that the ligand for MRC2 is collagen and the receptor has a role in collagen turnover (Melander et al., Reference Melander, Jürgensen, Madsen, Engelholm and Behrendt2015). Interestingly, MRC2 gene expression has also been shown to increase in spleen cells of mice after infection with Plasmodium spp (Rosanas-Urgell et al., Reference Rosanas-Urgell, Martin-Jaular, Ricarte-Filho, Ferrer, Kalko, Kimura and Del Portillo2012). Thus, it is possible that MRC2 is involved in the response to Apicomplexan parasites in both birds and mammals.
Most other differentially expressed genes with PRR functions identified in the present study also showed a downregulated pattern with maximal downregulation at 24 hpi. However, TLR15 was an exception to this and showed upregulation during the early infection, 2–12 hpi, with peak expression at 4 hpi. TLR15 is unique for the avian and reptile lineages and related to the mammalian TLR2 family but distinct from avian TLR2 (Boyd et al., Reference Boyd, Peroval, Hammond, Prickett, Young and Smith2012; Oven et al., Reference Oven, Resman Rus, Dusanic, Bencina, Keeler and Narat2013). Interestingly, in mammals, TLR2 is one of the TLRs involved in the recognition of protozoan parasites and GPI moieties of parasite SAGs have been identified as TLR2 ligands (Egan et al., Reference Egan, Sukhumavasi, Butcher and Denkers2009; Denkers, Reference Denkers2010; Ghosh and Stumhofer, Reference Ghosh and Stumhofer2013; Dos-Santos et al., Reference Dos-Santos, Carvalho-Kelly, Dick and Meyer-Fernandes2016). Activation of TLR15 expression has been shown upon stimulation with different organisms including E. tenella (Zhou et al., Reference Zhou, Wang, Cao, Hu, Zhang, Qin, Guo and Nie2013) and some lipopeptide and yeast-derived agonists have been suggested (Boyd et al., Reference Boyd, Peroval, Hammond, Prickett, Young and Smith2012; Oven et al., Reference Oven, Resman Rus, Dusanic, Bencina, Keeler and Narat2013). Thus, it is possible that an E. tenella SAG will be identified as a TLR15 ligand in the future.
Moreover, expression of NLRC5, a member of the CARD domain-containing, nucleotide-binding oligomerisation-like receptor (NLR) family, progressively increased during the E. tenella infection with similar kinetics as MRC2. In mammals this cytoplasmic receptor is known to regulate MHC I expression but also suggested to contribute to immune responses in other ways, e.g. through regulation of type I IFN responses (Benkö et al., Reference Benkö, Kovács, Hezel and Kufer2017). In chicken cells, NLRC5 expression has been induced upon LPS stimulation (Ciraci et al., Reference Ciraci, Tuggle, Wannemuehler, Nettleton and Lamont2010) and infection with avian influenza virus (Chothe et al., Reference Chothe, Nissly, Lim, Bhushan, Bird, Radzio-Basu, Jayarao and Kuchipudi2020). It has also been suggested that NLRC5 expression promotes type I IFN expression in chicken cells (Lian et al., Reference Lian, Ciraci, Chang, Hu and Lamont2012) but also, somewhat conflicting, the expression is also suggested to promote avian influenza virus (Chothe et al., Reference Chothe, Nissly, Lim, Bhushan, Bird, Radzio-Basu, Jayarao and Kuchipudi2020) and avian leukosis virus (Qiu et al., Reference Qiu, Xu, Guo, Li, Wan, Liu, Chen and Chang2016) replication, respectively. Considering E. tenella causes an intracellular infection it is not surprising that a cytoplasmic PRR such as NLRC5 is involved in its recognition. Interestingly we also observe an increased expression of IFN-β concurrent with the increased NLRC5 expression, which supports the earlier observation that NLRC5 could be a positive modulator of type I IFN expression in HD11 cells (Lian et al., Reference Lian, Ciraci, Chang, Hu and Lamont2012).
In the present study, E. tenella infection elicited a prompt expression of a number of chemokines and pro-inflammatory cytokines by the macrophages. This is an expected reaction upon infection and responses with several of these chemokines and cytokines have also been monitored upon Eimeria infection in chickens, e.g. CCL4, IL-8, IL-1β and CSF3 (Laurent et al., Reference Laurent, Mancassola, Lacroix, Menezes and Naciri2001; Hong et al., Reference Hong, Lillehoj, Lee, Dalloul and Lillehoj2006a, Reference Hong, Lillehoj, Lillehoj and Lee2006b; Cornelissen et al., Reference Cornelissen, Swinkels, Boersma and Rebel2009; Zhang et al., Reference Zhang, Liu, Song, Hu, Pan, Cai and Wang2017). A striking observation particularly for the cytokine responses but also many chemokines and many of the other immune system-related genes was the strong downregulation of expression at 48 hpi. This may be a physiological response by the host cells to avoid the negative effects of prolonged inflammatory reactions or due to immune evasive mechanisms exerted by the parasite. For related Apicomplexan parasite T. gondii it has been shown that several parasite proteins, e.g. some of the ROPK proteins, downregulate and/or modulate the host immune response in its own favour (Kemp et al., Reference Kemp, Yamamoto and Soldati-Favre2013; Behnke et al., Reference Behnke, Dubey and Sibley2016; Hakimi et al., Reference Hakimi, Olias and Sibley2017). In the current study, we observed upregulation of many E. tenella ROPKs during the early infection, some of which could consequently be involved in parasite immune evasion.
Two of the cytokines did not follow the common pattern with downregulation at 48 hpi; IFN-β and IL-11. Interferon-β is a type I IFN important in the innate response to intracellular pathogens and in regulating ensuing T-cell responses towards Th1-type responses and e.g. enabling cross-presentation by antigen-presenting cells to activate cytotoxic T-cells (CTL) (Le Bon and Tough, Reference Le Bon and Tough2008; Sebina and Haque, Reference Sebina and Haque2018). Thus, since a Th1-type response comprising CD8+ T-cells of potential CTL phenotype is crucial for immunity against Eimeria infections (McDonald and Shirley, Reference McDonald and Shirley2009; Kim et al., Reference Kim, Chaudhari and Lillehoj2019; Soutter et al., Reference Soutter, Werling, Tomley and Blake2020) the observed IFN-β expression may be important for regulation of such responses. Expression of another type I IFN, IFN-α, has also been observed after Eimeria infection of chickens (Hong et al., Reference Hong, Lillehoj, Lee, Dalloul and Lillehoj2006a; Kim et al., Reference Kim, Lillehoj, Bliss, Keeler, Hong, Park, Yamage, Min and Lillehoj2008). Interleukin-11 on the other hand is a cytokine primarily associated with downregulation of pro-inflammatory responses and inhibiting Th1-type responses (Truong et al., Reference Truong, Hong, Rengaraj, Lee, Lee and Hong2018). Its expression could hence be involved in the observed downregulation of immune responses, initiated either by the host or the parasite.
Several categories of genes known to have important roles in infection in both E. tenella and T. gondii were examined. The first of these categories of genes were the SAGs, 23 of which are annotated in the E. tenella genome with several other candidate SAGs having been identified (Tabarés et al., Reference Tabarés, Ferguson, Clark, Soon, Wan and Tomley2004). SAGs 2, 4 and 12 have been shown to have a role in modulating the chicken immune response by affecting the expression of several cytokines, including IFN-γ and IL-10, while many of the others have been shown to be immunogenic (Chow et al., Reference Chow, Wan, Blake, Tomley and Nathan2011). In the present study, most of the SAGs show significant and high upregulation at 48 and 72 hpi, indicating a role in the merozoites. This includes both SAG2 and SAG12. However, SAG4, along with SAG13 and SAG14, instead shows consistent and significant downregulation. These results are largely similar to those of Tabarés et al. (Reference Tabarés, Ferguson, Clark, Soon, Wan and Tomley2004), with most SAGs being expressed in the merozoite rather than in the sporozoite. As these are surface proteins, it is highly plausible that many of them are expressed during the maturation of the sporozoites in the oocyst. A potential example to the contrary is SAG13, as this gene is expressed in both the merozoites and the sporozoites but a much higher level in the sporozoites. This is also in line with the results of Tabarés et al. (Reference Tabarés, Ferguson, Clark, Soon, Wan and Tomley2004) who observed the expression of SAG13 in both stages.
For E. tenella a large number of ROPK family members have been identified including several sub-families unique to E. tenella (Talevich and Kannan, Reference Talevich and Kannan2013). In the present study, the ROPK genes showed varied expression profiles, even within sub-families. A good example is ROPK/Eten_5, where two genes were downregulated across all time points while the other two were upregulated, though at differing levels. Those ROPK genes that were generally upregulated appear to have a role in the merozoite stage of the E. tenella life cycle, potentially showing a difference in the infection mechanisms between sporozoites and merozoites. Indeed, several putative ROPK genes have been detected only in E. tenella merozoites rather than sporozoites, including ETH_00000075 (ROPK/Eten_4) and ETH_00005905 (ROP35) (Oakes et al., Reference Oakes, Kurian, Bromley, Ward, Lal, Blake, Reid, Pain, Sinden, Wastling and Tomley2013). Some research has been done on the roles of ROPKs in E. tenella, for example, ETH_00005190 (ROPK/Unique_3) has recently been shown to have an important role in preventing host cell apoptosis and arresting the cell cycle (Diallo et al., Reference Diallo, Sausset, Gnahoui-David, Silva, Brionne, Le Vern, Bussière, Tottey, Lacroix-Lamandé, Laurent and Silvestre2019). However, this gene showed no significant expression during the current experiment, which may indicate that it is expressed earlier in the development of the sporozoite. For genes of the second set of rhoptry proteins, i.e. RONs we observed that RON2, RON8, RON4L1 and RON6 seemed to be expressed during merozoite formation. Indeed, RON2 and RON8 have both been isolated from merozoites while RON4L1 has not (Oakes et al., Reference Oakes, Kurian, Bromley, Ward, Lal, Blake, Reid, Pain, Sinden, Wastling and Tomley2013), possibly indicating a difference between expression and translation patterns.
For expression of MIC protein genes of, i.e. MIC, we found a similar pattern to the other E. tenella genes, some were strongly downregulated across time points such as two versions of AMA1, and others appeared to be focused in the merozoites, such as AMA1_iso1 and EtMIC3. Interestingly, EtMIC3 has been pointed out as important for E. tenella tissue specificity to the caecum (Li et al., Reference Li, Wang, Chen, Chen, Liu, Sun, Jing, Xu, Yan, Li and Song2020). In the case of the AMA1 paralogues, AMA1 and AMA1_iso2 both were expressed across all time points in the present study, though downregulated, while AMA1_iso1 was almost exclusively expressed in the late time points. This may indicate that different versions of AMA1 are being used for different zoite stages.
In this study dual RNA-Seq allowed us to obtain a comprehensive view of the early interaction between E. tenella and the chicken host cell. For this initial analysis, we chose an in vitro system with a single host cell type. In vitro systems have drawbacks but may achieve valuable data that provide a foundation for better in vivo studies. In the present system, the HD11 cells readily supported the first schizogony of E. tenella and despite potentially not being the first choice of the host cell for the parasite macrophages have nevertheless been suggested to have a role in Eimeria infections in vivo (Van Doorninck and Becker, Reference Van Doorninck and Becker1957; Trout and Lillehoi, Reference Trout and Lillehoi1993) and also primary chicken macrophages support E. tenella replication (Long and Rose, Reference Long and Rose1976; Zhang et al., Reference Zhang, Thabet, Hiob, Zheng, Daugschies and Bangoura2018). Taken together our results provide new insights into host and parasite gene expression and suggest e.g. parasite genes of importance in the early infection events, pathways of recognition of Eimeria infection and distinct chemokine and cytokine profiles of the chicken immune system. This is valuable information for further in vivo studies on the early recognition of E. tenella infection.
Data
Sequencing data were deposited in the Gene Expression Omnibus under accession number GSE154393 and the Sequence Read Archive under accession number SRP271757.
Supplementary material
The supplementary material for this article can be found at https://doi.org/10.1017/S0031182021000111.
Acknowledgements
The authors wish to thank Per Thebo and Osama Ibrahim for sporozoite isolation and cryopreservation. They also acknowledge support from the National Genomic Infrastructure (NGI), SNP&SEQ Technology platform (Uppsala) where sequencing was performed and UPPMAX for computational infrastructure.
Author contribution
EW, KT, SGS and AL conceived and designed the study. EW performed laboratory work. AKSS, FX and RS performed bioinformatics analysis. AKSS, RS, and EW analysed results and wrote the article with input from all authors and all authors read and approved the final version of the manuscript.
Financial support
This study received financial support from the Swedish Research Council Formas (grant number 942-2015-494).
Conflicts of interest
The authors declare there are no conflicts of interest.
Ethical standards
The pure E. tenella isolate was maintained by twice-yearly passage in chickens at the animal facilities of the National Veterinary Institute, approved for experimental animals by the Swedish Board of Agriculture. This was approved by the Uppsala Regional Ethical Committee for Animal Experiments, permit no. C44/16, according to Swedish legislation and directives (SJVFS 2019:9 L 150) based on European Union legislation directive 2010/63/EU.


 Open access