


DISCUSSION POINTS
• ITER will demonstrate the feasibility of fusion energy.
• The use of fusion energy will be inherently safe and not pollute the environment.
• There is an urgent need to develop fusion materials which can withstand the harsh environment of high neutron and power fluxes.
• Renewable energies will not be able to meet the demand of all energy consuming sectors in highly developed industrial countries. Therefore, all carbon-free energy sources should be developed including fast fission reactors, CCS-technologies, and fusion.
Introduction
Mankind’s energy use will continue to grow at a rate steeper than the rise of population because the per capita energy consumption will also continue to increase. Till the middle of this century, the UN expects the world population to grow to 9.7 bn people. The IEA in its World Energy Outlook 2016 assumes an increase in primary energy usage of 1% per year. If this trend were to continue till 2050, the world primary energy consumption would increase from 160 to 230 PW h [1 PW h = 1015 W h] allocating on the average about 2700 W continuous power use per person. On the other hand, the business-as-usual burning of fossil fuels, which today still contribute with 85% the lion’s share of the world energy production, cannot continue as base-line supply technology. The concerns about global warming—the consequence of burning fossil fuels—intensify from one United Nations Climate Change Conference to the next one. However, the options for carbon-free energy production and the transition from chemical energy to electricity as primary energy source—as mandatory for a full decarbonisation of all human economic activities—are not manifold. CO2-free in their operation are the different forms of renewable energies (REs), fission—in the future possibly on the basis of the Generation-IV fast reactors—and fusion. Alternatively, fossil fuels could be further used in an environmentally friendly manner with CO2 removal and storage [carbon capture and storage (CCS) technology]. Facing the shortage on options, it would be very wise to develop all CO2-free energy forms with potential and at least prepare their scientific and technological basis. This is not presently the case and even highly developed countries with a long tradition in science and technology do not fund R&D into fast fission reactors with public money, reduce the scope of fusion research, or limit R&D into CCS technology by prohibitive legislation.
Fusion powers the universe by fusing of light elements like hydrogen to heavier ones like helium. In this process, mass is transferred to energy on the basis of Einstein’s special theory of relativity with E = mc 2, the equivalence of energy and mass, as the most famous result. In the core of stars like our sun, the conditions for this vast energy release are provided. Following the example of fission, the technical realization of controlled nuclear fusion power was awaited with great enthusiasm in the pioneering period of this field. These expectations were disappointed, however, because the development of fusion power turned out to be a long-term and tedious program, which rested on the progress of many scientific areas—the better understanding of turbulent plasma transport, the availability of computers with high processing power to optimize magnetic confinement concepts, technical systems to better heat and diagnose high-temperature plasmas, materials to sustain high heat and neutron fluxes, and advancements in technical subsystems needed to create a next generation fusion reactor.
A key element for the development of fusion energy is that the basic scientific principles cannot be tested on a small scale. A large system is necessary to ultimately test the soundness of its physics and technology basis. Only in a large system can the conditions be provided allowing self-sustained production of fusion power. Only under these conditions, the stable burn process of a fusion oven—the supply with fuel, the removal of ash, and the consequences of being far from thermodynamic equilibrium—can be tested along with the demanding technological challenges. The consequence still is to develop fusion power via demonstration experiments with growing sizes from generation to generation.
Some of these critical requirements, which could not have been foreseen in the initial period of this field, slowed down the development of fusion power. The practical joke is well known: Whenever you ask a fusion researcher how long the development will take you get a standard answer: 40 years—from now. 40 years was the conclusion of a committee set up in the United States after the first energy crisis in the 70s. The committee also elaborated the development costs of fusion to keep this promise. But the funding was never provided because the crisis went by and economies and societies had continuous access to cheap fossil fuels up to today. But the environmental concerns seem to eventually end this bonanza. Now the world is in the unfortunate situation that fusion energy is not yet available.
Nevertheless, a very important decision has been taken in the mid-80s by the presidents Gorbachev, Mitterrand, and Reagan—to jointly construct an initial experimental fusion reactor ITER—the International Thermonuclear Experimental Reactor. Seven partners cooperate now and finance this endeavor—China, Europe, India, Japan, Korea, Russia, and the USA. ITER1 is under construction in southern France and is expected to start operation in the middle of the next decade. ITER is a tokamak—a concept to confine a high-pressure plasma by strong magnetic fields in a toroidal geometry. This closed concept has been conceived and first realized in the Kurchatov Institute in Moscow in the 50s of last century. Most of the worldwide confinement research is based on this system. But the worldwide fusion program did not put all eggs into one basket. Parallel to the tokamak line, an alternative, the stellarator, has also been pursued albeit at a much smaller scale. The tokamak is a pulsed device, to start with, whereas the stellarator has the potential for steady-state operation. On the other hand, the tokamak is 2-dimensional in its toroidal geometry, whereas the stellarator is 3-dimensional. The lack of continuous symmetry causes insufficient plasma confinement under reactor conditions. This deficiency has conceptionally been removed now and a new stellarator, Wendelstein 7-X (W7-X),2 which has started operation at the end of 2015, is based on specific optimization criteria. With good confinement, this device should demonstrate the advantage of stellarators, to allow steady-state operation without additional external means.
This review paper deals with magnetic confinement and the physics of confining fusion-grade plasmas will be explained in some detail. The alternative—inertial confinement—is not covered because the author is not a specialist in this field. The physics of magnetic confinement is well developed. This is not the case with the other challenging task, the development of fusion materials. In the frame of fusion R&D, materials must be developed to withstand the extreme conditions including the high temperature and neutron fluxes demonstrating resistance against material damage. Fusion research urgently awaits the realization of IFMIF, the International Fusion Materials Irradiation Facility,3 realized jointly by the European and Japanese fusion communities. IFMIF is a neutron source fully devoted to fusion material R&D. The project is in the phase of prototype development and testing. A final decision on its realization could be taken in 2020. Fusion material development is an important field for the future and could be a professional option for the young readers of this article.
More up-to-date material can be found in a recent special issue on fusion energy in Europhysics News, the Bulletin of the European Physical Society.4
Elementary processes for technical fusion
The nuclear binding energy governs fusion processes. Figure 1 illustrates how the nuclear binding energy per nucleon depends on the mass number. The low mass number branch ends at the maximum where iron is placed. Iron is most strongly bound. Fusion processes from lighter to heavier elements release the difference in binding energy. The high mass number branch from iron to uranium is the basis for fission energy.
Plotted is the binding energy per nucleon against the nucleon number.
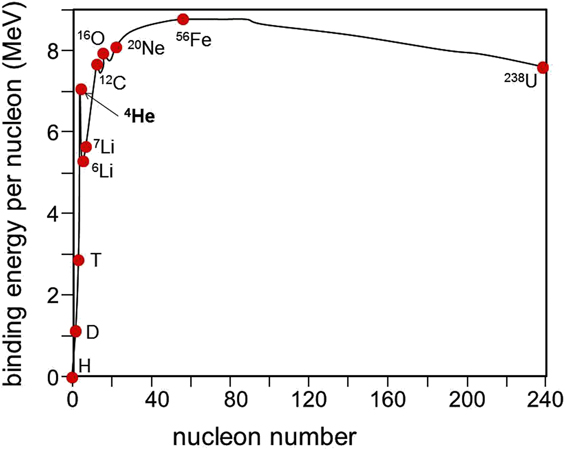
A distinguished role is played by fusion processes ending in 4He (see Fig. 1). The dominant solar process is the so-called pp cycle: In the core of the sun, ultimately four protons (p) fuse into helium with large amounts of energy being released. In the staged processes of the pp cycle, two protons have to be transformed into two neutrons, a process which is mediated by the weak interaction. The weak interaction—one of the four fundamental forces—has the smallest coupling constant yielding the lowest process rates. Indeed, the cross-section for pp fusion is too low to be measured.
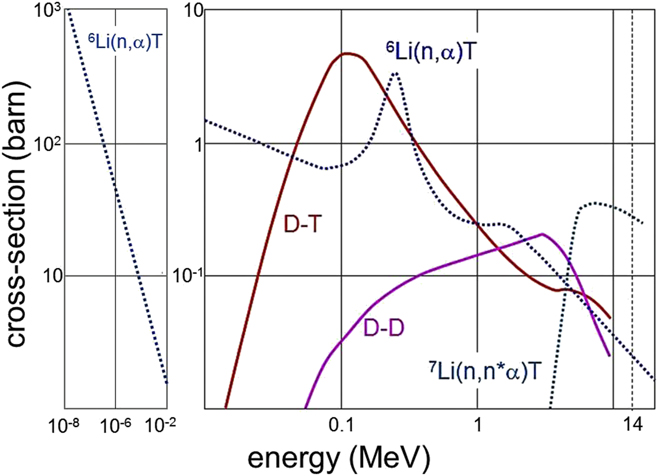
The consequence of the role of the weak interaction is that technical fusion can copy the principle of solar energy but has to work with different nuclei, which release fusion energy with the weak interaction not being involved. Figure 2, right side, shows the fusion cross-sections of deuterium–deuterium (D–D) and deuterium–tritium (D–T) versus species energy which are candidate processes for technical fusion. The curves display a typical maximum. High energy is necessary for the reactants to overcome repulsion of the positively charged nuclei. Beyond the maximum, the cross-section decreases because the interaction time of the species becomes too short. The maximum for D–T fusion is the largest and it is located at distinctively lower energy. These aspects determine the choice of fuel for technical fusion, which are the hydrogen isotopes deuterium and tritium. The radioactive nature of one constituent, tritium, has to be accepted. Other combinations allowing fusion cannot be considered facing the presently achieved plasma characteristics.
Fusion relevant cross-sections are plotted against energy. In case of the fusion reactions, D–T and D–D, the energy is the kinetic energy of the colliding particles; in case of the Li-breeding processes, it is the one of the incident neutrons. The right side shows the energy range of the fusion processes and the left side the one of the dominant breeding process.
The reaction process of D–T fusion is
 $${\rm{D}} + {\rm{T}} \to {}^4{\rm{He}}\left( {3.52\;{\rm{MeV}}} \right) + n\left( {14.06\;{\rm{MeV}}} \right).$$
On both sides, proton and neutron numbers are equal, two and three, and the weak interaction is not involved. In each fusion collision, 17.6 MeV energy are released because 4% of the mass of the reactants is transformed into energy. According to reaction (1), one gram of converted mass would be transferred into energy yielding 25 GW h. The neutron is the dominant heat carrier.
The reaction (1) defines already many features of D–T fusion:
(i) High energies have to be invested to initiate the reaction before even larger amounts of energy are released during the fusion processes; the release of fusion energy is a threshold process.
(ii) As a consequence of the high energy level, D, T, and He are ionized and only their nuclei are involved in the fusion processes.
(iii) The most obvious idea to produce fusion energy is by using an accelerator shooting one fuel species against a target of the other one which, however, does not work. The reason is that the fusion cross-sections shown in Fig. 2 are small in comparison to the elastic scattering cross-section. In the average, only one out of 100 encounters would lead to a fusion process. In the other 99%, the investment to bring the particles to high energies does not pay off. The cross-section ratio of the two competing processes, elastic scattering and fusion, leads to the concept of thermonuclear fusion. Elastic scattering has to be allowed and therefore, the medium out of which fusion happens shows a Maxwellian distribution. Facing the high process energies, the medium is in the plasma state consisting in its purest form of D+, T+, He++, and free electrons. The continuous release of fusion energy establishes the equilibrium state of the sun and the stars with the corollary that nature is predominantly in the plasma state. Because of the Maxwellian distribution of the plasma constituents, it is not the energy rather the temperature which determines the fusion rates. The cross-sections of Fig. 2 have to be replaced by rate coefficients and their dependence on the temperature governs fusion yield.
(iv) As plasmas are composed of charged species—ions and electrons—they can carry electrical currents and can thus be affected by magnetic fields. This enables the ability to use magnetic confinement, which is the primary focus of this report. In this concept, the fusion α-particles provide the inner heating, which maintains the plasma parameters, e.g., the temperature at the level where fusion power is optimally generated. From this point of view, a fusion reactor is like a stove with self-sustained burn, which has to be continuously fueled and whose ash—He at the plasma temperature—has to be continuously removed.
(v) Deuterium as one part of the fuel is contained in sea water in a number concentration of 0.016%, which is abundant enough for supplying a sustainable power technology and can be extracted at low costs.
(vi) Tritium, the other fuel component, is radioactive and it has a very short half-life of 12.3 years. Therefore, there is no natural source from which it could be extracted. Tritium will be produced inside the fusion reactor by involving two additional nuclear reactions, the tritium breeding reactions:
 $$n + {}^6{\rm{Li}} \to {\rm{T}} + {}^4{\rm{He}} + 4.8\;{\rm{MeV}}.$$
 $$n + {}^7{\rm{Li}} \to {\rm{T}} + {}^4{\rm{He}} + {n^ * } - 2.5\;{\rm{MeV}}.$$
The 14 MeV fusion neutron of reaction (1) has the additional task to breed tritium via the two Li isotopes 6Li (7.5% in natural Li) and the more abundant 7Li. Deuterium and Lithium, the primary fuels, are almost limitless and are basically uniformly distributed over the earth specifically if one considers the extraction of Li from sea water. The economics of this process has not been fully studied in a complete tech-to-market analysis. Reaction (2) is exothermal and the breeding process adds to the overall energy gain. Reaction (3) is endothermal but releases an additional neutron which can continue the breeding process. The released neutron of reaction (3) has an energy distribution depending on the kinetics of the process. Figure 2 also shows the cross-sections for the two breeding reactions. The (n, α) cross-section of 6Li has a large maximum from an energy resonance of the compound nucleus followed by the typical 1/v dependence, whereas the 7Li reaction shows the typical cross-section of a threshold reaction. The 6Li(n, α)T cross-section is continued on the left side of Fig. 2 into the low energy range where the T-production actually happens. Because of the high process rate, blankets may contain Li enriched with 6Li.
The technical consequence of the need to breed tritium in situ is that a fusion reactor’s first wall is composed of blankets filled with lithium, e.g., in ceramic form. The annual tritium consumption by a fusion power station with three gigawatt (thermal) power is ∼167 kg in a near ideal case. The blankets filled with the fuel are a very complex technical component. The blankets must be multifunctional both breeding tritium and absorbing the heat from the high-energy neutrons, about 2–3 MW/m2, transferring this power safely to a heat exchange system employing water or gaseous helium. Because of the loss of lithium and the neutron-induced material damages, the blankets have to be replaced in regular steps.
(vii) After heat exchange, electricity production is directly employing standard steam-turbine techniques. The integrated electrical system efficiency will therefore be in the range of 0.35–0.4. Higher efficiencies are possible with higher operational temperatures, but this has limits because of the necessary complex structures and the difficulty in finding reliable materials that will survive the erosion processes at higher temperatures.
(viii) The right side of the fusion reaction is carbon-free. Helium as ash of the process is a noble gas without any environmental impact. Unlike fission, fusion is also free of long-lived radioactive products like the unavoidable fission products cesium or iodine and plutonium and the minor actinides.
(ix) Nevertheless, also fusion has the problem of radioactive waste because the fusion neutrons produce activated structural materials. As radioactivity is limited to peripheral technology and not intrinsic to the energy producing process itself, an important task of fusion R&D is the development of low activation materials. The upshot is that longer-term radiotoxicity of fusion waste is low and its decay time can be as short as ∼100 years. Thereafter, the materials can be reused in industrial processes (see the section titled Tritium, safety, radioactive waste, and electricity costs of fusion energy).
The confinement of the tritium is a critical issue, especially due to the fact that it is quite radioactive and can easily enter the biosphere via HT and HTO formation. The section titled Tritium, safety, radioactive waste, and electricity costs of fusion energy will address the safety issues of tritium in more detail.
(x) A clear potential benefit of fusion power is its inherent safety. Since the fusion process occurs with binary collisions avoiding the danger of an avalanche process inherent to fission, a continuous safety control is not needed; in addition, the plasma energy density is low and the plasma process quenches with the slightest external interference; finally, the core energies cannot destroy the containment.
Conditions for controlled nuclear fusion
We have already singled out the plasma temperature as an important parameter which governs fusion power release. The power balance equating source and loss terms can be used to estimate the parameters needed to enable and sustain fusion. Using this methodology, it is relatively easy to predict the necessary conditions for controlled nuclear fusion, but these conditions are difficult to establish. John Lawson was able to equate power balance input terms and develop what has been termed Lawson criterion initially in 1957.Reference Lawson5 Different options exist for the set of conditions needed for controlled fusion depending on the terms and processes being considered—for example, whether the α-particle heating (20% of the fusion power) equals the power losses [ignition condition, Eq. (4)], whether total fusion power can be directly related to the external heating power P ext (break-even condition), how much of the fusion power is branched-off for the overall plant operation, and whether the ash concentration (He, α-particles) is fully considered and all of the radiation losses are included. In his original paper, Lawson considered the equilibrium state where the electricity gained from fusion power is sufficient to maintain the plasma state producing fusion power. The integration of all of the losses yields average values whose core values depend on the actual parameter profiles. Consequently, the Lawson conditions serve only as rough approximations of the fusion targets. The design of a fusion reactor such as ITER will be guided by its objectives and its design is based on detailed computer-based analysis; examples are given in Ref. Reference Ikeda6.
The equations below illustrate the ignition condition with radiation included:
 $${p_\alpha } = {1 / 4}{n_{{\rm{DT}}}}^2\left\langle {{\sigma _{{\rm{fus}}}}v} \right\rangle {E_\alpha } = {\rm{const}}.\;{n_{\rm{e}}}^2{Z_{{\rm{eff}}}}^2{T^{{1 / 2}}} + {3 / 2}\left( {{n_{{\rm{DT}}}} + {n_{\rm{e}}}} \right){T / {{\tau _{\rm E}}}}.$$
The term on the left side represents the α-particle power density deposited inside the plasma maintaining a self-sustained burn. The 1st term on the right side is for the radiation and the 2nd one for the plasma transport losses which are parameterized with the energy confinement time τE. The specific terms are as follows: n DT is the deuterium-tritium, n e is the electron density, Z eff is the average species charge of a mix of impurity ions (e.g., He and those caused by wall erosion), and T is the temperature. The factor 1/4 originates from the particle balance: n DT = n e = n D + n T assuming an equal mix between D and T.
A key term here is “energy confinement time τE” which is directly related to the concept of “magnetic confinement”. The energy confinement time is the energy replacement time, which we can understand using a familiar analogue situation - the case of a familiy house. τE would be the typical cooling time when the heating is turned off, for example, at night. If the insulation is very good, the temperature drops slowly and τE is long. A larger furnace would be needed if the thermal insulation is bad so as to meet the target temperature. Needless to say, this is not a very economic approach. In case of a plasma, it is heated externally with P ext or—after ignition—internally with the α-particle heating power P α. The power is transported to the plasma edge by heat conduction and convection and radiated off or deposited onto specific technical components—the divertor targets (see the section titled Principles of magnetic confinement). These thermal transport rates are characterized by τE, which is a measure of the thermal isolation of the plasma.
The total power balance under steady-state conditions can be described as
 $$\dot{W} = 0 = {P_{{\rm{ext}}}} + {P_\alpha } - {W / {{\tau _{\rm{E}}}}}\quad .$$
If the heating power is constant, the energy content W doubles if τE doubles. Therefore, τE is the critical parameter for confinement concepts defining operational plasma conditions. Transport and confinement and its improvement is central in present-day fusion research.
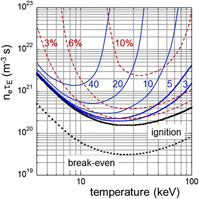
The general equation nτE = f(T) describes the power balance (4). Figure 3 illustrates this relationship plotted against different initial assumptions—the break-even condition (the fusion output is equivalent to the external heat input—“the furnace is puffing”)—and the ignition conditions (“the furnace transits into self-sustained burn”). The plot shows a minimum in the data with radiation dominating at low-T and decreasing reactivity in the high-T branch (see Fig. 2). Ideally, ignition requires a temperature of about 20 keV and a confinement product n eτE of ∼2 × 10²⁰ m−3 s. Temperatures in fusion research are expressed in energy units (eV, keV) because the relevant quantities to compare with are atomic or nuclear energies (1 eV equivalent to 11,600 K).
Plotted is the fusion product, electron density n e times the energy confinement time τE, against the plasma temperature. The bold solid line represents the ignition condition, the dotted line the break-even one. The marked curves represent the ignition condition with impurities. The cases for helium are shown by solid lines for various ρ = particle τp versus energy confinement time τE; the dashed line shows the impact of carbon radiation (Z = 6) at different concentrations.
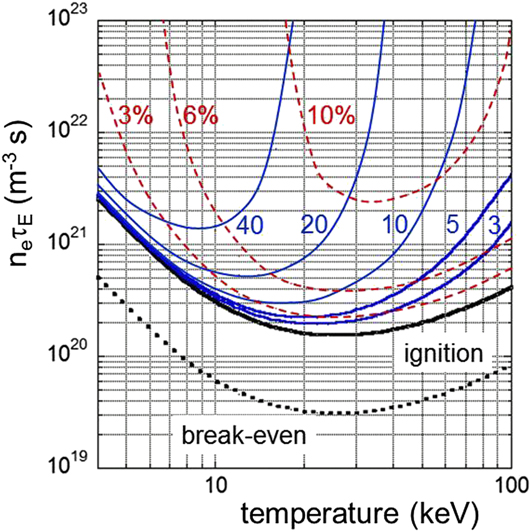
Alternative scenarios are shown in Fig. 3 reflecting the large effects of impurities. One such unavoidable “impurity” is He, the ash of the fusion process. The overall particle balance determines the concentration of the impurity, which can be evaluated equivalent to Eq. (4) but rephrased for the particle content. The fusion process inherently provides a particle source: for example, 1 MW of fusion power creates 3.5 × 10¹⁷ α-particles/s. Thus, under steady-state conditions, He will be transported to the plasma edge and thereby eliminated from the system. The rate for this process is determined by the particle confinement time τp. The plasma wall interaction (sputtering, chemical erosion, etc.) can also release other impurities from plasma chamber walls and from specific hardware needed to heat the plasma (antennas) or to absorb the power fluxes crossing the plasma surface (blanket, divertor target plates). The specific hardware for controlling the exhaust of energy and particles is the divertor, which acts effectively as “ash pan” (see the section titled Principles of magnetic confinement).
As expected from transport theory and as empirically observed, τp and τE are linked: τp and τE vary together as a function of the confinement regime and show similar parameter dependences. In Fig. 3, ρ = τp/τΕ is assumed constant and varied between 3 and 40. ρ changes the He concentration at constant source strength affecting the ignition conditions (marked solid lines). The dashed set of curves in Fig. 3 shows the impact of carbon impurity concentration on the ignition conditions varied from 3 to 10%. With impurities, the fusion conditions are much more sensitive because of dilution of the fuel and of excessive core radiation. The two factors—fuel dilution and radiation—can lead to an increase in the n eτE ignition threshold.
Figure 3 indicates that it is possible to have clean fusion plasmas with an appropriate reactor materials selection. Carbon is a favored 1st-wall material in fusion experiments and the curves in the figure are based on carbon Z = 6 radiation. But it easily forms dust that can strongly absorb hydrogen eventually creating high tritium inventories. This has resulted in an exclusion of carbon in ITER and the first electricity producing fusion reactor DEMO. The favored inner wall material in general for fusion reactors is now beryllium and tungsten is being used for the divertor. Beryllium is a low-Z material causing low radiation from the main plasma if eroded; tungsten qualifies as strike point of the plasma boundary layer because of its high melting temperature. With our simple assumptions on radiation, the radiation curves of Fig. 3 can also be applied for tungsten but at reduced impurity concentrations by a factor (Z W/Z C)2 ∼ 150.
Principles of magnetic confinement
The primary focus of fusion R&D is to find ways to confine the hot, high-pressure D–T plasma at a pressure of a few bars and with a volume of 1000 m3 through the use of strong magnetic fields of around 10 T in the plasma core. Magnetic confinement must fulfill a number of criteria including plasma equilibrium, stability, and low transport rates. The plasma has to be heated to about 20 keV using either the injection of ∼100 keV hydrogen (ITER foresees 1 MeV beam energy) or by electromagnetic waves. Approaching equilibrium reactor conditions, the α-particles originating from fusion processes in the plasma core provide sufficient heating so that the system develops a self-sustained burn. The external heating can be reduced after ignition to only a low level necessary for plasma control.
A fusion-grade plasma is distinguished by core plasma parameters, which allows continuous fusion processes to occur. The plasma pressure is maximum right in the plasma center where the α-particle source is located. In the frame of magnetic confinement, the pressure gradient is balanced by the Lorentz force at each point establishing an equilibrium force balance. Magnetohydrodynamics provides the theoretical framework for plasma equilibrium and stability. Charged particles in a magnetic field move in a helix due to the Lorentz force F = q·v × B. q is the charge, v(v ⊥, v ‖) is the individual particle velocity, and B is the magnetic field. Perpendicular to the field, the excursion of the particle is limited to the Larmor radius ρL (∼1 cm for ions in a reactor, a factor of 100 lower for electrons), which defines the mean-free path for perpendicular transport processes. Parallel to the magnetic field, the Lorentz force is zero. Consequently magnetic confinement is not sufficient in a homogeneous field. To cope with the lack of confinement in the parallel field direction, field inhomogeneity has to be involved and its consequences have to be accepted. In inhomogeneous magnetic fields, charged particles are exposed to an additional force parallel to the magnetic field F ‖ = −μ·grad‖ B with μ being the magnetic moment. In addition, the magnetized particles carry out a drift movement perpendicular to field and field gradient: vdrift = ±1/2ρLv ⊥B × ∇B/B 2. The drift moves the particles away from their field lines and thus degrades confinement. The particle direction depends on the sign of the particle charge. Therefore, the drift leads to charge separation giving rise to a current.
There are a number of different approaches to establish confinement parallel to the field in magnetic confinement-based systems. In linear devices, the “mirror effect” can improve parallel confinement. The basis of the mirror effect is the magnetic moment μ = 1/2mv ⊥2/B of a magnetized charged particle. A charged particle, an electron, or ion, with a thermal velocity v = (v ⊥, v ‖), which moves from a zone of low field B min to higher field increases its perpendicular velocity v ⊥ as a consequence of μ = const. However, the kinetic energy of the plasma species is also a constant of motion with the corollary that the parallel velocity v ‖ decreases. If the field is sufficiently large, v ‖ → 0 at B max. Subsequently, it is accelerated back to the low-field zone by the parallel force F ‖. If the field in the magnetic confinement system is built in a symmetric way, then the outcome is that the parallel field gradient will force the particles to bounce between two mirror points and ultimately stay in the neighborhood of the field minimum. In an actual mirror machine, characterized by B min and B max, it is necessary to consider two classes of particles determined by the ratio v ‖/v. If this velocity ratio is small, a particle is reflected by the magnetic mirrors as described above and the particle is confined. Larger v ‖/v-particles are slowed down along their trajectory toward higher field but do not reach the point at which v ‖/v = 0. These particles can eventually escape the mirror. The effective boundary between these conditions is given by v ⊥2/v 2 = B min/B max and this specifies a loss cone in phase space.
The confinement of simple mirror machines is not sufficient because of the effective transparency of the mirror. The mirror effect is described here because the concept helps us to understand confinement and transport of the currently preferred toroidal systems. To this point, we have ignored collisions between plasma species. The key is the collisions of the trapped particles occupying the low-field zone which are then scattered into the empty loss cone. Electrons with a higher velocity are therefore scattered more frequently into the loss cone than the slower ions. Consequently, the plasma charges up positively. The direction of the induced electric field retards the escaping electrons by electrostatic means but accelerates the ions. So as to achieve the transport equilibrium, the “ambipolar” electric field E enforces flux equality Γe = Γi between differently charged plasma species with different masses and kinetic properties. Later we will see that the ambipolar electric field is an important player in magnetic confinement.
The most successful confinement concept is toroidal confinement. Here, magnetic coils are placed in a circle and this establishes the toroidal magnetic field Btor. In this field, the plasma adopts the shape of a torus. The toroidal field is larger near the vertical symmetry axis. The field gradient is directed toward the symmetry axis and this field inhomogeneity can cause ions and electrons to drift parallel to it. Consequently, they are not confined. Due to their charge, the electrons and ions drift in opposite directions leading to charge separation, which cannot be compensated because of the high plasma resistivity perpendicular to the magnetic field. A drift current of ions and electrons can also originate due to the crossed-field arrangement of the vertical electric and toroidal magnetic fields. Similar to the Hall effect, the E × B drift generates a plasma flow perpendicular to both the E and Btor directions forcing the plasma torus to expand radially. Forces cannot be in equilibrium and therefore stable confinement cannot be established using this simple arrangement.
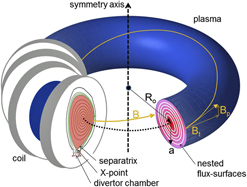
The approach to rectify this problem was to introduce rotational transform. The incorporation of a second field component Bpol with a perpendicular (poloidal) component introduces field lines where the field (B tor, B pol) winds around the torus in a helical path (see Fig. 4) and does no longer stay in a plane rather maps out a toroidal surface. As a consequence, vertical charge separation is effectively avoided since the up-down sides of the torus are short-circuited by the helical field lines and this facilitates balancing currents. This allows macroscopic radial equilibrium.
Schematic of a tokamak plasma; 4 toroidal coils are indicated along with the toroidal and poloidal fields. The right cut shows the nested flux surfaces; the left cut shows the separatrix of an elongated plasma cross-section with the X-point and the divertor chamber for exhaust.
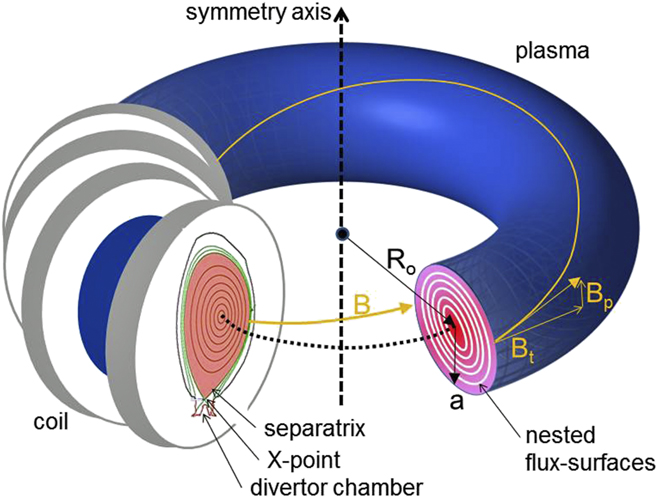
Based on the above, the essence of magnetic confinement is the utilization of a system of nested toroids with inhomogeneous field strength increasing toward the torus inside. These nested toroids are referred to as flux surfaces (see Fig. 4, right cut) and are not connected by radial field lines.
The manner in which the poloidal field component is generated defines the basic confinement types within the broader set of toroidal systems. The simplest approach is to use the electrical nature of the plasma to carry a current parallel to the magnetic field. This generates a ring current inside the plasma, and this plasma current I p, produces Bpol. The parallel electrical conductivity increases with the temperature of the electrons which is highest in the plasma core where the current density profile j(r) peaks. Systems using this approach are termed tokamaks (toroidal chamber with magnetic coils)Reference Wesson7 invented by the Russians in the 1950s. Figure 4 shows the typical set-up for a tokamak. The major strength of the tokamak concept is that I p can be produced inductively using a pulsed transformer and the plasma ring surrounding a central primary coil (not shown) then acts as secondary winding.
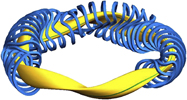
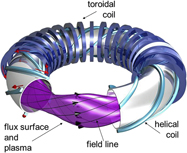
A second approach is to generate the poloidal field using external coils. Here, the coils are wound around the torus helically and this generates rotational transform. These concepts establish the class of helical confinement systems. The field composition is reminiscent of a multipole arrangement with the coils being helically twisted and then bent to a torus (see Fig. 5). The current direction of the helical coils—unipolar or bipolar—defines if the device is a heliotron/torsatron or a stellarator. Stellarators were invented by Lyman Spitzer of Princeton also in the 1950s. Figure 5 shows a schematic of an  $\ell = 2$ stellarator with helical coils, $\ell$ denoting the poloidal plasma symmetry.
Schematic of an  $\ell = 2$ stellarator with 3-dimensionally shaped plasma, helical coils, toroidal coils, and the helically twisted magnetic field lines (courtesy: IPP, Christian Brandt).
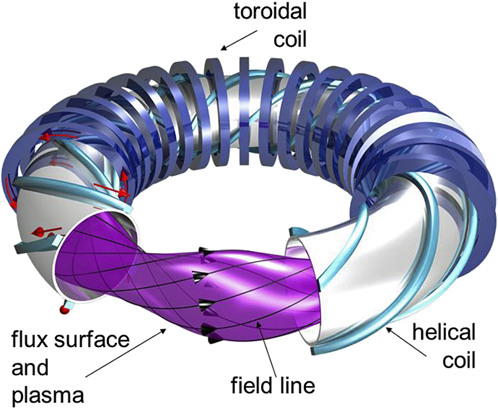
All toroidal systems share common descriptors. In the least complicated version, the torus geometry with a circular poloidal cross-section is defined by major radius R and minor radius a (see Fig. 4, right cut) and their ratio A = R/a is termed the aspect ratio. The rotational transform ι of a flux surface is therefore defined by the winding law for the field lines given by ι/2π = AB pol/B tor. In case of helical systems, the poloidal field is generated by an external helical coil system. It is defined by the number of coils used, e.g., three helical coils with unidirectional current would be termed an  $\ell = 3$ heliotron. This arrangement has a poloidal cross-section in the shape of a triangle. A stellarator with four helical coils and bipolar currents would give an $\ell = 2$ stellarator (see Fig. 5). This configuration has a poloidal cross-section that is an ellipse rotating in toroidal direction. An important stellarator descriptor is the coil pitch and the coil winding laws cause the coils to close. The field pattern of helical systems is periodic in the toroidal direction with toroidal periods e.g., m = 5 (W7-X) or for tight windings, e.g., m = 10 (Large Helical Device, LHD, a heliotron in Japan).
Basic tokamaks have a circular cross-section. However, achieving equilibria at higher plasma currents is only possible with an elongated or even a triangular cross-section of the shape of a “D” (see Fig. 4, left cut). Modern tokamaks benefit significantly by having higher currents and therefore
(i) reach higher plasma density—critical for ignition and subsequent burn,
(ii) higher stability in terms of the ratio β = 〈p kin〉/(B 2/2μ0) between average kinetic to magnetic field pressure, and
(iii) better energy confinement time, τE.
The plasma core is critical in providing proper conditions for high fusion yield as is also the boundary layer. The plasma surface is defined by a “separatrix” (see Fig. 4, left cut), which separates the nested flux surfaces of the confinement zone from the open field lines of the outside boundary defined as the scrape-off-layer. The separatrix is formed by a null in the poloidal field B pol, caused by the superposition of poloidal fields created by the plasma current (in case of the tokamak) and by additional external coils. An X-point (see Fig. 4, left cut) is formed along a toroidal ring. The rotational transform of the separatrix ι = 0. External to the separatrix, field lines do not close being diverted at the X-point and guided to a separate divertor chamber (see Fig. 4, left cut). The divertor chamber enables the basic geometry for exhaust and is part of the design for ITER and a future fusion reactor. Two key functions occur inside the divertor chamber—the neutralization of the plasma and the deposition of the α-particle power onto target plates. The target plates must be able to stand high heat fluxes in the range of >10 MW/m2; to facilitate this, the divertor chamber is equipped with pumping systems to remove the neutralized He ash and to aid in the control of plasma density and composition. A key aspect of the divertor chamber is that it traps and retains most of the impurities that are released from the contact zones with the plasma. The design of the magnetic field of the divertor is an active and evolving area of R&D.
Current stellarators are not a simple set of coils as described by l and m. Similar to the case of the tokamak, proper shaping of the plasma is essential to optimize and maximize performance. Using multi-helicity stellarators is the most effective way to optimize the plasma being composed of a mix of magnetic field components with different poloidal  $\ell$ symmetries. Here, the cross-section of the plasma varies toroidally depending on the dominant local field Fourier coefficients. Multi-helicity stellarators are difficult to realize by only employing toroidal and helical coils, rather so-called modular coils are used. These individual coils are not planar as in the case of a tokamak but have specifically shaped lateral excursions (see Fig. 12), generating a finite poloidal field component. Stellarator plasmas are also limited by a separatrix which is, however, an intrinsic feature of their magnetic system. The resulting divertor geometry is helical.
The role of field inhomogeneities has been illustrated with the mirror device as an example. Particle orbits in toroidal systems are also subject to the mirror effect as a consequence of the radial field gradient. Several classes of particles are created. First, particles with large v ‖/v, so-called “passing particles”, move cyclically from the outside of the torus to the inside. Their deviation from the flux surface is not large but is modified by the curvature of the toroidal field. For the second class, particles with small v ‖/v, called “trapped particles”, the orbits are strongly affected by the increasing magnetic field while traveling toward the inner sector of the torus. If v ‖/v is too small then the particles are reflected at B max. In this case, the particles do not experience the full rotational transform, rather stay at the torus outside and oscillate between the two mirror points. Since their drift in the field gradient is not fully compensated, their orbits deviate from the flux surfaces by more than the Larmor radius (typically by an order of magnitude). Due to the toroidal symmetry of the tokamak, the toroidal angular coordinate Φ can be ignored and the canonical momentum p Φ is a conserved quantity. With axisymmetry, the particles move along periodic orbits with deviations from the flux surfaces which stay finite.
In a current-free case with rot B = 0 within the plasma volume, equilibrium is not possible in a geometry with continuous symmetry. Therefore, stellarators are 3-dimensional. The helical coils (or the aligned modular coils) generate a further field inhomogeneity added to the toroidal curvature effect. The field underneath the helical coils is larger than the one between coils. This creates a third class of particles in addition to the passing and the toroidally trapped ones—i.e., helically trapped particles. As a result, these particles are highly localized in real space and phase space and do not benefit much from the confining effect of the rotational transform. These particles drift out of the system causing insufficient confinement in classical stellarators.
Due to their complementarity, both the internal (tokamak) and external confinement approaches (helical concepts) are being pursued worldwide. The plasma current in tokamaks are a strong ohmic heating source and temperatures >1 keV can be readily attained. Another advantage of tokamaks is low collisional transport rates as argued above. The down side of a tokamak is the requirement to continuously maintain the plasma current. In the simplest way, the tokamak operates like a large transformer with the plasma ring being the secondary winding. After a few hours, the primary transformer system needs to be recharged; however, the tokamak operation proceeds in pulses. To make tokamak operation steady-state noniductive current drive techniques are being developed relying on injection of fast particles or directed electromagnetic waves. Optimization of external current-drive in tokamaks is a very active R&D area.
The strong plasma current of a tokamak leads to current-driven instabilities—another key problem. The equilibrium in a tokamak is intimately connected to the plasma itself and its ability to carry a stable current. The equilibrium, transport, and stability properties of the plasma have complex nonlinear relationships which can cause instabilities to develop which can degrade the confinement quality and may ultimately evoke the collapse of the plasma. In such a scenario, the current of 20 MA in a reactor switches-off within seconds. The electromagnetic dynamics caused by such a perturbation can lead to high voltages or high halo currents, I ind, in structural components which have to be designed to withstand the strong Iind × B forces. This is a challenge for fusion engineers.
These problems are alien to helical systems. But as their field geometry is not continuously symmetric, no component of the canonical angular momentum will be conserved resulting in a class of particles located in a “loss cone” not being confined. In phase space, the loss cone is constantly filled by collisions; therefore, helical systems will not easily meet the ignition and burn conditions of a reactor. The section titled HELIAS reactor and the role of Wendelstein 7-X will address how the lack of symmetry can be overcome by a concept termed quasi-symmetry.
Confinement of high-temperature fusion plasmas
For a functional reactor, it is necessary for the fusion plasma to fulfill a diverse set of requirements including: equilibrium, stability, confinement, purity, and other qualities. It requires a complex strategy to achieve this multidimensional optimization. A crucial area is plasma materials interaction but within the scope of this article, there is not sufficient space to cover it. Rather we will focus on the topic of plasma transport and confinement. This is the most critical issue and possibly the most scientifically interesting one. Sophisticated physics allows us to describe and understand turbulent plasma transport and the changes in the plasma dynamics as they suddenly can occur. Reference Reference Boozer8 represents a detailed review of the physics of magnetic confinement.
Plasma transport has a collisional and a turbulent component. The origin of collisional transport are Coulomb collisions between charged species, causing particles to hop from one flux surface to another one and—following the pressure gradient—from the inside to the outside. In the homogeneous field, the key parameters of the diffusion process are the Larmor radius ρL and the Coulomb collision time τCb. In an axisymmetric toroidal geometry, these two characteristic factors are modified because of the induced drifts and the presence of free and trapped particles. Of particular relevance are the trapped particles because their step size corresponds to the Lamor radius in the poloidal field, ρpol = ρLB tor/B pol. The effective collision time results from the collisional flow across the boundary in phase space between trapped and passing particles. The theory of neoclassical transport provides a complete theoretical model to describe the collisional transport processes in toroidal geometry. However, collisions do not play a large role in defining tokamak confinement under reactor conditions.
The situation is quite different in the case of stellarators with the helically trapped particles becoming dominant. Whereas under axisymmetric conditions, the collisional losses decrease toward the operational range of the reactor they increase in the case of helical systems. This created significant doubts in the past whether helical systems would allow meeting reactor conditions. As in the case of mirror devices, the losses are not inherently ambipolar rather evoke radial electric fields which change particle orbits and reduce transport. The transport equations becoming nonlinear leading to different confinement branches, so-called roots, featuring widely different plasma transport characteristics.
Similar to the solar plasma, man-made fusion plasmas are highly turbulent and turbulence determines the confinement in general and specifically for reactor conditions. Thermodynamically, plasmas are open systems and nonlinear relations control plasma stability. The free energy is a function of the pressure gradient, plasma currents, and non-Maxwellian particle distributions driving instabilities with spatial scales ranging from the size of the overall geometry down to the Lamor radius and below. Some of the plasma properties like plasma resistivity or geometrical aspects like the collinearity of pressure and field gradients at the outer half-sector of the torus can be destabilizing. Since the plasma is diamagnetic, it will move away from strong to regions of lower magnetic field, which is supported by the pressure gradients at the outside of the torus. Ideally, fluid (plasma) and field lines are coupled with the field lines bent as the fluid moves; but plasma resistivity decouples the plasma from the field. At rational flux surfaces where the field lines close upon themselves, instabilities can grow in the form of toroidal eigenmodes. When the geometrical topologies of eigenmode and magnetic field agree, the instability can grow without the penalty of increasing its magnetic field energy.
As seen above, the Lamor radius defines the length scale of the turbulence and the nonlinear relations between stabilizing and destabilizing contributions control the onset conditions and critical gradients for temperature and pressure. For example, if the temperature gradient grows too large and exceeds a critical threshold, the turbulence level goes up dramatically. The diffusivities depend formally on the magnitude of the driving gradients with the consequence that critical gradients develop. Plasma profiles, specifically those of the temperatures, are found to be shape invariant, a feature which is called “profile resilience” leading to canonical profiles.
This discussion answers the question why the scientific feasibility of fusion power production necessitates large scales. To achieve the high temperature of 20 keV in the plasma core ensuring the anticipated fusion yield, steep gradients are required which are controlled, however, by onset conditions and limited to critical values. Similar to a sand pile, critical limits are exceeded in the effort to pile up sand resulting in continued avalanches rolling to the base of the sand box. The peak height can only be increased by broadening the base. The upshot is that a sustainable fusion burn can only be created in large devices at the power level of a few 100 MW. In case of fission, Fermi needed O(1) watt to demonstrate a controlled chain reaction.
Ardently awaited, auxiliary heating systems became available in the 70s of last century and allowed the increase of the core temperatures beyond the ohmic level. The delight over ion temperatures of 7 keV and more did not last very long because of the recognition that the plasma entered a new regime which had to be dubbed L-mode—low confinement mode: along with the improvement of the plasma temperatures, the plasma confinement degraded with heating power P according to τE ∼ P −0.5. The net effect was that auxiliary heating did not enable a distinct step toward the ignition conditions. It had to be accepted that the L-mode represented the standard confinement of strongly heated fusion plasmas displaying a degradation of both the energy and particle confinement times.
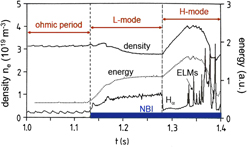
Fortunately, a key feature of plasmas being open systems far from thermodynamic equilibrium comes to the rescue—system self-organization. This has been demonstrated by transition to a state with better confinement occurring spontaneously observed in the ASDEX tokamak first and later in other tokamaks and finally also in stellarators. This regime, called H-mode for high confinement, is of practical significance and points the way toward achieving the fusion conditions under fewer constraints and more realistic conditions. Figure 6 is an historical diagram from 1982 when the H-mode was originally discovered. Plotted is the transition from the ohmic into the auxiliary heating phase using energetic neutral beams. First, the L-mode develops with the moderate increase of the energy content and a drop in density due to lower τE or τp, respectively. Spontaneously, the plasma transits into the H-mode shown by the sharp drop of the Hα-edge radiation and the increase in energy and density. In the specific case shown, so-called edge localized modes (ELMs) set in and accompany the progressive development of the H-mode. The H-transition is a threshold process, necessitating a minimum heating power. The improvement of τE is a consequence of a strong reduction of plasma turbulence specifically at the plasma edge. At the edge but inside the separatrix, a transport barrier is formed characterized by a steep pressure gradient giving rise to an edge pedestal as typical for the H-mode. Meanwhile, one succeeded to expand the quiescent region at the edge and even produced internal transport barriers leading to outstanding central plasma parameters. The limitations of the canonical profile shapes are fully overcome. The history of improved confinement regimes is narrated in Ref. Reference Wagner9, which also gives the most relevant references.
Historical diagram from ASDEX tokamak showing one of the first H-mode transitions. Two discharge periods are shown—the ohmic phase followed by the period with beam heating (NBI, in blue). The plasma enters first the L-mode with degraded confinement succeed by the sudden transition into the H-mode with improved confinement. Later in the H-mode phase, ELMs develop, which repetitively destroy the edge transport barrier of the H-mode.

Enhanced confinement regimes led the way to a better understanding of turbulent transport. Gradient-driven drift-wave–type turbulence (low-frequency collective modes driven by the expansion free energy in an inhomogeneous plasma) develops to a level set by the spatial variation of equilibrium and self-driven plasma flows. Turbulence and flows develop self-consistently. The dynamic behavior of the plasma edge is governed by 2-dimensional turbulence whose spectral content condenses eventually toward large scales ultimately set by the plasma circumference: The interactions of the turbulent plasma eddies sum up to a coherent flow field. As the flow has shear, it reacts back on the driving force resulting in destruction or “decorrelation” of the turbulent eddies. The conditions to ensure this mechanism are formulated in the BDT criterion.Reference Biglary, Diamond and Terry10 With edge turbulence being suppressed, the resulting steep gradients are maintained due to equilibrium conditions, and the large ion pressure gradient is offset by a negative radial electric field, that itself is equivalent to strong and sheared flow. As a consequence, the state of low-turbulence is preserved.
The other mechanism contributing to improved confinement is rooted in one of the most basic characteristics of plasmas consisting of light negative and heavy positive charges with very different mobilities. A radial electric field appears and the ambipolarity condition ensures transport equilibrium within these two constituents. This radial electric field is a major player in magnetic confinement: In case of 3-dimensional helical systems, it even governs collisional transport giving rise to bifurcations and different confinement roots. In toroidal systems, generally it causes sheared flows that subsequently interact with the turbulence and effectively regulate its level.
The highest fusion power in DT operation of JET was achieved in the H-mode. The overall prospects for the success of ITER depend on the H-mode confinement qualities.
Status of fusion energy development
After World War II, fusion research was initiated worldwide. Close to Oxford, UK, the EU fusion community jointly operates the largest and one of the most relevant fusion devices, the Joint European Torus JET, a tokamak.Reference Horton11 This device is closest to achieving ignition conditions and is therefore very important in building a foundation for ITER which is the next step (the section titled Toward a fusion reactor). The Asian fusion program has made impressive progress constructing modern tokamaks in Korea (KSTAR12), China (EAST13), and India (SST-114). In addition, Japan which has been successfully engaged in fusion research for decades is now constructing a large tokamak, JT-60 SA,15 in collaboration with Europe, with startup in 2019. All new Asian devices use superconducting coils and focus on the critical and not yet solved problem of steady-state operation. This problem is a real challenge for tokamaks due to their intrinsically pulsed nature. Many countries are currently operating helical systems at the laboratory scale. The largest devices with superconducting coils are LHD, a heliotron,16 operated in Japan, and W7-X, with optimised features, located in Greifswald, Germany (see the section titled Toward a fusion reactor). For many decades, the United States and Russia were leading the fusion program. This is no longer the case because in both countries, the fusion program was scaled down so that new devices in support of the main lines could unfortunately not be realized.
Fusion experiments have independently achieved the necessary temperature and density. Temperatures of 40 keV have been achieved on a routine basis in a number of systems. In addition, densities of a factor of 10 beyond the target values can be achieved. It is the critical parameter τE that is four times below what is needed to reach ignition. JET and the US tokamak TFTR have been able to routinely carry out DT operation. This is only being done on a small scale with a tritium consumption of grams not of kilograms as annually needed by a power station. α-particle heating has been verified in both devices. A key result is that DT operation in JET H-mode discharges has produced a fusion power of 16.1 MW in a short pulse with a power amplification factor of Q = P fus/P ext ∼ 0.65.
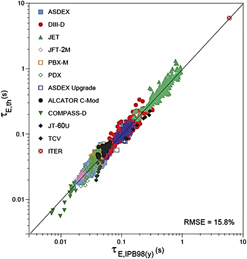
Experimental τE values depend on many parameters, plasma current I p, toroidal field B tor, heating power P, density n, isotopic mass M and the key geometry parameter radii, elongation, and triangularity of the plasma cross-section. Since τE is the result of turbulent processes, it is difficult to predict this parameter for ITER by first principles. The international fusion research efforts led to a joint database which allows extrapolation to larger scales and to plasma parameters of a reactor and provide also a value of the energy confinement time expected for ITER. Figure 7 shows the outcome of this kind of multidimensional regression. The experimental τE-values are compared with the expectation from the statistical analysis of the international database denoted by the label of the abscissa. The expected value of τE for ITER (∼5 s) is also shown in Fig. 7. This value is in close agreement with the objectives of ITER.
Multimachine thermal energy confinement time τE against the scaling results of the 98(y.2) ITER scaling [ITER Physics basis 1999, Nuclear Fusion 39, 2175 (1999)]. The expected ITER confinement time is also shown.

One potential benefit of stellarators is that they can operate at higher densities than tokamaks being a distinct advantage for divertor operation. Stellarators verify similar parameters to tokamaks of similar size and field. To this point, they do not yet reach comparable high core temperatures and confinement times as large tokamaks do in part due to the smaller sizes of present-day helical systems.
Toward a fusion reactor
ITER
Based on the foundational knowledge developed worldwide, the fusion community decided to realize ITER, the first experimental reactor. It employs a strongly shaped tokamak plasma utilizing a divertor for exhaust. The selection of the first-wall materials is based on the best knowledge available at present targeted to reduce impurity radiation, wall erosion and to minimize tritium inventory.
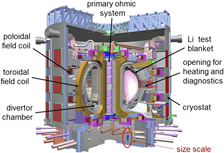
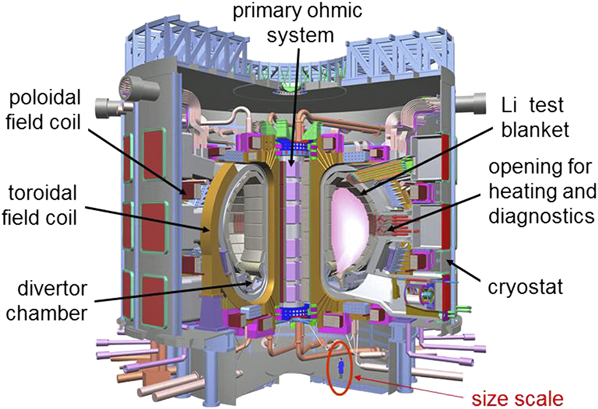
The International Thermonuclear Experimental Reactor, ITER,Reference Campbell17 is shown as a computer drawing in Fig. 8. The goal of the ITER is the production of 500 MW of fusion power. The new element in fusion research is the process of self-heating by 100 MW of α-particles. Key parameters will be a magnetic field on axis of 5.3 T using superconducting Nb3Sn: a current of 15 MA, a major radius of R 0 = 6.2 m, and a minor radius of a = 2 m. In addition, the overall cross section is D-shaped; divertors will be used for exhaust. For external heating, the ITER will employ neutral beams (33 MW) and both electron and ion cyclotron heating at 20 MW each. The ITER will ultimately be fully licensed by the French nuclear authorities.
Computer drawing of the International Tokamak Experimental Reactor, ITER.
A power amplification factor Q ≥ 10 is the formal objective for ITER based on an average neutron wall load of ≥0.5 MW/m2; the pulse length is limited to 400 s. The quasi-steady state operation is envisaged with more moderate conditions of Q ∼ 5. The ITER will begin operation around 2025. The major physics issues of the ITER center on the burning plasma state, specifically (i) the confinement characteristics with dominant self-heating, (ii) burn control and helium-exhaust, and (iii) plasma stability in the presence of an α-particle fast ion component. Other factors that are important for ITER to achieve its goals are the nature of helium transport from the core to the edge and the control of disruptions.
ITER’s unique role is expected to significantly expand the foundational knowledge leading to practical fusion. These include a demonstration of the application of superconductivity in the harsh environment of fusion neutrons; viability of remote handling techniques in the activated plasma chamber for complex assembly and maintenance tasks; reliability of complex external heating systems like the injection of high-energy deuterium atoms at 1 MeV energy.
Critical issues are the handling of the α-power exhausted at a level of 10 MW/m2, even more during dynamic phases (e.g., when edge instabilities appear). A key additional goal is the demonstration of tritium breeding by employing test blankets. Thereafter, save predictions for the tritium supply of DEMO and subsequent commercial power reactors should be possible.
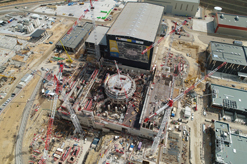
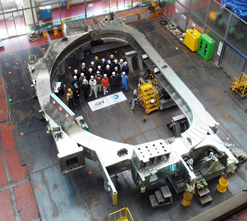
ITER is being erected in Cadarache, in the south of France. Figure 9 shows the development state of the ITER site. The tokamak will be placed in the ring-shaped structures shown in the center of the photo. Figure 10 shows the casing of one of the toroidal-field coils as an example of the component fabrication.
Bird’s eye view of the ITER site in Cadarache with the growing torus hall in the middle; status: March 2018 (courtesy: ITER Organization/EJF Riche; more photos available under: https://www.iter.org/album/Media/4%20-%20Aerial).

Casing of a toroidal field coil for ITER (courtesy: ITER Organization; more photos on component production available under: https://www.iter.org/album/Media/2%20-%20Manufacturing%20underway).

HELIAS reactor and the role of Wendelstein 7-X
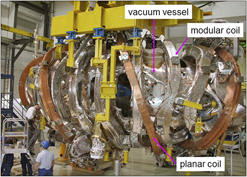
Stellarators are in need of significant confinement optimization. The most structured approach underlies the development of the Wendelstein 7-X (W7-XReference Klinger18) project. W7-X is a multi-helicity stellarator with optimized properties. A computer-generated image of plasma and modular coils is shown in Fig. 11. One out of 5 modules with 10 out of 50 modular coils is shown in Fig. 12; the copper-colored coils are planar and facilitate changes in the magnetic settings. All coils are fabricated from the superconducting material NbTi allowing 3 T as maximum field on axis. The cooling capacity of the plant is sufficient so as to allow 30 min pulses. The major radius of the device is 5.5 m with an aspect ratio of ten. The primary heating for Wendelstein 7-X is by using a 10 MW steady-state electron cyclotron system at 140 GHz. For exhaust, W7-X is equipped with a helical island divertor. Figure 13 shows an inside-view of W7-X with elements of the wall protection plates being mounted.
Computer drawing of plasma and modular coils of Wendelstein 7-X.
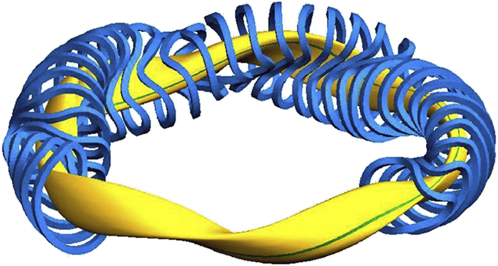
Photo of one out of five modules of Wendelstein 7-X. The modular coils are silver-colored. The copper-colored planar coils serve to change the magnetic setting (courtesy: IPP, Anja Richter-Ullmann).

View into the plasma vessel of Wendelstein 7-X. The copper plates establish the support structure for the vessel protection (courtesy: IPP, Bernhard Ludewig).

The underlying theory for the optimization of the W7-X performance has two main components: (i) deviation of particles from the flux surface as well as equilibrium and stability properties depend on the variation of the magnetic field strength |B| within the flux surfaceReference Boozer19 and (ii) |B| can be made 2-dimensional in otherwise 3-dimensional toroidal geometry.Reference Nührenberg and Zille20 Stellarators with these properties are termed quasi-symmetric systems and a number of small stellarators based on these concepts have been developed (HSX in Wisconsin21 and Heliotron J in Kyoto, Japan22). The design of W7-X adheres to the quasi-isodynamic principle. In an isodynamic system particle, heat and charges would flow within a flux surface without a radial component. This cannot be achieved in a toroidal geometry. Quasi-isodynamicity, a viable approximation of poloidal symmetry, foresees rigid equilibrium and good stability toward high plasma pressure and good confinement for thermal and energetic particles (α-particles) avoiding the helical ripple losses as described in the section titled Principles of magnetic confinement. One feature of the optimization following the quasi-isodynamicity concept is to utilize the mirror effect. W7-X has a toroidal periodicity that corresponds to a pentagon. The toroidal curvature therefore becomes localized at the corners. The field strength |B| is increased in the zones of field inhomogeneity to minimize the drift losses. Therefore, the W7-X resembles a system of linked mirrors. Particles with large v ⊥/v are thus expelled from the critical sectors with curvature. The optimization strategy is not yet verified in all aspects. Parts of the basic physics have been validated at the smaller and partially optimized stellarator device W7-AS.Reference Hirsch, Baldzuhn, Beidler, Brakel, Burhenn, Dinklage, Ehmler, Endler, Erckmann, Feng, Geiger, Giannone, Grieger, Grigull, Hartfuß, Hartmann, Jaenicke, König, Laqua, Maaßberg, McCormick, Sardei, Speth, Stroth, Wagner, Weller, Werner, Wobig and Zoletnik23 The expected qualities from the optimization in addition to the key stellarator properties of steady-state operation free of current driven instabilities bespeak the potential of this approach.
Most of the current stellarator reactor studies focus on specific aspects such as the complex coil system and the 3-D blanket and neutron shield that are unique to this system. Overall, these focus areas are basically extrapolations of the existing concepts; in case of W7-X, it is the HELIAS reactor concept.Reference Igitkhanov, Andreeva, Beidler, Harmeyer, Herrnegger, Kisslinger, Wagner and Wobig24 The overall stellarator design is dictated by two criteria: the overall size should be large enough to accommodate blanket and shield between plasma and coils and second, the confinement time, which roughly grows with the plasma volume, must be large enough to ensure ignition and self-sustained burn. Also stellarators will be able to leverage the additional physics and the technology provided by and developed for the ITER.
A future stellarator reactor will do without a current drive system. As about 200 MW power are required to run a tokamak reactor steady-state, the plant internal recycling power needs are large at an electrical efficiency of about 0.4. For a tokamak, this extra drain could increase the cost of electricity by about 25%.Reference Bustreo, Bolzonella and Zollino29 It is hoped that stellarators will be able to demonstrate steady-state operation with LHD and W7-X still within this decade.
DEMO
Unlike ITER, the DEMOReference Ward25 fusion reactor will be aimed at producing about 1 GW electric power steady-state or quasi-steady state. DEMO will be somewhat larger than ITER with Q ∼ 40. Specifically, it will operate at higher density [P fus, based on binary processes, scales directly with the density-square, reference Eq. (4)] and requires somewhat higher confinement and stability margins. The ITER will be addressing these topics as part of its research program. ITER will also help facilitate the licensing of DEMO. This is a totally new area in fusion development and is exercised for the first time with the nuclear safety authorities of France. Many open material questions have to be answered before DEMO can be built. An up-to-date review on fusion material issues is provided by Ref. Reference Knaster, Moeslang and Muroga26. Wall damage is caused primarily by the high neutron fluxes and fluences leading to dpa (displacement per atom) values of ∼20 per year. An example of this R&D program is the development of EUROFER97 steel with a specification presented in Ref. Reference Rieth, Schirra, Falkenstein, Graf, Heger, Kempe, Lindau and Zimmermann27. To assess the material damage induced primarily by the fusion 14 MeV neutrons but ultimately by the whole reaction chain within blanket and first wall and to foster the further development of structural material which do not activate easily, the availability of a devoted 14 MeV neutron source research tool IFMIF, is necessary.
Tritium, safety, radioactive waste, and electricity costs of fusion energy
Tritium production
An important measure of the sustainability of the fusion reactor is the efficiency of the fusion breeding blanked as measured by tritium breeding ratio TBR. To be sustainable, for each triton burnt in the fusion process, a new one has to be formed. Realistically, the TBR must be >1 for self sufficient supply because of unavoidable losses (tritium-decay in storage, spurious tritium inventories in the exhaust and recycling systems, initial feeding for other fusion reactors). TBR depends on a number of factors—plasma properties, design specifics of the blanket, and the way the 14 MeV neutrons actually slow down, interact with the Li, and are finally absorbed or lost. These processes are partially governed by the cross sections shown in Fig. 2. In process (2), the 6Li-reaction, each n has the chance to generate a tritium nucleus due to the high cross section even at low neutron energies. The importance of process (3) is the n-multiplication, which is possible for neutrons with energy above the threshold of 2.5 MeV.
If a breeding ratio of 1.15 could be achieved then a 3 GWth power station produces 25 kg/year surplus tritium to facilitate the startup of other fusion reactors. A typical fusion power plant would require an initial charge of 7–15 kg tritium. The first fusion reactor would require an initial supply of tritium from an external source before it becomes tritium self-sufficient. The current source is from fission reactors using heavy water for moderation and cooling such as those operated in Canada (the CANDU reactors), India, and Korea. The worldwide amount of tritium is determined by their production and by the radioactive decay and may eventually rise to 42 kg in the mid-20s. The tritium availability depends however strongly on national energy politics.Reference Kovari, Coleman, Cristescu and Smith28
The fusion community has not yet validated the breeding reaction in a breeding blanket because this requires a burning plasma supplying 14 MeV neutrons. Pure lithium should allow for the highest TBR close to 2 but is not considered because of the safety aspects being a very reactive alkali–metal and of the unfavourable flow conditions as a conducting liquid in the presence of magnetic fields. ITER plans to evaluate 6 breeding blankets with water or helium cooling and these will be evaluated in situ based on liquid PbLi-eutectic, or on solid Li-ceramic with a lower TBR. While both will allow an evaluation of TBR under realistic conditions they will not allow the ITER to produce the tritium it needs so it must still be supplied from external sources.
To increase the tritium yield, it will be necessary to employ neutron multipliers, based on (n, 2n) reactions with thresholds lower than 14 MeV. Candidates are beryllium (9Be + n → 24He + 2n) and lead (208Pb + n → 207Pb + 2n) and the latter of which is already incorporated in the LiPb blanket eutectic. Pb has the higher cross-section. The idea to enrich natural Li with 6Li because of its high cross-section specifically for thermal neutrons has to be balanced against the pathway offered by process (2) to increase the number of neutrons. A realistic value for the TBR of a fusion blanket meeting all tasks is ∼1.1.
Operational safety
The section titled Elementary processes for technical fusion summarized the basic features of D–T fusion, and how this can evolve to ultimately be a safe and accepted energy source. The safety aspects of a fusion reactor are based on a set of experiments and detailed reactor models and accident scenarios. ITER has successfully finished a licensing procedure with a detailed safety analysis and later it will provide an experience base for many safety issues.
Some of the basic factors affecting the safety of fusion reactors are as follows: the reactor containment cannot be destroyed by an internal accident; the hazards of fire are reduced by lithium in the blanket being in ceramic form; graphite will not be used inside a reactor primarily to avoid large tritium inventories in dust particles; and the response of the system in case of a loss of coolant accident (LOCA) is governed only by the afterheat. The power density is about a factor of 100 lower than in the core of a fission reactor after shut-down. The temperature increase after an LOCA should not reach melting temperatures and it will develop slowly over about a week. As a consequence, the major safety concern is the release of tritium into the biosphere. Tritium is a β-emitter and therefore has a low radiotoxicity. If ingested, the human body eliminates both inhaled and consumed tritium within ∼10 days. The tritium which is embedded into bones is minute but more firmly bound and has to be considered separately, e.g., scaled to the radioactivity of natural 40K of >100 Bq/kg in human bone tissue. Given possible accident scenarios even in a large accident such as an earthquake, the release of up to 1 kg of T has to be anticipated being restricted to a limited area of ∼ km2 typically inside the reactor fence which would have to be evacuated for a limited period.
Fusion waste
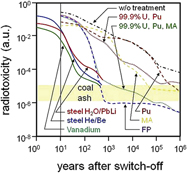
Fusion energy causes radioactive waste of an amount comparable to that of fission. The radiotoxicity of the waste is, however, totally different because fission products, plutonium, and minor actinides with long half-lives are missing (see Fig. 14). A key way to minimize waste formation is to build the reactor structure out of materials that are difficult to activate. The goal for these materials would be to have them decay within 100 years and then be able to be recycled. In case longer-half-life waste is created which is critically dependent on the materials chosen and their activation profiles, it is anticipated that ultimately the amount will be small enough so that shallow geologic disposal will be possible.
Decay of radiotoxicity of the waste from fission and fusion reactors. Shown are the cases of a light water reactor without any waste treatment, with the removal of Pu, of minor actinides (MA) and of fission products (FP). These traces and time scales are compared with those of fusion with various structural materials and coolants. (The plot is partially based on data made available by KIT.)

Costs of fusion electricityReference Bustreo, Bolzonella and Zollino29
The cost structure of fusion electricity is at present determined predominately by large capital costs and not the fuel costs. Fusion reactors are base-load power generators and essentially require continuous operation for economic operation. Two ultimate advantages of fusion are that the electricity production is CO2-free and the basic fuel is obtained with minimum environmental impact. At present, it is expected that electricity costs will be smaller than the usual taxes on electricity and additional charges presently imposed, but they are expected to be higher than those using fossil fuels and present nuclear fission reactors. The details will depend on the development of CO2 costs and many other factors impossible to assess decades ahead.
Roadmap to fusion energy
In Europe, fusion research is coordinated by EUROfusionReference Donné30 on the basis of an elaborated roadmap.Reference Romanelli, Barabaschi, Borba, Federici, Neu, Stork, Horton and Zohm31 Also other nations involved in fusion energy R&D orient themselves along targeted roadmaps. The development of practical fusion requires a series of devices that evolve toward the final reactor parameters. This has been developing over the last 50 years and the international fusion community is now close to the first fusion reactor. In all major devices and specifically on JET, the R&D program is strictly oriented toward open issues for ITER which need urgent clarification before the anticipated startup ∼2025. The initial experimental period will be used to develop plasma scenarios with good prospects to meet the overall ITER goals. The DT operation is scheduled beyond 2030 and this knowledge will be handed over to DEMO.
Wendelstein 7-X started operation at the end of 2015. The future role of the stellarator will depend on the impact of the optimization—specifically on confinement and on the demonstration of steady-state operation. Data and experience will be available when ITER has started. During this period, different concepts for DEMO should be developed and initial designs completed. A concept decision—if necessary—can be taken later. In the long run, both concepts may be worth pursuing if ITER can meet its goals and W7-X can demonstrate a viable steady-state concept.
If successful, DT operation can be demonstrated by ITER by 2035. Thereafter, it is possible that fusion can be put into national energy strategies beyond 2050. Around the same time, a clearer picture will be available on the prospects of Generation-IV fission reactors, the viability of CCS, and the availability of storage systems for intermittent renewable energy sources. Fusion will be an option where ensured base-load power is required and a large and complex infrastructure has to be operated reliably, e.g., within the boundaries of developing mega-cities.
Conclusions
Technical development permitted to exploit the natural energy resources of the earth allowing mankind to rise to more than 7 bn people with growth ongoing. The “limits of growth” of the Club of Rome, proclaimed in the 70s of last century, was found to turn into a “growth of limits”. The resource-to-production ratio increases up to today for oil and gas. In this period of abundance, there was indeed no need to develop further energy technologies. This attitude affected the development of fission energy but also the course of fusion R&D, which never got the means and support to seriously turn the concept into an energy source. The development of fusion had to be structured sequentially dispensing largely with the gain in time of a parallel development of fusion physics and fusion materials.
In the last decade now, the business-as-usual strategy to meet the demands of a growing population by fossil fuels lost its basis because mankind had entered the “Anthropocene”: more than 9 bn people may exist on earth but the energy source which enabled their growth may destruct now the environment for their existence. As a consequence, tremendous activities to save the climate followed. The most obvious conclusion—to vigorously develop all carbon-free energy supply technologies—was not drawn. The previous mistake—to use exclusively fossil fuels—is repeated with the salvation expected exclusively from renewable energy forms. REs will play a role, possibly a major role in the future energy portfolio, no doubt, but they will not be able to cost-effectively serve all sectors of energy use. Fission with fast neutrons, CCS-techniques, and fusion have to be developed in spite of the general hope to meet the 2 or 1.5 °C limit by 2050, before these systems had a chance to penetrate the market. I do not think that the other argument—fission and fusion do not fit to the intermittent supply by wind and photovoltaic systems, supplying the grid—is correct. Many countries will not have the means to provide each citizen with 12 kW installed wind and PV power, adjust the grid to the high power levels, and realize the necessary storage technologies. A more meaningful scenario for me is to develop dispatchable power sources to meet the electricity demand and to use intermittent sources to produce, e.g., hydrogen for other energy consuming sectors.
Fusion physics has made impressive progress and it is now ready to carry out the critical test with the ITER—to produce large amounts of fusion power. The ITER can be built with existing materials. The ITER will show whether the physics basis allows meeting its goals and whether tritium can sufficiently be produced in blankets. With these results on the table, a critical assessment of this concept and the future R&D needs and the general prospects of fusion power can be made. In parallel to the ITER process, fusion materials have to be developed with more vigor than in the past. In case the tokamak line does not allow steady-state operation, the optimized stellarator might turn out to be the right concept.
Fusion research started initially with the expectation to realize an unlimited energy source, which is inherently safe and does not pollute the environment. The safety and exhaust characteristics still apply. Whether it will be an unlimited source has to be demonstrated. However, the expectation is not that fusion alone would supply mankind with energy. Like in the past, the supply should be based on several technologies. However, they all need to be compatible with the protection of the environment. Fusion qualifies for this.