



The global increase in obesity and chronic non-communicable diseases is associated with changes in population dietary habits(Reference Rauber, Martínez Steele and Louzada1–Reference Chang, Khandpur and Neri5). These changes are characterised by the replacement of traditional meals based on fresh foods and culinary ingredients with ultra-processed foods(Reference Moubarac, Batal and Martins6–Reference Marrón-Ponce, Tolentino-Mayo and Hernández-F8).
Among various food classification systems, the NOVA classification developed by Monteiro et al. has become the most widely used in research and policy(Reference Monteiro, Cannon and Levy9). NOVA classifies foods into four groups based on the degree and purpose of their industrial processing: Group 1 – Unprocessed or minimally processed foods, such as whole grains and cereals, legumes, fruits, vegetables, eggs and meats; Group 2 – Processed culinary ingredients, such as salt, sugar, oils and fats; Group 3 – Processed foods, such as vegetables and legumes preserved in brine, cheeses and bread; and Group 4 – Ultra-processed foods, such as soft drinks, ready-to-eat or semi-ready-to-eat meals, prepared sauces, cured meats, breakfast cereals, packaged snacks and candy(Reference Monteiro, Cannon and Levy10). Ultra-processed foods have an unfavourable nutritional profile that negatively affects the nutritional quality of foods(Reference Andrade, Julia and Deschamps11–Reference Juul, Lin and Deierlein16), with significant consequences for health(Reference Adams and White17–Reference Juul, Vaidean and Lin20) and the environment(Reference Swinburn, Kraak and Allender21).
The availability and sale of ultra-processed foods have boomed in high-income countries (1970–2000)(Reference Monteiro, Moubarac and Cannon22) and, more recently, in middle-income countries (2000–2013)(23). In a 2019 analysis of global ultra-processed food trends, the UK had the third-highest sales volume of ultra-processed food per capita (140·7 kg/capita/year) compared with eighty high- and middle-income countries(Reference Vandevijvere, Jaacks and Monteiro24). Previous analyses of the National Diet and Nutrition Survey (NDNS) show that ultra-processed foods already account for more than half of the total food energy consumed by the UK population(Reference Rauber, Louzada and Martínez Steele25). However, as far as we know, there are no trend studies that have examined the changes in actual food consumption considering industrial processing and the differences between socio-demographic strata in the UK. In this sense, this study aims to assess the trend of food consumption in the UK from 2008 to 2019, considering the extent and purpose of industrial food processing and to analyse how these trends vary according to socio-demographic characteristics.
Methods
Data source and sample
Data were acquired from the National Diet and Nutrition Survey (NDNS), a national survey conducted in the UK (England, Wales, Scotland and Northern Ireland). This annual survey has used a standardised methodology since 2008 enabling combined analysis(26). The 1–11 survey years correspond to the years: 1-2008–2009, 2-2009–2010, 3-2010–2011, 4-2011–2012, 5-2012–2013, 6-2013–2014, 7-2014–2015, 8-2015–2016, 9-2016–2017, 10-2017–2018 and 11-2018–2019. The purpose of the NDNS is to collect detailed information about the food consumption of the UK population. Data collection takes place monthly and considers possible seasonal variations in food consumption(27). The survey samples were randomly drawn from the UK Postcode Address Archive, which contains a list of all addresses in the four constituent countries. One child (from 1·5 to 18 years) or one child together with an adult (19 years or older) were selected from each of the randomly selected addresses(28). Data collection included an interview with the researcher to collect socio-demographic and food consumption data as well as a visit with a nurse(27). Food consumption was assessed using a food diary completed by participants on four consecutive days. Everyone who completed the diary on 3 or 4 d was included in the survey, totalling 15 643 participants.
Data and files used in this study were acquired under license from the UK Data Archive found at http://www.esds.ac.uk The study was approved by the ethics committees of each of the four countries participating in the study.
Food consumption
Food consumption was assessed using 4-d food diaries that included workdays and weekends, thus covering all days of the week. Participants were instructed to record all food and beverages consumed inside and outside the home on that day. Portion sizes were estimated using household measures or weights from packing. After completion, diaries were checked by trained interviewers to improve accuracy. Food consumption data from the complete records were coded and processed using the programme DINO (Diet In, Nutrients Out)(Reference Fitt, Mak and Stephen29), and energy and nutrient intakes were estimated using the NDNS food nutrient composition table(30).
Covariates
The socio-demographic variables included in this study were: sex (female and male), age group (1–3 years, 4–10 years, 11–18 years, 19–64 years, 65+ years), region (southern England, central England, northern England, Scotland, Wales and Northern Ireland), ethnicity (white, mixed ethnic group, black, Asian and other ethnicities), and occupational social class. Occupational social class was categorised as high (High and lower managerial and professional occupations), intermediate (intermediate occupations, small employers and own account workers, Lower supervisory and technical occupations) and low (routine and manual occupations).
Food classification according to processing
All food items were classified according to NOVA(Reference Monteiro, Cannon and Levy9), a food classification system based on the nature, extent and purpose of the industrial processing they undergo before consumption. This classification includes four categories (see Box 1).
The NOVA food classification system and its four groups defined according to the extent and purpose of food processing.

All foods presented in the NDNS database are coded as food number and grouped into subsidiary food groups (n 155). When possible, the subsidiary food groups were classified directly according to NOVA. When foods within a subsidiary food group belonged to different NOVA groups (n 52), it was the food codes instead of the group, which were classified individually. Hence, it was possible to allocate each underlying ingredient of homemade dishes into the appropriate NOVA group. Food classification details can be found in a previously published article(Reference Rauber, Louzada and Martínez Steele25).
Data analysis
For each survey day and age group, we defined values for daily energy intake below 1 percentile and above 99 percentiles as outliers. Based on that, tweleve individuals were excluded (n 15 643) and more than 90 % completed the 4-d food diary. The mean of all available days of food diary was used for each person.
We estimated the distribution of daily energy intake (% of total energy) according to NOVA groups and subgroups: (1) unprocessed or minimally processed = thirteen subgroups; (2) processed culinary ingredients = four subgroups; (3) processed foods = six subgroups; and (4) ultra-processed foods = sixteen subgroups) for each survey year. Linear regression analysis was used to assess how this distribution of NOVA groups and subgroups (% of total energy) varied across the 11 years studied (including year as an ordinal variable). Models were adjusted for the covariates of sex, age group, region, ethnicity and occupational social class. In order to estimate the main changes over the period, the difference in the mean energy share (% of total energy) of the extreme years (year 11 (2019) minus year 1 (2008)) of the NOVA subgroups was calculated.
To examine potential differences in energy share trends (% of total energy) by population subgroups, we evaluated an interaction term between the survey year (as an ordinal variable) and each socio-demographic characteristic using the Wald F test.
All analyses were also performed using the contribution of NOVA groups and subgroups to total grams intake (% of total grams).
NDNS study weights were used in all analyses to account for sampling and non-response error. Data analysis was performed using STATA software version 16.1. We considered a P value < 0·05 to test statistical significance.
Results
Table 1 presents the evolution of the dietary share of NOVA food groups and subgroups (% of total energy) over the 11 years of the NDNS survey (2008–2019). The dietary share of unprocessed or minimally processed foods (group 1) remained similar from 2008 to 2019 (≅30 % of total energy, P for linear trend = 0·505). Processed culinary ingredients (group 2) showed an increase from 3·7 % in 2008 to 4·9 % in 2019 (P for linear trend < 0·001) and processed foods (group 3) a decrease from 9·6 % to 8·6 %, respectively (P for linear trend = 0·002). No changes were observed in the proportion of ultra-processed foods (group 4), which accounted for more than half of total energy consumed throughout the period (≅56 % of total energy, P for linear trend = 0·580).
Trend of dietary share (% of total energy intake) of NOVA food groups and subgroups over 11 years in the United Kingdom (NDNS 2008 to 2019)
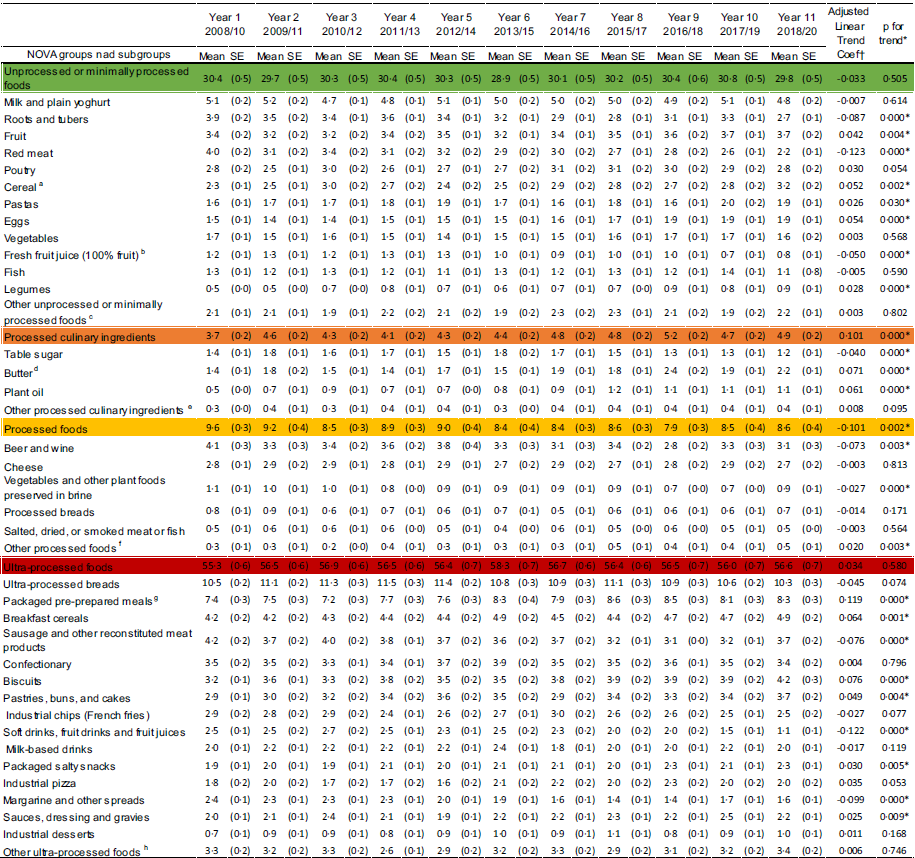
aIncluding grains and flours; bIncluding ultra-high temperature processing (UHT) or pasteurized, and smoothies; cIncluding coffee, tea, sea foods, fungi, nuts, and freshly prepared dishes based on one or more unprocessed or minimally processed food; d Including lard and suet shredded; e Including starches, coconut and milk cream, gelatin powder, and vinegar; fIncluding salted, sweetened, or oil-roasted nuts or seeds, condensed milk, and commercial baby foods; g Including frozen and shelf-stable dishes and canned soups; h Including baked beans, meat alternatives, soy and other drinks as milk substitutes, infant formula, and distilled alcoholic drink · SE = standard error.
†Adjusted for age (years), sex, occupational social class and ethnicity (white, mixed ethnic group, black, Asian and other race). *p value<0·05 for linear trend across years.
Regarding unprocessed or minimally processed food subgroups (group 1), there was a significant decrease in the proportion of diet (% of total energy) from 2008 to 2019 for roots and tubers (from 3·9 % to 2·7 %), for red meat (from 4·0 % to 2·2 %), and for 100 % fruit juice (from 1·2 % to 0·8 %). In addition, an increase in the dietary contribution was observed for fruits (from 3·4 % in 2008 to 3·7 % in 2019), for whole grains and cereals (from 2·3 % to 3·2 %), for pasta (from 1·6 % to 1·9 %), for eggs (from 1·5 % to 1·9 %) and for legumes (from 0·5 % to 0·9 %).
Processed culinary ingredient subgroups (group 2) intake varied from 2008 to 2019. The energy share of table sugar decreased significantly from 1·4 % to 1·2 %, while butter and plant oil intake increased significantly from 1·4 % to 2·2 % and from 0·5 % to 1·1 %, respectively.
Among processed food subgroups (group 3), there was a significant decrease in the energy share of beer and wine from 4·1 % to 3·1 %, vegetables and legumes preserved in brine from 1·1 % to 0·9 %, and an increase in other processed foods from 0·3 % to 0·5 % during the same period.
Among ultra-processed food subgroups (group 4), a significant decrease was observed in the energy share of sausages and other reconstituted meat products (from 4·2 % to 3·7 %), soft drinks (from 2·5 % to 1·1 %) and margarine (from 2·4 % to 1·6 %). On the other hand, significant increase in energy share of packaged pre-prepared meals (from 7·4 % to 8·3 %), breakfast cereals (from 4·2 % to 4·9 %), cookies (from 3·2 % to 4·2 %), pastries, buns and cakes (from 2·9 % to 3·7 %), packaged salty snacks (from 1·9 % to 2·3 %) sauces, dressing and gravies (from 2·0 % to 2·2 %).
The significant differences in the mean energy share of the NOVA subgroups between extreme years, reflecting the entire period studied in the UK population, are shown in Fig. 1. For unprocessed or minimally processed foods, the largest differences were observed for red meat (-1·8 %), roots and tubers (-1·2 %) and whole grains and cereals (0·9 %). Among processed culinary ingredients, the differences between butter (0·8 %) and plant oil (0·6 %) stood out. In processed foods, beer and wine (-1·0 %) presented the largest differences. Regarding ultra-processed foods, soft drinks (-1·4 %), margarine (-0·8 %), sausages and other reconstituted meat products (-0·5 %), breakfast cereals (0·7 %), pastries, buns and cakes (0·8 %), packaged pre-prepared meals (0·9 %), and cookies (1·0 %) differed the most.
Changes in food consumption of the UK population according to NOVA classification subgroups between 2008 and 2019.

No interaction was observed for the trend of energy share of the four NOVA groups when considering the socio-demographic characteristics.
The trend in the share of NOVA food groups and subgroups (% of total grams) over the 11 years is shown in online Supplementary Table 1. The trend in % gram consumption observed in the groups evolved according to the % of energy for processed culinary ingredients (increase from 0·5 % in 2008 to 0·6 % in 2019, P for linear trend = 0·043); processed foods (decreased from 7·7 % to 5·5 %, P for linear trend < 0·001), with the decrease in consumption of beer and wine being noteworthy (from 6·0 % to 3·9 %, P for linear trend < 0·001); and ultra-processed foods (remained ≅29 %; P for linear trend = 0·090), with the decreased consumption of milk-based drinks subgroup to be highlighted (from 3·2 % to 2·8 %, P for linear trend = 0·005). There was a significant increase in gram share of foods grouped as unprocessed or minimally processed (from 61·9 % in 2008 to 65·2 % in 2019, P for linear trend < 0·001), with emphasis on the increase in the water subgroup (from 14·3 % to 21·9 %, P for linear trend < 0·001) and decreases in the milk and yogurt subgroups (from 7·4 % to 6·4 %, P for linear trend < 0·001) and fresh fruit juice (from 4·8 % to 3·4 %, P for linear trend < 0·001).
Discussion
By analysing the representative data of the UK population from 2008 to 2019, we found that the trend of energy share of culinary ingredients, particularly butter and oils, has increased significantly. Moreover, processed foods, particularly beer and wine and vegetables and legumes preserved in brine, have decreased significantly. The energy share of unprocessed or minimally processed foods and ultra-processed foods did not change significantly during this period. While the energy share of roots and tubers, red meat and fresh fruit juice in the diet tended to decline, the energy share of fruits, whole grains and cereals, pasta, eggs and legumes augmented. Among ultra-processed foods, the energy share of packaged pre-prepared meals, breakfast cereals, cookies, pastries, buns and cakes, packaged salty snacks and sauces, dressing and gravies sauces increased, while the share of sausage and other reconstituted meat products, sweetened beverages and margarine decreased over the entire period.
The previously described trends in the energy share of Nova groups in the UK population did not vary according to socio-demographic characteristics. A study carried out in a nationally representative sample of USA adults, also observed an increase in the energy contribution of processed culinary ingredients from 2001 to 2018 that did not differ by age group, education or income level but increased the most among non-Hispanic blacks, followed by Hispanics and non-Hispanic whites. Among US adults, however, a borderline significant trend toward increased contribution of processed foods that did not differ by age group was observed. A trend toward increased consumption of processed foods was observed only among females, among non-Hispanic whites and among individuals with a lower household income level. This study observed a decrease in the contribution of unprocessed/minimally processed foods, that was similar among both sexes, among all races/ethnicities, across all education and income levels, decreasing the most among adults aged 60 years and older followed by middle-aged adults and younger adults. Over this period, an increase in the contribution of ultra-processed foods was observed that was similar across all age groups, education and income levels and that increased to a greater extent among males than among females. This increase was only confirmed among non-Hispanic whites and non-Hispanic blacks(Reference Juul, Parekh and Martinez-Steele34).
As among US adults, a study carried out in a nationally representative sample of US youths between 1999 and 2018, also observed an increase in the energy contribution of processed culinary ingredients, a non-significant change in the contribution of processed foods, a decrease in the contribution of unprocessed/minimally processed foods and an increase in the contribution of ultra-processed foods. A similar increase in the contribution of ultra-processed foods was observed across all sex, age, education and income-level youth population subgroups; however, the increase observed among non-Hispanic Black youths and Mexican American youths was significantly higher than the increase among non-Hispanic White youths(Reference Wang, Martínez Steele and Du35).
The replacement of unprocessed or minimally processed foods and culinary preparations by ultra-processed foods is occurring worldwide. In the UK, this substitution can be said to have already taken place and reached a plateau where the overall increase in the ultra-processed food group is no longer observed. Ultra-processed foods have become a significant source, and in some cases the main source, of dietary energy, in high-income countries, including the UK(Reference Monteiro, Cannon and Moubarac31,32) . While sales of these products appear to be stagnant in high-income countries (due to market saturation), the sales of ultra-processed foods have grown more rapidly in middle-income countries(Reference Monteiro, Moubarac and Cannon22,Reference Baker and Friel33) .
From 2000 to 2016, an analysis of food sales in eighty countries highlighted the global trend of increasing ultra-processed food sales worldwide, except Western Europe, North America and Australasia. The UK had the third-highest volume of ultra-processed food sales (140·7 kg/person), trailing only the Netherlands (143·8 kg/person) and Germany (141·8 kg/person)(Reference Vandevijvere, Jaacks and Monteiro24). Our findings are consistent with these studies on global sales trends, highlighting that ultra-processed food consumption in the UK has remained high in recent years (57 %).
Studies using household budget surveys conducted in Mexico (from 1984 to 2016) and Canada (from 1938 to 2011) have also shown that there has been a gradual decline in unprocessed or minimally processed foods and culinary ingredients – characterising culinary preparations – and an increase in ultra-processed food in recent decades(Reference Moubarac, Batal and Martins6,Reference Marrón-Ponce, Tolentino-Mayo and Hernández-F8) . In the USA, trend analyses over the past two decades (2000 to 2018) have shown an increase in the consumption of ultra-processed foods and culinary ingredients accompanied by a decrease in the consumption of minimally processed foods among adults and children(Reference Juul, Parekh and Martinez-Steele34,Reference Wang, Martínez Steele and Du35) . In our study, targeting the recent period 2008–2019, we observed an increase in the energy share of processed culinary ingredients among the UK population due to increased consumption of butter and plant oils substituting margarine, which presented a decline over time. This replacement may result from the fact that margarines which are produced through intensive processing and chemical transformation of vegetable oils, contain trans-fats, which are more harmful than saturated fats(Reference Hunter36). We also observed the maintenance of the energy share of unprocessed or minimally processed foods in the British diet, with increases in some subgroups (whole grains and cereals, pasta, eggs and legumes) and decreases in others (roots and tubers, red meat and fresh fruit juice), which may indicate a change in the pattern of British culinary preparations during this period.
The decrease in consumption of fresh red and ultra-processed meats, such as sausages and other reconstituted meat products, observed in this study is consistent with current recommendations to reduce consumption of these foods. In the UK, a review of dietary recommendations by the Scientific Advisory Committee on Nutrition in 2011 recommended the reduction of red and processed meat consumption by adults from ≅90 g/d or more to ≅70 g/d(26). The report ‘The Global Syndemic of Obesity, Malnutrition and Climate Change’, published in The Lancet Commission, demonstrates that red meat and ultra-processed foods are among the major contributors to the global syndemic(Reference Swinburn, Kraak and Allender21).
Our results also showed that despite the reducing energy share of table sugar as a culinary ingredient, there was an increase in the consumption of ultra-processed foods rich in sugars, such as breakfast cereals, biscuits, pastries, buns and cakes. There is already a consensus that high consumption of free sugars contributes to obesity, type 2 diabetes, dyslipidaemia, hypertension, and CHD(Reference Te, Mallard and Mann37–39) and, consequently, most dietary recommendations limit their intake. However, more focused efforts are needed to put this recommendation into practice as most free sugar is added to foods before they are marketed and sold. A study conducted with data from the national survey showed that ultra-processed foods were the ones that contributed the most to sugar consumption in the UK and the elimination of these products could reduce the prevalence of excessive free sugar intake by 47 %(Reference Da Costa Louzada, Ricardo and Martínez Steele15). Initial stages of the UK government’s sugar reduction programme, which challenged the food industry to voluntarily reduce the sugar from some products, produced only slow progress towards proposed targets(40).
Energy share reduction of sweetened beverages observed in the period occurred despite no change in the volume (in grams) of these beverages. That may be due to reductions in the sugar concentration of sweetened beverages associated with the UK sugar reduction program and the taxation initiative of the Soft Drink Industry Levy (SDIL) launched in 2015(Reference Alison, Victoria and Gabrielle41,42) . The SDIL was successful in reducing sugar from soft drinks, when compared to that seen for the food categories included in the sugar reduction programme(40). However, when targeting sugar, the SDIL has hastily contributed to increases in the consumption of drinks with artificial sweeteners(Reference Percival43), which have also been associated with adverse health effects(Reference Suez, Korem and Zeevi44,Reference Pearlman, Obert and Casey45) . Regarding the contribution of NOVA groups and subgroups to the total grams, an increase of unprocessed or minimally processed foods was observed, unlike the energy share, which is due, at least in part, to the increase in water consumption. The increase in water consumption was accompanied by a decrease in the gram contribution of each one of the remaining beverages, regardless of the degree of processing (milk and plain yogurt, fresh fruit juice, beer and wine and milk-based drinks). This trend of replacing drinks with water in a country like the UK, with high consumption of ultra-processed foods, is positive taking into account studies assessing an inverse association between the energy share of ultra-processed foods and water intake(Reference Baraldi, Steele and Louzada46).
Our study pioneers analysing trends of food consumption considering the degree of industrial processing among the UK population. In addition, we use data sourced from the NDNS, which uses a high-quality dietary assessment method that provides a detailed analysis of different foods consumed, several assessment days and considers the daily variability of each individual. However, some potential limitations are also noteworthy. The data used were self-reported and may be subject to recording errors. Although food records are recognised as one of the most comprehensive methods for assessing dietary intake, a limitation of this method is the underreporting of some foods, particularly unhealthy foods. Although previous study had shown the mean daily energy intake significant decrease of 164 kJ (39 kcal) between days 1 and 4, the size of the effect was relatively minor(Reference Whybrow, Horgan and MacDiarmid47). The underreporting of ultra-processed foods may have increased over time, considering the growing awareness of the harmful effects of these products on health. However, NDNS data are accurate and validated through painstaking collection methods, with review by trained personnel which helps to minimise misreporting. Although NDNS collects limited information indicative of food processing (i.e., meal location and product brands), the data are not consistently determined for all food items, which can lead to a food classification error. However, standardised NDNS methods minimise potential error and bias.
Food consumption trends according to the degree of food processing highlight a significant increase in processed culinary ingredients and a reduction in the consumption of processed food in the British diet from 2008 to 2019. Furthermore, it sheds light on the high share of ultra-processed foods in the contemporary British diet.
Acknowledgements
The authors would like to thank the Coordenação de Aperfeiçoamento de Pessoal de Nível Superior (CAPES) for the financial support. CAPES had no role in study design, data collection and analysis, decision to publish or preparation of the manuscript.
Planning and analysis were performed by M. F. M., F. R., E. M. S. and R. B. L. The first draft of the manuscript was written by M. F. M. and F. R. All authors commented on previous versions of the manuscript. All authors have read and approved the final manuscript.
The authors declare there is no conflict of interest.
Supplementary material
For supplementary material/s referred to in this article, please visit https://doi.org/10.1017/S0007114522003361



