


Understanding property rights provision is important because it is central to theories about economic growth.Footnote 1 How do we explain property rights provision? Prominent theories hold that property rights are more likely to emerge where assets are mobile.Footnote 2 Asset mobility captures the extent to which productive assets may be withheld from government oversight. This mobility may stem from the ability to move the asset abroad or to a different jurisdiction within the country or simply to evade authorities that seek to tax profits or expropriate assets. The owners of mobile assets are thought to have political influence, precisely because they can withhold these assets from government oversight.Footnote 3 They can use their influence to obtain their preferred policies, especially movement toward property rights and democratic institutions.Footnote 4
Rather than considering the influence of asset owners, this research note considers the preferences of asset owners. Drawing on a formal model, I show that the owners of mobile assets have less to gain from property rights. Because they can withhold their assets from government oversight, they are less likely to be targeted with costly policies and, when targeted, their costs are lower. I also consider how heterogeneity in firm mobility among competing firms affects their market share and their preferences for property rights. Improvements in property rights reduce the likelihood of expropriation, which directly benefits all firms. At the same time, these benefits are larger for immobile firms, who were more vulnerable to expropriation. This means that improvements in property rights shift market share from mobile to immobile firms. If the shift in market share is sufficiently large, property rights improvements harm mobile firms precisely because they help immobile firms so much.
I assess the model predictions drawing on two sources of data: original survey responses from business executives in Latin America and Orbis data on firm profits. Business executives who report having fewer mobile assets and higher costs to evading government policies also indicate more support for property rights. These data are consistent with a stronger need for property rights among executives with more immobile assets. The Orbis data show that property rights are associated with firm profits, but the direction of the association depends on firm mobility. Firms with many immobile assets see an increase in profits while firms with more mobile assets see a reduction in profits when property rights increase. Consistent with the competition mechanism, the results are confined to firms operating in industries with substantial variation in asset mobility. While merely correlations, the results are consistent with both a greater benefit of property rights among firms with more immobile assets and a possible aversion to property rights among those with more mobile assets.
This research note contributes to several literatures. First, the note is closely related to recent work that considers how firm heterogeneity affects politics and policy.Footnote 5 Similar to the competitive mechanism outlined here, Kennard shows that firms can benefit from climate change regulations if they are more prepared for regulation than their competitors are.Footnote 6 Sonin demonstrates that owners may not need institutionally provided property rights if they can instead privately protect their own assets, giving them an advantage over competitors who are less able to self-insure.Footnote 7 I draw on these insights about competition to show that where firms differ in their asset mobility, more mobile firms can benefit from keeping property rights weak, as this weakness disproportionately harms their competitors.
Second, a large literature considers property rights and democratization together because democratic institutions are needed to make property rights credible.Footnote 8 The research note has implications most directly for the literature on property rights and, through the credibility mechanism, for the literature on democracy. The literature suggests that asset mobility is essential to the development of property rights, because either the owners of mobile assets demand property rights and democracy,Footnote 9 or the owners of mobile assets ignore the demands of others for property rights and democracy, allowing the demands to be realized.Footnote 10 This research overlooks that if the owners of mobile assets are willing to ignore demands for property rights and democracy, they will probably also ignore demands for autocracy. They are simply less sensitive to government policies and thus less likely to push for policy reforms, especially those that benefit their competitors. Asset mobility is thus unlikely to trigger property rights development and also unlikely to prevent reversals of property rights.
Research on privatization in Russia follows a similar logic. Economists had expected that privatization would create a new constituency of asset owners demanding property rights. Yet rather than demanding property rights, many owners of privatized assets stripped the value from those assets and moved their earnings abroad.Footnote 11 They didn’t demand property rights at home because they had these rights abroad.Footnote 12 In this literature, mobility helps undermine property rights because the owners of mobile assets exercise their exit option. This research note suggests that mobility can undermine property rights developments, even where owners do not exit, because owners of mobile assets are less likely to be targeted with costly policies and less likely to demand property rights protections.
The theory lends parallel insights to the literature on foreign investment. If foreign firms are more mobile than domestic firms,Footnote 13 then foreign firms have less to gain from property rights improvements, and may even oppose them as property rights disproportionately benefit their less mobile, domestic competitors. This pattern is plausibly reinforced by bilateral investment treaties (BITs). BITs can give multinational firms access to stronger property rights than their domestic counterparts.Footnote 14 This reduces the benefit of domestic property rights for foreign firms and increases the gap between foreign and domestic firms. This makes it more likely that, for foreign firms, the costs of property rights in terms of market share overwhelm the benefits in terms of expropriation. The expansion of global markets and international investment law may consequently reduce demand for domestic property rights improvements.
Substantive Background
Because this research note deals with several broad concepts that are presented in different ways in existing literature, it is helpful to clarify how these concepts will be used here. These concepts also motivate the formalization of the theoretical model described in the next section. First, property rights capture investors’ “ability to retain ownership of the accumulated factor and especially the returns to the factor.”Footnote 15 An implied part of this definition is that, if the ownership of or returns to the factor is circumscribed in some illegal way, property rights provide access to legal redress: targeted owners can seek and obtain compensation through courts or arbitration. Consistent with this characterization, property rights are modeled here as the probability that owners continue to derive profits from their businesses following expropriation.
There are various strategies that firms could use to pressure the government for stronger property rights. These strategies operate through various channels, including formal transfers like campaign contributions, informal transfers like bribes, or information provision through lobbying.Footnote 16 This study does not address which strategies firms use;Footnote 17 it merely recognizes that firms can influence policy. Firms seeking property rights are different from firms attempting to strengthen political connections. Property rights are public goods and provide legal recourse to all firms—this will be apparent in the model where the consequences of property rights are shared across firms.
Second, expropriation is used generally to describe violations of property rights. Governments make commitments to asset owners about how their assets will be treated. Expropriation here is a reversal of these commitments without compensation. This broad conceptualization includes outright seizure of assets and corruption or discriminatory policies that benefit specific firms.Footnote 18 The example of Khar’kov-Moska, a firm located in Kharkiv, Ukraine illustrates the logic.Footnote 19 Khar’kov Moska planned to build a new business center. During the permitting process, the local government began targeting Khar’kov Moska with unfavorable inspections, claims of tax evasion, withdrawal of the land lease, and fines. A county-level agency declared the targeting “had no merit,” and a local TV station reported that “the mayor’s friend” was interested in the project. The legal harassment continued for two years, until Khar’kov-Moska gave up the project. In the model, a government decides whether to expropriate each firm or to honor its rights.
Third, asset mobility captures the extent to which firms can withhold their assets from government oversight, typically from taxation, regulation, or expropriation. Measures of immobility include capital intensity, fixed assets, tangible assets, capital account closure, or lack of diversification.Footnote 20 Scholars typically expect that natural resource assets, especially oil, are immobile.Footnote 21 Crucial for the insights that follow is that mobility can differ among producers of the same product. This makes sense if they use different production processes. Consider blueberry producers: Blueberries are often grown in fields, and land is immobile, yet they can also be grown in greenhouses and in containers, which are more mobile. Blueberries can be harvested by hand or using machines.Footnote 22 Different producers rely on different production strategies that have consequences for their mobility, and switching between different production strategies would impose transaction costs. In the model, I assume that mobility is firm specific, that firms cannot alter their level of mobility, and that mobility can vary across firms that are in direct competition with one another.
Model
This section elaborates a formal model to explore the relationship between asset mobility and property rights. There are three actors in the model: a government and two firms. The sequence of play is as follows.
Sequence of Moves
-
1. Nature draws the government’s payoff from not expropriating,
 $${v}$$
.
$${v}$$
. -
2. Without observing nature’s draw, the firms simultaneously decide how much quantity to produce,
$${{q_i}}$$
and
$${{q_j}}$$
. -
3. The government decides whether to expropriate each firm.


Preferences
Firms seek to maximize their profits. Production follows a linear Cournot model of quantity competition, which has been revised to include property rights and mobility considerations. Each firm has the following profit function:
 $${{\pi _i}\left( {{q_i},{q_j}} \right) = {q_i}\left( {D - {q_i} - {q_j} - {c_i} - {\varepsilon _i}\left( {1 - \rho } \right){\mu _i}} \right)}$$
, where the quantities produced by firm
$${{\pi _i}\left( {{q_i},{q_j}} \right) = {q_i}\left( {D - {q_i} - {q_j} - {c_i} - {\varepsilon _i}\left( {1 - \rho } \right){\mu _i}} \right)}$$
, where the quantities produced by firm
 $${i}$$
and
$${i}$$
and
 $${j}$$
are
$${j}$$
are
 $${{q_i}}$$
and
$${{q_i}}$$
and
 $${{q_j}}$$
; the level of market demand is
$${{q_j}}$$
; the level of market demand is
 $${D}$$
and the unit cost of production is
$${D}$$
and the unit cost of production is
 $${{c_i}}$$
. The unit cost of expropriation is
$${{c_i}}$$
. The unit cost of expropriation is
 $${{\varepsilon _i}\left( {1 - \rho } \right){\mu _i}}$$
. The probability that firm
$${{\varepsilon _i}\left( {1 - \rho } \right){\mu _i}}$$
. The probability that firm
 $${i}$$
will be expropriated is
$${i}$$
will be expropriated is
 $${{\mu _i}}$$
, which is endogenous in the model. Immobility is
$${{\mu _i}}$$
, which is endogenous in the model. Immobility is
 $${{\varepsilon _i} \in \left[ {0,1} \right]}$$
: higher levels of
$${{\varepsilon _i} \in \left[ {0,1} \right]}$$
: higher levels of
 $${{\varepsilon _i}}$$
capture fewer mobile assets. The extent of property rights is
$${{\varepsilon _i}}$$
capture fewer mobile assets. The extent of property rights is
 $${\rho \in \left[ {0,1} \right]}$$
. Both firms are assumed to be sufficiently productive to enter the market:
$${\rho \in \left[ {0,1} \right]}$$
. Both firms are assumed to be sufficiently productive to enter the market:
 $${D - {q_i} - {q_j} - {c_i} - {\varepsilon _i}\left( {1 - \rho } \right){\mu _i}\; \gt \;0}$$
.
$${D - {q_i} - {q_j} - {c_i} - {\varepsilon _i}\left( {1 - \rho } \right){\mu _i}\; \gt \;0}$$
.
The government’s return if it does not expropriate is
 $${v \in \left[ {0,1} \right]}$$
, where
$${v \in \left[ {0,1} \right]}$$
, where
 $${v}$$
is a random variable drawn from the uniform probability density function,
$${v}$$
is a random variable drawn from the uniform probability density function,
 $${f\left( x \right) = 1}$$
, with cumulative density,
$${f\left( x \right) = 1}$$
, with cumulative density,
 $${F\left( x \right) = x}$$
. The government’s payoff from expropriation per unit of production of firm
$${F\left( x \right) = x}$$
. The government’s payoff from expropriation per unit of production of firm
 $${i}$$
is
$${i}$$
is
 $${{\varepsilon _i}\left( {1 - \rho } \right)}$$
, that is, the firm’s production that is neither mobile nor protected by property rights.
$${{\varepsilon _i}\left( {1 - \rho } \right)}$$
, that is, the firm’s production that is neither mobile nor protected by property rights.
The model introduces firm-specific differences in production, both through productivity,
 $${{c_i}}$$
, and immobility,
$${{c_i}}$$
, and immobility,
 $${{\varepsilon _i}}$$
. Additionally, either mobility or property rights,
$${{\varepsilon _i}}$$
. Additionally, either mobility or property rights,
 $${\rho }$$
, can lesson the cost of expropriation: The firm pays no cost to expropriation and the government sees no gain from expropriation for the share of the firm’s production that is mobile or protected by property rights. One important difference between property rights and mobility is that property rights protect the assets of both firms, while mobility is firm specific: only the mobile firm gets protection from its mobility.
$${\rho }$$
, can lesson the cost of expropriation: The firm pays no cost to expropriation and the government sees no gain from expropriation for the share of the firm’s production that is mobile or protected by property rights. One important difference between property rights and mobility is that property rights protect the assets of both firms, while mobility is firm specific: only the mobile firm gets protection from its mobility.
Equilibrium and Model Insights
The solution concept is Sub-game Perfect Nash equilibrium, as is appropriate for a sequential-move game. I proceed via backward induction. The government expropriates firm
 $${i}$$
if:
$${i}$$
if:
 $${v \le {\varepsilon _i}\left( {1 - \rho } \right)}$$
. In expectation, the probability that the government expropriates is:
$${v \le {\varepsilon _i}\left( {1 - \rho } \right)}$$
. In expectation, the probability that the government expropriates is:
 $${{\mu _i} = Pr\left( {v \le {\varepsilon _i}\left( {1 - \rho } \right)} \right) \Rightarrow {\mu _i} = {\varepsilon _i}\left( {1 - \rho } \right)}$$
. The government is more likely to expropriate firms with lower levels of mobility (where
$${{\mu _i} = Pr\left( {v \le {\varepsilon _i}\left( {1 - \rho } \right)} \right) \Rightarrow {\mu _i} = {\varepsilon _i}\left( {1 - \rho } \right)}$$
. The government is more likely to expropriate firms with lower levels of mobility (where
 $${{\varepsilon _i}}$$
is large) and where property rights are weak (
$${{\varepsilon _i}}$$
is large) and where property rights are weak (
 $${\rho }$$
is small). The following proposition details this finding. The finding is consistent with the conventional wisdom and thus reassuring that the model works in a reasonable way. Proofs are in the appendix.
$${\rho }$$
is small). The following proposition details this finding. The finding is consistent with the conventional wisdom and thus reassuring that the model works in a reasonable way. Proofs are in the appendix.
Proposition 1 The government is less likely to expropriate firms with more mobile assets and where property rights are stronger.
Now, consider the firm’s production decision. Each firm selects production to maximize profits:
 $${{\rm{ma}}{{\rm{x}}_{{q_i}}}\left\{ {{\pi _i} = {q_i}\left( {D - {q_i} - {q_j} - {c_i} - {\varepsilon _i}\left( {1 - \rho } \right){\mu _i}} \right)} \right\}}$$
. Plugging
$${{\rm{ma}}{{\rm{x}}_{{q_i}}}\left\{ {{\pi _i} = {q_i}\left( {D - {q_i} - {q_j} - {c_i} - {\varepsilon _i}\left( {1 - \rho } \right){\mu _i}} \right)} \right\}}$$
. Plugging
 $${{\mu _i}}$$
in and solving for both firms’ optimal quantities yields the following expression for firm
$${{\mu _i}}$$
in and solving for both firms’ optimal quantities yields the following expression for firm
 $${i}$$
.
$${i}$$
.
 $${q_i^{\rm{*}} = {{{D - 2{c_i} + {c_j} - \left( {2\varepsilon _i^2 - \varepsilon _j^2} \right){{(1 - \rho )}^2}}}\over{3}}}$$
This expression includes the standard findings, where each firm’s production is increasing in aggregate demand,
 $${D}$$
; decreasing in their own production costs,
$${D}$$
; decreasing in their own production costs,
 $${{c_i}}$$
; and increasing in their competitor’s costs,
$${{c_i}}$$
; and increasing in their competitor’s costs,
 $${{c_j}}$$
. More interestingly, each firm’s production is decreasing in their own immobility,
$${{c_j}}$$
. More interestingly, each firm’s production is decreasing in their own immobility,
 $${{\varepsilon _i}}$$
, and increasing in the competitor’s immobility,
$${{\varepsilon _i}}$$
, and increasing in the competitor’s immobility,
 $${{\varepsilon _j}}$$
. In short, firms that are immobile invest less in production, as they lose more from expropriation. Immobility, in the context of weak property rights, deters investment.
$${{\varepsilon _j}}$$
. In short, firms that are immobile invest less in production, as they lose more from expropriation. Immobility, in the context of weak property rights, deters investment.
From the quantity produced, we derive the firm’s profit function, allowing us to investigate how profits change with property rights and which firms are most in need of property rights improvements. The first Lemma follows from the profit function.
Lemma 1 The effect of property rights on firm profits is inconclusive; property rights may increase or decrease profits.
To see where this insight comes from, consider how property rights affect firm profits. The effect of property rights on equilibrium profits is:
 $${{{\partial \pi _i^{\rm{*}}} \over {\partial \rho }} = {{4q_i^{\rm{*}}} \over {\rm{3}}}\left[ {{\rm{2}}\varepsilon _{{i}}^{\rm{2}}{\rm{ - }}\varepsilon _{{j}}^{\rm{2}}} \right]\left( {{\rm{1 - }}\rho } \right)}$$
. The sign of this effect depends on the expression in brackets. The first term in brackets,
$${{{\partial \pi _i^{\rm{*}}} \over {\partial \rho }} = {{4q_i^{\rm{*}}} \over {\rm{3}}}\left[ {{\rm{2}}\varepsilon _{{i}}^{\rm{2}}{\rm{ - }}\varepsilon _{{j}}^{\rm{2}}} \right]\left( {{\rm{1 - }}\rho } \right)}$$
. The sign of this effect depends on the expression in brackets. The first term in brackets,
 $${2\varepsilon _i^2}$$
, captures the direct benefit of an improvement in property rights. Property rights reduce the chance and cost of expropriation. These effects lead to an increase in a firm’s profits. At the same time, property rights carry these benefits for the firm’s competitor as well. The second term in brackets,
$${2\varepsilon _i^2}$$
, captures the direct benefit of an improvement in property rights. Property rights reduce the chance and cost of expropriation. These effects lead to an increase in a firm’s profits. At the same time, property rights carry these benefits for the firm’s competitor as well. The second term in brackets, $ {- \varepsilon _j^2}$
, captures the indirect cost of property rights, as they increase the quantity produced by the competitor firm. When the competitor increases production, this reduces the firm’s profits. Whether the firm benefits from property rights improvements depends on whether their own benefit is larger than the benefit for their competitor and thus whether
$ {- \varepsilon _j^2}$
, captures the indirect cost of property rights, as they increase the quantity produced by the competitor firm. When the competitor increases production, this reduces the firm’s profits. Whether the firm benefits from property rights improvements depends on whether their own benefit is larger than the benefit for their competitor and thus whether  .
.
Proposition 2 Property rights are more likely to profit the firm with more immobile assets.
The proposition follows from the logic earlier. The direct benefit of property rights in terms of reducing production costs overwhelms the indirect cost in terms of market share when
 $${2\varepsilon _i^2{\rm{ \gt }}\varepsilon _j^2}$$
. This condition is more likely to hold when the firm’s own immobility,
$${2\varepsilon _i^2{\rm{ \gt }}\varepsilon _j^2}$$
. This condition is more likely to hold when the firm’s own immobility,
 $${{\varepsilon _i}}$$
, is large. The intuition for the proposition is that although property rights directly reduce production costs for all firms, these benefits are largest for immobile firms. Improvements in property rights thus shift production toward firms with more immobile assets. When this shift is sufficiently large, property rights improvements reduce the profits of the more mobile firm, whose competitive advantage was at least in part based on its better ability to cope with property rights violations. The indirect effect is more likely to dominate the direct effect for the more mobile firm when mobility is higher and the difference in asset mobility between the two firms is large.
$${{\varepsilon _i}}$$
, is large. The intuition for the proposition is that although property rights directly reduce production costs for all firms, these benefits are largest for immobile firms. Improvements in property rights thus shift production toward firms with more immobile assets. When this shift is sufficiently large, property rights improvements reduce the profits of the more mobile firm, whose competitive advantage was at least in part based on its better ability to cope with property rights violations. The indirect effect is more likely to dominate the direct effect for the more mobile firm when mobility is higher and the difference in asset mobility between the two firms is large.
Extensions
Lobbying on property rights. In the appendix, I present a model where firms, prior to making their production decision, can exert effort to improve property rights. Drawing on the profit effects outlined in Proposition 2, firms with more immobile assets are more likely to exert effort toward property rights improvements because they see larger gains from property rights.
Modeling expropriation. The model here assumes that expropriation, or violations of firm property rights, affect production. Formally, expropriation was modeled as adding an additional cost,
 $${{\varepsilon _i}\left( {1 - \rho } \right)}$$
, to each unit of production. This assumption is compelling for corruption that degrades the firm’s ability to operate and is proportional to its productive capacity: it makes sense that expropriation would increase operating costs for firms.
$${{\varepsilon _i}\left( {1 - \rho } \right)}$$
, to each unit of production. This assumption is compelling for corruption that degrades the firm’s ability to operate and is proportional to its productive capacity: it makes sense that expropriation would increase operating costs for firms.
At the same time, there are other ways that expropriation could be modeled, which are consequential for the insights derived here. Expropriation could be modeled as a tax on firm profits, reducing the extent to which firms retain the profits from their production. The appendix shows that if expropriation costs are deducted from profits, for example,
 $${\pi_i-\epsilon_i(1-\rho)\mu_i}$$
, rather than by increasing the marginal cost of production as is assumed earlier, then there are no competitive effects. Firms simply make their production decisions to maximize profits, and weak property rights do not affect market shares. Under this assumption, all firms benefit from property rights improvements, albeit to different degrees. Proposition 1 still follows: Expropriation is less likely for firms with more mobile assets and in places with weaker property rights. For this reason, firms with more mobile assets should express less need for property rights. However, subtracting the expropriation costs from profits gets rid of the heterogeneous effects outlined in Lemma 1 and Proposition 2.Footnote 23 To derive the heterogeneous effects of expropriation, one must consider expropriation as affecting production decisions.
$${\pi_i-\epsilon_i(1-\rho)\mu_i}$$
, rather than by increasing the marginal cost of production as is assumed earlier, then there are no competitive effects. Firms simply make their production decisions to maximize profits, and weak property rights do not affect market shares. Under this assumption, all firms benefit from property rights improvements, albeit to different degrees. Proposition 1 still follows: Expropriation is less likely for firms with more mobile assets and in places with weaker property rights. For this reason, firms with more mobile assets should express less need for property rights. However, subtracting the expropriation costs from profits gets rid of the heterogeneous effects outlined in Lemma 1 and Proposition 2.Footnote 23 To derive the heterogeneous effects of expropriation, one must consider expropriation as affecting production decisions.
Model predictions. The model shows that property rights can have two effects. First, they directly reduce the production costs of firms. However, these effects are heterogeneous. For firms with more mobile assets, the benefits of property rights are smaller because they are less likely to be expropriated and, when expropriated, the costs are smaller. Second, improvements in property rights have competitive effects. By reducing costs, they increase the market share of firms with immobile assets at the expense of those with mobile assets. When the differences between asset mobility are sufficiently large, firms with mobile assets lose enough market share that they earn lower profits than they would in the absence of property rights improvements.
These material effects cut in the opposite direction as the influence channel anticipated by existing literature. Existing arguments typically expect firms with mobile assets to have more political influence and to use that influence to achieve improvements to property rights provision.Footnote 24 I now turn to an empirical analysis to evaluate which argument is more consistent with observational data.
Empirics
I present two analyses to assess the predictions: first, survey evidence from business executives in Latin America, and second, cross-national evidence on asset mobility, property rights, and firm profits.Footnote 25
Survey Data from Business Executives
The theory anticipates that business executives with more immobile assets are more likely to be targeted for expropriation and thus have stronger preferences for property rights improvements. To assess whether their preferences are consistent with the theory, I ran an online survey of business executives in Latin America. Following standard practices in the field, I preregistered my expectations with OSF.Footnote 26 The research design was also approved by the Institutional Review Board at Washington University in St. Louis, which vetted the project with regional experts who had done survey research in the countries of interest. I also provided all survey respondents with information about the survey and gave them the opportunity to opt out.
I requested the full sample that Bilendi could reliably make available, and I collected 388 survey responses from business executives between 29 May and 5 June 2024. I targeted respondents in Argentina (fifty responses), Chile (fifty-six responses), Colombia (eighty-one responses), Mexico (155 responses), and Peru (forty-six responses). Bilendi subcontracts with survey firms in each country and provides each respondent with the equivalent of about five euros in compensation for completing the survey. Business executives are owners or managers of companies. Ninety-eight percent of the sample respondents are owners and almost 88 percent are managers (the vast majority, 86 percent, of respondents are owners and managers).Footnote 27 Most of the respondents own small- or medium-sized businesses. Forty-two-and-a-half percent of the firms employ fewer than ten employees, 30.4 percent have between ten and forty-nine employees, 18 percent have between fifty and 249 employees, and 9 percent have over 250 employees.Footnote 28
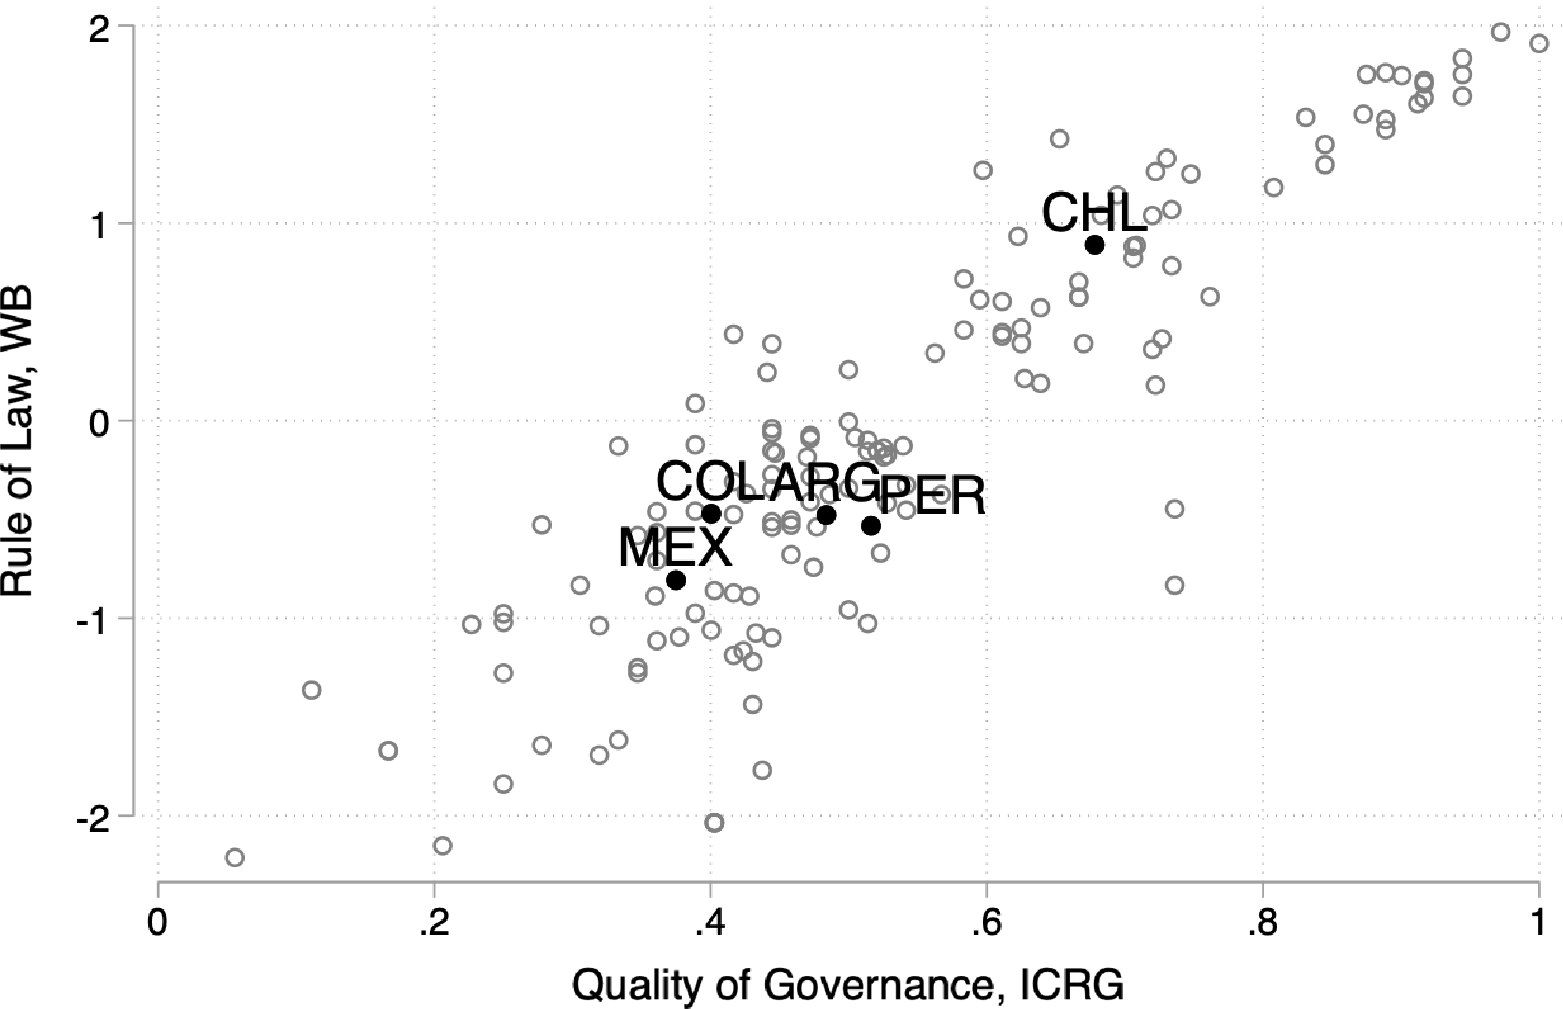
These countries were selected because they are middle-income countries (2025 World Bank classification) in the same region and speaking the same language with middling levels of property rights enforcement. In these countries, firm executives are plausibly familiar with the concept and function of property rights but also perceive the need to strengthen rights. Figure 1 displays cross-national data from two commonly used measures of property rights reported in 2023: the rule of law from the World Bank is on the y-axis and the quality of governance from the ICRG is on the x-axis.Footnote 29 Rule of law includes several indicator variables capturing perceptions of contract enforcement, judicial effectiveness, and the incidence of crime. Quality of governance similarly collapses indicators based on perceptions of law and order, bureaucratic quality, and corruption. Each empty gray circle in the figure represents one country from the full sample of countries available. The filled black circles represent the countries included in the survey here. Argentina, Colombia, Mexico, and Peru are clustered together near the center of the distribution. Chile scores higher on both property rights measures, a point explored in the robustness discussion later.
Property rights across sample countries

Figure 1 Long description
A scatter plot showing the relationship between the quality of governance and the rule of law across sample countries. The x-axis represents the quality of governance, ICRG, ranging from 0 to 1. The y-axis represents the rule of law, WB, ranging from -2 to 2. The plot contains dozens of data points, with several clusters and outliers. Notable labeled data points include CHL, COL, ARG, PER, and MEX. CHL is positioned at a high quality of governance and a high rule of law. COL, ARG, PER, and MEX are clustered around a moderate quality of governance and a moderate to low rule of law. The overall trend shows a positive correlation between the quality of governance and the rule of law. All values are approximated.
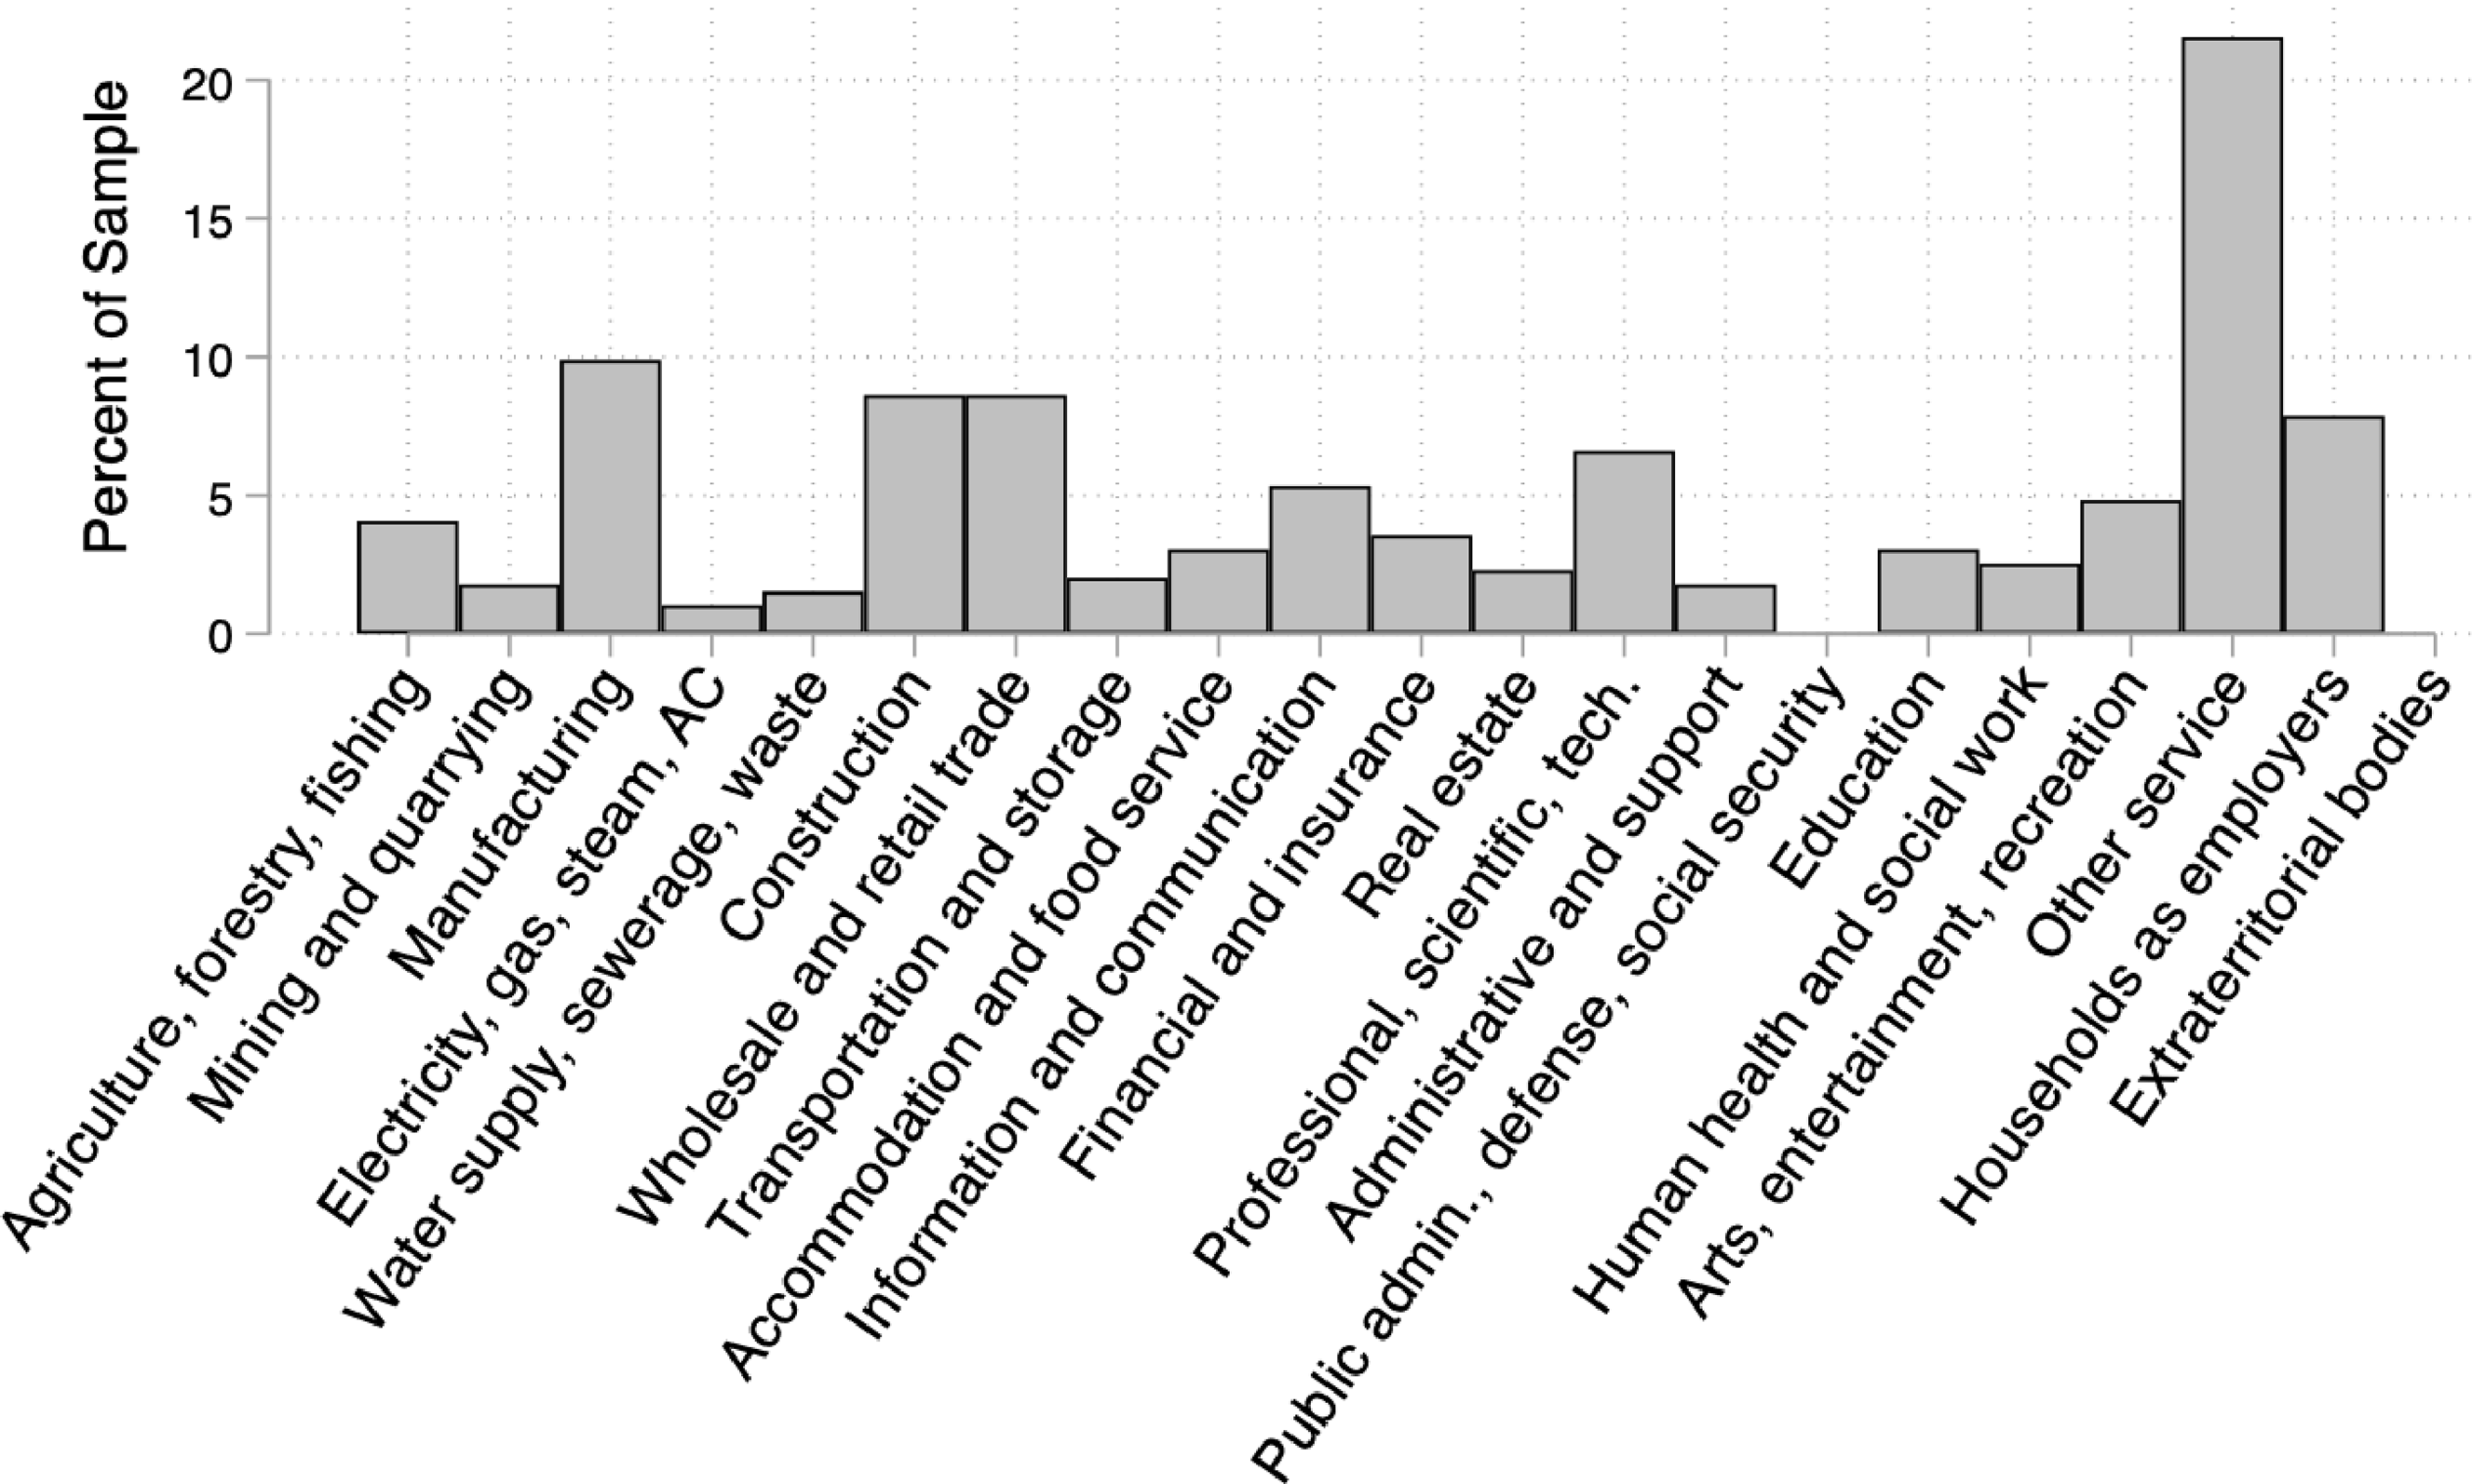
Figure 2 displays the sectoral composition of the sample. “Other service” is the most common sector, representing about 20 percent of the sample. Within the “Other service” sector, the most common division is “Other personal services,” which accounts for about 90 percent of that sector.Footnote 30 Manufacturing is the second most common sector, with around 10 percent of the sample. The appendix reports the distribution of sectors for each country.
Distribution of respondent sectors

Figure 2 Long description
The bar graph compares various sectors by the percentage of respondents from each sector. The x-axis lists sectors such as Agriculture, forestry, fishing, Mining and quarrying, Manufacturing, Electricity, gas, steam, AC, Water supply, sewerage, waste, Construction, Wholesale and retail trade, Transportation and storage, Accommodation and food service, Information and communication, Financial and insurance, Real estate, Professional, scientific, and technical, Administrative and support, Public administration, defense, social security, Education, Human health and social work, Arts, entertainment, recreation, Households, Other service, Extraterritorial bodies, and Extraterritorial bodies. The y-axis represents the percentage of the sample, ranging from 0 to 20 percent. The bars are vertical and show varying heights, indicating the percentage of respondents in each sector. Notable trends include a high percentage in the Extraterritorial bodies sector and lower percentages in sectors like Mining and quarrying and Water supply, sewerage, waste. All values are approximated.
To measure each firm’s asset mobility (the independent variable of interest), respondents were asked about the cost their firm would face if it was forced to relocate and about the share of their firm’s assets that are fixed. To capture the cost to move, the question read, “How costly would it be for your company to reinvest elsewhere or change the business model if the government threatened property rights?” Footnote 31 Respondents selected an answer from the following: not at all costly (which takes on a value of 1), somewhat costly (2), or very costly (3). Higher values indicate less mobility and more vulnerability to government intervention.
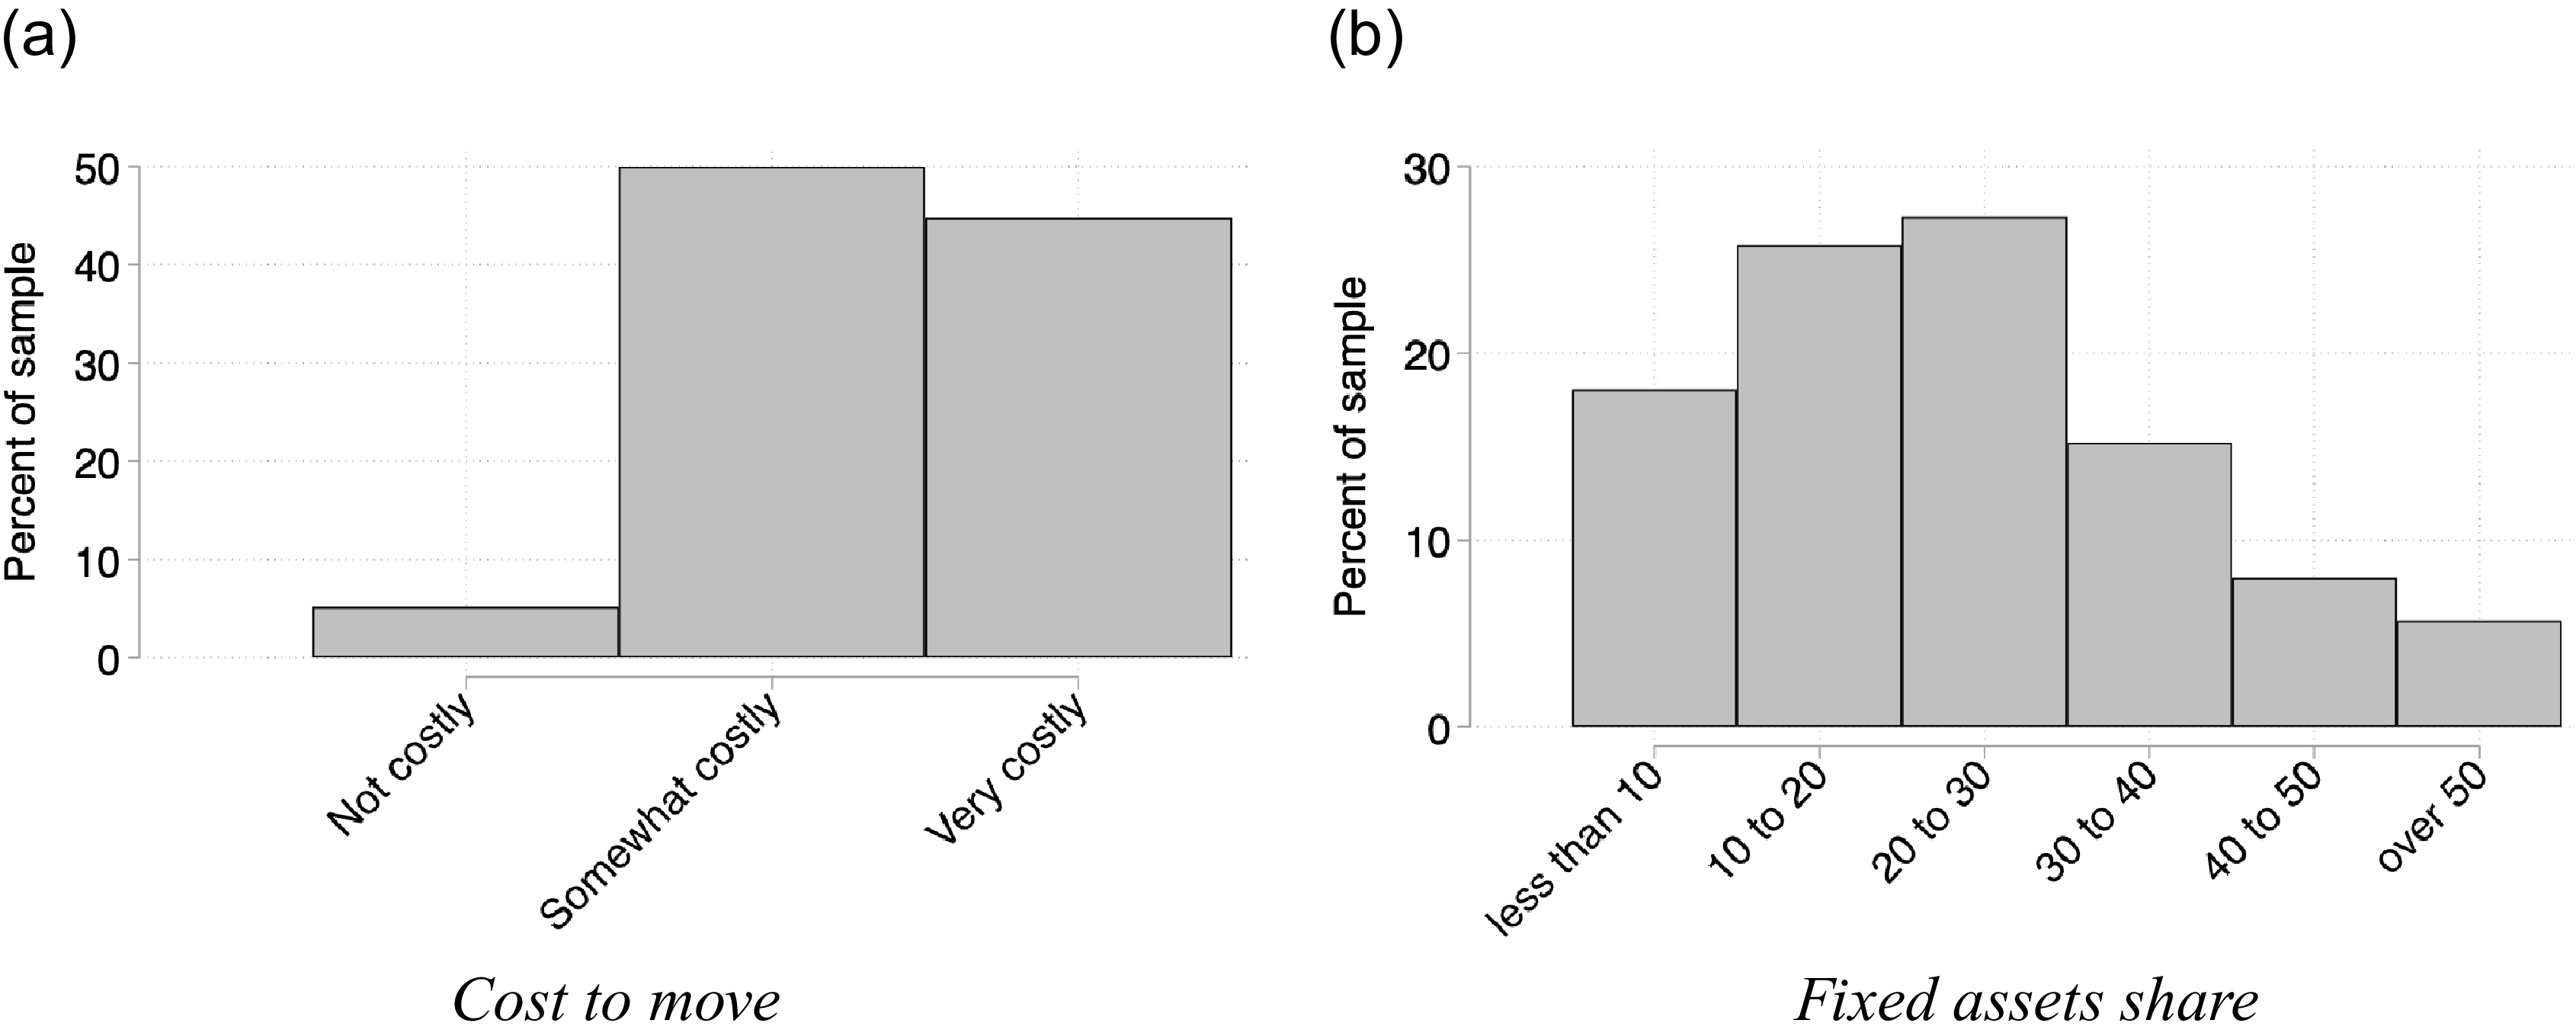
To capture mobility a bit differently, respondents were also asked about the share of their assets that are fixed, which is commonly used in the literature to measure firm immobility.Footnote 32 Respondents read, “Fixed assets are assets acquired for long-term use, such as machinery, vehicles, equipment, land or buildings. In terms of ownership of company assets, what proportion are fixed assets?” Footnote 33 They selected a level from the following list: less than 10 percent (which takes on a value of 1 in the data), between 10 and 20 percent (2 in the data), between 20 and 30 percent (3), between 30 and 40 percent (4), between 40 and 50 percent (5), and over 50 percent (6). Higher values thus indicate more fixed assets and less mobility. Figure 3 displays the distribution of the cost to move and fixed asset share variables.
Distributions of the immobility variables: the cost to move (left panel) and the fixed asset share (right panel)

Figure 3 Long description
The image contains two bar graphs side by side. The left graph, labeled 'Cost to move,' shows the percentage of samples categorized by costliness: Not costly, Somewhat costly, and Very costly. The right graph, labeled 'Fixed assets share,' displays the percentage of samples distributed across different ranges: less than 10, 10 to 20, 20 to 30, 30 to 40, 40 to 50, and over 50. The left graph indicates that the majority of samples fall under 'Somewhat costly' and 'Very costly,' with a small percentage under 'Not costly.' The right graph shows a higher percentage of samples in the 10 to 20 and 20 to 30 ranges, with decreasing percentages as the fixed asset share increases. All values are approximated.
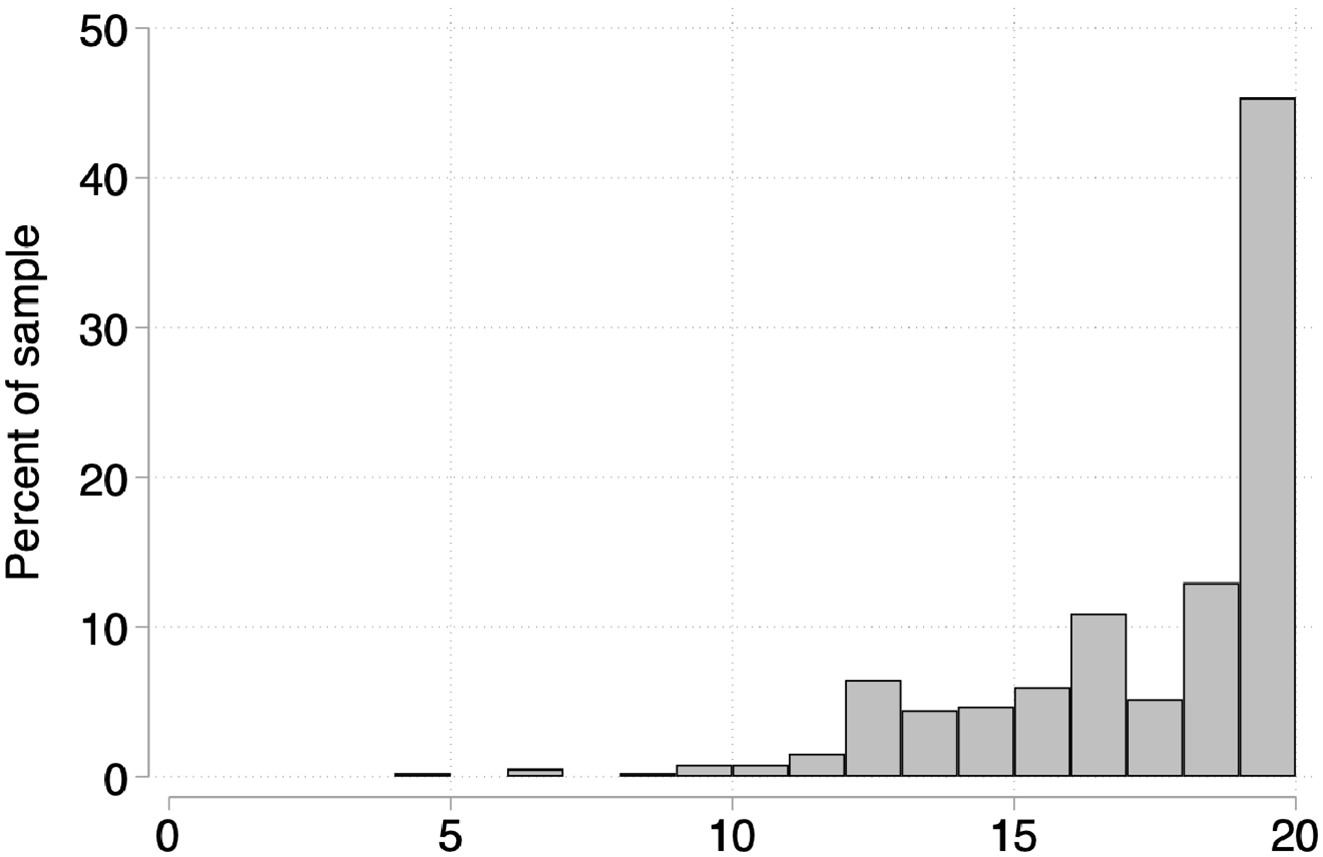
To measure the dependent variable of interest, support for improving property rights, respondents were asked the extent to which they agree or disagree with the following four statements:Footnote 34 First, “firm owners should be able to use the legal system to protect themselves from corruption and government interference;” Footnote 35 second, “the government should do more to combat corruption;” Footnote 36 third, “the government should do more to give firms access to a free and just legal system;” Footnote 37 and fourth “benefits for companies with political connections create an unfair advantage for those companies.” Footnote 38 Respondents selected the extent to which they agree with the statements on a five-point Likert scale from strongly disagree to strongly agree. Higher values indicate more agreement and thus are consistent with a stronger preference for improvements in property rights. Responses to the four questions are summed up to create the dependent variable. Figure 4 displays the distribution of the data. The appendix also reports the distribution of the underlying variables.
Distribution of support for property rights, dependent variable

Figure 4 Long description
A histogram showing the distribution of support for property rights. The x-axis represents the support levels ranging from 0 to 20, while the y-axis indicates the percentage of the sample. The histogram consists of vertical bars, with the majority of the data concentrated towards the higher end of the x-axis. The highest bar, representing the 20 support level, reaches approximately 50 percent of the sample. The distribution shows a significant skew towards higher support levels, with fewer samples at the lower end. The bars gradually increase in height as the support level rises, indicating a trend of increasing support. All values are approximated.
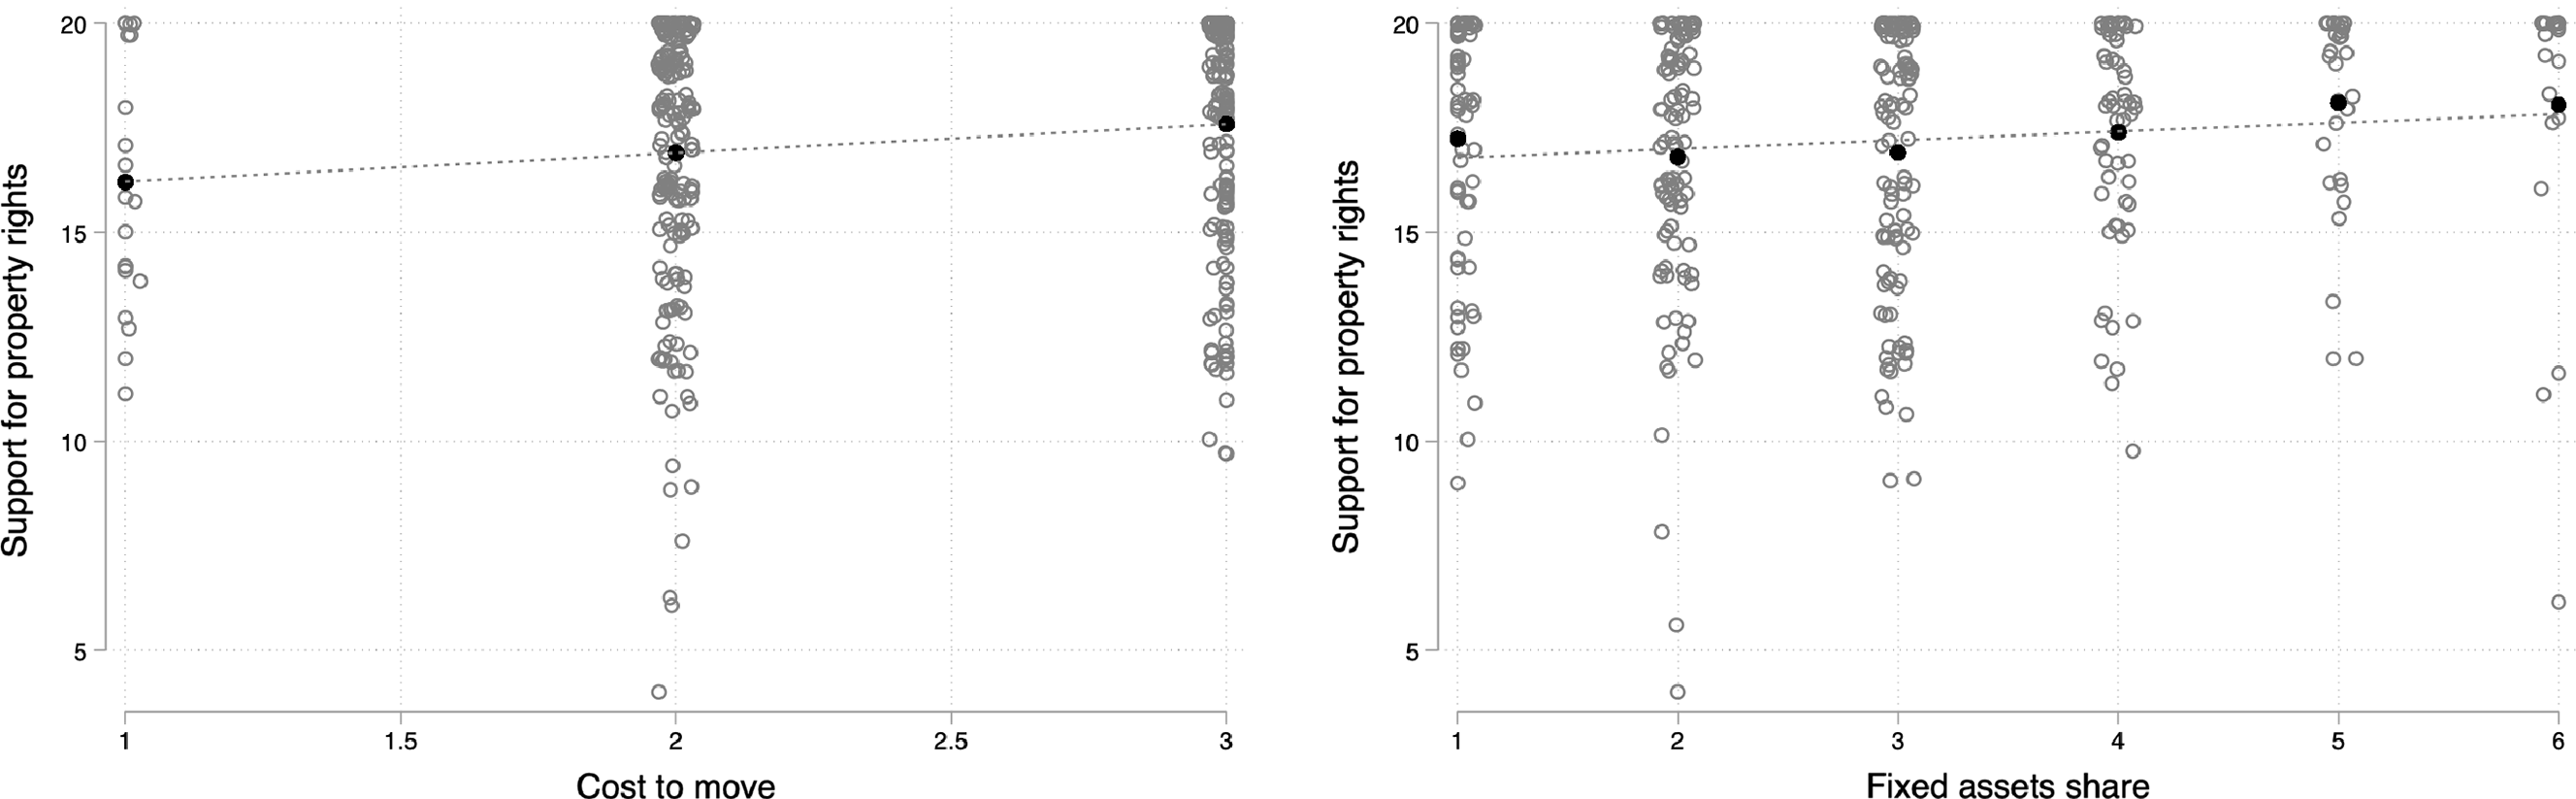
Before proceeding to the regression analysis, it is useful to display relationships in the raw data. Figure 5 includes two panels. The left panel plots the support for property rights measure on the y-axis and the cost to move variable on the x-axis. The right panel plots the support for property rights measure on the y-axis and the fixed assets share on the x-axis. The empty gray circles display all the observations in the data (the circles are “jittered” slightly to make it easier to see them); the black circles are the mean value of support for property rights at each level of cost to move and fixed asset share; and the line provides the linear fit of the property rights variable as a function of cost to move and fixed asset share. The data reveal a small but plausible increase in support for property rights as a function of asset immobility.
Raw data: support for property rights as a function of the cost to move (left panel) and the fixed asset share (right panel)

Figure 5 Long description
A scatter plot with two panels. The left panel shows the relationship between support for property rights and the cost to move. The right panel shows the relationship between support for property rights and the fixed asset share. Each panel contains dozens of data points represented by circles. The x-axis of the left panel ranges from 1 to 3, representing the cost to move. The y-axis ranges from 5 to 20, representing support for property rights. The x-axis of the right panel ranges from 1 to 6, representing the fixed asset share. The y-axis ranges from 5 to 20, representing support for property rights. Both panels include a dotted trend line indicating the overall trend. The data points are clustered around specific values, with some outliers present. All values are approximated.
In order to include control variables and calculate significance levels, I now turn to OLS regression models. Controls include operating revenue, number of employees, and political connections—as measured by the extent to which the executive agrees that they are close to many politicians. Controls also include industrial level fixed effects. Respondents selected their NACE sector and division from a drop-down menu. The NACE sector codes are listed along the x-axis in Figure 2 and include sectors like “manufacturing” (C) and “information and communication” (J). The divisions further disaggregate the sectors and provide an additional two-digit code, which differentiates, for example, between the “manufacture of food products” (C.10) and the “manufacture of beverages” (C.11) and “publishing activities” (J.58) and “programming and broadcasting activities” (J.60). The regressions include first sector fixed effects and then division fixed effects. They also include country fixed effects.
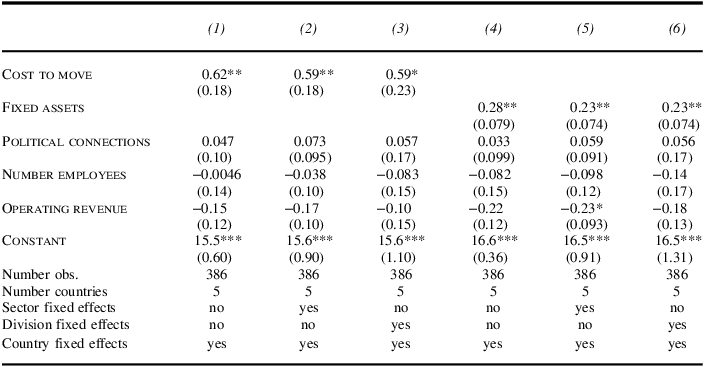
Table 1 reports coefficients from OLS regression models. In columns (1) through (3) the independent variable of interest is the cost to move, while in columns (4) through (6) the independent variable is the share of fixed assets. Columns (1) and (4) include country fixed effects and baseline controls. Columns (2) and (5) add sector fixed effects, and columns (3) and (6) include division fixed effects. Robust standard errors clustered by country are reported in parentheses. The results indicate a robust association between asset immobility and demand for property rights. Those with higher costs to move and higher shares of fixed assets are more likely to report a preference for improving property rights.
Dependent variable is support for improving property rights

Table 1 Long description
The table presents coefficients from OLS regression models, with columns (1) through (3) focusing on the cost to move and columns (4) through (6) on the share of fixed assets. Columns (1) and (4) include country fixed effects and baseline controls. Columns (2) and (5) add sector fixed effects, while columns (3) and (6) include division fixed effects. Robust standard errors clustered by country are reported in parentheses. The results show a strong association between asset immobility and demand for property rights, indicating that higher costs to move and higher shares of fixed assets correlate with a greater preference for improving property rights. The table includes six columns and seven rows, with each row representing different variables and their respective coefficients and standard errors.
Notes: The dependent variable is support for improving property rights. Standard errors in parentheses, clustered at the country level.
 $${{{\rm{\;}}^{\rm{*}}}p \lt .10}$$
;
$${{{\rm{\;}}^{\rm{*}}}p \lt .10}$$
;
 $${{{\rm{\;}}^{{\rm{**}}}}p \lt .05}$$
;
$${{{\rm{\;}}^{{\rm{**}}}}p \lt .05}$$
;
 $${{{\rm{\;}}^{{\rm{***}}}}p \lt .01}$$
.
$${{{\rm{\;}}^{{\rm{***}}}}p \lt .01}$$
.
For ease of interpretation, I dichotomize the dependent variable (where 1 is a score of at least 16 on the composite support for property rights measure, and 0 is any score less than 16)Footnote 39 and run linear probability models. A one-unit change in asset immobility (that is about a 10 percent increase in the share of fixed assets) increases the probability that respondents support property rights by 2.1 percentage points with division fixed effects and 2.8 percentage points without. Similarly, a one-unit change in cost to move (that is moving from “not at all costly” to “somewhat costly” or from “somewhat costly” to “very costly”) increases the probability that respondents support property rights by 6.1 percentage points with division fixed effects and 7.0 percentage points without. While modest, the results suggest that asset immobility is an important correlate of preferences for property rights improvements, and firms with more immobile assets express more support for property rights improvements.
Robustness. There are various robustness tests reported in the appendix. First, because the composite property rights variable is left skewed, I replicate the main regression models but replace the dependent variable with a logged measure of support for property rights. The results following this transformation are similar to those reported in the text.
Second, the immobility of firms may have larger effects in countries with weak property rights because improvements are more relevant in these countries. To evaluate this expectation, I interact the measures of immobility with the rule of law measure from the World Bank.Footnote 40 The positive association between immobility and demand for property rights remains positive and significant across all models. The results suggest that the positive association is larger in countries with weaker rule of law, but the difference in the effect size (interaction term) is not statistically significant. The insignificance of the interaction could stem from the limited variation in property rights in the sample countries or the sample size.
Third, to further assess the sensitivity of the results to country characteristics, I interact the measures of immobility with each country dummy. The association between cost to move and demand for property rights remains positive and statistically significant across all specifications. The association with fixed assets is positive and significant without sector and division fixed effects, but loses significance once these are added. There are some small differences between demand for property rights across the different countries.
Fourth, I replicate the main regression table and replace the dependent variable with each of the underlying property rights variables used to calculate the composite variable: support for protection from corruption and government interference, doing more to combat corruption, doing more to provide a free and just legal system, and political connections providing an unfair advantage. The correlations are similar in sign and magnitude, but the results lose significance about half of the time. The results are most robust using the underlying variables that capture support for a free and just legal system and doing more to combat corruption.
Cross-national data on firm profits
I next turn to Proposition 2—the theory anticipates that property rights improvements provide larger benefits to firms with more immobile assets, while those with mobile assets may even be harmed by property rights improvements. I draw on data from the Orbis Historical database.Footnote 41 Only firms that report data on their fixed assets are included in the sample. The data include over 33 million observations from over 6 million firms in 156 countries from 1998 to 2020.
The dependent variable is each firm’s profit margin, logged. The independent variables include an interaction between property rights and asset immobility. Property rights are measured using the World Bank’s rule of law variable described earlier.Footnote 42 Asset immobility is again captured by each firm’s fixed assets, logged. Higher values indicate less mobility. The theory anticipates a positive interaction, where property rights increase profits more among firms with more fixed or immobile assets.
The empirical models control for several confounding factors. At the firm level, they include controls for the number of employees and total firm assets, both logged, as well as fixed effects for the firm’s four-digit NACE industry code (also from Orbis). These are important controls since larger firms plausibly earn higher profits and have more fixed assets. The fixed effects allow us to look within the same industry, which is important for capturing firms that are in competition with one another. The models also control for country-level variables: wealth (GDP per capita), growth rates, the polity score,Footnote 43 and capital account openness.Footnote 44 Profits may be higher in wealthier countries and in countries that are growing quickly. The level of democracy may affect both rule of law and profits. Capital account openness may be related to asset mobility, property rights, and profits if it prevents redistribution and facilitates democratization.Footnote 45
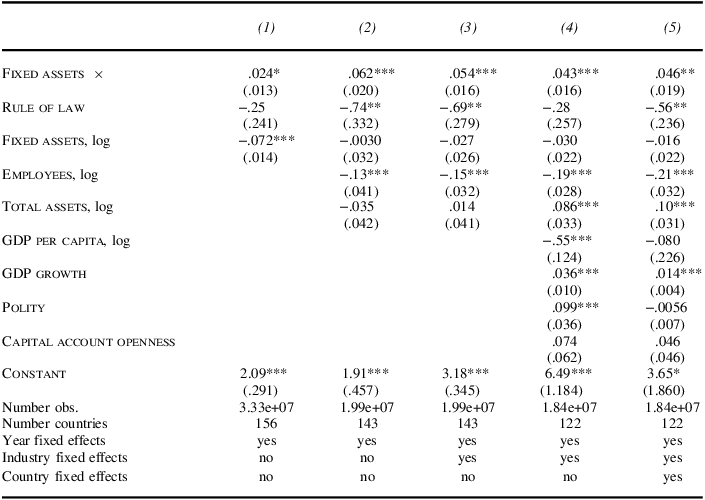
Table 2 reports the results of OLS regression models. Errors are clustered at the country level.Footnote 46 All columns include year fixed effects. Column (1) reports the baseline model. Column (2) adds firm-level controls for employees and total assets, logged. Column (3) adds industry fixed effects at the four-digit level (NACE code). Column (4) adds controls for log GDP per capita, GDP growth, the Polity score, and capital account openness. Column (5) adds country fixed effects.
Dependent variable is profit margin, logged

Table 2 Long description
The table presents the results of OLS regression models analyzing the profit margin, logged. It includes five columns, each representing different models with varying controls. Column 1 shows the baseline model with fixed assets and rule of law. Column 2 adds firm-level controls for employees and total assets, logged. Column 3 includes industry fixed effects at the four-digit level. Column 4 adds controls for log GDP per capita, GDP growth, Polity score, and capital account openness. Column 5 includes country fixed effects. Each row lists the coefficients and standard errors for different variables across these models. The table also provides the number of observations, number of countries, and indicates the inclusion of year fixed effects.
Notes: The dependent variable is the profit margin, logged. Standard errors in parentheses, clustered at the country level.
 $${{{\rm{\;}}^{\rm{*}}}p \lt .10}$$
;
$${{{\rm{\;}}^{\rm{*}}}p \lt .10}$$
;
 $${{{\rm{\;}}^{{\rm{**}}}}p \lt .05}$$
;
$${{{\rm{\;}}^{{\rm{**}}}}p \lt .05}$$
;
 $${{{\rm{\;}}^{{\rm{***}}}}p \lt .01}$$
.
$${{{\rm{\;}}^{{\rm{***}}}}p \lt .01}$$
.
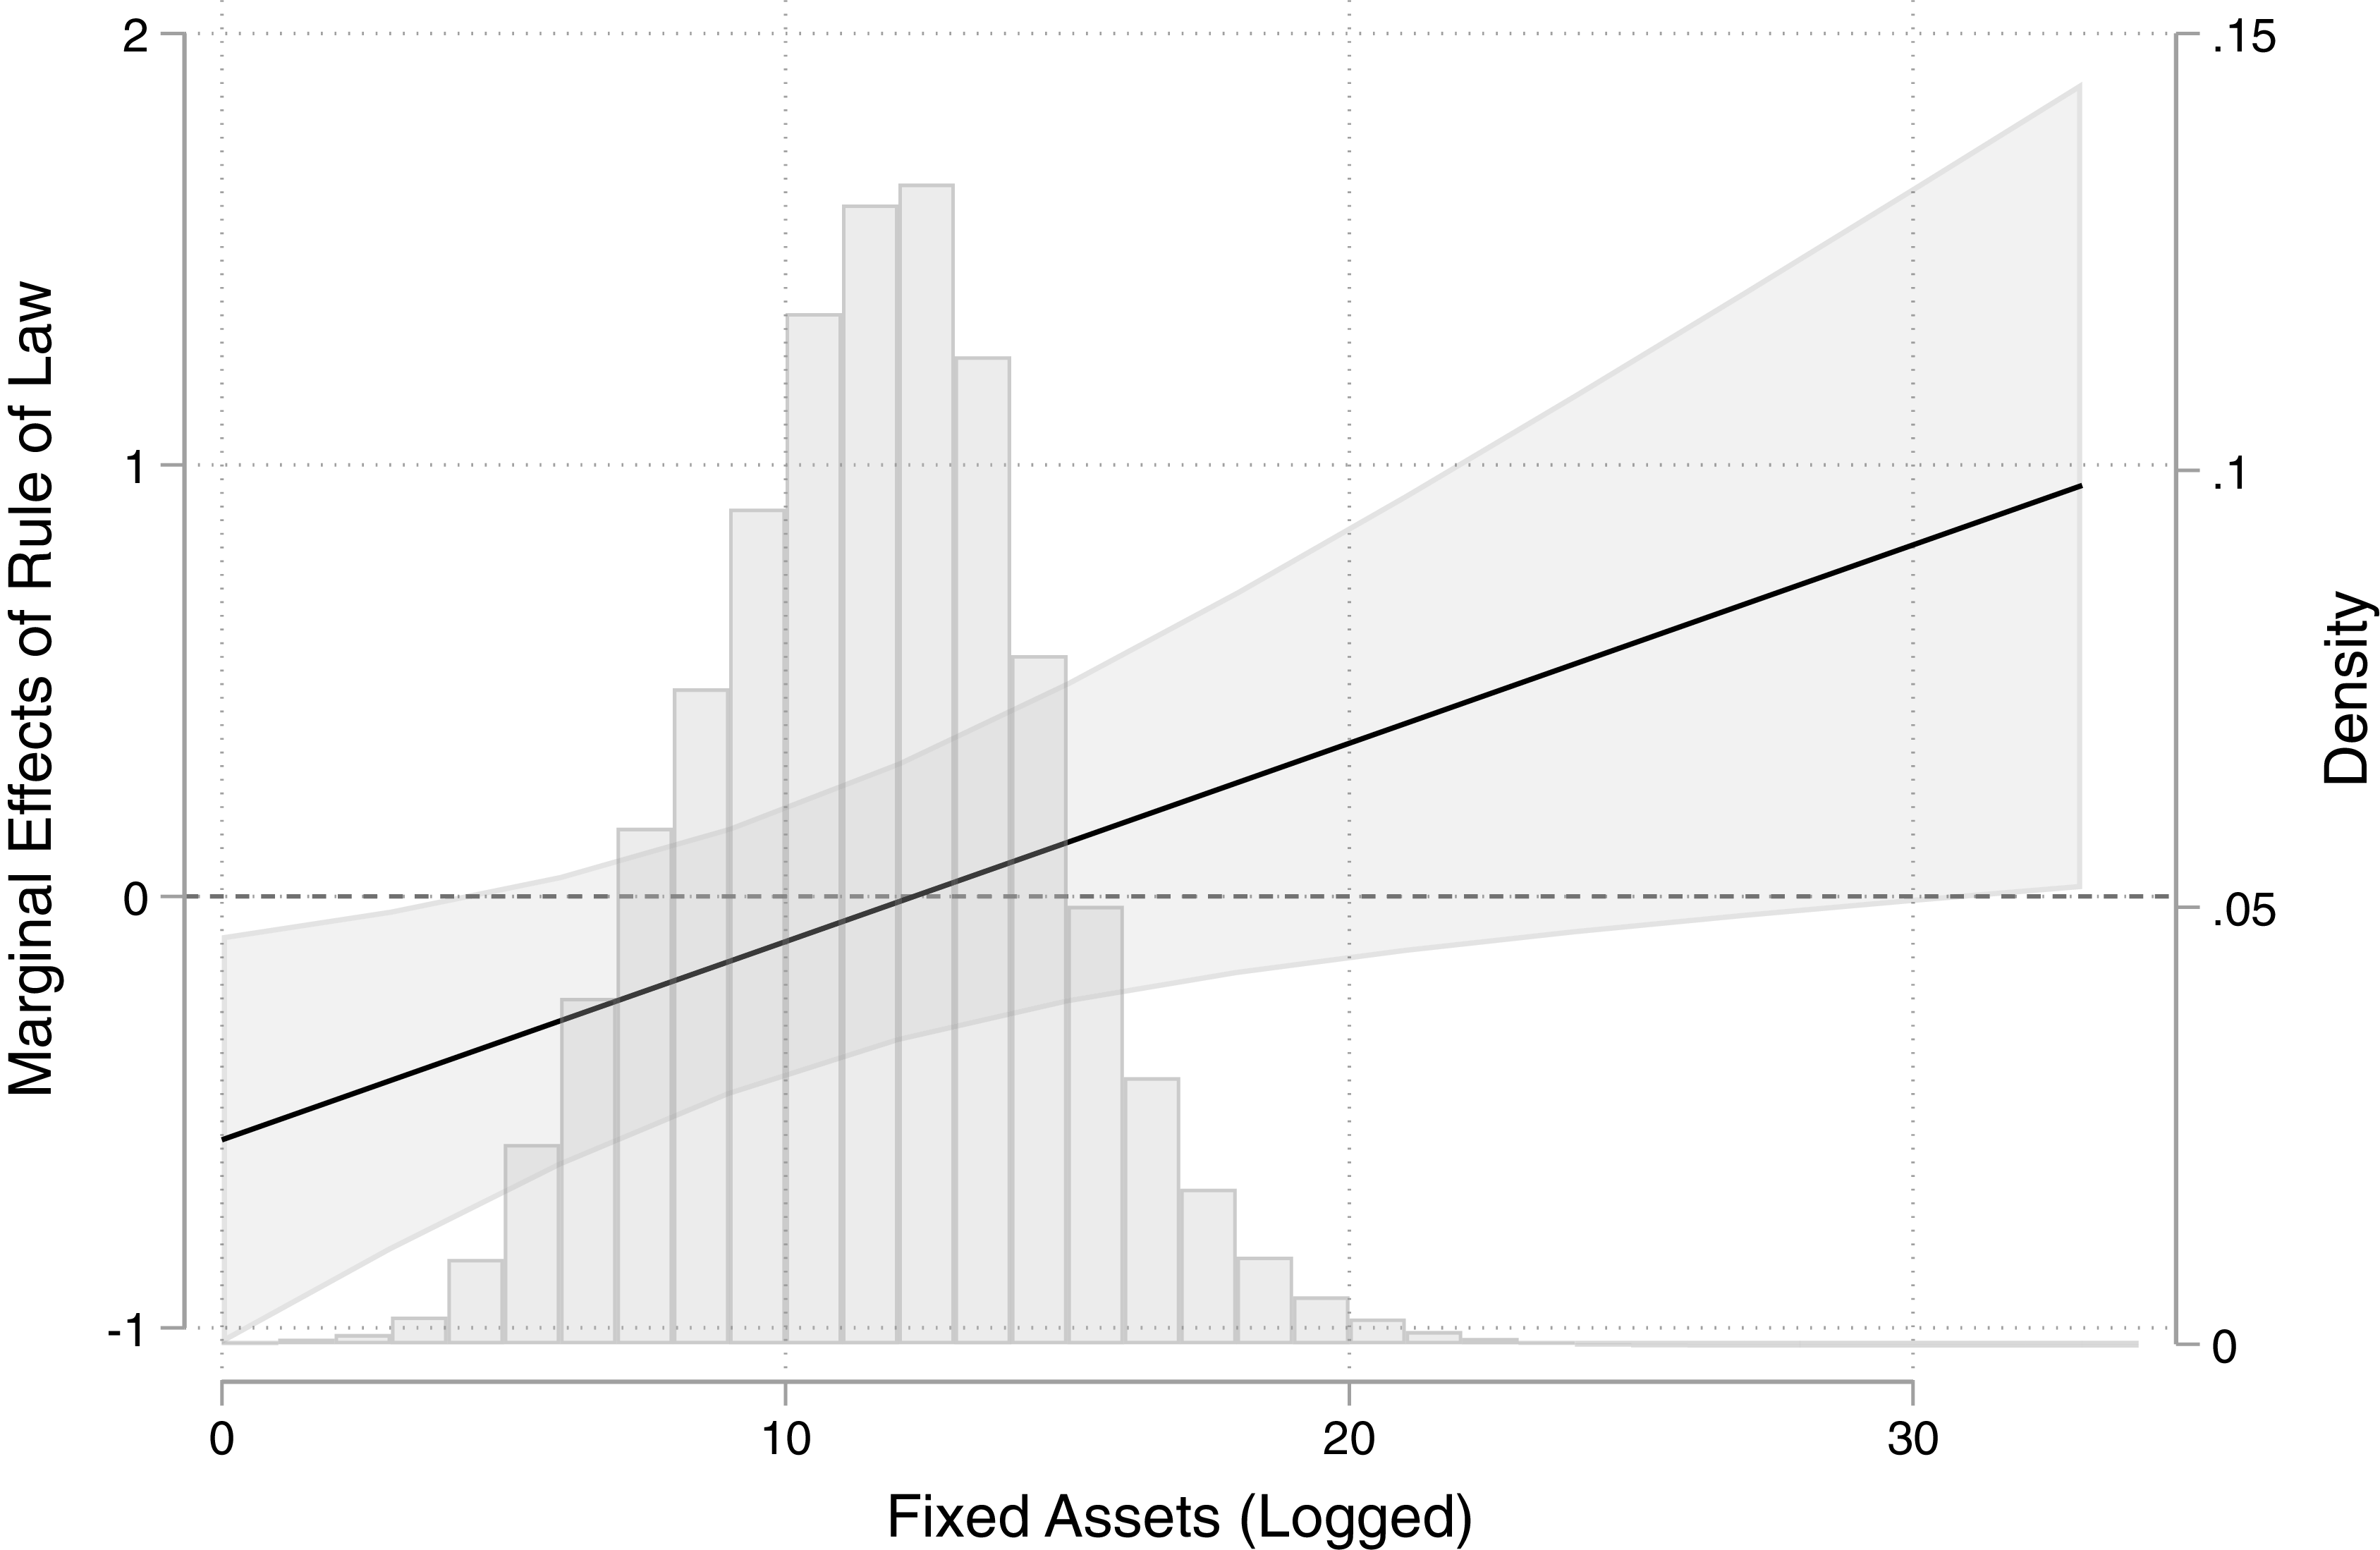
The coefficient on the interaction term is positive in all models and reaches statistical significance at the 5 percent level in most models (the exception is the baseline model, which does not control for total assets). Figure 6 displays the marginal effect of rule of law as a function of fixed assets, drawing on the estimates from column (5). While the interaction is significant, the marginal effect of rule of law is often insignificant. Rule of law is negatively associated with profits for firms with very few fixed assets, in other words for those with many mobile assets. This effect is consistent with these firms losing market share to firms with fewer mobile assets—when property rights are improved. It is only for firms with very many fixed assets that rule of law is positively and significantly associated with profits. The findings are consistent with property rights affecting market share and immobile firms benefiting from property rights improvements.
Marginal effect of governance on profits

Figure 6 Long description
A histogram displays the distribution of the marginal effects of the rule of law on fixed assets, which are logged. The x-axis represents fixed assets in logarithmic scale, ranging from 0 to 30. The y-axis on the left shows the marginal effects of the rule of law, ranging from -1 to 2. A density plot is overlaid on the histogram, with the y-axis on the right indicating density values from 0 to 0.15. The histogram bars are vertical and vary in height, indicating the frequency of different marginal effects. The density plot line is black, showing a positive trend as fixed assets increase. The shaded area around the density line represents the confidence interval. The data appears to be continuous, and the distribution shows a general upward trend in the marginal effects of the rule of law with increasing fixed assets. All values are approximated.
These findings are merely suggestive. They are correlations in observational data, and there are many challenges to inference. First, reverse causality could be present and bias could go in either direction: profits could drive rule of law if economic growth fosters demand for rule of law (positive association) or if large profits make attractive targets for expropriation (negative association). These effects may be especially pronounced for firms with more fixed assets, as willingness to invest depends on property rights. Second, property rights may induce changes to markets that affect profits through several avenues distinct from those outlined in the formal model. If property rights deepen financial markets, they may facilitate entry and encourage competition, which reduces profits. I cannot rule out these competing effects and thus urge caution in interpreting the results.
Robustness. I provide several additional analyses and robustness tests in the appendix. First, the theoretical intuition earlier relied on the idea that more mobile firms could gain a competitive advantage in a weak property rights environment as their competitors are more sensitive to government intervention. I thus expect the results to apply only in industries with variation in sensitivity to government intervention. To assess this, I calculate the standard deviation in log fixed assets among firms in the same NACE four-digit industry. I then calculate the standard deviation in log fixed assets across all firms. I code a dummy variable, “low variation,” which is equal to 1 for each industry with a below-average standard deviation in logged fixed assets and equal to 0 for those industries with an above-average standard deviation in logged fixed assets. I interact low variation with rule of law and fixed assets to evaluate whether the results are stronger for those industries with substantial variation in fixed assets (and thus where competitive effects should be relevant). Among high-variation industries, the results look similar to those reported in the text. Among low-variation industries, the association between rule of law (at all levels of fixed assets) is largely insignificant, as is the interaction term. In sum, the results are confined to those industries with above-average variation in fixed assets, where asset mobility can be a source of competitive advantage.
Second, I assess the linearity assumption of the interaction with immobility. I first bin the immobility variable (fixed assets) into terciles and replicate the main findings in the paper; I then bin the variable into quintiles for added flexibility. The binned findings are similar to the continuous findings and reveal larger positive effects of property rights at higher levels of immobility.
Third, I replicate the main models replacing the dependent variable with alternative measures of profits. These variables are profit to loss ratio (before and after taxes) and the profit margin. The correlations remain similar in size and significance.
Conclusion
This research note presents three empirical predictions. First, governments are more likely to expropriate firms with more immobile assets and in weak property rights environments. Second and for this reason, firms with more immobile assets have more to gain from property rights improvements. Third, to the extent that firms, who produce the same products, differ in their production processes, those with more mobile assets may be competitively disadvantaged by property rights improvements. This is because property rights disproportionately reduce the production costs of their competitors.
Evidence is consistent with the predictions. Survey data from Latin America shows that business executives with more immobile assets are more likely to agree that improving the legal system and providing protection from corruption are important. In cross-national regressions, property rights are positively associated with profits for only firms with substantial immobile assets. For those with many mobile assets, property rights are negatively associated with profits.
These findings challenge the conventional wisdom that asset owners with mobile assets seek out institutional reforms that enhance property rights provision. The theory suggests instead that firms with immobile assets are more likely to demand institutionalized property rights protections, although they may lack the influence to realize their preferences in policy. The note suggests that the owners of mobile assets, who are less sensitive to costly government policies, were unlikely to have been the primary driver of property rights developments. Combined with theories of firm influence, this presents a paradox. Firm owners who have the more political influence and are better able to realize their preferences as policy are less likely to seek property rights.
More broadly, the note is thus consistent with arguments asserting that a fundamental cause of property rights is a division between the economic and the political elite, where the economic elite seek property rights protection from interference by the political elite.Footnote 47 The note further suggests that, due to the influence induced by mobility, the economic elite—when they own mobile assets—are unlikely to demand property rights. This suggests that a division between the economic and political elite and the ownership of immobile assets by the economic elite might be needed for the development of democratic institutions. This insight is consistent with case material from Bellin, who shows divisions within economic elites in their preferences for representative institutions.Footnote 48
Research further suggests that divisions between the economic and political elite are unlikely. First, the political elite systematically regulate markets to undermine the economic performance of their rivals’ firms.Footnote 49 Second, if immobile assets are more subject to government discretion, they are likely to be owned by those with political connections: connected individuals gain ownership through expropriation, biased legal decisions, or purchases.Footnote 50 This is indeed one of the logics of the resource curse. If governments can take over immobile natural resource firms and have easy access to resource revenues,Footnote 51 they can use those revenues to co-opt or repress popular dissent and undermine moves toward democracy.Footnote 52 In sum, even with differences between the political and economic elite, there is little reason to anticipate property rights improvements if the assets of the economic elite are protected by their mobility.
The theory relied on several assumptions that warrant more exploration. First, it assumed that asset mobility is fixed (this is a common starting point in the literature).Footnote 53 In fact, firms can choose to invest in making their assets more mobile, in increasing their political influence, or in improving property rights. All three strategies are consistent with concern about costly government policies. In addition, governments have an incentive to increase mobility when it helps them meet political objectives.Footnote 54 The precise relationships between these strategies warrants more attention in future work.
Second, the theory assumed that violations of property rights affect the operations of firms. As discussed earlier, this assumption is consequential. If expropriation comes purely from profits, it does not affect market share and all firms benefit, albeit to different degrees, from property rights. Considering how best to model expropriation warrants more attention in future work. Early steps included distinguishing between taxation of profits and expropriation of assetsFootnote 55 and between expropriation from centralized or local authorities.Footnote 56 Understanding how different types of expropriation affect firm profits and behavior could help us better understand when firms call for property rights improvements and which firms are likely to make these calls.
Acknowledgments
I am thankful to Timm Betz for his support in every step of this project, including sharing theoretical insights and sharing the Orbis Historical data, which greatly improved this manuscript. I am also thankful to Hannah Löffler, Lucia Motolinia, Nancy Ramos, Guillermo Rosas, and Alma Velazquez for their help with the online survey and to Sarah Brooks, Julia Gray, Nathalie Mendez Mendez, Jacob Montgomery, Renard Sexton, and Michelle Taylor-Robinson for their assistance during the IRB process. I further appreciate the careful comments of everyone who engaged with this work, including Lucy Barnes, Bill Clark, Sarah Bauerle Danzman, Anthony Calacino, Simone Dietrich, Jeffry Frieden, Ana Carolina Garriga, Zoe Ge, Bobby Gulotty, Soo Yeon Kim, Johannes Lindvall, Zhaotian Luo, Helen Milner, Layna Mosley, Mark Nance, Marina Nistotskaya, Irfan Nooruddin, Erica Owen, Mikael Persson, Paul Poast, Dennis Quinn, Nita Rudra, Ron Rogowski, Arthur Silve, Joel Simmons, Florence So, Vera Troeger, Erik Voeten, and seminar participants at the International Relations Faculty Colloquium at Princeton University, the Workshop on International Politics at the University of Chicago, the General Research Seminar Series at the University of Gothenburg, and the Political Science Seminar Series at the University of Hamburg.
Data Availability Statement
Replication files for this research note may be found at <https://doi.org/10.7910/DVN/GMJTHI>.
Supplementary Material
Supplementary material for this research note is available at <https://doi.org/10.1017/S0020818326101325>.


 Open access

