







1. Introduction
In recent decades, the wake dynamics behind bluff bodies has captured the interest of fluid dynamicists. This growing attention is due to the enhanced availability of computational resources and advanced experimental techniques, which enable a deeper understanding of the two-dimensional (2-D) and three-dimensional (3-D) wake transition flow behind a bluff body. Numerous studies have emerged in the literature examining wake transitions in the flow around canonical bluff bodies, with significant emphasis on the wake dynamics behind an unheated cylinder. However, investigating the wake dynamics behind a heated bluff body is crucial for various industrial and engineering applications, including electronic cooling, combustion chambers and compact heat exchangers (Zebib & Wo Reference Zebib and Wo1989; Yang & Fu Reference Yang and Fu2001; Patel, Sarkar & Saha Reference Patel, Sarkar and Saha2018).
In the study of wake transition flow, the surface of a cylinder can be uniformly heated, resulting in two distinct flow regimes: the small-scale heating regime (where  $\beta \Delta T \ll 1$, with $\beta$ representing the thermal expansion coefficient, typically denoted as $\beta =1/T_\infty$ for air, and $\Delta T$ representing the temperature difference between the cylinder surface and the free stream) and the large-scale heating regime, where $\beta \Delta T$ approaches the order of unity. In previous research on both heating regimes, the majority of studies on forced and mixed convection have concentrated on 2-D transitional flow in the wake of a heated bluff body, such as a circular or square cylinder, at low Reynolds numbers ( $Re=U_\infty D/\nu _\infty$). Here, $U_\infty$ and $\nu _\infty$ represent the free stream velocity and free stream kinematic viscosity, respectively, while $D$ is the side length of the square cylinder or the diameter in the case of a circular cylinder. In 2-D transition flow studies, the small-scale heating regime yielded precise outcomes through an incompressible model employing the Boussinesq approximation (Dennis, Hudson & Smith Reference Dennis, Hudson and Smith1968; Lee & Richardson Reference Lee and Richardson1974; Lecordier, Hamma & Paranthoen Reference Lecordier, Hamma and Paranthoen1991; Dumouchel, Lecordier & Paranthoën Reference Dumouchel, Lecordier and Paranthoën1998; Kieft et al. Reference Kieft, Rindt, van Steenhoven and van Heijst2003; van Steenhoven & Rindt Reference van Steenhoven and Rindt2003; Sahu, Chhabra & Eswaran Reference Sahu, Chhabra and Eswaran2009; Hasan & Ali Reference Hasan and Ali2013; Ali et al. Reference Ali, Arif, Haider and Shamim2024; Kumar, Murali & Sethuraman Reference Kumar, Murali and Sethuraman2024), where density changes are significant only under the influence of a body force. Conversely, in the large-scale heating scenario, where significant variations occur in thermophysical and transport properties alongside thermal straining in fluid particles, a non-Oberbeck–Boussinesq (NOB) model is employed, utilizing compressible flow equations (Collis & Williams Reference Collis and Williams1959; Wang, Trávníček & Chia Reference Wang, Trávníček and Chia2000; Darbandi & Hosseinizadeh Reference Darbandi and Hosseinizadeh2006; Hasan & Saeed Reference Hasan and Saeed2017; Arif & Hasan Reference Arif and Hasan2019, Reference Arif and Hasan2020, Reference Arif and Hasan2021). For 3-D transition flow in mixed convection in the presence of aiding and cross-buoyancy (the focus of the present study), there is limited literature available.
In the presence of aiding buoyancy (where free stream cross-flow is aligned opposite to gravity), Noto, Ishida & Matsumoto (Reference Noto, Ishida and Matsumoto1984) and Badr (Reference Badr1984) experimentally studied the effects of heating on the vortex dynamics in the wake of a heated circular cylinder, using air as the working fluid. These studies clarified that the shedding frequency, i.e. Strouhal number, increases on increasing the value of the Richardson number, i.e.  $Ri=g\beta \Delta T D/U_\infty ^2$, where $g$ represents gravity. Above a critical Richardson number, the vortex shedding is suppressed, with twin attached vortices with the cylinder, and the Strouhal number becomes zero. These twin vortices disappear and turn into thermal plumes as the Richardson number increases further. Furthermore, in the experimental study of Noto & Matsushita (Reference Noto and Matsushita2001) and Noto & Fujimoto (Reference Noto and Fujimoto2001), the vortex dynamics above a triangular cylinder and a circular cylinder at $Re\simeq 10^3$ are compared and it is observed that the vortex dislocation above a circular cylinder wake is remarkable. The effects of aiding buoyancy are further investigated numerically at $Re=300$ and $Ri=0.3$ (Noto & Fujimoto Reference Noto and Fujimoto2006, Reference Noto and Fujimoto2007). These studies discussed vortex dislocations in a heated wake above a circular cylinder and compared the computed results with those of an isothermal wake. In conclusion, all research on 3-D transitional flows in the presence of aiding buoyancy has observed the heating effect on vortex shedding, vortex dislocations and the three-dimensionality near the cylinder wake. However, these investigations did not report the shape and wavelength of the 3-D instability modes.
In the case of cross-buoyancy flow where the free stream is perpendicular to gravity, the 3-D transition flow around a heated circular cylinder immersed in water (Prandtl number  $Pr=7$) has been studied experimentally and numerically (Ren, Rindt & van Steenhoven Reference Ren, Rindt and van Steenhoven2006a,Reference Ren, Rindt and van Steenhovenb, Reference Ren, Rindt and van Steenhoven2007). In these studies, it has been shown that the onset of three-dimensionality occurs at a lower $Re$ than for the unheated case. In the near-wake of the cylinder, their investigation observes a difference in the strength of the upper and lower vortices with an increase in Richardson number and finds that the discrepancy in strength of these vortices is due to the production of baroclinic vorticity. Moreover, the Mode-E instability with spanwise wavelength $\lambda _z/D=2$ is observed for the Reynolds number range $75\leqslant Re\leqslant 117$ and the Richardson number range $0.35\leqslant Ri\leqslant 2.5$. In addition, $\varLambda$-shaped structures have been observed in the near-wake and mushroom-type structures in the far-wake. The effect of cross-buoyancy on the 3-D flow transition around a square cylinder in mixed convection is further studied numerically by Mahir & Altaç (Reference Mahir and Altaç2019) for $Re=55\unicode{x2013}250$ and $Ri=0\unicode{x2013}2$. In order to examine the wake dynamics and flow characteristics, this study uses air ( $Pr=0.7$) and water ( $Pr=7$) as the working fluid. In this study, it is shown that the velocity and mass flow rate of the fluid particles at the bottom of the cylinder rise as buoyancy increases. Further, Kumar & Lal (Reference Kumar and Lal2020) examined the influence of the Prandtl number on 3-D coherent structures and observed Mode-E instability in the wake of a heated cylinder, for the parameter ranges $75\leqslant Re\leqslant 150$, $0.5\leqslant Ri\leqslant 2$ and $0.25 \leqslant Pr \leqslant 10$. Recently, the 3-D transition flow around a square cylinder (exposed to air) near a moving wall was studied numerically (Tanweer, Dewan & Sanghi Reference Tanweer, Dewan and Sanghi2020, Reference Tanweer, Dewan and Sanghi2021). These studies report several 3-D instability modes that correspond to various Richardson numbers and gap ratios (between the cylinder and the moving wall). Additionally, global flow parameters such as the force coefficient, the Strouhal number and the Nusselt number are investigated in these investigations. In summary, these investigations primarily centred on wake structures and the overall flow characteristics within the small-scale heating regime, employing the incompressible solver with the Boussinesq approximation.
For flow past an unheated cylinder, a sequence of 3-D transition regimes has been reported using experimental, direct numerical simulation (DNS) and Floquet approaches. These transition regimes are associated with a range of free stream Reynolds numbers. The shape and spanwise wavelength of the vortical structure in the bluff-body wake serve to identify the 3-D instability modes. In the case of an isolated square cylinder, three distinct 3-D instability modes have been observed. The first instability mode, i.e. Mode-A, a tongue-shaped streamwise vortical structure with longer wavelength ( $\lambda _z/D \simeq 5\unicode{x2013}5.8$), is observed at Reynolds number between 150 and 200 (Robichaux, Balachandar & Vanka Reference Robichaux, Balachandar and Vanka1999; Sohankar, Norberg & Davidson Reference Sohankar, Norberg and Davidson1999; Luo, Chew & Ng Reference Luo, Chew and Ng2003; Sheard, Fitzgerald & Ryan Reference Sheard, Fitzgerald and Ryan2009; Choi, Jang & Yang Reference Choi, Jang and Yang2012; Agbaglah & Mavriplis Reference Agbaglah and Mavriplis2017; Jiang, Cheng & An Reference Jiang, Cheng and An2018). For $Re=200\unicode{x2013}250$, a second instability mode (denoted as Mode-B) that generates a rib-like streamwise vortical structure with shorter wavelengths ( $\lambda _z/D \simeq 1.2\unicode{x2013}1.5$) is detected (Robichaux et al. Reference Robichaux, Balachandar and Vanka1999; Luo, Tong & Khoo Reference Luo, Tong and Khoo2007; Sheard et al. Reference Sheard, Fitzgerald and Ryan2009; Choi et al. Reference Choi, Jang and Yang2012; Agbaglah & Mavriplis Reference Agbaglah and Mavriplis2017; Jiang & Cheng Reference Jiang and Cheng2018; Jiang et al. Reference Jiang, Cheng and An2018). A third instability mode (denoted as Mode-QP) with an intermediate wavelength ( $\lambda _z/D \simeq 2.6\unicode{x2013}2.8$) has been observed using the Floquet method in the Reynolds number range $200\leqslant Re\leqslant 219$ (Robichaux et al. Reference Robichaux, Balachandar and Vanka1999; Sheard et al. Reference Sheard, Fitzgerald and Ryan2009).
Based on the above discussion, it can be concluded that most research involving 3-D wake transition focused on the flow past an unheated cylinder. In the mixed convective flow regime, the 3-D flow transitions around a heated cylinder have mostly been studied in the small-scale heating regime using the Boussinesq approximation. In the context of large-scale heating influenced by cross-buoyancy, which is the focus of present study, the investigation of 3-D transitional flow has been mostly overlooked. The exception is a recent numerical study by Ali, Hasan & Sanghi (Reference Ali, Hasan and Sanghi2023), where a non-Boussinesq compressible model at low Mach number ( $M=0.1$) was utilized. This study mainly investigated different instability modes at various heating levels, with a Reynolds number of 250. So far, in previous research, the impact of thermophysical and transport properties on 3-D wake transition flow remains unexplored. Additionally, in the large-scale heating regime, the influence of cross-buoyancy on the strength of vortex shedding and three-dimensionality has not been thoroughly investigated.
In the present numerical study, we aim to explore the 3-D flow transition around a heated square cylinder immersed in air with cross-buoyancy in a large-scale heating regime. The scenario and mechanism of wake transitions at  $Re=180$ (which corresponds to Mode-A instability for the unheated case) as the heating levels increase will be presented and analysed. The influence of baroclinic vorticity production on the wake dynamics behind the heated cylinder will be investigated. Additionally, the flow behaviour and its correlation with variations in thermophysical and transport properties around a heated square cylinder will be highlighted.
2. Numerical model
For small-scale heating, accurate results can be obtained by employing the Boussinesq approximation, where density variations are only significant with body forces. However, in the large-scale heating scenario, there are significant effects of molecular transport property variations and thermal straining in fluid particles (Hasan & Saeed Reference Hasan and Saeed2017; Arif & Hasan Reference Arif and Hasan2019, Reference Arif and Hasan2021). To capture these variations, an in-house solver based on the NOB model has been developed. This NOB model employs the governing equations for a compressible gas flow.
2.1. Governing equations
The non-dimensional governing equations for compressible gas flow, expressed in a strong-conservative form in 3-D Cartesian coordinates, are given as
 \begin{equation} \frac{\partial \boldsymbol{U}}{\partial t}+ \frac{\partial \boldsymbol{F}}{\partial x}+ \frac{\partial \boldsymbol{G}}{\partial y}+ \frac{\partial \boldsymbol{H}}{\partial z}=\boldsymbol{J} , \end{equation}
where  ${\boldsymbol {U}}$ is a solution vector, ${\boldsymbol {F}}$, ${\boldsymbol {G}}$ and ${\boldsymbol {H}}$ are the flux vectors, and ${\boldsymbol {J}}$ is the source vector. These vectors are expressed as
 \begin{gather} \boldsymbol{U}=\begin{bmatrix} \rho\\ \rho u\\ \rho v\\ \rho w\\ \rho E \end{bmatrix}, \end{gather}
 \begin{gather} \boldsymbol{F}=\begin{bmatrix} \rho u\\ \rho u u+p-\dfrac{2\mu}{Re}\left\{\dfrac{\partial u}{\partial x}-\dfrac{1}{3}(\boldsymbol{\nabla}\boldsymbol{\cdot}\boldsymbol{V})\right\}\\[10pt] \rho u v-\dfrac{\mu}{Re}\left(\dfrac{\partial v}{\partial x}+\dfrac{\partial u}{\partial y}\right)\\[10pt] \rho u w-\dfrac{\mu}{Re}\left(\dfrac{\partial u}{\partial z}+\dfrac{\partial w}{\partial x}\right)\\[10pt] \rho u E-\dfrac{\gamma \kappa}{Re Pr}\dfrac{\partial T}{\partial x}+\gamma(\gamma-1){M}^2 p u + \dfrac{\gamma(\gamma-1){M}^2\mu}{Re}D_F \end{bmatrix}, \end{gather}
 \begin{gather} \boldsymbol{G}=\begin{bmatrix} \rho v\\ \rho v u-\dfrac{\mu}{Re}\left(\dfrac{\partial v}{\partial x}+\dfrac{\partial u}{\partial y}\right)\\[10pt] \rho v v+p-\dfrac{2\mu}{Re}\left\{\dfrac{\partial v}{\partial y}-\dfrac{1}{3}(\boldsymbol{\nabla}\boldsymbol{\cdot}\boldsymbol{V})\right\}\\[10pt] \rho v w-\dfrac{\mu}{Re}\left(\dfrac{\partial v}{\partial z}+\dfrac{\partial w}{\partial y}\right)\\[10pt] \rho v E-\dfrac{\gamma \kappa}{Re Pr}\dfrac{\partial T}{\partial y}+\gamma(\gamma-1){M}^2 p v + \dfrac{\gamma(\gamma-1){M}^2\mu}{Re}D_G \end{bmatrix}, \end{gather}
 \begin{gather} \boldsymbol{H}=\begin{bmatrix} \rho w\\ \rho w u-\dfrac{\mu}{Re}\left(\dfrac{\partial w}{\partial x}+\dfrac{\partial u}{\partial z}\right)\\[10pt] \rho w v-\dfrac{\mu}{Re}\left(\dfrac{\partial w}{\partial y}+\dfrac{\partial v}{\partial z}\right)\\[10pt] \rho w w+p-\dfrac{2\mu}{Re}\left\{\dfrac{\partial w}{\partial z}-\dfrac{1}{3}(\boldsymbol{\nabla}\boldsymbol{\cdot}\boldsymbol{V})\right\}\\[10pt] \rho w E-\dfrac{\gamma \kappa}{Re Pr}\dfrac{\partial T}{\partial z}+\gamma(\gamma-1){M}^2 p w +\dfrac{\gamma(\gamma-1){M}^2\mu} {Re}D_H \end{bmatrix}, \end{gather}
 \begin{gather} \boldsymbol{J}=\begin{bmatrix} 0\\ 0\\ (1-\rho)/{Fr}^2\\ 0\\ \gamma(\gamma-1)(1-\rho)\left(\dfrac{M}{Fr}\right)^2 v-(\gamma-1)(\boldsymbol{\nabla}\boldsymbol{\cdot}\boldsymbol{V}) \end{bmatrix}. \end{gather}
 The quantities  $D_F$, $D_G$ and $D_H$, corresponding to the energy components of the flux vectors $\boldsymbol {F}$, $\boldsymbol {G}$ and $\boldsymbol {H}$ are, respectively,
 \begin{gather} D_F=\left[\frac{2}{3}u\left({-}2\frac{\partial u}{\partial x}+\frac{\partial v}{\partial y}+\frac{\partial w}{\partial z}\right)-v\left(\frac{\partial v}{\partial x}+\frac{\partial u}{\partial y}\right)-w\left(\frac{\partial w}{\partial x}+\frac{\partial u}{\partial z}\right)\right], \end{gather}
 \begin{gather}D_G=\left[\frac{2}{3}v\left(\frac{\partial u}{\partial x}-2\frac{\partial v}{\partial y}+\frac{\partial w}{\partial z}\right)-u\left(\frac{\partial v}{\partial x}+\frac{\partial u}{\partial y}\right)-w\left(\frac{\partial w}{\partial y}+\frac{\partial v}{\partial z}\right)\right], \end{gather}
 \begin{gather}D_H=\left[\frac{2}{3}w\left(\frac{\partial u}{\partial x}+\frac{\partial v}{\partial y}-2\frac{\partial w}{\partial z}\right)-u\left(\frac{\partial w}{\partial x}+\frac{\partial u}{\partial z}\right)-v\left(\frac{\partial w}{\partial y}+\frac{\partial v}{\partial z}\right)\right]. \end{gather}
In the above equations, all variables are expressed in a dimensionless form, which are non-dimensionalized by their respective free stream values. Here  $x$,
$x$,  $y$,
$y$,  $z$ are the dimensionless Cartesian coordinates, and $t$ is the non-dimensional time. The components of the dimensionless fluid velocity vector $\boldsymbol {V}$ are represented by $u$,
$u$,  $v$ and $w$ along the $x$,
$x$,  $y$, and $z$ directions, respectively. The symbols ${\rho }$, $T$,
$T$,  $p$,
$p$,  $\mu$, $\kappa$ and $E$ are representing the density, temperature, thermodynamic pressure, dynamic viscosity, thermal conductivity and total specific energy in non-dimensional form. The various scales employed for non-dimensionalization of the governing equations are $\rho _\infty$, $T_\infty$, $\rho _\infty U_\infty ^2$, $\mu _\infty$, $\kappa _\infty$ and ${C_v}_\infty T_\infty$ for density, temperature, gauge pressure ( $p-p_\infty$), dynamic viscosity, thermal conductivity and total specific energy, respectively. The Cartesian coordinates are non-dimensionalized using the cylinder side length ( $D$). The free stream conditions are indicated by the subscript ‘ $\infty$’.
In the NOB model, the conversion of the governing equations from dimensional to non-dimensional form gives dimensionless parameters such as Reynolds number  $Re=\rho _\infty U_\infty D/{\mu _\infty }$, Mach number $M=U_\infty /a_\infty$ (where $a_\infty$ is the free stream sound speed), Prandtl number $Pr=\mu _\infty {C_p}_\infty /\kappa _\infty$ and Froude number $Fr=U_\infty /\sqrt {gD}$.
To close the above governing equations, the thermodynamic state relations expressed in the non-dimensional form are
 \begin{gather} \rho=\frac{1+\gamma M^{2}p}{T}, \end{gather}
 \begin{gather}E=e+\frac{\gamma(\gamma-1)}{2}{M}^2(u^2+v^2+w^2). \end{gather}
The quantity  $e=\int _{1}^{T}C_v(T)\,{\rm d}T+e_{\infty }$ is the dimensionless specific internal energy where $C_v$ represents dimensionless constant volume-specific heat, and the value of $e_{\infty }$ (which serves as a datum) is taken as unity. The specific heat ratio $\gamma$ is taken as 1.4.
A low Mach number ( $M=0.1$) is used to minimize pressure compressibility effects, and the Froude number is fixed at $Fr=1.0$. The molecular transport properties (such as $\mu$, $\kappa$ and $C_v$) vary only with temperature, assuming air to be a thermally perfect gas. Sutherland's law is used to compute the molecular viscosity, and it is stated in the dimensionless form as
 \begin{equation} \mu=T^{3/2}\left(\frac{1+\sigma}{T+\sigma}\right). \end{equation}
Here,  $\sigma =S/T_\infty$, where $S=110\ {\rm K}$ is Sutherland's constant, and $T_{\infty }=300\ {\rm K}$ is the free stream reference temperature. The dimensionless equations of state for thermal conductivity, specific heat and specific internal energy are given as
 \begin{gather} \kappa=A+BT+CT^2, \end{gather}
 \begin{gather}C_v = 1 + C_1(T-1) + C_2(T-1)^2 + C_3(T-1)^3 , \end{gather}
 \begin{gather}e=T+\frac{C_1}{2}(T-1)^2+\frac{C_2}{3}(T-1)^3+\frac{C_3}{4}(T-1)^4, \end{gather}
where  $A=2.811\times 10^{-2}$, $B=1.074$, $C=-9.918\times 10^{-2}$, $C_1=1.201\times 10^{-2}, C_2=6.528\times 10^{-2}$, $C_3= -1.576\times 10^{-2}$ are the constants based on property data on taking $T_\infty$ as a reference (Ghoshdastidar Reference Ghoshdastidar2012; Hasan & Saeed Reference Hasan and Saeed2017; Arif & Hasan Reference Arif and Hasan2019). Equation (2.15) is also used to generate ( $T,e$) data over a wide range $1\leqslant T\leqslant 3$ in order to develop the inverse relation for (2.15) given as
 \begin{equation} T=1+B_{1}(e-1)+B_{2}(e-1)^2+B_{3}(e-1)^3+B_{4}(e-1)^4+B_{5}(e-1)^5, \end{equation}
where  $B_{1}=1.0$, $B_{2}=5.479\times 10^{-3}$, $B_{3}=2.336\times 10^{-2}$, $B_{4}=7.122\times 10^{-3}$ and $B_{5}=6.897\times 10^{-4}$ are the constants. This inverse relation is utilized to obtain temperature from the knowledge of $e$ obtained via the energy equation.
In the present computations, the governing equations for compressible flow in the Cartesian coordinate system, given in (2.1), are transformed to the body-fitted coordinate system (Appendix A) and solved using a variant of the PVU-M $+$ (particle-velocity upwind) scheme (Appendix B). The PVU-M $+$ scheme (Hasan, Khan & Shameem Reference Hasan, Khan and Shameem2015) has been shown to be a robust, accurate and efficient flux-based scheme for Euler/Navier–Stokes equations over a wide range of Mach numbers ( $M=0.1\unicode{x2013}10$).
2.2. Computational domain and grid generation
Figure 1(a) shows an infinite-span square cylinder with a truncated spanwise periodic domain having length ‘ $H_z$’ heated to a uniform temperature $T_w$ and exposed to a uniform horizontal free stream in cross-flow. The flow field is described in a Cartesian coordinate system. The $x$,
$x$,  $y$ and $z$ coordinates are aligned in streamwise, transverse and spanwise directions, respectively. The square cylinder is surrounded by a cylindrical surface, whose axes is coincident with the axis of the square cylinder. The cylindrical surface radius is fixed at $R_d=60D$ using a domain size independence test (Appendix C) to minimize computing expense and yet produce accurate results.
(a) A square cylinder subjected to horizontal free stream cross-flow, and (b) a magnified view of the grid near the cylinder in the  $x\unicode{x2013}y$ plane.

The value of spanwise length is decided on the basis of previous numerical studies reported by Sohankar et al. (Reference Sohankar, Norberg and Davidson1999), Saha, Biswas & Muralidhar (Reference Saha, Biswas and Muralidhar2003) and Agbaglah & Mavriplis (Reference Agbaglah and Mavriplis2017). In these studies, it has been shown that  $H_z=6D$ is appropriate for capturing the largest wavelength of the 3-D instability modes. Thus, $H_z=6D$ is employed in the current simulation to lower the computational cost and capture all spanwise wavelengths of 3-D instability modes with various heating levels. As the spanwise length extends infinitely, the 3-D modes can be effectively captured by confining the spanwise domain using a periodic boundary condition.
The present computations are carried out on an O-type body-fitted grid in the  $x\unicode{x2013}y$ plane that is extruded in the $z$-direction (spanwise direction). In order to generate a 3-D grid, an initial O-type, 2-D, body-fitted grid is created in the $x\unicode{x2013}y$ plane. Then, this 2-D grid is uniformly replicated for a spanwise length $H_z=6D$ in the $z$-direction. The methods for constructing an O-type grid are described in Thompson, Warsi & Mastin (Reference Thompson, Warsi and Mastin1985). A suitable grid size having 281, 355 and 61 grid points in the $\xi$, $\eta$ and $z$ directions, respectively, is chosen using a grid independence test (Appendix C) in order to get accurate and trustworthy data. A magnified view of a 2-D grid near a square cylinder with a minimum dimensionless spacing of $1.7\times 10^{-3}$ is shown in figure 1(b). For this grid size, a time step of $\Delta t=10^{-4}$ is employed for the simulation of flow around an unheated cylinder, while a time step of $\Delta t=5\times 10^{-5}$ is utilized for the simulation of flow around the heated cylinder.
2.3. Initial and boundary conditions
In the present computations, the undisturbed free stream conditions that exist at an infinitely large distance from the cylinder are employed in the entire flow field as initial conditions. These initial conditions expressed in non-dimensional form are  $\boldsymbol {V}=1\hat {i}+0\hat {j}+0\hat {k}$, $T=1$, $\rho =1$, $p=0$.
At the surface of the cylinder, no-slip and no-penetration conditions are specified for the velocity. The surface of the cylinder is uniformly heated to an elevated temperature  $T_w$. The normal momentum equation is used to determine the pressure, and the density is obtained via the equation of state.
At the inflow and outflow region along the local normal direction of the artificial boundary, the characteristic numerical boundary conditions based on wave speed have been employed (Hirsch Reference Hirsch2007). In the family of waves, two acoustic waves are employed to determine the two non-dimensional Riemann invariants  $R^\pm _N=V_N\pm {2\sqrt {T}}/{M(\gamma -1)}$, while one shear wave regulates local tangential velocity ( $V_T$) and spanwise velocity ( $w$), and one entropy wave governs pressure, as listed in table 1. When waves enter the flow domain, the associated characteristic variables are set to the free stream conditions, while for waves exiting the flow domain, these variables are extrapolated from the interior (table 1). The use of Riemann invariants is consistent with the local one-dimensional inviscid approximation at the artificial boundary (Hirsch Reference Hirsch2007).
Boundary conditions for the various types of waves at inflow and outflow.

The Riemann invariants at any boundary point are based on the normal acoustic wave speeds  $V_N\pm c$ which determine the entering/leaving acoustic family of waves as shown in table 1. Here $V_N$ and $c$ represent the local normal velocity component and the local sound speed, respectively, in non-dimensional form. In table 1, the subscript ‘ $i$’ is for the interpolated value from interior data. Once the Riemann invariants are fixed at the boundary points, the values of the local normal velocity component and temperature are determined as
 \begin{gather} V_N =\frac{R^+_N+R^-_N}{2}, \end{gather}
 \begin{gather}T =\frac{M^2(R^+_N-R^-_N)^2}{4(\gamma-1)^2}. \end{gather}
At the artificial boundary in a given spanwise plane, the tangential velocities  $w$ and $V_T$ are set to the free stream value at the inflow and interpolated from the interior at the outflow. Once the values of $V_N$ and $V_T$ are determined, they are used to calculate the Cartesian components ( $u,v$) in a specific spanwise $x\unicode{x2013}y$ plane.
At the inflow, pressure is set equal to the free stream value, temperature is calculated via (2.18) and density is determined through the equation of state. While at the outflow, as for pressure, the linearized characteristics boundary condition, as given by Bayliss & Turkel (Reference Bayliss and Turkel1982), is employed and expressed as
 \begin{equation} \frac{\partial p}{\partial t}-\left(\frac{1}{M}\right)\frac{\partial V_N}{\partial t}=0. \end{equation}
For the temperature at the outflow, it is calculated using interior values, and the density is determined using the equation of state based on the calculated values of pressure and temperature.
In the present computational study, the 2-D  $von\ K\acute {a}rm\acute {a}n$ instability leading to vortex shedding originates naturally without imposing any external perturbation in the flow. This instability occurs due to small perturbations introduced in the flow via truncation and round-off errors. However, these errors lack sufficient strength to induce 3-D instabilities in the wake of the cylinder. Therefore, a spanwise random perturbation with an order of $10^{-7}$ is added to the density at the initial condition in the near wake of the cylinder for triggering 3-D instabilities. In the study conducted by Agbaglah & Mavriplis (Reference Agbaglah and Mavriplis2017), a similar order of perturbation ( $10^{-7}$) was also used to observe three-dimensionality in the cylinder wake.
3. Model validation
3.1. The  $St$–$Re$ and $\bar {C}_D$–$Re$ characteristics


The in-house NOB compressible model solver is validated with the reported data for the problem of cross-flow of an approaching uniform stream of air past an unheated infinite-span square cylinder. In figure 2, the values from present computations of the Strouhal number ( $St$) and the time-averaged-drag coefficient ( $\bar {C}_D$) at $\varepsilon =0.0$ have been compared with the reported values from previous studies obtained using experimental, DNS and the Floquet methods for Reynolds numbers ranging from 50 to 300. The present numerical values of $St$ and $\bar {C}_D$ at $\varepsilon =0.0$ are obtained using data from fully developed flow between $t=1000$ and $t=3000$. The lift coefficient ( $C_L$) values are used to compute the dominant frequency or the $St$ value shown in figure 2(a). In the $St$–
$St$– $Re$ plot, the $St$ values of the 2-D time-periodic flow increases smoothly with $Re$ and agrees well with the values reported by Sheard et al. (Reference Sheard, Fitzgerald and Ryan2009) and Jiang et al. (Reference Jiang, Cheng and An2018) (figure 2a). Similarly, in the $\bar {C}_D$– $Re$ plot, the 2-D flow values of $\bar {C}_D$ obtained in the present computation at various $Re$ agree well with the numerical values reported by Sohankar et al. (Reference Sohankar, Norberg and Davidson1999) and Jiang & Cheng (Reference Jiang and Cheng2018) (figure 2b).
The present values of 2-D and 3-D wake transitions at  $\varepsilon =0.0$ and $M=0.1$ compared with the reported values obtained using various methodologies showing in the plots of (a) $St$–
$St$– $Re$ and (b) $\bar {C}_D$– $Re$.
$Re$.

In the case of 3-D transition flow ( $Re>Re_{cr}$), the present computed values deviate slightly from other reported values. Figure 2(a) shows that the present $St$ values are close (around 4 % deviation) to the values obtained by DNS study of Jiang et al. (Reference Jiang, Cheng and An2018). Similarly, the present $\bar {C}_D$ values agree well (with less than 3 % deviation) to the numerical values reported by Jiang & Cheng (Reference Jiang and Cheng2018) as shown in figure 2(b). It can be seen from both the plots that the present DNS results are comparable to the DNS results that were reported in the previous studies. As far as deviations are concerned, it is worth mentioning that previous DNS studies on the unheated square cylinder utilized the incompressible flow model, whereas the present computations involve a compressible flow model with low but finite Mach number effects. This fact, in addition to differences in numerical methodologies, accounts for the slight deviations observed in the results between the current computations and those found in the existing literature. The values of $St$ and $\bar {C}_D$ obtained by the experimental and Floquet methods deviate more from the present DNS values. This is due to the fact that in Floquet studies, three-dimensionality in the flow is achieved using a 2-D base flow solver with 3-D perturbations, whereas in comparing with the experimental studies, the greater deviations observed can be attributed to the finite cylinder end-conditions.
The sudden drop in the values of  $St$ and $\bar {C}_D$ (as shown in figure 2a,b) indicates the presence of large-scale vortex dislocations in the flow field. These dislocations account for the large intermittent velocity irregularities that Roshko (Reference Roshko1954) and Bloor (Reference Bloor1964) first identified to define the transition. Williamson (Reference Williamson1992) later noted that the development of vortex dislocations in the flow is caused by primary von Kàrmàn vortices that are out of phase with one another in the near wake and later descend into large-scale structures. The discontinuity is not observed in the $St$–
$St$– $Re$ and $\bar {C}_D$– $Re$ plots in the data reported by the experimental and DNS studies of Okajima (Reference Okajima1982) and Sohankar et al. (Reference Sohankar, Norberg and Davidson1999), respectively, due to the fact that their analysis utilized larger steps in $Re$ values. In the present study, the onset of three-dimensionality is triggered at a critical Reynolds number ( $Re_{cr}$) of 173, a value in close agreement with those reported in previous investigations using different techniques (figure 2).
3.2. Tongue-shaped and rib-like vortical structure
In the wake of the cylinder, various shapes of vortical structures involving streamwise vorticity ( $\varOmega _x$), transverse vorticity ( $\varOmega _y$) and spanwise vorticity ( $\varOmega _z$) are observed. These vorticities are defined as follows:
 \begin{equation} \left. \begin{array}{l}
\displaystyle \varOmega_x=\dfrac{\partial w}{\partial
y}-\dfrac{\partial v}{\partial z}\\ \displaystyle
\varOmega_y=\dfrac{\partial u}{\partial z}-\dfrac{\partial
w}{\partial x}\\ \displaystyle \varOmega_z=\dfrac{\partial
v}{\partial x}-\dfrac{\partial u}{\partial y} \end{array} \right\} .
\end{equation}
\begin{equation} \left. \begin{array}{l}
\displaystyle \varOmega_x=\dfrac{\partial w}{\partial
y}-\dfrac{\partial v}{\partial z}\\ \displaystyle
\varOmega_y=\dfrac{\partial u}{\partial z}-\dfrac{\partial
w}{\partial x}\\ \displaystyle \varOmega_z=\dfrac{\partial
v}{\partial x}-\dfrac{\partial u}{\partial y} \end{array} \right\} .
\end{equation}
The shape of the vortical structure and their spanwise wavelength in the wake of a square cylinder characterize the 3-D modes A and B. The tongue-shaped vortical structure in the cylinder wake with a large spanwise wavelength of streamwise vorticity shows the Mode-A instability at  $Re=180$ and $\varepsilon =0.0$ (figure 3a). While, at $Re=250$ and $\varepsilon =0$, the rib-like vortical structure with a small wavelength indicates the Mode-B instability (figure 3b). In figure 3(a), the tongue-shaped vortical structure of the regular Mode-A pattern becomes visible at $t=400$ when three-dimensionality initiates in the flow. For longer time integration, this regular pattern of Mode-A instability is disrupted by the presence of large-scale vortex dislocations in the flow field (see the vortical structure at $\varepsilon =0.0$ in figure 4a). At $Re=250$ in the Mode-B instability, the change in the wake pattern with time integration is negligible as the dislocation appears with a smaller scale. In the present DNS investigation, the spanwise wavelength is determined based on the vortex pair of $\varOmega _x$ in the wake of the cylinder. The existing wavelengths of the Mode-A and Mode-B wake instabilities in a fully developed flow are quite near to all previously published values as listed in table 2. Furthermore, the current numerical value of $Re_{cr}$ closely aligns with the reported values obtained using DNS and Floquet approaches (as listed in table 2).
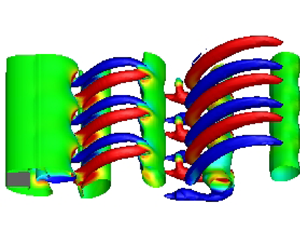
Isocontours of  $\varOmega _x$ in the isothermal wake of a square cylinder at $\varepsilon =0.0$ and $M=0.1$, showing (a) the tongue-shaped vortical structure with longer wavelength of Mode-A instability at $t=400$ for $Re=180$, $\varOmega _x=\pm 0.05$ and (b) the rib-like vortical structure with shorter wavelength of the Mode-B instability at $t=300$ for $Re=250$, $\varOmega _x=\pm 0.3$. The blue and light-yellow colours represent positive and negative vortices, respectively.

The vortical structure ( $Q$-criterion) in a square cylinder wake coloured by $\varOmega _x$ at $Re=180$ and $t=1300$ for (a) $\varepsilon =0.0$, (b) $\varepsilon =0.2$, (c) $\varepsilon =0.4$, (d) $\varepsilon =0.6$, (e) $\varepsilon =0.8$ and (f) $\varepsilon =1.0$.

Comparison of the present numerical values of  $Re_{cr}$ and $\lambda _z/D$ (for Mode-A and Mode-B) at $\varepsilon =0.0$ with the values reported in previous studies for flow past an unheated square cylinder.

4. Numerical results
4.1. Wake bifurcation to Mode-E instability
In the presence of a buoyant force, the wake dynamics of 3-D flow transitions is a phenomenon of great interest to fluid dynamicists. The  $Q$-criterion visualises the vortex formations, which adds to the understanding of wake dynamics. The following expression gives the $Q$ values:
 \begin{equation} Q=\tfrac{1}{2}(||\boldsymbol{\varOmega}||^2-||\boldsymbol{S}||^2), \end{equation}
where  $\boldsymbol {\varOmega }=\frac {1}{2}(\boldsymbol {\nabla }\boldsymbol {u}-\boldsymbol {\nabla }\boldsymbol {u}^\textrm {T})$ and $\boldsymbol {S}=\frac {1}{2}(\boldsymbol {\nabla }\boldsymbol {u}+\boldsymbol {\nabla }\boldsymbol {u}^\textrm {T})$ represent the skew-symmetric vorticity tensor and symmetric strain rate tensor. The presence of a vortex is indicated by $Q>0$.
Figure 4 shows the vortical structures (visualized using the  $Q$-criterion) with positive and negative values of streamwise vorticity in the wake of a square cylinder at $Re=180$ and $t=1300$ for various heating levels. At $\varepsilon =0.0$, a single streamwise vortex pair with large-scale dislocations is observed across the whole spanwise domain, indicating the Mode-A instability, as depicted in figure 4(a). When the surface of the cylinder is heated to $\varepsilon =0.2$, the vortex pair disappears even at $\varOmega _x=\pm 0.01$ (figure 4b), which clearly indicates that the three-dimensionality in the flow is suppressed. As the heating level is raised to $\varepsilon =0.4$, three-dimensionality reemerges, characterized by the presence of three pairs of $\varOmega _x$ vortices in the cylinder wake for $x<15$. The number of these vortex pairs is unaffected even in longer time integration and for an increase in the surface heating up to $\varepsilon =1.0$ (figure 4d–f). However, these vortex pairs can also be seen in the far-wake ( $x>15$) during large-scale heating as depicted in figures 4(e) and 4(f). Based on these vortex pairs (within the entire span length, $H_z=6D$), the value of $\lambda _z/D$ is estimated to be ${\simeq }2$ for $\varepsilon =0.4- 1.0$. In the earlier 3-D transition flow studies involving mixed convection (Ren et al. Reference Ren, Rindt and van Steenhoven2006a,Reference Ren, Rindt and van Steenhovenb; Kumar & Lal Reference Kumar and Lal2020), the vortical structure with $\lambda _z/D \sim 2$ in a circular cylinder wake is described as the Mode-E instability. These numerical investigations were carried out using an incompressible model with the Boussinesq approximation. Therefore, the present 3-D transition at $Re=180$ for $\varepsilon =0.4- 1.0$ is also designated as the Mode-E instability. Furthermore, it is worth noting that the vortex dislocation (which appears at $\varepsilon =0.0$ in the Mode-A instability) is suppressed in the Mode-E instability (figure 4c–f). The bifurcation in the wake of a square cylinder from Mode-A to Mode-E with an increase in surface heating is due to the baroclinic vorticity production (see detailed explanation in § 4.3).
4.2. Chaotic, periodic and quasiperiodic behaviour of wake
Three-dimensionality in the cylinder wake is indicated by the appearance of spanwise velocity ( $w$) in the cylinder wake, which results in the generation of $\varOmega _x$ and $\varOmega _y$ vortices. Figure 5 shows the time history of $w$ located in the near-wake ( $x=2, y=0, z=3$) at $Re=180$ for heating level $\varepsilon =0.0- 1.0$. It is shown that the fluctuations in $w$ of the Mode-A instability have very small amplitude at $\varepsilon =0.0$. At slight heating $\varepsilon =0.2$, these small amplitude fluctuations are suppressed which shows a 2-D flow field and can be seen in figure 4(b) with the vanishing of $\varOmega _x$ vortices. With further increase in heating level, the amplitude of $w$ increases with a nonlinear saturation value in large time limit except at $\varepsilon =1.0$. In large-scale heating at $\varepsilon =1.0$, a strong buoyancy force is generated around the square cylinder that disturbs the flow field and the amplitude of $w$ appears to fluctuate (figure 5). These fluctuations at $\varepsilon =1.0$ are accompanied by a slight disorder in $\varOmega _x$ pairs in the cylinder wake, as depicted in figure 4(f). It is worth noting that with the increase of heating ( $\varepsilon \geqslant 0.4$), the time taken for onset of the three-dimensionality ( $t'$) decreases (figure 5). This indicates that the growth of 3-D perturbation is faster as $\varepsilon$ is increased for $\varepsilon \geqslant 0.4$.
Time history of spanwise velocity ( $w$) in a square cylinder wake ( $x=2, y=0, z=3$) at $Re=180$ and $M=0.1$ for $\varepsilon =0.0- 1.0$.

The temporal behaviour of the wake largely depends on the surface heating of the square cylinder in mixed convection. In figure 6(a), the wake behaviour is analysed using spanwise velocity data for various heating levels over a short period of time ( $t=1400- 1500$). At $\varepsilon =0.0$, an irregular/chaotic 3-D wake appears behind an isolated square cylinder (figure 6a). With increase of heating levels, this chaotic wake is first suppressed in the 2-D wake ( $\varepsilon =0.2$), then it appears as a 3-D periodic wake ( $\varepsilon =0.4- 0.8$), and finally it transforms into a 3-D quasiperiodic wake ( $\varepsilon =1.0$). The chaotic, periodic and quasiperiodic wake behaviours can be better understood by the spectrum of $w$. In figure 6(b), the frequency spectra of $w$ is obtained using the fast Fourier transform (FFT) algorithm from its fully developed data for $t=1000- 1700$. Distinct frequencies in the spectra are denoted by the symbols $f_o$, $f_1$, $f_2$ and so on, as depicted in figure 6(b). At $\varepsilon =0.0$, the presence of numerous large- and small-scale peaks at irregular intervals in the spectrum suggests chaotic behaviour in the cylinder wake. For $\varepsilon =0.4- 0.8$, the harmonic spectra indicate the periodic nature of the wake. Whereas, at $\varepsilon =1.0$, the presence of small-scale peaks with incommensurate frequencies in the spectrum indicates a quasiperiodic state (figure 6b).
The wake behaviour of a square cylinder at  $Re=180$ and $M=0.1$ for various heating levels ( $\varepsilon =0.0- 1.0$) shown by (a) spanwise velocity ( $w$) located at the near-wake ( $x=2, y=0, z=3$), and its (b) frequency spectra, $f$.
$f$.

A quantitative measure for characterizing the temporal states of the wake is the largest Lyapunov exponent (LLE). The Lyapunov exponent is essential for understanding the stability and chaos in dynamical systems (Wolf et al. Reference Wolf, Swift, Swinney and Vastano1985; Rosenstein, Collins & De Luca Reference Rosenstein, Collins and De Luca1993). It characterizes the sensitivity of a system to its initial conditions and is used to distinguish chaotic, periodic and quasiperiodic behaviours. In this study, the Rosenstein algorithm is employed to calculate the LLE values using temporal data of spanwise velocity across different heating levels. As illustrated in figure 6(a), the LLE values go from a strongly positive value of 0.107 at  $\varepsilon =0.0$ to a nearly zero value of 0.001 for $\varepsilon =0.4- 0.8$, culminating in 0.053 at $\varepsilon =1.0$. For periodic flow, LLE values are either zero or negative. The difference between the LLE values for various $\varepsilon$ is further correlated to the spectra of the time series. The flow state for $\varepsilon =0.0$ is clearly chaotic, as the LLE is strongly positive and the spectra exhibit several large and small peaks. For flow states at $\varepsilon =0.4- 0.8$, the spectra reveal a periodic state with peaks observed at equal intervals, indicating harmonics. The LLE values corresponding to these states are nearly zero (of the order of $10^{-3}$). For $\varepsilon =1.0$, the LLE values increase again to 0.053, and the spectra show large peaks along with some smaller peaks at slightly irregular intervals. These two characteristics combined together are an indication of a quasiperiodic state. Hence, it can be inferred that as the cylinder heating increases, it exerts a notable influence on the wake behaviour of the cylinder, shifting the wake dynamics from chaotic to periodic or quasiperiodic patterns.
4.3. Baroclinic vorticity production
The vorticity transport equation (VTE) is obtained by taking the curl of the momentum equation given in (2.1). The non-dimensional VTE in vector form is expressed as
 \begin{align} \frac{{\rm
D}\boldsymbol{\varOmega}}{{\rm
D}t}&=(\boldsymbol{\varOmega}\boldsymbol{\cdot}\boldsymbol{\nabla})\boldsymbol{V}-(\boldsymbol{\nabla}\boldsymbol{\cdot}
\boldsymbol{V})\boldsymbol{\varOmega} +
\frac{1}{\rho^2}\boldsymbol{\nabla}\rho \times
\boldsymbol{\nabla} p -
\frac{1}{\rho^2}\boldsymbol{\nabla}\rho \times
\boldsymbol{f_v}\nonumber\\ &\quad + (\varGamma_x\hat{i}+\varGamma_z\hat{k})
+ \frac{1}{\rho}(\boldsymbol{\nabla}\times
\boldsymbol{f_v}).
\end{align}
\begin{align} \frac{{\rm
D}\boldsymbol{\varOmega}}{{\rm
D}t}&=(\boldsymbol{\varOmega}\boldsymbol{\cdot}\boldsymbol{\nabla})\boldsymbol{V}-(\boldsymbol{\nabla}\boldsymbol{\cdot}
\boldsymbol{V})\boldsymbol{\varOmega} +
\frac{1}{\rho^2}\boldsymbol{\nabla}\rho \times
\boldsymbol{\nabla} p -
\frac{1}{\rho^2}\boldsymbol{\nabla}\rho \times
\boldsymbol{f_v}\nonumber\\ &\quad + (\varGamma_x\hat{i}+\varGamma_z\hat{k})
+ \frac{1}{\rho}(\boldsymbol{\nabla}\times
\boldsymbol{f_v}).
\end{align}
Here  $\boldsymbol {f_v}=\boldsymbol {\nabla } \boldsymbol {{\cdot }} \bar {\bar {\sigma }}$ represents the viscous force per unit mass. The dimensionless viscous stress tensor components $\sigma _{ij}$ are given as
 \begin{equation} \sigma_{ij}=\frac{2\mu}{Re}\left[S_{ij}-\frac{1}{3}\frac{\partial u_k}{\partial x_k} \delta_{ij} \right], \end{equation}
where  $S_{ij}$ is the strain rate tensor and $\delta _{ij}$ represents the Kronecker delta.
In (4.2), the operator  ${\textrm {D}}/{\textrm {D}t}$ represents material derivative and $\boldsymbol {\varOmega }$ is the vorticity vector. The expressions $(\boldsymbol {\varOmega }\boldsymbol {{\cdot }} \boldsymbol {\nabla })\boldsymbol {V}$ and $(\boldsymbol {\nabla }\boldsymbol {{\cdot }} \boldsymbol {V})\boldsymbol {\varOmega }$ are the vortex stretching and production terms due to volumetric straining, respectively. The term $({1}/{\rho ^2})\boldsymbol {\nabla }\rho \times \boldsymbol {\nabla }p$ represents the baroclinic production of vorticity due to the interaction of density gradients and pressure gradients. Moreover, the term $({1}/{\rho ^2})\boldsymbol {\nabla }\rho \times \boldsymbol {f_v}$ represents the production of vorticity resulting from stratification effects and their interaction with viscous forces. Lastly, the expression $({1}/{\rho })(\boldsymbol {\nabla }\times \boldsymbol {f_v})$ signifies the diffusion of vorticity through molecular viscous stresses or forces.
The terms  $\varGamma _x=({1}/{Fr^2})(({1}/{\rho ^2})({\partial \rho }/{\partial z}))$ and $\varGamma _z=-({1}/{Fr^2})(({1}/{\rho ^2})({\partial \rho }/{\partial x}))$ in (4.2) are the baroclinic streamwise and spanwise vorticity production rate due to presence of buoyant force (stratification interacting with gravity). In the presence of buoyancy, the density gradients ( ${\partial \rho }/{\partial x}, {\partial \rho }/{\partial z}$) are significant in the near-wake of square cylinder. Therefore, the quantities $\varGamma _x$, $\varGamma _z$ have a significant role in the production of baroclinic vorticity in the near wake of the cylinder.
Figure 7 shows the vortical structures generated by  $\varGamma _x$ in the near-wake of a heated square cylinder at $Re=180$ for $\varepsilon =0.4- 1.0$. At $\varepsilon =0.4$, both positive and negative vorticity generation via $\varGamma _x$ appear in the cylinder wake for $x\leqslant 10$, as shown in figure 7(a). The production due to $\varGamma _x$ increases with a further increase of heating level ( $\varepsilon =0.6- 1.0$), which results in vortical structures appearing farther downstream in the wake for $x\geqslant 10$ (figure 7). It is evident that as the heating rises, $\varGamma _x$ vortices are generated over larger downstream distances in the wake. This explains why the 3-D mode (with a larger area of $\varOmega _x$ vortices in the cylinder wake) grows faster as the heating level is increased in the range $0.4\leqslant \varepsilon \leqslant 1.0$. In the case of low heating ( $\varepsilon =0.2$), the creation of $\varGamma _x$ vortices is limited by the weak effects of buoyancy. Therefore, the instability naturally triggered by inertia effects overcoming viscous effects is suppressed by the influence of heating on thermophysical and transport properties (see detailed discussion in § 4.6). From the ongoing discussion, it can be concluded that in the mixed convection flow regime, the generation of $\varOmega _x$ vortices for $\varepsilon \geqslant 0.4$ is due to the baroclinic production term $\varGamma _x$. This conclusion agrees well with the experimental and numerical investigations of Ren et al. (Reference Ren, Rindt and van Steenhoven2006b, Reference Ren, Rindt and van Steenhoven2007).
Isosurfaces at  $t=1300$ of positive (brown) and negative (light-yellow) streamwise baroclinic vorticity $\varGamma _x=\pm 0.05$ in a square cylinder wake at $Re=180$ and $M=0.1$ for (a) $\varepsilon =0.4$, (b) $\varepsilon =0.6$, (c) $\varepsilon =0.8$ and (d) $\varepsilon =1.0$.

For the heating range  $\varepsilon =0.4- 1.0$, the number of vortex pairs produced by $\varGamma _x$ (figure 7) is comparable to that of $\varOmega _x$ vortices (as depicted in figure 4). In addition, the production of $\varGamma _x$ vortices in the near-wake is also responsible for the suppression of the vortex dislocation that appears in the wake of an isolated square cylinder at $\varepsilon =0.0$. Therefore, it can be concluded that $\varGamma _x$ plays a significant role in wake transition and wake dynamics in the mixed convective flow regime.
4.4. Translational and rotational energy norms
The growth of the 3-D mode requires some energy that is either available in the 2-D base flow or the energy is transformed from the thermal field by baroclinic effects as represented by the streamwise vorticity production term  $\varGamma _x$. This picture of energy transfer with increasing heating levels is quantitatively presented in table 3 containing the data representing the various time-averaged energy norms. Specifically, it focuses on additional energy modes for 3-D flow: $E(w)$; $E(\varOmega _x)$; $E(\varOmega _y)$. In addition to these energy norms, the time-averaged magnitudes of the $\varGamma _x$ are also estimated using the norm $E(\phi )$. These energy norms (per unit span), encompassing translational and rotational energy, are defined as
 \begin{equation} \left\langle E(\phi)\right\rangle=\frac{1}{\tau H_z}\iiiint \phi^2(x,y,z,t)\,{\rm d}\mathbb{V} \,{\rm d}t, \end{equation}
where  $\tau$ represents the overall duration between $t=1200$ and $t=1500$, during which a total of 61 snapshots are taken with an equal time interval of five units for the purpose of time averaging. In (4.4), the symbol $\mathbb {V}$ is the volume of the near-wake region for $x=0$ to 20, $y=-5$ to 5 and the entire spanwise length.
The transfer of time-averaged 3-D energy shown at  $Re=180$ in the form of translational and rotational energy norms for $\varepsilon =0.0- 1.0$.

Table 3 reveals that the zero values of both the translational and rotational energy norms (at  $\varepsilon =0.2$) indicate a complete transformation of the energy from the 3-D wake into a 2-D wake, leading to the suppression of three-dimensionality in the cylinder wake. For the heating levels in the range of $0.4\leqslant \varepsilon \leqslant 1.0$, 3-D energy reappears and increases as the heating levels rise (table 3). The results also reveal an increase in the strength of $\varGamma _x$ and $\varOmega _x$ as heating levels rise from $\varepsilon =0.4$ to $\varepsilon =1.0$. Therefore, the role of energy transformations from thermal mode via buoyancy in feeding the 3-D states (as listed in table 3), with increasing heating levels, are evident in the form of generation of $\varOmega _x$ through $\varGamma _x$ for $\varepsilon =0.4$–1.0 over large downstream distances in the cylinder wake (figures 4 and 7).
4.5. Spanwise vorticity in the near wake
As discussed in § 4.3, with the increase in heating levels ( $\varepsilon =0.4- 1.0$), the baroclinic vorticity production by $\varGamma _x$ is strengthened and plays a significant role in wake dynamics behind the heated cylinder, specifically in the generation and strengthening of the $\varOmega _x$ structures. In a similar vein, this section explores the impact of spanwise baroclinic vorticity production by $\varGamma _z$ on the dynamics of the near wake, with a specific focus on the spanwise vortex ( $\varOmega _z$). To elucidate, figure 8 displays the spatial distribution of $\varOmega _z$ and $\varGamma _z$ in the near wake at $\varepsilon =0.2$, 0.6 and 1.0. It is observed that with an increase in heating level, the magnitude of $\varOmega _z$ decreases (figure 8a,c,e), even though the magnitude of $\varGamma _z$ increases (figure 8b,d,f).
Spatial distribution of  $\varOmega _z$ (a,c,e) and $\varGamma _z$ (b,d,f) in the wake of the midspan of a heated square cylinder at $Re=180$ for $\varepsilon =0.2$, 0.6 and 1.0.

Furthermore, an increase in asymmetry is also observed in the magnitude of the upper and lower  $\varOmega _z$ vortex with an increase in heating level (figure 8a,c,e). This asymmetry arises from the production of $\varGamma _z$ vorticity of opposite sense to that of $\varOmega _z$. From figure 8(b,d,f), it can be observed that the positive $\varGamma _z$ region is increasing over the top surface, while the negative $\varGamma _z$ region is increasing near the bottom surface around the right-hand corner. As a result, $\varGamma _z$ creates an asymmetric reduction in the magnitude of $\varOmega _z$ near the top and bottom surfaces of the cylinder. Kieft et al. (Reference Kieft, Rindt, van Steenhoven and van Heijst2003) and Ren et al. (Reference Ren, Rindt and van Steenhoven2006b) also revealed that spanwise vorticity production by $\varGamma _z$ plays a crucial role in the variations in strength between the lower and upper spanwise vortices in the near wake of a heated circular cylinder. Nonetheless, their research is confined to small-scale heating scenarios using the Boussinesq model. In the current computations, the overall reduction in the magnitude of $\varOmega _z$ with an increase in heating level, accompanied by an increase in energy norms for $\varOmega _x$ and $\varOmega _y$, suggests a transfer of rotational energy from spanwise vortices. Hence, $\varGamma _z$ is also indirectly responsible for the sustenance and growth of the 3-D modes in the wake of the heated square cylinder.
4.6. Effective thermophysical properties
The thermophysical properties (such as  $\mu$, $\kappa$, $\rho$ and $C_v$) of fluid particles around a square cylinder vary as the heating level $\varepsilon$ is increased using the present NOB model. The average over space and time of these properties constitutes the effective thermophysical and transport properties of the fluid near the heated cylinder. The effective value in the dimensionless form of any of these properties can be defined as
 \begin{equation} \psi_{eff}=\frac{1}{(\mathcal{T})(\mathbb{V})}\iiiint \psi(x,y,z,t)\,{\rm d}\mathbb{V} \,{\rm d}t, \end{equation}
where  $\mathcal {T}$ is the duration of the dimensionless time interval for time averaging. The symbol $\mathbb {V}$ represents the total volume of fluid particles around a square cylinder within a radial distance $r$ at a certain time $t$.
$t$.
The variation of the effective dimensionless thermophysical properties (such as  $\mu _{eff}$, $\kappa _{eff}$, $\rho _{eff}$ and ${C_v}_{eff}$) with increasing heating level is depicted in figure 9 at $Re=180$ for $r=5D$, $r=15D$ and $r=25D$. A total of 61 snaps (between $t=1200$ and $t=1500$) are used for time averaging of the thermophysical properties. As the heating level increases, it can be seen that the values of $\mu _{eff}$, $\kappa _{eff}$ and ${C_v}_{eff}$ increase (figure 9a,b,d) while the value of $\rho _{eff}$ decreases (figure 9c). In addition, a small change is noticed in the values of these properties for $r=15D$ and $r=25D$ compared with the change in values obtained in going from $r=5D$ to $r=15D$. This shows that at $r=15D$, the values of the effective fluid properties converge and can be assumed to be nearly independent of radial distance or volume size, as per (4.5).
The changes in thermophysical and transport properties of fluid particles with increasing heating level at  $Re=180$ and $M=0.1$ around a square cylinder within radial distances of $5D$,
$5D$,  $15D$ and $25D$ shown in the plots of (a) $\mu _{eff}-\varepsilon$, (b) $\kappa _{eff}-\varepsilon$, (c) $\rho _{eff}-\varepsilon$, (d) ${C_v}_{eff}-\varepsilon$, (e) $Pr_{eff}-\varepsilon$ and (f) $Re_{eff}-\varepsilon$.

Owing to changes in thermophysical properties during heating, the Prandtl number and Reynolds number of fluid flow around the cylinder is affected and is referred to as the effective Prandtl number ( $Pr_{eff}$) and effective Reynolds number ( $Re_{eff}$). These are expressed as
 \begin{gather} Re_{eff}=\frac{\rho_{eff}}{\mu_{eff}} Re, \end{gather}
 \begin{gather}Pr_{eff}=\frac{({C_v}_{eff})(\mu_{eff})}{\kappa_{eff}} Pr. \end{gather}
The concept of the effective Reynolds number was initially introduced experimentally by Lecordier et al. (Reference Lecordier, Hamma and Paranthoen1991) and Dumouchel et al. (Reference Dumouchel, Lecordier and Paranthoën1998) to explore the control of laminar vortex shedding behind heated circular cylinders at low Reynolds numbers. Subsequently, Wang et al. (Reference Wang, Trávníček and Chia2000) experimentally investigated the effect of temperature on the vortex shedding frequency of a heated circular cylinder, utilizing the effective Reynolds number concept, which incorporates a kinematic viscosity calculated from an ‘effective temperature’. In the current numerical study of 3-D transitional flow, the effective Reynolds number is crucial for understanding the flow dynamics behind a heated cylinder.
Therefore, it can be argued that the concept of an ‘effective Reynolds number’ from previous studies, which primarily aimed to represent the effects of heating on fluid properties via a single dimensionless effective Reynolds number on vortex-shedding frequency, is also useful for representing the effects of heating on the 3-D transitional wake dynamics. This aspect opens a new pathway for the physical understanding of flows with large-scale heating. Further, the computations of  $\rho _{eff}$, $\mu _{eff}$ and $k_{eff}$, unlike in previous studies, are not based on an ‘effective temperature’ whose values are assigned to develop accurate empirical (curve fit) relations for heat transfer, Strouhal number and drag characteristics. Rather, using the volumetric numerical data, averaged measures of various thermophysical properties in the near field of the heated square cylinder have been employed.
As shown in figure 9(e,f), it can be seen that  $Pr_{eff}$ decreases by a very small margin as the heating level rises, while the value of $Re_{eff}$ is significantly reduced. Therefore, it can be concluded that as the heating increases, the effective thermophysical properties differ significantly resulting in a decrease in the effective Reynolds number around the cylinder. On the other hand, with an increase in heating, the strength of streamwise vorticity increases via baroclinic vorticity production. These two factors oppose each other, and the dominance of one over the other results in either the weakening or suppression of three-dimensionality in the wake, as observed with slight heating ( $\varepsilon =0.2$). However, at higher heating levels ( $\varepsilon \geqslant 0.4$), despite the significant reduction in $Re_{eff}$ value, the main reason for the occurrence of three-dimensionality leading to stronger $\varOmega _x$ is the production of streamwise baroclinic vorticity in the heated cylinder wake, as explained in § 4.3.
4.7. Lift coefficient and frequency spectra
Figure 10 shows the variation in the time history of the lift coefficient ( $C_L$) at $Re=180$ with increasing heating level from $\varepsilon =0.0$ to $\varepsilon =1.0$. At various heating levels, a drop in the $C_L$ amplitude (except at $\varepsilon =0.2$) is observed in temporal data, indicating the transition to 3-D flow (figure 10a). A rectangular box is employed to highlight the transition in $C_L$ data, including the temporal data at $\varepsilon =0.2$. A detailed view of the $C_L$ data within this highlighted zone, over a short time interval ( $\Delta t=150$ for $\varepsilon =0.0- 1.0$), is depicted in figure 10(b). At low heating ( $\varepsilon =0.2$), the constant $C_L$ amplitude with time reveals a 2-D flow, as shown in figure 10. It is observed that the onset time of three-dimensionality decreases with the increase of heating (figure 10a) and can also be seen in the time history of the spanwise velocity (figure 5). At $\varepsilon =0.0$, the fluctuations in the time history of $C_L$ for $t>700$ (where the flow is fully developed) indicate the presence of vortex dislocation in the wake. These fluctuations are suppressed with the increase of heating from $\varepsilon =0.2$ to $\varepsilon =1.0$ (figure 10a).
(a) Temporal variation of  $C_L$, and (b) a close-up view of onset of three-dimensionality in a small time interval, shown at $Re=180$ and $M=0.1$ for $\varepsilon =0.0- 1.0$.

Moreover, it is observed that the  $C_L$ amplitude reduces as the heating rises except at $\varepsilon =0.2$ (figure 10). The reduction in $C_L$ amplitude is due to the decrease of $\varOmega _z$ strength in the near-wake of a heated square cylinder (figure 8). In contrast, at $\varepsilon =0.2$, a large value of the $C_L$ amplitude is observed due to high strength of $\varOmega _z$ (as shown in figure 8a). In figure 10, it can be seen that the average magnitude of $C_L$ increases with an increase in the heating level. Furthermore, in comparison with the isothermal wake at $\varepsilon =0.0$, the heated wake exhibits an earlier initiation of vortex shedding (figure 10a) owing to variations in the strength of positive and negative $\varOmega _z$ vortices (figure 8).
The frequency spectra of  $C_L$ for the heating level $\varepsilon =0$ to 1 at $Re=180$ are shown in figure 11. An FFT algorithm is used to determine the vortex-shedding frequency ( $\,f_L$) using the fully developed $C_L$ data for the dimensionless time interval $t\simeq 700- 1700$. In figure 11, several small-scale peaks are visible at $\varepsilon =0.0$ in the frequency spectrum due to the vortex dislocation in the Mode-A instability. At $\varepsilon =0.2$, the dominant frequency and its amplitude (i.e. the amplitude of $C_L$) have a large value indicating strong 2-D vortex shedding (figure 11). With further increase of heating from $\varepsilon =0.2$ to $\varepsilon =1.0$, the decrease in the value of $C_L$ amplitude (figure 11) suggests a weaker form of 3-D vortex shedding. This result reveals that vortex shedding is weakened due to the low strength of spanwise vorticity.
Frequency spectra of  $C_L$ at $Re=180$ for $\varepsilon =0.0- 1.0$.

5. Conclusions
This paper presents a detailed numerical study of the 3-D flow transition in the wake of a heated square cylinder subjected to cross-flow perpendicular to gravity in the mixed convection flow regime. In the wake of an unheated square cylinder, a tongue-shaped vortical structure with a longer spanwise wavelength ( $\lambda _z/D \sim 5.5$) of the Mode-A instability is shown at $Re=180$. While a rib-like vortical structure is depicted at $Re=250$ with a shorter wavelength ( $\lambda _z/D\sim 1.2$) of the Mode-B instability. The presence of large-scale vortex dislocations is detected by the discontinuity in the $St$–
$St$– $Re$ and $\bar {C}_D$– $Re$ plots. Furthermore, the critical Reynolds number for onset of three-dimensionality is found to be $Re_{cr}=173$ in the wake of the unheated square cylinder.
In the mixed convection flow regime, when heat is added to the cylinder surface at  $Re=180$, the 3-D chaotic wake (of the Mode-A instability) is first suppressed into a 2-D wake ( $\varepsilon =0.2$), then bifurcates into a 3-D periodic wake ( $\varepsilon =0.4- 0.8$), and finally transforms into a 3-D quasiperiodic wake ( $\varepsilon =1.0$). The creation of streamwise vorticity behind the heated cylinder is significantly influenced by the baroclinic vorticity production in the streamwise direction. For $\varepsilon =0.4- 1.0$, using the NOB compressible model with a low Mach number ( $M=0.1$), the production of $\varGamma _x$ structures in the near-wake leads to the appearance of $\varOmega _x$ structures (having $\lambda _z/D\sim 2$), which is designated as the Mode-E instability. Ren et al. (Reference Ren, Rindt and van Steenhoven2006b) also reported a similar wake structure (referred as Mode-E instability) for $Re=75- 117$ and $Ri=0.35- 2.5$. However, their findings are limited to the small-scale heating scenario for the flow around a heated circular cylinder under horizontal water flow, utilizing the Boussinesq model.
In the heated cylinder wake, it is observed that the magnitude of the streamwise vorticity production rate increases with the increase of heating levels from  $\varepsilon =0.4$ to $\varepsilon =1.0$. As a result, the strength of the $\varOmega _x$ vortices increases causing the onset time of three dimensionality to be reduced. The streamwise baroclinic production is shown to be directly correlated with the energy fields associated with spanwise translational energy ( $w^2$), streamwise rotational energy ( $\varOmega_x^2$) and transverse rotational energy ( $\varOmega_y^2$). Furthermore, in the near wake, the production of baroclinic vorticity in the spanwise direction significantly contributes to the reduction in the magnitudes of positive as well as negative $\varOmega _z$ vorticity. Hence the spanwise baroclinic production of vorticity indirectly plays a role in the transfer of rotational energy from $\varOmega _z$ vortices to $\varOmega _x$ and $\varOmega _y$ vortices.
The strong and weak vortex shedding largely depends on the strength of the  $\varOmega _z$ vortices in the cylinder wake. As the heating increases, a decrease in the strength of the $\varOmega _z$ vortices causes weaker vortex shedding which is indicated by the decreasing value of the $C_L$ amplitude. In the case of low heating ( $\varepsilon =0.2$), the baroclinic vorticity production in the streamwise direction is weak. However, the temperature-dependent variations in the thermophysical and transport properties, result in lowering of effective Reynolds number around the heated cylinder which suppresses the typical Mode-A instability that would exist for an unheated cylinder at $Re=180$.
Funding
The authors express their gratitude for the computational support provided by the High Performance Computing (HPC) facility at the Indian Institute of Technology-Delhi, India.
Declaration of interests
The authors report no conflict of interest.
Appendix A. Governing equations in body-fitted coordinates
The governing equations from (2.1) are converted into body-fitted curvilinear coordinates  $\xi (x,y)$, $\eta (x,y)$ as follows:
 \begin{equation} \frac{\partial
\boldsymbol{U}}{\partial t}+\frac{\partial
\boldsymbol{\tilde{F}}}{\partial \xi}+\frac{\partial
\boldsymbol{\tilde{G}}}{\partial
\eta}+\frac{\partial\boldsymbol{ H}}{\partial
z}=\boldsymbol{\tilde{J}},
\end{equation}
\begin{equation} \frac{\partial
\boldsymbol{U}}{\partial t}+\frac{\partial
\boldsymbol{\tilde{F}}}{\partial \xi}+\frac{\partial
\boldsymbol{\tilde{G}}}{\partial
\eta}+\frac{\partial\boldsymbol{ H}}{\partial
z}=\boldsymbol{\tilde{J}},
\end{equation}where
 \begin{equation} \boldsymbol{\tilde{F}}=\xi_x \boldsymbol{F}+\xi_y \boldsymbol{G},\quad \boldsymbol{\tilde{G}}=\eta_x \boldsymbol{F}+\eta_y \boldsymbol{G} \end{equation}
and
 \begin{equation} \boldsymbol{\tilde{J}}=\boldsymbol{J}+\left(\frac{\partial \xi_x}{\partial \xi}+\frac{\partial \eta_x}{\partial \eta}\right)\boldsymbol{F}+\left(\frac{\partial \xi_y}{\partial \xi}+\frac{\partial \eta_y}{\partial \eta}\right)\boldsymbol{G}. \end{equation}
Appendix B. Numerical scheme
The present computations are carried out using the PVU-M $+$ scheme with a few adjustments. In order to solve the Euler/Navier–Stokes equations of compressible flow models using the finite difference approach, Hasan et al. (Reference Hasan, Khan and Shameem2015) originally proposed a high-resolution TVD (total variation diminishing) flux-based scheme. The robustness of this scheme allows it to be used for a wide range of Mach numbers, from $M=0.1$ (incompressible regimes) to $M=10$ (hypersonic regimes). The PVU-M $+$ scheme uses a two-step, predictor–corrector, second-order temporal integration method to integrate the compressible flow equations in time. The scheme's primary concept is the division of the total flux vectors (given in (2.1)) into convective and non-convective flux vectors.
Recently, a modified version of the PVU-M $+$ scheme was utilized by Ahmad, Hasan & Sanghi (Reference Ahmad, Hasan and Sanghi2020) in carrying out DNS study on starting axisymmetric compressible jets at moderately high Reynolds numbers. The complex features of subsonic and supersonic jets were resolved quite accurately by a modified version of this scheme. Apart from providing a good blend of robustness, efficiency and accuracy, the scheme also offers excellent scalability for parallelization. Ahmad et al. (Reference Ahmad, Hasan and Sanghi2020) observed a three-way splitting of the total flux into convective flux, pressure flux and viscous flux. They employed central difference with intercell values for estimating viscous flux derivatives, which resulted in much better resolution with negligible numerical noise compared with the older version of the PVU-M $+$ scheme. The older version of the scheme employed forward/backward differencing of the combined pressure and viscous flux (non-convective flux). The forward/backward differencing for pressure flux was retained in their modified version of the PVU-M $+$ scheme.
In the present study, when this modified version of the PVU-M $+$ scheme is utilized at low Mach numbers, some non-physical oscillations in the pressure field are observed near the sharp corners of the square cylinder. It is found that employing central differencing for both pressure and viscous flux using intercell values leads to the elimination of spurious oscillations in the pressure field. Therefore, the derivatives of the non-convective fluxes (pressure and viscous) are discretized by central difference scheme utilizing intercell values (see (B1) and (B2)).
The predictor and corrector steps at an  $i\textrm {th}$ grid point in the one-dimensional framework used to construct the solution vector of (A1) at the new time level ( $n+1$) are given as follows:
the predictor step,
 \begin{equation} \boldsymbol{U}^{*}=\boldsymbol{U}^n-\Delta t\left\{\frac{\boldsymbol{\tilde{F}}^c_{i+1/2}(\boldsymbol{U}^n)-\boldsymbol{\tilde{F}}^c_{i-1/2} (\boldsymbol{U}^n)}{\xi_{i+1/2}-\xi_{i-1/2}}+\frac{\boldsymbol{\tilde{F}}^{nc}_{i+1/2} (\boldsymbol{U}^n)-\boldsymbol{\tilde{F}}^{nc}_{i-1/2}(\boldsymbol{U}^n)}{\xi_{i+1/2}-\xi_{i-1/2}}- \boldsymbol{\tilde{J}}^n_i\right\}; \end{equation}
the corrector step,
 \begin{align} \boldsymbol{U}^{n+1}&=\frac{(\boldsymbol{U}^*+\boldsymbol{U}^n)}{2}\nonumber\\ &\quad -\frac{\Delta t}{2}\left\{\frac{\boldsymbol{\tilde{F}}^c_{i+1/2}(\boldsymbol{U}^*)-\boldsymbol{\tilde{F}}^c_{i-1/2}( \boldsymbol{U}^*)}{\xi_{i+1/2}-\xi_{i-1/2}}+\frac{\boldsymbol{\tilde{F}}^{nc}_{i+1/2}(\boldsymbol{U}^*)- \boldsymbol{\tilde{F}}^{nc}_{i-1/2}(\boldsymbol{U}^*)}{\xi_{i+1/2}-\xi_{i-1/2}}-\boldsymbol{\tilde{J}}^*_i\right\}. \end{align}
The convective and non-convective flux vectors are represented here by the symbols  $\boldsymbol {\tilde {F}}^c$ and $\boldsymbol {\tilde {F}}^{nc}$. The intercell convective flux $\boldsymbol {\tilde {F}}^c_{i+1/2}$ is expressed as
 \begin{equation} \boldsymbol{\tilde{F}}^c_{i+1/2}=u_{i+1/2}\phi_{i+1/2}, \end{equation}
where  $u_{i+1/2}$ represents intercell numerical velocity and $\phi _{i+1/2}=[\rho \ \rho u\ \rho v \rho w\ \rho E]_{i+1/2}^T$ is the intercell convective property vector. The estimation of $u_{i+1/2}$ and $\phi _{i+1/2}$ is accomplished by combining a fourth-order central interpolation and second/first-order upwind biased interpolation with appropriate weight functions. The weight functions are designed to control the blending weight of higher/lower-order approximations. This allows the scheme to handle abrupt changes in the flow field, such as the appearance of discontinuities, in a relatively smooth flow field. The work of Hasan et al. (Reference Hasan, Khan and Shameem2015) provides more information about the PVU-M $+$ scheme and related spatial discretization of fluxes.
The intercell non-convective flux  $\boldsymbol {\tilde {F}}^{nc}_{i+1/2}$ is obtained using the values at neighbouring node points. The flow field variable $f$ (of non-convective flux) and its derivatives at the intercell or midway location ( $i+1/2, j, k$) are
 \begin{gather} f_{i+1/2}=\frac{f_{i+1}+f_{i}}{2}, \end{gather}
 \begin{gather}\left.\frac{\partial f}{\partial \xi} \right|_{i+1/2}=\frac{f_{i+1}-f_{i}}{\xi_{i+1}-\xi_{i}}=\frac{f_{i+1}-f_{i}}{\Delta\xi}, \end{gather}
 \begin{gather}\left.\frac{\partial f}{\partial \eta} \right|_{i+1/2} \quad {\rm or} \quad \left.\frac{\partial f}{\partial z} \right|_{i+1/2} = \left.\frac{\partial f}{\partial (\eta,z)} \right|_{i+1/2}= \frac{\left.\dfrac{\partial f}{\partial(\eta,z)}\right|_{i+1}+\left.\dfrac{\partial f}{\partial (\eta,z)}\right|_{i}}{2}. \end{gather}
Here,  ${\partial f}/{\partial \eta }$ is discretized using second-order central and one-sided differencing at the interior and boundary nodes of the grid, respectively. The variables and their derivatives at other midway locations ( $i, j+1/2, k$) and ( $i, j, k+1/2$) can be expressed, in a similar manner.
Appendix C. Domain and grid independence studies
Tests for domain size and grid independence are carried out to ensure accurate results and prevent high computational costs. These tests are carried out at  $M=0.1$ and $Re=500$ for large-scale heating ( $\varepsilon =1.0$). In these tests, the variation in the values of time-averaged force coefficients ( $\bar {C}_D$ and $\bar {C}_L$), time-averaged Nusselt number ( $\overline {Nu}$) and Strouhal number ( $St$) with different domain and grid sizes have been examined. The force coefficients are defined as
 \begin{gather} C_D=\frac{2 F_D}{\rho_\infty {U_\infty}^2 D H_z}, \end{gather}
 \begin{gather}C_L=\frac{2 F_L}{\rho_\infty {U_\infty}^2 D H_z}, \end{gather}
where  $F_D$ and $F_L$ represent the integrated drag and lift forces on the entire cylinder, respectively. These force coefficients using the surface stress distribution are expressed in the form of curvilinear coordinates as
 \begin{gather} C_D=\frac{D}{H_z}\int\left\{\oint \frac{2}{|\tilde{J}|}\left({-}p+\frac{4}{3Re}\mu \boldsymbol{\nabla}\boldsymbol{\cdot}\boldsymbol{V}\right)\eta_x \,{\rm d}\xi- \frac{2}{Re}\oint \frac{1}{|\tilde{J}|} \mu \varOmega_z \eta_y \,{\rm d}\xi \right\}{\rm d}z, \end{gather}
 \begin{gather}C_L=\frac{D}{H_z}\int\left\{\oint \frac{2}{|\tilde{J}|}\left({-}p+\frac{4}{3Re}\mu \boldsymbol{\nabla}\boldsymbol{\cdot}\boldsymbol{V}\right)\eta_y \,{\rm d}\xi+ \frac{2}{Re}\oint \frac{1}{|\tilde{J}|} \mu \varOmega_z \eta_x \,{\rm d}\xi \right\}{\rm d}z. \end{gather}
Here, 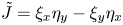 $\tilde {J}=\xi _x \eta _y-\xi _y \eta _x$ is the determinant of the Jacobian matrix. The vortex-shedding frequency, i.e. Strouhal number $St$, expressed as
 \begin{equation} St=\frac{f_LD}{U_\infty}, \end{equation}
where  $f_L$ represents the dominant frequency in the lift force spectrum obtained from the time history of $C_L$ using the FFT algorithm. The Nusselt number is defined as
 \begin{equation} Nu=\frac{hD}{\bar{k}_\infty}=\frac{\bar{Q}}{4\bar{k}_\infty(\bar{T}_w-\bar{T}_\infty)}, \end{equation}
where  $h$ represents convective heat transfer coefficient of the flow and the quantity $Q$ is the heat transfer rate from the cylinder expressed as
 \begin{equation} \bar{Q}={-}\bar{k}_\infty D \bar{T}_\infty \int\oint k_w (\boldsymbol{\nabla} T\boldsymbol{\cdot}\hat{n})({\rm d}l)\,{\rm d}z. \end{equation}
Here, the symbol  $\hat {n}$ stands for the local outward normal vector to the cylinder wall, and dimensional quantities are indicated by an overbar. The symbol d $l$ denotes the dimensionless differential line element at the cylinder boundary, expressed as follows:
 \begin{equation} {\rm d}l=\frac{1}{|\tilde{J}|}\left(\sqrt{{\eta_y}^2+{\eta_x}^2}\right) {\rm d}\xi. \end{equation}
In the body-fitted coordinates, the final expression for the Nusselt number is given as
 \begin{equation} Nu=\frac{D}{H_z}\int\left\{-\frac{k_w}{4\varepsilon}\oint\frac{1}{|\tilde{J}|}\left(\frac{\partial T}{\partial \eta}\right)_w(\eta^2_x+\eta^2_y)\,{\rm d}\xi\right\}{\rm d}z. \end{equation}
 For assessing domain size independence, an O-type coarse grid with 249, 327 and 31 mesh points in the  $\xi$, $\eta$ and $z$ directions is used. Initially, the artificial boundary of the grid is set at a dimensionless distance of 100 from the centre of the cylinder. This initial grid is then truncated to obtain different grids with the same cell size at non-dimensional distances $R_d$ (namely 80, 60, 40 and 20) from the centre of the cylinder. The values of the flow properties at the same flow conditions ( $Re=500$, $M=0.1$ and $\varepsilon =1.0$) corresponding to the truncated grid are listed in table 4. Beyond $R_d=60$, the variations in the values $\bar {C}_D$, $\bar {C}_L$ and $\overline {Nu}$ are relatively small. Furthermore, the changes in the values of $St$ are negligible. Therefore, the far boundary at $R_d=60$ is considered to be suitable for the entire computations.
Domain size independence check at  $Re=500$ and $\varepsilon =1.0$.

For  $R_d=60$, the grid independence test is initially performed on three grids (G1, G2 and G3) refined in the $\xi - \eta$ plane with fixed spanwise grid points listed in table 5. From G2 to G3, a maximum deviation of $0.71\,\%$ in the values of flow properties such as $\bar {C}_D$, $\bar {C}_L$, $\overline {Nu}$ and $St$ is observed. Therefore, the grid G2 is selected and refined in the $z$-direction to form new grids (G4 and G5). Table 6 demonstrates that the $\bar {C}_D$, $\overline {Nu}$ and $St$ values are reduced insignificantly by $0.15\,\%$, $0.15\,\%$ and $0.46\,\%$, while utilizing grid G5 in comparison with grid G4, whereas the $\bar {C}_L$ value is reduced slightly by $1.27\,\%$. Therefore, to save computation time, grid G4 is considered for the present simulations.
Grid refined in the  $\xi$– $\eta$ plane at $Re=500$ and $\varepsilon =1.0$.

Grid G2 refined in the  $z$-direction at $Re=500$ and $\varepsilon =1.0$.


 Open access

