

Whole-grain wheat consumption is associated with reduced risk of CVD and type 2 diabetes(Reference Seal and Brownlee1–Reference Threapleton, Greenwood and Evans3), largely attributed to the bran fraction which is rich in fibres, phenolic acids, antioxidants, S-containing amino acids, vitamins and minerals(Reference Călinoiu and Vodnar4–Reference Masisi, Beta and Moghadasian6). As reviewed previously(Reference Lee, Han and Song7), foods based on whole-grain wheat can attenuate markers of oxidative stress, as well as inflammation. Studies have shown improvements in inflammatory markers, including C-reactive protein (CRP)(Reference Hoevenaars, Esser and Schutte8) and TNF-α, when whole-grain wheat was the only(Reference Vitaglione, Mennella and Ferracane9) or the predominant(Reference Vanegas, Meydani and Barnett10,Reference Kopf, Suhr and Clarke11) grain in the diet, although other studies have shown no effect(Reference Price, Wallace and Hamill12). The contributions of specific grain constituents to the observed risk reduction effects of whole grains remain unresolved. Phenolic acids and their metabolites contribute by serving as free radical scavengers, reducing agents and quenchers of singlet oxygen formation that inactivate reactive oxygen species(Reference Rice-Evans, Miller and Paganga13,Reference Liu, Qiu and Beta14) . Dietary fibres contribute by modulating glycaemic response, lowering blood cholesterol and increasing faecal bulk, subject to fibre type(Reference Alan, Ofelia and Patricia15,Reference Stevenson, Phillips and O’Sullivan16) . Other phytochemicals (e.g. anthocyanins and flavonoids) present in whole grains(Reference Belobrajdic and Bird17), including coloured varieties, may confer additional health benefits.
Phytochemicals (e.g. anthocyanins, flavonoids, phytates, lectins), some of which contribute colour to grains, may interfere with nutrient digestion and absorption (e.g. phytic acid leading to Zn deficiency)(Reference Samtiya, Aluko and Dhewa18). Plant breeding and processing have sought to decrease phytochemical concentrations because of their anti-nutritional activities or to increase them based on health-enhancing potential, since many molecules can have positive or negative consequences, depending on the context (e.g. molecule, dose, degree of processing, bioavailability, animal species, health conditions)(Reference Soetan19). For example, polyphenols, and in particular the phenolic acids, ferulic and p-coumaric acids, negatively influence energy utilisation in sorghum-based broiler diets(Reference Khoddami, Truong and Liu20) by binding proteins and inhibiting digestive enzymes, but a higher intake of flavonoids in humans has been associated with lower incidence of type 2 diabetes(Reference Jacques, Cassidy and Rogers21). As such, there is interest in teasing out the potential of phytochemicals that may be health-promoting (for example, anthocyanins) and incorporating these into emerging grain varieties. This includes colourful specialty whole-grain wheat varieties(Reference Abdel-Aal, Young and Rabalski22,Reference Abdel-Aal, Hucl and Rabalski23) , one example of which is purple wheat (PW). This relatively new grain is rich in anthocyanins, especially cyanidin-3-glucoside(Reference Abdel-Aal, Hucl and Rabalski23). PW and its fractions, including the bran, can be incorporated as ingredients into a range of functional food products(Reference Shipp and Abdel-Aal24). However, most research with cereal anthocyanins is limited to in vitro and animal models(Reference Zhu25). Mrkvicova et al.(Reference Mrkvicova, Pavlata and Karásek26) observed some changes in antioxidant activity and liver enzyme activities in rats, chickens and fish who were fed PW. Human studies of coloured grain foods and coloured wheat and PW, specifically, are scarce and mostly limited to extracted pigmented fractions. For example, Wang et al.(Reference Wang, Han and Zhang Phd27) showed that black-pigmented rice fraction improved cardiovascular risk factors, including high-sensitivity C-reactive protein (hs-CRP). Liu et al.(Reference Liu, Qiu and Yue28) conducted a 5-week intervention where participants with type 2 diabetes consumed products (steamed buns, noodles, and peeled kernels mixed with rice and mung beans) containing a relatively new variety of anthocyanin-rich black-grained wheat or control regular white and rice cereal products, with all participants given nutritional and diabetes education. Participants in the black-grained wheat group had a decrease in glycated albumin. Also, TNF-α which tends to increase in type 2 diabetes did not increase for participants consuming the black-grained wheat, but did for the control group.
Our previous work showed that PW bars inhibited in vitro radical activity by 76 % according to the oxygen radical absorbance capacity method(Reference Gamel, Wright and Pickard29). It also confirmed that, when healthy adults consumed PW bars and crackers, the anthocyanins were rapidly absorbed and excreted, with no short-term impacts on plasma antioxidant activity or the inflammatory markers IL-6 and TNF-α (Reference Gamel, Wright and Tucker30). In general, the majority of anthocyanin studies are limited to fruits and vegetables, as thoroughly reviewed(Reference Gomes, Rigolon and Souza31,Reference Guo and Ling32) . Although this evidence is strong and suggests mechanisms for anti-obesity effects, and reducing oxidative stress and inflammation(Reference Gomes, Rigolon and Souza31), the data cannot be fully extrapolated to coloured grains. The objective of the present study was to explore if 8-week consumption of products based on whole PW, compared with whole regular wheat (RW), with weight maintenance, would alter markers of inflammation, oxidative stress and lipaemia in overweight or obese individuals with chronic inflammation. It was hypothesised that consumption of both whole-grain products would positively influence metabolic markers, but that, because of its anthocyanin content, PW would have a greater influence.
Methods
Study materials and products
Whole-grain PW (CDC Primepurple cultivar, commercially distributed by InfraReady Products Ltd, Saskatoon, SK as AnthoGrainTM) and RW (CDC Utmost cultivar) were used to produce bran-enriched convenience bars by an automated process at the Saskatchewan Food Industry Development Centre Inc., Saskatoon, SK., following good manufacturing and sanitary practices. PW was developed based on the CDC Utmost cultivar and owes its namesake colour to the enrichment in anthocyanin pigments. In each case, a blend of 50 g whole wheat flakes and 50 g wheat bran was combined with maize syrup, sugar, rapeseed oil and xanthan gum (30, 10, 10 and 0·5 g, respectively). The dry ingredients were mixed with the maize syrup, compressed, shaped into thick sheets, cut into bars and dried at 300°F for 30 min. Products were shipped frozen to the University of Guelph, immediately portioned into baggies in 40 g servings, sealed from air and moisture, packaged in fours to provide the daily serving amount (160 g), labelled, and placed in frozen storage (–18 ± 2 °C).
Product analysis
Nutrient analysis was performed after milling the bars to fine particles using an M2 universal mill (IKA-Werke). Protein (N × 5·7) was measured by the combustion method using a nitrogen analyser (FP 2000 Leco Instrument UK Ltd.). Moisture, starch, ash, crude fat and total dietary fibre were determined according to American Association of Cereal Chemists International Approved Methods 44–40.01, 76–13.01, 08–01.01, 30–20.01 and 32–05.01, respectively(33). Anthocyanins were quantified after extraction with acidified ethanol(Reference Abdel-Aal, Hucl and Rabalski23). Free and bound phenolic acids were separated and quantified following extraction with 80 % methanol to obtain free phenolic acids followed by saponification to liberate bound phenolic acids(Reference Gamel, Wright and Tucker30,Reference Abdel-Aal and Rabalski34) . The anthocyanins and phenolic acids were separated and quantified(Reference Abdel-Aal, Young and Rabalski22) using an 1100 series chromatograph (Agilent Tech.) and malvinidin-3-glucoside as an internal standard. Anthocyanins were detected at 525 nm and phenolic acids at 260, 275 and 320 nm using nine anthocyanin standards (>97 % purity) (Polyphenols AS), and six phenolic acids purchased from Sigma-Aldrich Co.
Human study
Trial design and participant enrolment
The present study was conducted according to the guidelines laid down in the Declaration of Helsinki and all procedures involving human participants were approved by the Research Ethics Board of the University of Guelph (16MR006). Written informed consent was obtained from all subjects/patients. The clinical trial was registered (NCT02840357) at ClinicalTrials.gov (https://clinicaltrials.gov/ct2/show/NCT02840357?term=02840357&draw=2&rank=1).
A randomised, single-blind parallel-arm study was conducted at the Human Nutraceutical Research Unit, at the University of Guelph, Ontario from June 2016 to September 2017. The trial ended when all recruited eligible participants finished the intervention and in order to end the research activities within the funding agency timelines.
Participants were recruited from Guelph, Ontario, and the surrounding area through various channels. The study inclusion criteria were age 18–70 years; BMI ≥ 25 kg/m2 and/or waist circumference ≥102 cm (men) and ≥88 cm (women); serum hs-CRP over 1·0 mg/l (based on the American Heart Association(Reference Ridker35)); stable (>3 months) and consistent use of any prescribed medications and/or supplements; non- to moderate alcohol consumption; not taking antibiotics within the last 3 months or planning to take antibiotics within the next 6 months. Exclusion criteria were smoking, pregnancy or breast-feeding, lifetime history of any acute medical event, including but not limited to, heart attack or stroke; recent diagnosis (within 6 months) of a serious medical condition; any disorder of the gastrointestinal system or food intolerances, any food allergies; and use of anthocyanin-specific supplements. Eligibility was assessed through a phone-screening questionnaire and in-person screening visit where a fasted blood sample was collected by venepuncture for determination of the study primary outcome hs-CRP by an accredited medical laboratory (LifeLabs, Ontario, Canada). All eligible and interested participants provided written informed consent. A sample size calculation (OpenEpi, version 3, open source calculator; http://www.openepi.com/SampleSize/SSMean.htm) using CI (95 %), power (80 %) and sd of 20 % indicated that thirty-two participants (sixteen per group) would be required, based on a 20 % change in CRP in one group compared with the other, as estimated in previous studies, that is, Lefevre & Jonnalagadda(Reference Lefevre and Jonnalagadda36) for a whole-grain intervention and Zhu et al.(Reference Zhu, Ling and Guo37) for an anthocyanin supplement intervention.
Study intervention and procedures
Participants were assigned randomly following stratified block randomisation procedures (computer-generated list) to one of two groups; bran-enriched whole PW (intervention) or bran-enriched whole RW (control) convenience bars, aiming for balanced group sizes and equal distribution of male and female participants between groups. Participants were enrolled into the study after approval of the principal investigator and assigned to treatment group by the lead study coordinator. The PW and control bars differed in colour, with the PW products being darker, but not obviously purple, such that participants could not know which treatment group they were allocated to. To maintain blinding, study coordinators other than the lead coordinator distributed coded products to participants throughout the intervention. Data were also re-coded from participant number to help obscure treatment allocation throughout analysis by the lead coordinator and others. Participants were instructed to limit their consumption of high anthocyanin/phenolic content foods (e.g. coffee, berries, wine, black tea) to a maximum of two servings per d for a 10-d run-in period and throughout the intervention. They were asked to replace four daily servings of grain food products with the four servings (160 g total, based on Canada’s Food Guide guidelines)(38) of whole-wheat bars for 8 weeks. Participants attended study visits on days 1, 29 and 57 and three additional check-in visits to ensure compliance to study protocols and to receive study products. Two days prior to each study visit, participants were requested to avoid consuming all high anthocyanin/phenolic acid-containing foods, alcoholic beverages and over-the-counter medications and supplements (unless prescribed by a healthcare professional) and to refrain from participating in strenuous physical activity. For 24 h prior to each study visits, participants were asked to adhere to their typical diet and to consume the same foods, supported by providing participants a copy of their food intake from their first visit. Participants were also asked to observe a 12- h overnight fast where no intake of food or drink was permitted, except water, prior to each study visit. For premenopausal female participants, study visits were scheduled within the proliferative phase (approximately days 6–13 of the menstrual cycle). At days 1, 29 and 57, participants provided fasted venous blood samples and had body weight, height, waist circumference and blood pressure determined(Reference Gamel, Wright and Tucker30) and received study products. Participants completed gastrointestinal questionnaires to track the incidence of any symptoms (i.e. abdominal discomfort, bloating, cramping, rumbling, flatulence and bowel movement number, urgency and consistency) in the 24 h prior to each visit and provided 3-d food records for 2 week days and 1 weekend day in the week prior to each study visit. Participants were instructed to store the wheat bars frozen and to consume the daily portion periodically throughout each day, in place of other grain servings. Compliance was monitored based on returned empty bags and unconsumed bars and using a daily study diary that also captured details (e.g. illness, injury, new medication/supplement use), which were discussed with a study coordinator.
Collection and analysis of blood samples
On days 1, 29 and 57, fasting blood samples were collected into BD Vacutainer blood tubes by an approved phlebotomist through an antecubital vein in the arm. For determination of hs-CRP, a blood sample (6 ml) was collected in an SST tube with no anti-coagulant, allowed to clot at room temperature for 30 min and serum separated by centrifugation at 2600 rpm (572 g at mean r) for 10 min at 4°C. Blood was otherwise collected in heparin-coated tubes and centrifuged at 3000 rpm (665 g at mean r) for 10 min at 4°C. Plasma was sent directly to a medical laboratory for analysis, as below, or aliquoted and stored at –80°C, until analysis. For the anthocyanin and phenolic acid metabolite analyses, plasma was acidified with 50 % formic (50 µl/1 ml plasma) prior to –80°C storage in light-sensitive polypropylene tubes.
Fasting plasma TAG, total cholesterol, LDL- and HDL-cholesterol, glucose and insulin concentrations and serum hs-CRP were determined by Lifelabs. The homeostatic model assessment of insulin resistance (HOMA-IR 2) was calculated using the online calculator https://www.dtu.ox.ac./homacalculator/uk according to Levy et al.(Reference Levy, Matthews and Hermans39). Commercial kits were used to determine plasma levels of oxidised LDL (hydroxynonenal) (Ox-LDL, Cell Biolabs Inc., no. STA-389), adiponectin (Affymetrix eBioscience, no. BMS2032) and glutathione (GSH, Cayman Chemical, no. 703002). IL-4, IL-6, IL-10 and TNF-α were determined using Invitrogen ELISA kits (Thermo Fisher Scientific Inc., no. EH3IL4, KHC0062 and EH3TNFA, respectively). IL-10 data were not analysed since 80 % of sample values fell below the kit’s limit of detection (LOD). Intra- and inter-assay CV were between 2·4–3·7 % and 2–4·5 %, respectively. Plasma samples were analysed for anthocyanins, phenolic acids and metabolites by ultra-high-pressure liquid chromatography-MS (UPLC-MS, Waters Acquity UPLC H-Class with ACQUITY column manager and ACQUITY-Photometric detector), as previously described(Reference Gamel, Wright and Tucker30) and with a cyanidin-3-glucoside detection limit of 5 ng/10 µl injected volume.
Data and statistical analysis
Statistical analysis was conducted using IBM SPSS Statistics for Windows, version 25.0.: IBM Corp. (2017) and P < 0·05 significance level. Data are presented as mean values and standard deviations, unless otherwise indicated. Before analysis, extreme outliers (> mean ± 3-fold of sd) were eliminated(Reference Leys, Ley and Klein40). This included a single value of TNF-α and the complete dataset for one participant who had extreme glucose and lipid concentrations. Where values of plasma hs-CRP (1 % of values), IL-4 (20 % of values) and the metabolites (12 % of values) below the assays’ detectable limits, these data points were replaced by one half of the LOD (LOD/2)(Reference Lambert, Peterson and Terpenning41).
The assumption of homogeneity of variances between the two groups was verified prior to each ANOVA using Levene’s test, and the assumption of sphericity was verified in all cases of repeated-measures ANOVA. Unless otherwise stated, these assumptions were valid. Where homogeneity of variances was violated, data were log-transformed, and, where sphericity was violated, the Greenhouse–Geisser correction was applied. Independent t tests were used to determine differences in each parameter between the two treatments at baseline (day 1). ANCOVA was used to determine differences between the treatments at day 57 using day 1 as a covariate. Repeated-measures ANOVAs were used to evaluate the effect of days in the pooled dataset and within each treatment group, separately, as well the overall interaction of days × treatment. Specifically, when days was significant in the model, the Bonferroni adjustment was applied to assess differences between pairs of days 1, 29 and 57.
Results
Product characteristics
The nutrient and polyphenol compositions of the bars are presented in Table 1. The daily portion of four servings of the PW bars provided 1·65 mg anthocyanins. As expected, there were no anthocyanins detected in the RW bars. On the other hand, the whole PW and RW bars provided similar amounts of phenolic acids (i.e. 215 and 190 mg/4 servings, respectively), with ferulic being the dominant species in both. Both bars were also enriched in total dietary fibre because of the inclusion of bran. They contained similar levels of soluble fibre, although the PW bars were significantly higher (approximately 2 g/d) in insoluble fibre. Comparable bar caloric energy and available carbohydrate compositions were prioritised and successfully achieved.
Nutrient, anthocyanin and phenolic acid contents of whole purple and whole regular wheat convenience bars*
(Mean values and standard deviations, wet weight basis, n 3)
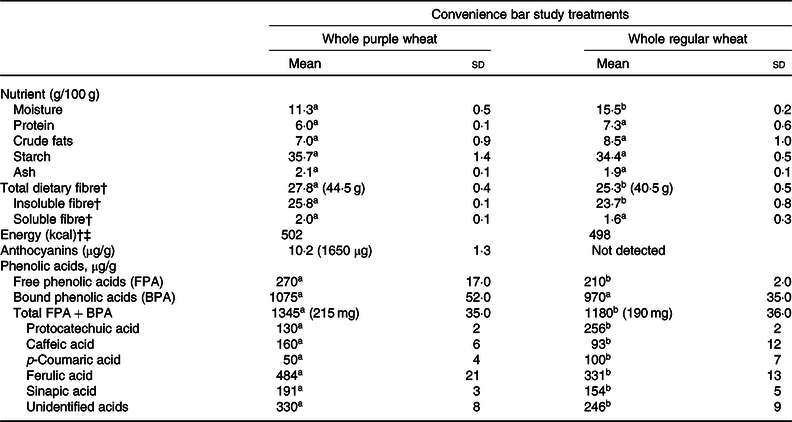
a,b Within a row, values with unlike superscript letters are significantly different (P < 0·05).
* Total amount in the daily 4–40 g servings is indicated in parentheses.
† Energy content calculated based on proximate analysis.
‡ To convert energy values from kcal to kJ, multiply by 4·184.
Participant study diaries
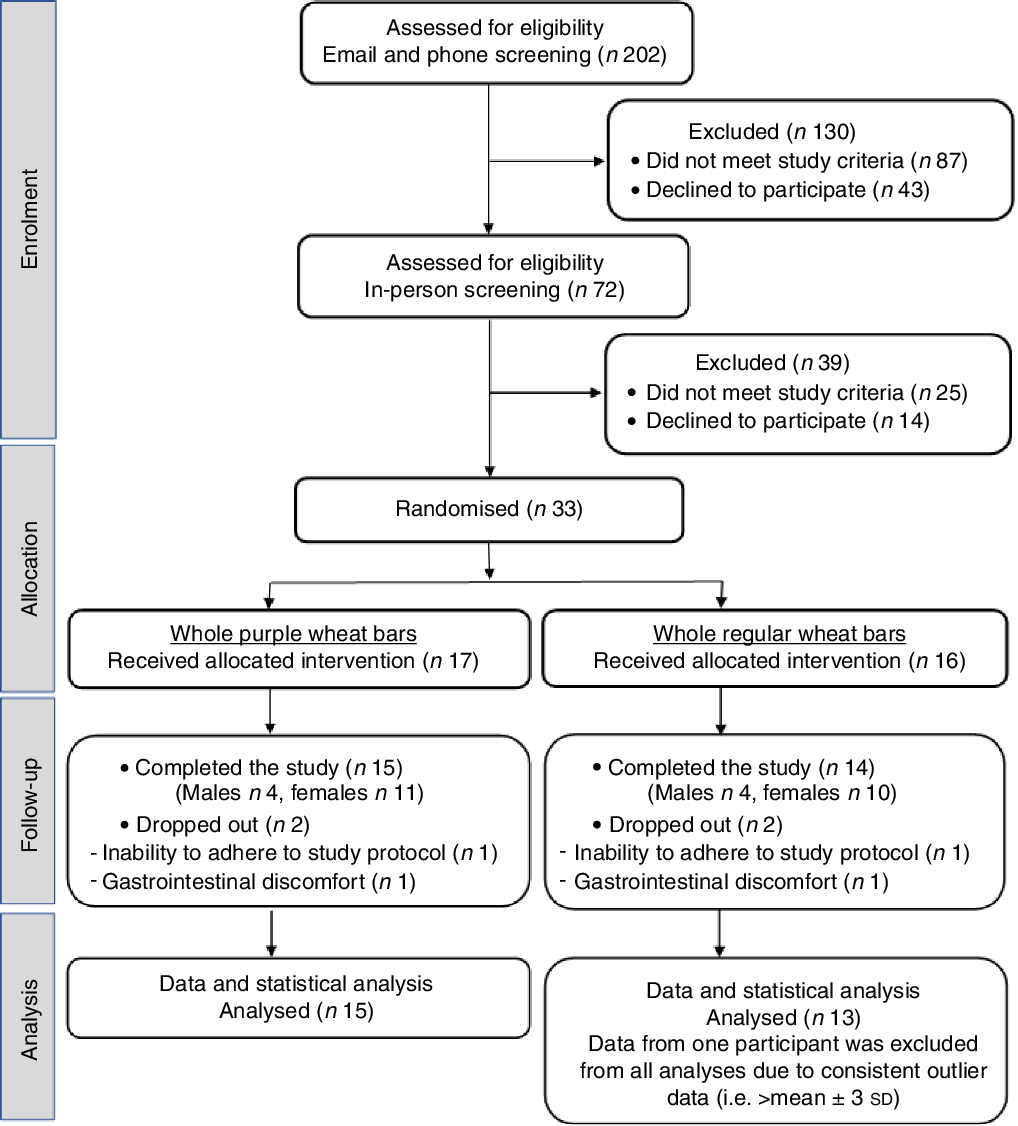
The CONSORT flow diagram (Fig. 1) shows that thirty-three participants were randomised to either the PW (n 17) or RW (n 16) groups. Daily study diaries indicated that participants were compliant in limiting anthocyanin-rich foods and beverages and regularly consumed the bars, that is, overall rates of bar consumption were 99·4 and 97·3 % for PW and RW participants, respectively. According to food diaries kept for three 3-d periods, preceding days 1, 29 and 57, there were no significant differences between the groups for any period. Table 2 shows the pooled analysis of nutrient intakes. There was an effect of the intervention regardless of treatment group, whereby, over time, average intakes of total carbohydrates, total dietary fibre and total sugars increased, and average intakes of saturated fat and protein intakes decreased. Intakes were consistent over time for energy, total fat and cholesterol (Table 2). Participants consumed an average daily energy intake of 8544 (sd 2272) kJ (2042 (sd 543) kcal) across the entire study duration, which is in line with a healthy energy intake for this demographic.
CONSORT participant flow diagram.
Average daily energy and nutrient intakes based on 3-d food records preceding days 1 (baseline), 29 and 57
(Mean values and standard deviations, n 29)
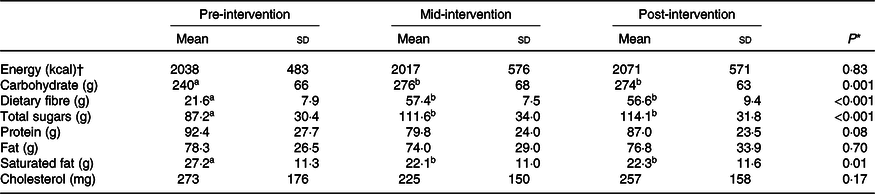
a,b Within each row, values with unlike superscript letters are significantly different (P < 0·05).
* Repeated-measures ANOVA P comparing between days.
† To convert energy values from kcal to kJ, multiply by 4·184.
Retrospective gastrointestinal questionnaires were completed for three 24-h periods throughout the study and revealed that, although there were no differences in symptoms between the groups pre-intervention or between PW and RW (P > 0·05; data not shown), both interventions significantly increased participant perception of stomach rumbling (P = 0·05), flatulence (P = 0·02) and bowel movement urgency (P < 0·001) and number (P < 0·001), with improvements in bowel movement consistency (P = 0·04), over time.
Baseline (day 1) and treatment × day interactions
There were no observed baseline (day 1) differences between the PW and RW groups for any parameter (Table 3). Furthermore, there were no treatment × day interaction effects for any parameter investigated (Table 4).
Outcome measures at days 1 (baseline), 29 and 57 for participants in the purple and regular wheat groups*
(Mean values and standard deviations)
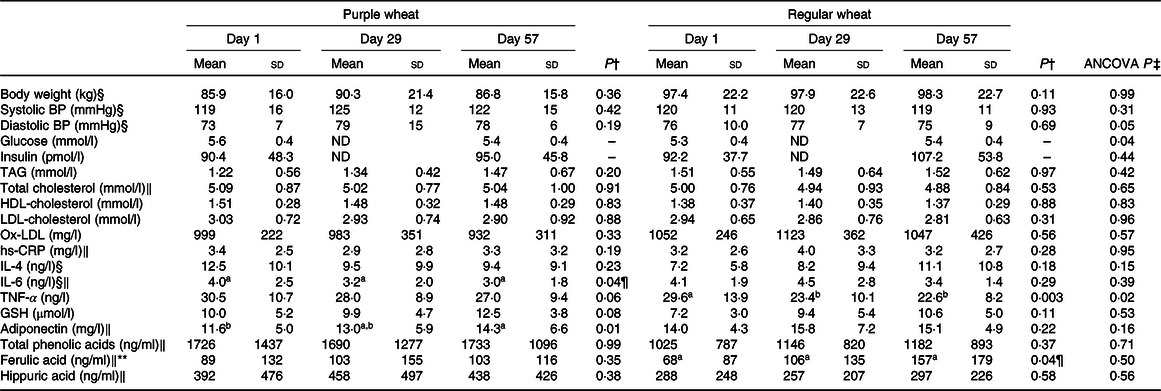
BP, blood pressure; ND, not determined; Ox-LDL, oxidised LDL; hs-CRP, high-sensitivity C-reactive protein.
a,b Unlike superscript letters indicate significant difference (P < 0·05) between days within each group.
* Mean of data for group participants and standard deviations (n 15 for purple wheat, except for TNF-α where n 14; n 13 for regular wheat group.
† Repeated-measures ANOVA P comparing between days within each wheat category.
‡ Significant difference in ANCOVA between purple and regular wheat groups at day 57, treating day 1 as a covariate (P < 0·05).
§ In the purple wheat group, the assumption of sphericity was violated so the Greenhouse–Geisser correction was applied.
‖ In the regular wheat group, the assumption of sphericity was violated so the Greenhouse–Geisser correction was applied.
¶ Although the overall difference between days was significant (P < 0·05), pairwise post hoc comparisons were not statistically different.
** Assumption of homogeneity was violated at day 57, treating day 1 as a covariate, so data were log-transformed prior to analysis. Arithmetic means are shown.
Pooled participant data at days 1 (baseline), 29 and 57*
(Mean values and standard deviations)
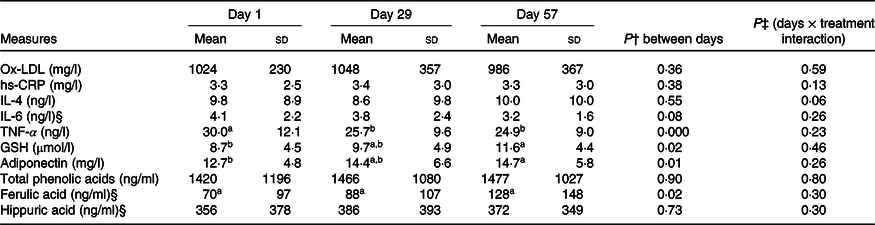
Ox-LDL, oxidised LDL; hs-CRP, high-sensitivity C-reactive protein.
a,b Unlike superscript letters indicate significant difference (P < 0·05) between days.
* Mean of pooled data for all participants and standard deviations (n 28, except for TNF-α where n 27).
† Repeated-measures ANOVA P comparing between days.
‡ Significant day × treatment interaction (P < 0·05).
§ Assumption of sphericity was violated, so the Greenhouse–Geisser correction was applied.
Anthropometrics, plasma glucose, insulin and lipids
After 8-week consumption, only plasma glucose decreased significantly in PW compared with RW (P = 0·04). There were no differences between the PW and RW groups for anthropometrics, insulin, adiponectin or lipids (Table 3). BMI was not significantly different between or within groups, and from day 1 to 57 average BMI values were 30·7 (sd 3·7) to 30·9 (sd 3·6) kg/m2 with PW, and 27·2 (sd 4·5) to 26·8 (sd 4·9) kg/m2 with RW (P > 0·05). HOMA-IR was also unchanged within each group and between groups (P > 0·05). Average calculated values for HOMA-IR for day 1 and day 57, respectively, were 1·7 (sd 0·9) to 1·8 (sd 0·8) with PW, and 1·7 (sd 0·7) to 2·0 (sd 1·0) with RW. None of these parameters were significantly different in the pooled participants (data not shown).
Inflammatory markers
Within the PW group, adiponectin increased 23 % (P = 0·01) from days 1 to 57 (Table 3). Also, within the PW group only, IL-6 decreased significantly (P = 0·04) at 8 weeks and there was a trend for a reduction in TNF-α (P = 0·06; Table 3). Within the RW group, positive effects on TNF-α were observed at 4 and 8 weeks, with significant reductions (P = 0·003) observed at both time points. In the pooled participants, both adiponectin and TNF-α were significantly different over time (Table 4).
Participant serum hs-CRP levels were not significantly affected by either PW or RW consumption. The only difference in inflammatory markers observed between the groups was in TNF-α (P = 0·02; Table 3).
Oxidative stress markers
Plasma antioxidant activity was assessed by tracking changes in the oxidative stress markers GSH and ox-LDL. Within each group, and between groups, there were no changes in either parameter (Table 3). Within the pooled data (n 29), a significant 33 % increase in plasma GSH level was observed after 8 weeks (Table 4).
Plasma anthocyanins and phenolic acid metabolites
No parent anthocyanins were detected in the plasma of any participants, after 4 or 8 weeks of consumption of PW bars that contributed 1·65 mg of daily anthocyanins. Six phenolic acid metabolites, including ferulic and hippuric acids, were detected in both groups at each time point. After 8 weeks, there was a 2-fold increase (P = 0·04) in ferulic acid with RW and plasma ferulic acid also increased in the pooled data (P = 0·02; Table 4), but this was unchanged with PW and no changes were observed for hippuric acid. There also were no differences between the PW and RW groups in terms of total phenolic acids, ferulic acid or hippuric acid (Table 3).
Discussion
This is the first human intervention study to investigate the effects of consuming whole PW and RW in individuals with evidence of chronic inflammation, and only the second human study of PW to our knowledge. The study had a food replacement protocol with a run-in period and diet controls, food and energy intake records, and monitoring of gastrointestinal symptoms. Participants in both groups maintained their body weight, suggesting they were successful in substituting the daily 2092 kJ (500 kcal) serving of bars for other servings of refined grains or snack foods. Participant groups were equivalent at baseline for all outcome measures. By including individuals over a wide age range (25–69 years) and with overweight and obese BMI (25·3–56·9 kg/m2), the generalisability of the results to the general North American population is relatively high. The inclusion of individuals with stable medical conditions, so long as medication use was consistent, was also a pragmatic decision. Overall, the study participants possessed different CVD risk factors, although all had evidence of low-grade chronic inflammation. At baseline, participant serum hs-CRP levels ranged from 1·03 to 10·84 mg/l (average of 3·3 (sd 2·5) mg/l), that is, levels associated with moderate to high risk of CVD(Reference Ridker35). Roughly 50 % of the study participants had two CVD risk factors according to the American Heart Association classifications, and 20 and 30 % had three and four, respectively.
Plasma analysis did not indicate the presence of intact anthocyanins in participants’ blood. This may be attributed to PW’s low anthocyanin content, low absorption and/or rapid metabolism. Our previous study also did not detect any anthocyanins or main metabolites in the plasma of healthy individuals within 8 h of consumption of PW bars and crackers which contained 6·7 mg anthocyanin, although there was evidence of urinary excretion (18–22 ng/ml)(Reference Gamel, Wright and Tucker30). In the present work, it was hypothesised that, in spite of the low anthocyanin level in the PW products, with regular consumption, accumulation and cumulative physiological effects related to intact anthocyanins or their metabolites would occur. Plasma anthocyanin accumulation was not observed, but there was evidence of a cumulative physiological benefit of PW, as below. The relatively low level of anthocyanins in the PW product is a limitation of the study, as is the high dose of wheat products (i.e. four grain servings). Moreover, both products contained high levels of dietary fibre and this may have partly driven the metabolic effects observed. To enrich the PW bars in anthocyanins to the highest extent possible, bran was used, resulting in participants in both groups consuming >40 g dietary fibre, daily. This serving of PW bars was previously well tolerated by healthy male and female study participants who consumed them in one setting(Reference Gamel, Wright and Tucker30). In the present study, one participant dropped out from each group, related to gastrointestinal upset. Indeed, there were some perceived gastrointestinal symptoms and overall improvements in bowel movement consistency over time in both groups. Future functional food developments could explore de-branning methods that further enrich bran anthocyanin content(Reference Zanoletti, Abbasi Parizad and Lavelli42) in order to minimise the required serving size and should also consider effects of food matrix(Reference Gamel, Wright and Pickard29) and processing(Reference Kadiri43). As it stands, the present study adds to the evidence that high-fibre food products based on whole-grain wheat can shift the metabolic profile in at risk adults, without reductions in body weight when a replacement strategy is used.
The main metabolites detected in participants’ plasma with RW and PW consumption were ferulic and hippuric acids. Ferulic acid is the main phenolic acid found in wheat and especially of the bran fraction(Reference Laddomada, Caretto and Mita44). Hippuric acid is a urine and plasma metabolite seen after coffee consumption(Reference Stalmach, Mullen and Barron45). Dietary records thoroughly assessed for non-compliance did not indicate that observations of hippuric acid were associated with particular foods or beverages. Interpersonal variation based on genetic and/or background diet could be important factors influencing intervention impact. Prospective screening of plasma for detection of relevant compounds should be considered in human studies, as should faecal analysis, recognising that anthocyanins can alter and their metabolism can be altered by gut microbiota(Reference Tian, Tan and Chen46). There was some evidence of phenolic acid accumulation, that is, plasma ferulic acid increased in the pooled participants after 8 weeks, driven by RW consumption (P = 0·02; Table 3). Vitaglione et al.(Reference Vitaglione, Mennella and Ferracane9) reported that consumption of 70 g/d of 100 % whole-grain shredded wheat biscuits for 4–8 weeks by overweight and obese individuals resulted in a 4-fold increase in serum dihydroferulic acid and a 2-fold increase in faecal ferulic acid compared with refined wheat crackers or toasted bread, which showed no changes. In the present study, PW had higher levels of bound and total (free + bound) phenolic acids than RW. More work needs to be done to understand the metabolism of anthocyanins and phenolic acids derived from PW and should include analysis of other biological samples, for example, faeces, urine, breath.
Importantly, our findings support a role for whole-grain wheat interventions to improve plasma TNF-α after a 4-week period with significant decreases in the pooled data and RW group and a trend to decrease within the PW group (P = 0·06). Similarly, Vitaglione et al. (2015) observed significant reductions in plasma TNF-α after consumption of 70 g of whole-grain v. refined wheat products daily for 8 weeks by overweight and obese participants who maintained a habitual diet devoid of whole-grain cereals and cereal bran-containing products, low fruit and vegetables intake and a low level of physical activity(Reference Vitaglione, Mennella and Ferracane9). Price et al.(Reference Price, Wallace and Hamill12) compared the effects of a high-wheat aleurone diet (27 g aleurone/d) v. control in healthy, older, overweight participants (n 79) for 4 weeks and found no changes in terms of inflammatory markers studied or plasma antioxidant status. The ability to modify plasma TNF-α within 4 weeks, along with participant weight maintenance, is a strength of this intervention.
Whole-grain interventions of wheat are limited but have suggested a role in protecting circulating adiponectin levels compared with refined grains(Reference Kirwan, Malin and Scelsi47). In the present study, improvements in plasma adiponectin were seen in the pooled data and adiponectin and IL-6 improved in the PW group. The preservation of adiponectin in RW and increase in PW, while body weight was maintained during a high-carbohydrate diet, reveals a benefit of the whole-wheat high-fibre intervention. That said, differences in hs-CRP were not observed. While human studies of PW, specifically, do not exist, there have been investigations of anthocyanin-rich supplements, as reviewed by meta-analysis. Comparing seventeen human intervention trials of anthocyanin-rich supplements from mostly fruits (average of >200 mg/d), the evidence favours anthocyanin intake for improving HDL-cholesterol, LDL-cholesterol, apo A1, apo B, TAG and TNF-α, with no benefit on total cholesterol, IL-6 or hs-CRP, compared with placebo(Reference Shah and Shah48). Therefore, our results showing a PW-specific effect on IL-6 and adiponectin are unique and may be attributed to the whole-grain wheat intervention. Grain-derived anthocyanin supplements have been studied, previously. For example, 6-month supplementation with 10 g daily black rice fraction powder significantly reduced hs-CRP (1·26 mg/l change), as well as plasma total antioxidant capacity and CVD risk factors in patients (n 30) with CHD(Reference Wang, Han and Zhang Phd27). The present study saw no changes in hs-CRP, potentially because it was underpowered, with high inter-participant variability in a parallel-arm design, and used a relatively low dose of anthocyanins. However, the present results are in line with a cross-sectional study of 938 healthy men and women showing that whole-grain intake was not associated with reductions in the inflammatory markers CRP and IL-6(Reference Jensen, Koh-Banerjee and Franz49), and with an intervention study by Andersson et al.(Reference Andersson, Tengblad and Karlströ50) that found that daily consumption of 112 g whole-grain products by 30 healthy moderately overweight adults for two 6-week periods did not affect hs-CRP or IL-6. Hoevenaars et al.(Reference Hoevenaars, Esser and Schutte8) showed that 12-week whole-grain wheat consumption lowered fasting CRP compared with refined wheat, in fifty overweight and obese participants with hypercholesterolaemia and noted the challenges with observing improvement in very healthy participants. While whole-grain consumption has been associated with lower hs-CRP levels in older women and individuals with certain health conditions(Reference Gaskins, Mumford and Rovner51), this is not supported by all studies, including the present one. hs-CRP plays an important diagnostic role but is not specific to only chronic inflammation and is therefore a challenging study marker. The value of measuring various circulating inflammatory markers in intervention studies is evident.
According to the pooled analysis, consumption of the RW and PW products improved plasma oxidative status. A high correlation was recently reported between antioxidant activity of coloured wheat genotypes, blue wheat and PW, and their contents of total phenolics and anthocyanins(Reference Sytar, Bosko and Živčák52), with PW flagged as a promising functional food ingredient. There have been many in vitro and several in vivo studies that support a role for cereal anthocyanins to improve antioxidant capacity, many of which have been thoroughly reviewed(Reference Zhu25). Most in vitro studies have been conducted using ingredients or laboratory prepared food products. Previously, our team assessed the acute plasma and urine bioavailability and plasma antioxidant capacities of PW bars and crackers in healthy adults and showed no effect on 2,2’-azino-bis(3-ethylbenzothiazoline-6-sulfonic acid) or 1,1-diphenyl-2-picrylhydrazyl radical scavenging activities(Reference Gamel, Wright and Tucker30). In the present study, levels of GSH did not increase significantly in the PW (P = 0·08) or RW (P = 0·11) groups but did increase in the pooled dataset (P = 0·02), suggesting a cumulative effect of whole wheat on this key intracellular thiol that regulates cell redox status(Reference Hakuna, Doughan and Escobedo53), reduces cellular damage from oxidative stress and prevents development of CVD(Reference Shimizu, Kiyohara and Kato54). This agrees with other whole-grain intervention studies showing improvements related to antioxidant activity of wheat bran phenolics(Reference Yu, Zhou and Parry55–Reference Wang57).
There were no changes in insulin or HOMA-IR in the PW, RW or pooled groups. This is consistent with a previous 6-week whole-grain wheat-based diet intervention study in healthy overweight adults(Reference Andersson, Tengblad and Karlströ50) and 12-week whole-grain wheat intervention in overweight and obese adults with hypercholesterolaemia(Reference Hoevenaars, Esser and Schutte8). However, fasting glucose was significantly lowered with consumption of the PW v. RW (P = 0·04). This result is in agreement with a human study where black-grained wheat positively influenced glycated albumin and certain markers of inflammation v. non-coloured control foods in adults with type 2 diabetes(Reference Liu, Qiu and Yue28). It is also consistent with in vitro evidence that anthocyanins from purple rice bran increased glucose uptake and inhibited the activity of the starch digestion enzyme glucosidase(Reference Boue, Daigle and Chen58). Therefore, the PW intervention showed potential to improve glycaemic management that was not seen in the RW or pooled data, that is, beyond a whole-grain wheat effect. Aside from the low level of anthocyanins present in the PW products, these contained higher levels of insoluble fibre (approximately 2 g/d, but the same level of soluble fibre) suggesting colonic fermentation may have contributed to the augmented differences, although this requires further study.
Conclusion
Consumption of whole PW and RW convenience bars for 8 weeks by overweight and obese adults with chronic inflammation induced modest and more pronounced reductions in plasma TNF-α in the pooled and RW participants, respectively. Plasma IL-6 and fasting glucose concentrations were reduced significantly only in the PW group. Both groups had comparable levels of plasma phenolic metabolites and oxidative stress markers at baseline and these remained unchanged with 4 and 8 weeks of RW product consumption. When data from both groups were pooled, improved plasma TNF-α, GSH and adiponectin were observed, pointing to the benefits of a high-fibre, whole-grain intervention. In general, these results support that 8-week consumption of whole-grain wheat products confers positive health impacts in terms of inflammation and oxidative stress, with modestly greater effects for the PW variety.
Acknowledgements
The authors thank M. Deschner, head of R&D team at Infra-Ready Ltd, for assisting in preparing the wheat bars for the clinical trial. Special thanks to the study participants, students L. Barnes, N. Di Ilio, H. Szczepanski and D. Trang-Thompson who assisted with the human study activities, statistician N. Hafiz and phlebotomy team members P. Sathasivam and J. Turgeon.
The authors thank the Canadian Food Innovation Cluster, Agriculture and Agri-Food Canada (AAFC) and InfraReady Products Ltd, Saskatoon, SK for providing financial support.
T. H. G., E.-S. M. A., M. P., A. J. T. and A. J. W. designed research; T. H. G., E.A., S. M. P., K. F., C. D. O., A. D. and A. J. W. conducted research; T. H. G. and I. R. conducted sample analysis; T. H. G., A. J. T. and A. J. W. managed and conducted statistical analysis; T. H. G., E.-S. M. A., A. J. T. and A. J. W. analysed data, wrote the paper and had primary responsibility for final content. All authors read and approved the final manuscript.
Mark Pickard is President of InfraReady Products Ltd.


