


1. Introduction
Standard hydrodynamic turbulence exhibits forward cascading whereby kinetic energy cascades from large scales (small wavenumbers) to smaller scales (larger wavenumbers) (Kolmogorov Reference Kolmogorov1941). This also happens in decaying turbulence, except that the rate of energy transfer to smaller scales is here decreasing with time (Batchelor Reference Batchelor1953; Saffman Reference Saffman1967). In magnetohydrodynamic (MHD) turbulence, the situation is in many ways rather different. This is primarily owing to magnetic helicity (Hosking & Schekochihin Reference Hosking and Schekochihin2021), which is a conserved quantity in the absence of magnetic diffusivity (Woltjer Reference Woltjer1958). Magnetic helicity is an important property of MHD turbulence that is not shared with hydrodynamic turbulence, even though there is kinetic helicity that is also an invariant if viscosity is strictly vanishing (Moffatt Reference Moffatt1969). However, this is no longer true when the viscosity is finite (Matthaeus & Goldstein Reference Matthaeus and Goldstein1982). This is because kinetic helicity dissipation occurs faster than kinetic energy dissipation, whereas magnetic helicity dissipation occurs more slowly than magnetic energy dissipation for finite magnetic diffusivity (Berger Reference Berger1984).
The importance of magnetic helicity conservation has been recognized long ago by Frisch et al. (Reference Frisch, Pouquet, Leorat and Mazure1975) and Pouquet, Frisch & Leorat (Reference Pouquet, Frisch and Leorat1976) in cases when it is finite on average. In that case, it leads to the phenomenon of an inverse cascade. In forced turbulence, this means that part of the injected energy gets transferred to progressively larger scales (Brandenburg Reference Brandenburg2001). This process is at the heart of large-scale dynamos, which can be described by what is known as the alpha effect (Steenbeck, Krause & Rädler Reference Steenbeck, Krause and Rädler1966), and is relevant for explaining the large-scale magnetic fields in stars and galaxies (Parker Reference Parker1979). In decaying MHD turbulence, on the other hand, inverse cascading leads to a temporal increase of the magnetic energy at the smallest wavenumbers. A similar phenomenon has never been seen in hydrodynamic turbulence, where the spectrum at small $k$ remains unchanged.
Even when the magnetic helicity vanishes on average, there can still be an inverse cascade. In that case, it is no longer the mean magnetic helicity density whose conservation is important, but the magnetic helicity correlation integral, also known as the Hosking integral (Hosking & Schekochihin Reference Hosking and Schekochihin2021; Schekochihin Reference Schekochihin2022; Zhou, Sharma & Brandenburg Reference Zhou, Sharma and Brandenburg2022). In non-helical turbulence, the possibility of inverse cascading with an increase of spectral magnetic energy at small wavenumbers was originally only seen for steep initial magnetic energy spectra, $E_{M}(k)\propto k^4$ , where $k$
 is the wavenumber. Here, $E_{M}(k)$
 is defined as the spectral magnetic energy per linear wavenumber interval and is normalized such that $\int E _{M}(k,t)\,{\rm d} {} k=\langle \boldsymbol {B}^2\rangle /2\equiv {\mathcal {E}}_{M}(t)$
 is the mean magnetic energy density. Those $k^4$
 spectra were motivated by causality arguments, requiring that magnetic field correlation functions strictly vanish outside the light cone (Durrer & Caprini Reference Durrer and Caprini2003). Such a field can be realized by a random vector potential that is $\delta$
 -correlated in space, i.e. the values of any two neighbouring mesh points are completely uncorrelated. The magnetic vector potential $\boldsymbol {A}$
 therefore has a $k^2$
 spectrum, which implies that the magnetic field $\boldsymbol {B}={\boldsymbol {\nabla }}\times \boldsymbol {A}$
 has a $k^4$
 spectrum.
For the case of a shallower $E_{M}(k)\propto k^2$ spectrum, no inverse cascade has been found (Brandenburg et al. Reference Brandenburg, Kahniashvili, Mandal, Roper Pol, Tevzadze and Vachaspati2017; Reppin & Banerjee Reference Reppin and Banerjee2017). This was explained by the conservation of the magnetic Saffman integral (Brandenburg & Larsson Reference Brandenburg and Larsson2023), which constitutes the coefficient in the leading quadratic term of the Taylor expansion of the magnetic energy spectrum for small $k$
 .
.
The intermediate case of a $k^3$ spectrum may be realized during the electroweak epoch in cosmology due to a distribution of magnetic charges as shown in Vachaspati (Reference Vachaspati2021) and Patel & Vachaspati (Reference Patel and Vachaspati2022). The evolution of the magnetic field in this case is less clear. Reppin & Banerjee (Reference Reppin and Banerjee2017) reported weak inverse cascading, but it is not obvious whether this agrees with what should be expected based on the conservation of the Hosking integral, or whether it is some intermediate case in which the possible conservation of both the magnetic Saffman integral and also the Hosking integral can play a role. Investigating this in more detail is the purpose of the present work.
2. Preliminary considerations
2.1. Relevant integral quantities in MHD
Three important integrals have been discussed in the context of decaying MHD turbulence. The first two are the magnetic Saffman and magnetic Loitsyansky integrals (Hosking & Schekochihin Reference Hosking and Schekochihin2021)


respectively. Here, angle brackets denote ensemble averages, which we approximate by volume averages. The integrals (2.1) and (2.2) are analogous to those in hydrodynamics, but with $\boldsymbol {B}$ being replaced by the velocity $\boldsymbol {u}$
 . The third relevant quantity is the Hosking integral (Hosking & Schekochihin Reference Hosking and Schekochihin2021; Schekochihin Reference Schekochihin2022)

where $h=\boldsymbol {A}\boldsymbol {\cdot }\boldsymbol {B}$ is the magnetic helicity density. By defining the longitudinal correlation function $M_{L}(r)$
 through

the integrals $I_{\rm SM}$ and $I_{\rm LM}$
 emerge as the coefficients of the Taylor expansion of the magnetic energy (Subramanian Reference Subramanian2019). A similar expansion also applies to the magnetic helicity variance spectra (Hosking & Schekochihin Reference Hosking and Schekochihin2021).
For power spectra that decay sufficiently rapidly, a Taylor expansion of $(kr)^{-1}\sin kr$ gives
gives


Here, ${\rm Sp}(h)=(k^2/8{\rm \pi} ^3L^3)\oint _{4{\rm \pi} }|\tilde {h}|^2\,{\rm d} {}\varOmega _k$ is the shell-integrated spectrum in volume $L^3$
 , the tilde marks a quantity in Fourier space and $\varOmega _k$
 is the solid angle in Fourier space, so that $\int {\rm Sp}(h)\,{\rm d} {} k=\langle h^2\rangle$
 , and likewise for $\int {\rm Sp}(\boldsymbol {B})\,{\rm d} {} k=\langle \boldsymbol {B}^2\rangle$
 . The definition of shell integration implies that Parseval's theorem in the form $\langle h^2\rangle L ^3=\int |\tilde {h}|^2\,{\rm d} {}^3k/(2{\rm \pi} )^3$
 is obeyed. The magnetic energy spectrum is defined as $E_{M}(k,t)= {\rm Sp}(\boldsymbol {B})/2\mu _0$
 , where $\mu _0$
 is the magnetic permeability, but in the following, we measure $\boldsymbol {B}$
 in units where $\mu _0$
 is set to unity.
According to (2.5), ${\rm Sp}(\boldsymbol {B})$ seems to be constrained to having only even powers of $k$
 in the limit $k \to 0$
 . Furthermore, ${\rm Sp}(\boldsymbol {B}) \propto k^2$
 when $I_{\rm SM}$
 is finite and dominant, and likewise, ${\rm Sp}(\boldsymbol {B}) \propto k^4$
 when $I_{\rm LM}$
 is finite and dominant. The expansion in powers of $k$
 in (2.5) holds, however, only when the coefficients in the expansion are finite. This is the case if, for example, $M_{L}$
 is an exponentially decaying function of $r$
 . If, on the other hand, $M_{L}$
 decays only as a power law, the expansion does not hold since higher-order coefficients will be divergent. In such cases the leading-order behaviour in $k$
 may consist of odd (or even arbitrary) powers of $k$
 . A simple counterexample to the expansion in (2.5) is provided by considering the case $r^3M_L \propto r$
 for large $r$
 in (2.4). The specific case of ${\rm Sp}(\boldsymbol {B})\propto k^3$
 occurs for magnetic fields produced during electroweak symmetry breaking as discussed in Vachaspati (Reference Vachaspati2021) and Patel & Vachaspati (Reference Patel and Vachaspati2022).
2.2. Competition between $I_{\rm SM}$ and $I_{H}$


Using the Taylor expansion of the magnetic energy spectrum in (2.5), we see that, for initial Saffman scaling ($E_{M} \propto k^\alpha$ with $\alpha =2$
 ), the magnetic Saffman integral $I_{\rm SM}$
 must be non-vanishing. For initial Batchelor scaling ($\alpha =4$
 ), on the other hand, $I_{\rm SM}$
 vanishes initially and cannot play a role. In that case, the conservation of $I_{H}$
 becomes important and leads to inverse cascading, which then also implies the non-conservation of $I_{\rm SM}$
 (Hosking & Schekochihin Reference Hosking and Schekochihin2021).
Our question here is what happens in the intermediate case when $\alpha =3$ , a case already discussed in the supplemental material of Hosking & Schekochihin (Reference Hosking and Schekochihin2023). In that situation, ${\rm Sp}(\boldsymbol {B})$
 and ${\rm Sp}(h)$
 cannot be Taylor expanded and it is unclear whether there is then inverse cascading, because it would require violation of the conservation of $I_{\rm SM}$
 , or whether $I_{\rm SM}$
 is conserved, as for $\alpha =2$
 , and there is no inverse cascade.
2.3. Growth of spectral energy at small wavenumbers
We now want to quantify the growth of spectral energy at small wavenumbers. As in Brandenburg & Kahniashvili (Reference Brandenburg and Kahniashvili2017), we use self-similarity, i.e. the assumption that the magnetic energy spectra at different times can be collapsed on top of each other by suitable rescaling. Thus, we write

where $\xi _{M}(t)=\int k^{-1}E_{M}(k)\,{\rm d} {} k/{\mathcal {E}}_{M}$ is the integral scale and $\beta$
 depends on the relevant conservation law: $\beta =2$
 for Saffman scaling and $\beta =3/2$
 for Hosking scaling. This follows from the dimensions of the conserved quantity; see Brandenburg & Larsson (Reference Brandenburg and Larsson2023) for details. Next, we assume a certain initial subinertial range scaling, $E_{M}(k,0)=a_{\alpha 0} k^\alpha$
 , where $a_{\alpha 0}$
 is a coefficient determining the initial field strength. Thus, for $k\xi _{M}\ll 1$
 , we can write $\phi =a_{\alpha 0}(\xi _{M} k)^\alpha$
 , so
, so

Assuming power-law scaling, $\xi _{M}(t)\propto t^q$ , we get

From this, it follows that inverse cascading is possible for $\alpha >\beta$ , so $\alpha =2$
 and $\beta =3/2$
 could, in principle, still give rise to inverse cascade.
Following Brandenburg & Kahniashvili (Reference Brandenburg and Kahniashvili2017), who assumed a self-similar decay, we have $q=2/(\beta +3)$ , so $q=2/5$
 for $\beta =2$
 and $q=4/9$
 for $\beta =3/2$
 ; see table 1 for a comparison of different theoretical possibilities for the various exponents. Thus, unless $I_{\rm SM}$
 were conserved and there were therefore no inverse cascades, we must expect $\lim _{k\to 0}E_{M}(k,t)\propto t^{2/3}$
 for cubic scaling ($E_{M}\propto k^3$
 , i.e. between Saffman and Batchelor scalings) when the Hosking integral is conserved ($\beta =3/2$
 and $q=4/9$
 ). Let us also note that the case $\alpha >4$
 reduces to that of $\alpha =4$
 after a short time; see Appendix A. In the following, however, we present numerical simulations demonstrating that, for $3/2<\alpha \leq 4$
 , there is indeed inverse cascading with the expected rise of spectral magnetic energy at small values of $k$
 . We focus on the $\alpha =3$
 , but we also consider $\alpha \neq 3$
 to show that an inverse cascade always occurs for $\alpha >3/2$
 and that the Hosking integral is conserved.
Summary of $(\alpha -\beta )\,q$ for Saffman ($\alpha =2$
 ), Batchelor ($\alpha =4$
 ) and intermediate ($1.7\leq \alpha \leq 3$
 ) spectra under the assumption that either the Saffman integral is conserved ($\beta =2$
 ) or the Hosking integral ($\beta =3/2$
 ). Two non-integer values of $\alpha$
 are also considered. For $\alpha =6$
 , the subinertial range quickly becomes shallower with time, so the value $(\alpha -\beta )\,q=2$
 does not apply and is put in parentheses.

3. Simulations
We perform simulations in a domain of size $(2{\rm \pi} )^3$ , so the lowest non-vanishing wavenumber is $k\equiv k_1$
 . For most runs, we use $k_1=1$
 , but we use $k_1=0.02$
 for what we call runs A and D. For the run with $\alpha =3$
 (run B), as well as for all other runs, we assume that the initial magnetic energy spectrum peaks at $k_0=60\,k_1$
 , and therefore we consider spectral values for $k=k_1$
 to approximate the limit $k\to 0$
 . We use $N^3=2048^3$
 mesh points in all those simulations, so the largest wavenumber is 1024. This is similar to a run of Zhou et al. (Reference Zhou, Sharma and Brandenburg2022) with $\alpha =4$
 , which is here called run C. We also compare with some other runs that we discuss later. All simulations are performed with the Pencil Code (Pencil Code Collaboration et al. Reference Brandenburg, Johansen, Bourdin, Dobler, Lyra, Rheinhardt, Bingert, Haugen and Mee2021), which solves the compressible, isothermal equations using sixth-order finite differences and a third-order time stepping scheme.
In the numerical simulations, the sound speed $c_{s}$ is always chosen to be unity, i.e. $c_{s}=1$
 . The initial position of the spectral peak is at $k=k_0$
 and its numerical value is chosen to be 60 and the lowest wavenumber in the domain is unity, or, when using the data of Brandenburg & Larsson (Reference Brandenburg and Larsson2023), $k_0=1$
 and $k_1=0.02$
 , so that $k_0/k_1=50$
 . The magnetic diffusivity is $\eta \,k_1/c_{s}=2\times 10^{-6}$
 in runs B and C, so $\eta \,k_0/c_{s}=1.2\times 10^{-4}$
 . In some runs with $\alpha =2$
 , we also present results for larger values of $\eta$
 . The magnetic Prandtl number, i.e. the ratio of kinematic viscosity $\nu$
 to magnetic diffusivity, ${\rm Pr}_{M}=\nu /\eta$
 , is unity for most of our runs. For runs A and D, we have $\eta \,k_0/c_{s}=5\times 10^{-5}$
 and $\nu \,k_0/c_{s}=2\times 10^{-4}$
 , so ${\rm Pr}_{M}=4$
 .
.
Neither hyperviscosity nor magnetic hyperdiffusivity are used in any of our runs. Hyperviscosity and magnetic hyperdiffusivity are sometimes used to enhance the length of the inertial range. This would give rise to different scalings, as explained in the works of Hosking & Schekochihin (Reference Hosking and Schekochihin2021) and Zhou et al. (Reference Zhou, Sharma and Brandenburg2022). This led to the idea that a finite reconnection time could significantly prolong the decay (Zhou et al. Reference Zhou, Bhat, Loureiro and Uzdensky2019; Zhou, Loureiro & Uzdensky Reference Zhou, Loureiro and Uzdensky2020; Bhat, Zhou & Loureiro Reference Bhat, Zhou and Loureiro2021). However, this aspect will not be pursued in the present paper.
The initial magnetic field strength is characterized by the Alfvén speed $v_{A}\equiv B _{\rm rms}/\sqrt {\rho }$ , where $\rho$
 is the gas density. For most of our runs, we choose rather strong magnetic fields with an initial value $v_{A0}/c_{s}\approx 0.87$
 .
.
3.1. Inverse cascading
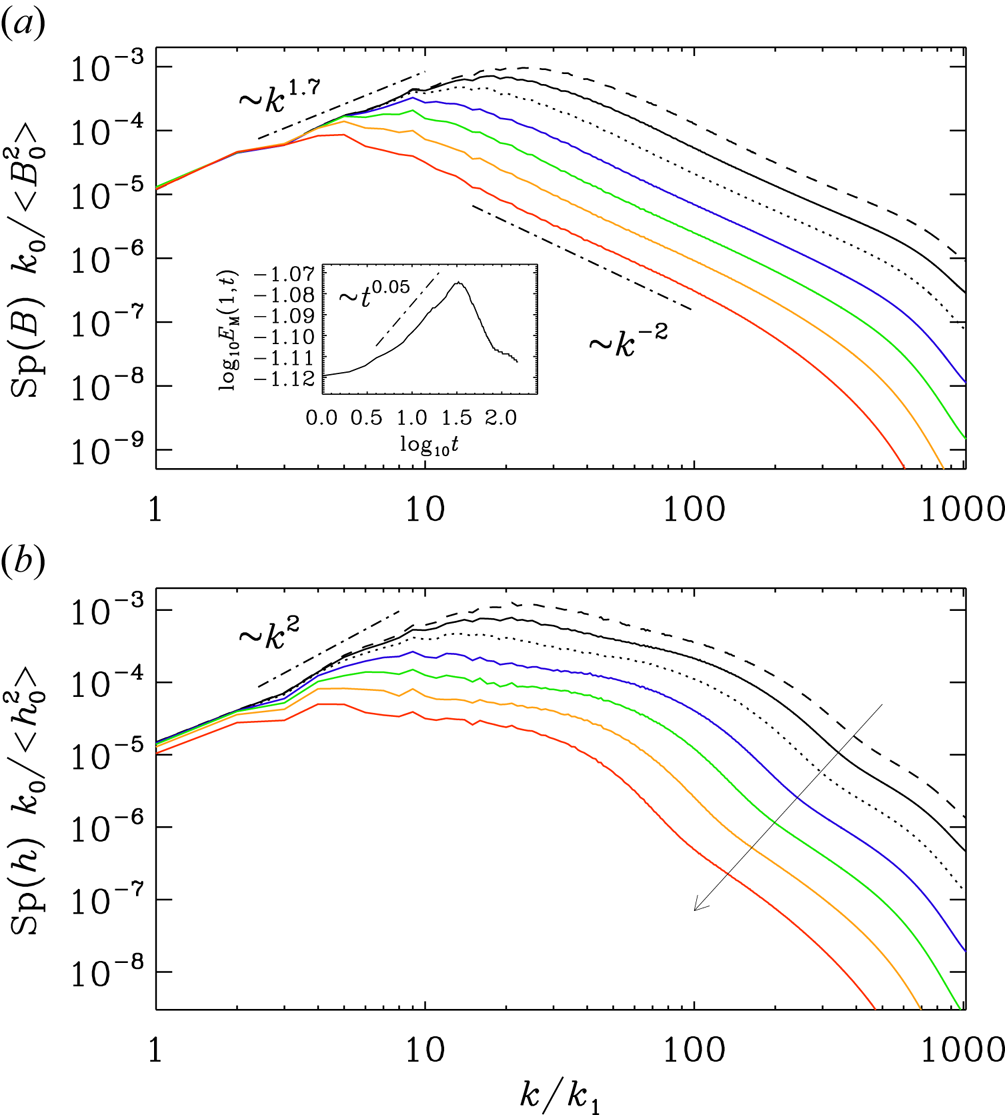
The results for the magnetic energy and helicity variance spectra are shown in figure 1, which shows inverse cascading with $E_{M}(k_1,t)\propto t^{2/3}$ and ${\rm Sp}(h)={\rm const.}{}$
 for $k\to 0$
 . The temporal increase at low $k$
 is compatible with table 1 for $\alpha =3$
 , $\beta =3/2$
 , $q=4/9$
 , and thus $(\alpha -\beta )\,q=2/3$
 . For general values $3/2\leq \alpha \leq 4$
 , the spectral increase at small $k$
 is proportional to $t^{4\alpha /9-2/3}$
 .
.
(a) Values of $E_{M}(k,t)$ and (b) ${\rm Sp}(h)$
 vs $k$
 for run B with $\alpha =3$
 at $t=2$
 , 5, 10, 25, 50, 100 and 200. The first three times are shown as black dashed, solid and dotted lines. The next four times are shown as solid blue, green, orange and red lines. The upward arrow in (a) indicates the direction of time. The inset in (a) shows that $E_{M}(k_1,t)\propto t^{2/3}$
 .
.

In the supplemental material of Hosking & Schekochihin (Reference Hosking and Schekochihin2023), it was proposed that the evolution for $\alpha \le 3$ deviates from self-similarity at intermediate times, and that the spectrum might show a ‘pile up’ to the left of the peak where it would locally be approaching $k^4$
 scaling. In fact, this was already proposed by Vachaspati (Reference Vachaspati2021, see his figure 16). While we cannot exclude the possibility of a short $k^4$
 range, figure 1(a) suggests that such a tendency could at best be identified at intermediate times. However, according to the phenomenology of Hosking & Schekochihin (Reference Hosking and Schekochihin2023), this range should become wider at later times. This is certainly not the case in the simulations, but there is the worry that, at late times, our results become affected by finite-size effects; see the blue and green curves for $t=25$
 and 50, respectively.
At early times, our simulations are poorly resolved and one might wonder whether they are then still reliable. Poor resolution can be seen by the lack of a proper dissipation range in figure 1(a) for $t=2$ . At later times, however, the simulations are certainly well resolved and inverse cascading is still found to persist. Thus, we argue that the initial phase does not adversely affect our results. Indeed, sufficiently small viscosity and magnetic diffusivity are crucial for being able to verify the expected Hosking scaling.
Next, we compare in figure 2 compensated spectra, which allow us to determine $a_{\alpha }={\rm Sp}(\boldsymbol {B})/2k^\alpha$ and $I_{H}\to 2{\rm \pi} ^2{\rm Sp}(h)/k^2$
 for small $k$
 , where the $k$
 -dependence of those compensated spectra is approximately flat. The fact that the magnetic Saffman integral is not conserved is evidenced by the increase in the height $a_\alpha (t)$
 of the compensated magnetic spectra; see figure 2(a,b). Only for $\alpha =2$
 does the height stay nearly constant, as was already verified by Brandenburg & Larsson (Reference Brandenburg and Larsson2023). In that case, we have $I_{\rm SM}=4{\rm \pi} ^2 a_2$
 . However, we return to this aspect in § 3.6, where our higher resolution simulations now suggest that, even in that case, the decay is governed by the conservation of the Hosking integral rather than the magnetic Saffman integral.
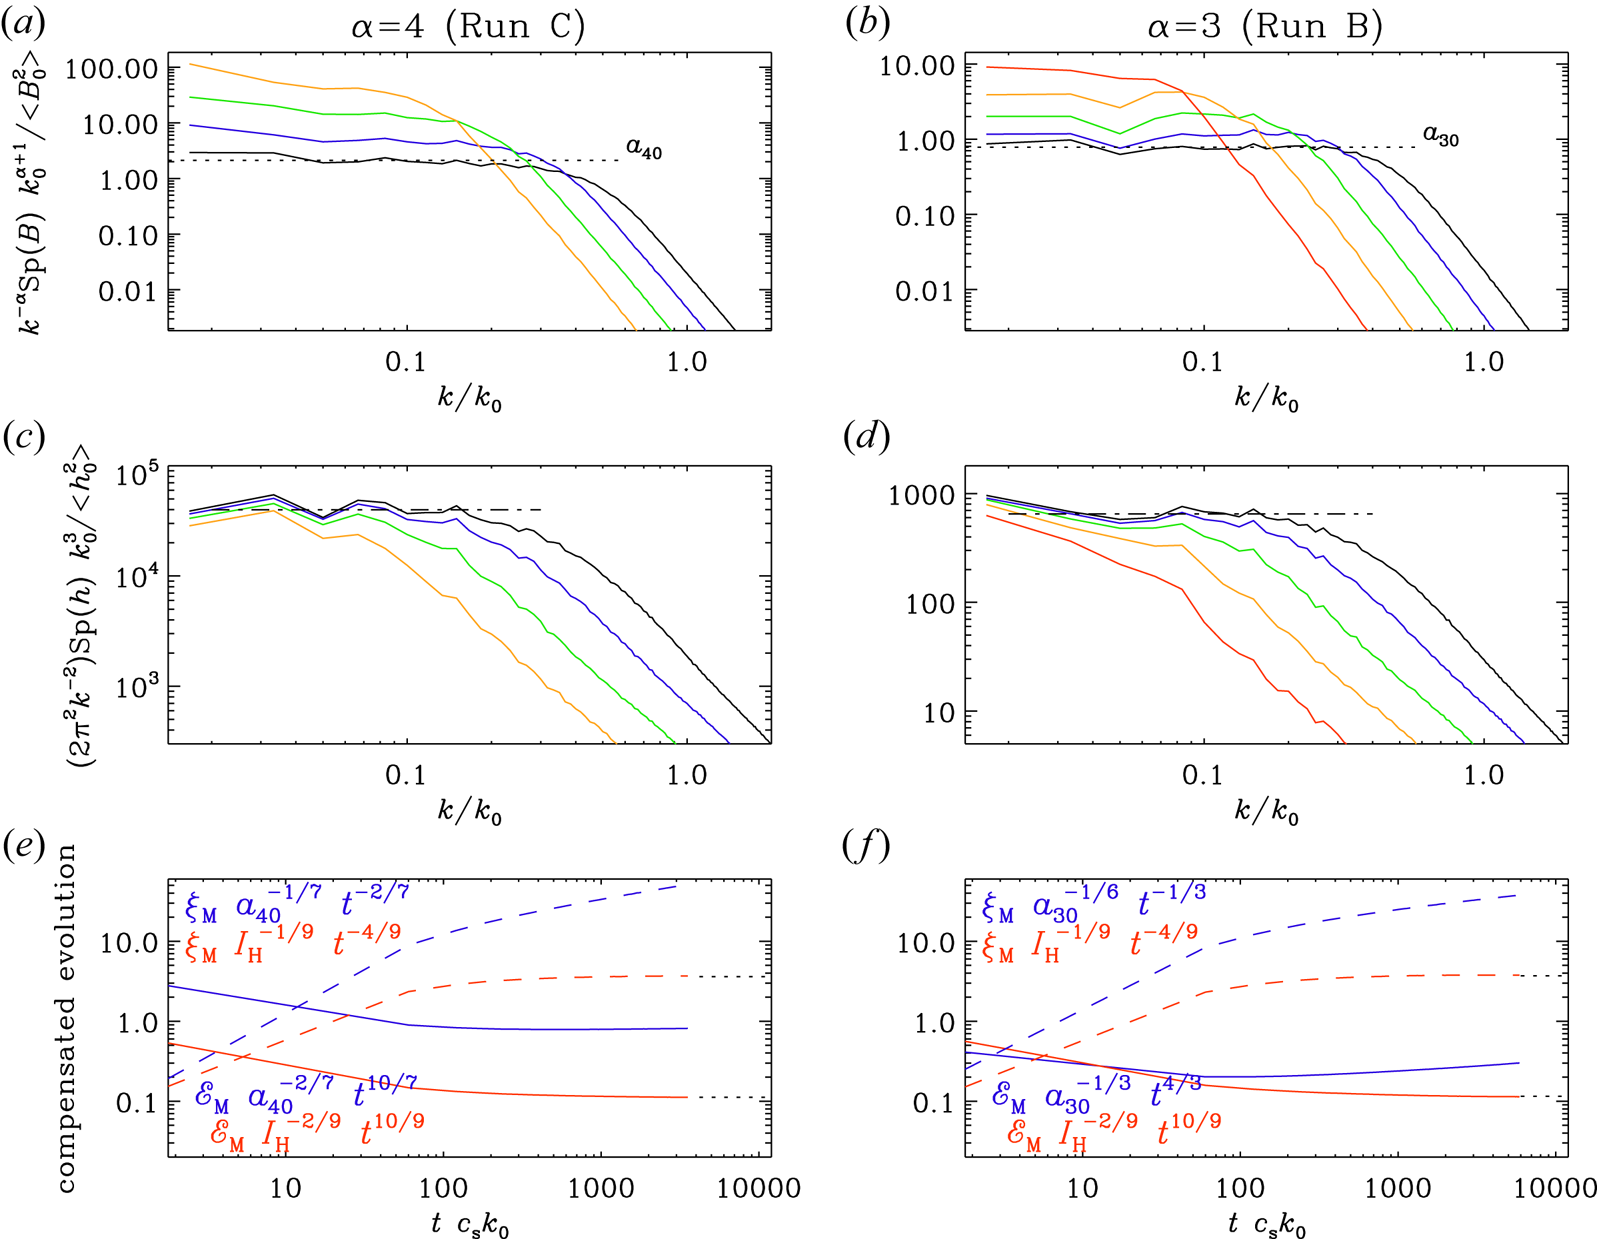
Compensated spectra showing that $\lim _{k\to 0}{\rm Sp}(\boldsymbol {B})/k^\alpha$ is not constant, and that instead the Hosking integral is conserved. Panels (a,c,e) and (b,d,f) show a comparison between $\alpha =4$
 (Batchelor spectrum, a,c,e) and $\alpha =3$
 (b,d,f). The times are $t=2$
 (black), 6 (blue), 20 (green), 60 (orange) and 190 (red). For $\alpha =4$
 (a,c,e), $t=190$
 is not available. In panels (e,f), we see that the red lines asymptote to constants, compatible with earlier work (Brandenburg & Larsson Reference Brandenburg and Larsson2023). In (e,f), the dashed curves denote the compensated time dependences of $\xi _{M}(t)$
 and the solid ones refer to the compensated dependences of ${\mathcal {E}}_{M}(t)$
 . Thus, we plot $\xi _{M} I_{H}^{-1/9} t^{-4/9}$
 and ${\mathcal {E}}_{M} I_{H}^{-2/9} t^{10/9}$
 , which are non-dimensional and should approach constants. The dotted lines mark the approximate positions of the asymptotic values of the non-dimensional constants in the Hosking scalings.
In figure 2(d), we see that ${\rm Sp}(h)$ shows a distinctly downward trend with $k$
 for the smallest $k$
 values. This suggests that the conservation property of $I_{H}$
 begins to deteriorate, especially at late times. To clarify this further, even more scale separation would be useful, i.e. a run with a larger value of $k_0$
 . Such runs at a resolution of $2048^3$
 mesh points are, however, rather expensive, but it is interesting to note that, even for the case of an initial $k^4$
 spectrum, the compensated spectra show a similar downward trend with $k$
 when the numerical resolution is only $1024^3$
 ; see figure 3(d) of Brandenburg & Larsson (Reference Brandenburg and Larsson2023), which corresponds to our run D. It should also be noted that, in figure 2(d), the last time is $t=190/c_{s} k_1$
 , while, in figure 2(c), the last time is only $60$
 . The two times correspond to $t\,\eta k_0^2\approx 1.4$
 and $0.4$
 , respectively.
3.2. Universal scaling constants
Given that $I_{H}$ is reasonably well conserved and enters the evolution of magnetic energy and correlation length, as well as the spectral envelope of the peak, through dimensional arguments, it is useful to determine the non-dimensional coefficients in these relations. This was done recently for the cases $\alpha =2$
 and $\alpha =4$
 ; see Brandenburg & Larsson (Reference Brandenburg and Larsson2023), who computed the coefficients $C_{H}^{(\xi )}$
 , $C_{H}^{({\mathcal {E}})}$
 and $C_{H}^{(E)}$
 , defined through the relations

where the index $i$ in the integrals $I_i$
 and the coefficients $C_{i}^{(\xi )}$
 , $C_{i}^{({\mathcal {E}})}$
 and $C_{i}^{({E})}$
 stands for SM or H for magnetic Saffman and Hosking scalings, respectively, and $\sigma$
 is the exponent with which length enters in $I_{i}$
 : $\sigma =5$
 for the magnetic Saffman integral ($i={\rm SM}$
 ) and $\sigma =9$
 for the Hosking integral ($i={H}$
 ). In the following, we focus on the case $i={H}$
 , but refer to Brandenburg & Larsson (Reference Brandenburg and Larsson2023) for comparisons with $i={\rm SM}$
 . We recall that $k_0$
 is the initial position of the spectral peak. Note that the last expression of (3.1a–c) describes an envelope under which $E(k,t)$
 evolves; see figure 1(a) for an example.
In principle, the non-dimensional coefficients $C_{H}^{(\xi )}$ , $C_{H}^{({\mathcal {E}})}$
 and $C_{H}^{({E})}$
 could depend on other quantities characterizing the system, for example the magnetic Reynolds number, but they may also be universal, just as for the Kolmogorov constant in the kinetic energy spectrum. To begin assessing the degree of universality of these non-dimensional coefficients, we now consider the empirical laws $\xi _{M}(t)$
 , ${\mathcal {E}}_{M}(t)$
 and $E_{M}(k,t)$
 for the new case of $\alpha =3$
 .
.
As in earlier work, the non-dimensional constants in the scaling laws for $\alpha =3$ agree with those found earlier for $\alpha =4$
 (Brandenburg & Larsson Reference Brandenburg and Larsson2023). Specifically, we have

The quality of these asymptotic laws can be seen from the red lines in figure 2(e,f). The blue lines show the case if the Saffman integral were conserved. As explained above, those are based on the values of $a_{\alpha 0}$ indicated in figure 2(a,b). A comparison of the coefficients with those found by Brandenburg & Larsson (Reference Brandenburg and Larsson2023) is given in table 2. Note that, in figure 2(e,f), the solid and dashed blue lines show an asymptotic upward trend, reflecting again that the magnetic Saffman integral is not conserved.
Summary comparison of the coefficients in the relations for $\xi _{M}(t)$ , ${\mathcal {E}}_{M}(t)$
 and $E_{M}(k,t)$
 for different values of $\alpha$
 . The numbers in parentheses indicate that the slope $\beta$
 is incompatible with the value of $\alpha$
 .
.

3.3. The normalized Hosking integral
The runs of Brandenburg & Larsson (Reference Brandenburg and Larsson2023) had different mean magnetic energy densities and also the minimum wavenumber $k_1$ was not unity, but $k_1=0.02$
 , unlike the present cases, where $k_1=1$
 . Instead, the peak of the initial spectrum, $k_0$
 , was then chosen to be unity. To compare such different runs, it is necessary to normalize $I_{\rm SM}$
 and $I_{H}$
 appropriately. On dimensional grounds, $I_{\rm SM}$
 is proportional to ${\mathcal {E}}_{M}\xi _{M}^3$
 and $I_{H}$
 is proportional to ${\mathcal {E}}_{M}^2\xi _{M}^5$
 . By approximating the spectrum as a broken power law, as in Zhou et al. (Reference Zhou, Sharma and Brandenburg2022),

where $s=5/3$ and $s=2$
 were used to represent the inertial range slopes at early and late times, respectively, we find

For $\alpha =2$ , we find the following reference values for the Saffman integral:

For other values of $\alpha$ , the value of $I_{\rm SM}^{\rm ref}$
 is not meaningful and only $I_{H}^{\rm ref}$
 is computed for other values of $\alpha$
 by using equations (2.14) and (4.5) in Zhou et al. (Reference Zhou, Sharma and Brandenburg2022). It is given by

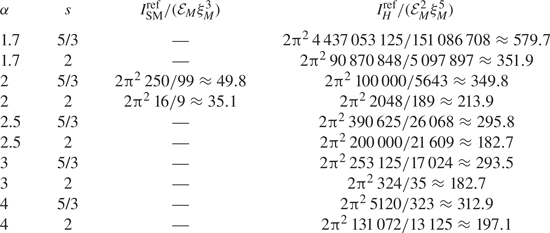
In calculating the above expression, we assumed the magnetic field distribution to be Gaussian and its spectrum to be of the form as given in (3.3). These reference values are summarized in table 3.
Reference values for $I_{\rm SM}$ and $I_{H}$
 for different combinations of $\alpha$
 and $s$
 .
.
In table 2, we list the ratio $I_{H}/I_{H}^{\rm ref}$ , where $I_{H}^{\rm ref}\propto {\mathcal {E}}_{M}^2\xi _{M}^5$
 is given in table 3. We have used here the actual values of $\alpha$
 and $s=2$
 in all cases, which describes the late time inertial range; see figure 1(a).
The former ratio, $I_{H}/I_{H}^{\rm ref}$ , varies only little, because the Hosking integral is always reasonably well conserved, except when the magnetic diffusivity is large. Near $t\eta k_0^2\approx 0.1$
 , the ratio has for all runs a well-distinguished maximum, which is the value we quote in table 2. These values tend to be approximately 20 % larger than those at the end of the run, which are the reference values given in table 2.
It is interesting to note that $I_{H}/I_{H}^{\rm ref}$ is approximately twice as large on the finer mesh (run C) than on the coarser mesh (run D). This is somewhat surprising. It should be noted, however, that run C with a larger mesh had actually a larger magnetic diffusivity ($\eta k_0/c_{s}=7\times 10^{-3}$
 ) than run D ($\eta k_0/c_{s}=5\times 10^{-5}$
 ); see table 2. It is therefore possible that run D was actually underresolved and that this was not yet noticed.
3.4. Comments on non-Gaussianity
The question of non-Gaussianity is important in many aspects of cosmology. Not all of its aspects are captured by kurtosis or skewness. In the work of Zhou et al. (Reference Zhou, Sharma and Brandenburg2022), it was already pointed out that, although the kurtosis was only slightly below the Gaussian value of three, there was a very strong effect on the statistics of the fourth-order moments that enter in the calculation of $I_{H}$ and ${\rm Sp}(h)$
 . In figure 3, we compare ${\rm Sp}(h)$
 at the initial and a later time from the numerical calculation and the semi-analytical calculation based on the actual magnetic energy spectra, assuming Gaussian statistics. As in Zhou et al. (Reference Zhou, Sharma and Brandenburg2022), we find also here a tenfold excess of the actual spectra compared with the value expected based on the assumption of Gaussianity.
The function ${\rm Sp}(h)$ at $t=0$
 and $1$
 . The dotted red curves represent the spectra obtained from the simulation and the solid black curves represent the spectra calculated by assuming the magnetic field distribution to be Gaussian.

3.5. Scaling for non-integer values of $\alpha$

We now address in more detail the case $\alpha =1.7$ , for which (2.9) with $\beta =3/2$
 would predict $\lim _{k\to 0}E_{M}(k,t)\propto t^{4\alpha /9-2/3}=t^{4/45}\approx t^{0.09}$
 . These runs are listed in table 2 as runs O and P. We have seen that, for small magnetic diffusivity, $I_{H}$
 is well conserved for all values of $\alpha$
 . On the other hand, $I_{\rm SM}$
 appears to be well conserved in the special case of $\alpha =2$
 . One possibility is therefore that, as long as $\alpha >2$
 , we have an inverse cascade, but not for $\alpha \leq 2$
 . However, the argument for not expecting an inverse cascade relies heavily on the existence of $I_{\rm SM}$
 and that it is non-vanishing. If we accept that, for $\alpha =3$
 , ${\rm Sp}(\boldsymbol {B})$
 cannot be expanded in terms of $k^2$
 and $k^4$
 , then this would also be true for $\alpha =1.7$
 , which is a value between $3/2$
 and $2$
 . One might therefore expect that, also in this case, $I_{\rm SM}$
 would not be conserved, and that the decay is governed by the conservation of $I_{H}$
 . This possibility was already listed table 1.
In figure 4(a) we show that there is no noticeable growth of $\lim _{k\to 0}E_{M}(k,t)$ . The inset, however, does show that there is an intermediate phase with a very weak growth $\propto t^{0.05}$
 . Given that the theoretically expected growth $\propto t^{0.09}$
 is already very small, and that the degree of conservation of $I_{H}$
 is also limited by a finite Reynolds number, as seen in figure 4(b) showing a premature decline of ${\rm Sp}(h)/k^2$
 in time at small $k$
 , it is indeed possible that, at larger resolution and smaller magnetic diffusivity, clearer inverse cascading might emerge.
Similar to figure 1, but for $\alpha =1.7$ .
.
Next, we consider the case $\alpha =2.5$ . The results are shown in figure 5. We see inverse cascading that is compatible with $a_{2.5}(t)\propto t^{4/9}=t^{0.44}$
 . Note that, for the intermediate time $t=50$
 , there is some evidence for a short range with a steeper spectrum, but it would hardly be as steep as $k^4$
 .
.
Similar to figure 1, but for $\alpha =2.5$ . Note that, for the green line at $t=50$
 , there is some evidence for a short range with a steeper spectrum, possibly $\propto k^4$
 .
.

3.6. Reassessment of the Saffman case
Given that there is now some evidence for inverse cascading for $\alpha =1.7$ , it is reasonable to re-address earlier evidence for the absence of inverse cascading for $\alpha =2$
 . We must remember that the results of Brandenburg & Larsson (Reference Brandenburg and Larsson2023) for $\alpha =2$
 were obtained at a resolution of $1024^3$
 mesh points using a value of the magnetic Reynolds number that was possibly too large for that resolution. More importantly, however, a superficial inspection of the spectral evolution may not suffice. We have therefore repeated such a calculation using otherwise the same parameters as in figures 1, 4 and 5 and compared the evolution of the spectral magnetic energy at low $k$
 with that expected theoretically. Our initial result suggested that a larger scale separation would be needed to obtain reliable results; see Appendix B.
A large scale-separation ratio, $k_0/k_1$ , was previously found to be important. For example, in the context of the Hall cascade, a threefold larger value of $k_0/k_1$
 was needed to demonstrate clear evidence for inverse cascading (Brandenburg Reference Brandenburg2020). Therefore, we now present in figure 6 the results for $k_0=180\,k_1$
 . We see that, similarly to the case of $\alpha =1.7$
 in the inset of figure 4(a), there is an initial rise of spectral magnetic energy compatible with being $\propto t^{0.22}$
 , which, again, is followed by a decline at very late times. This result therefore supports the notion that the Hosking integral is indeed well conserved and that it governs the evolution of the magnetic field even for $\alpha =2$
 .
.
Similar to figure 1, but for $\alpha =2$ and $k_0=180\,k_1$
 at $t=2$
 , 6, 15, 34, 80, 183 and 416. The inset applies here to the evolution at $k=5\,k_1$
 , instead of $k=k_1$
 , as for all other plots.

3.7. Evolution in the $pq$ diagram

There is a range of tools for assessing the decay properties of MHD turbulence. We have already discussed the determination of $I_{H}$ and $I_{\rm SM}$
 , and the potentially universal coefficients $C_{H}^{(\xi )}$
 , $C_{H}^{({\mathcal {E}})}$
 and $C_{H}^{({E})}$
 . We also discussed the close relation between the envelope parameter $\beta$
 in (2.7) and (3.1a–c), and the parameter $q$
 characterizing the growth of the correlation length $\xi _{M}\propto t^q$
 . There is also the parameter $p$
 characterizing the decay of magnetic energy, ${\mathcal {E}}_{M}\propto t^{-p}$
 . Both $p$
 and $q$
 can also be determined as instantaneous scaling parameters through $p(t)=-{\rm d} {}\ln {\mathcal {E}}_{M}/{\rm d} {}\ln t$
 and $q(t)={\rm d} {}\ln \xi _{M}/{\rm d} {}\ln t$
 , and their parametric representation $p(t)$
 vs $q(t)$
 gives insights into the properties of the system and how far it is from a self-similar evolution (Brandenburg & Kahniashvili Reference Brandenburg and Kahniashvili2017) and the scale-invariance line, $p=2(1-q)$
 ; see Zhou et al. (Reference Zhou, Sharma and Brandenburg2022).
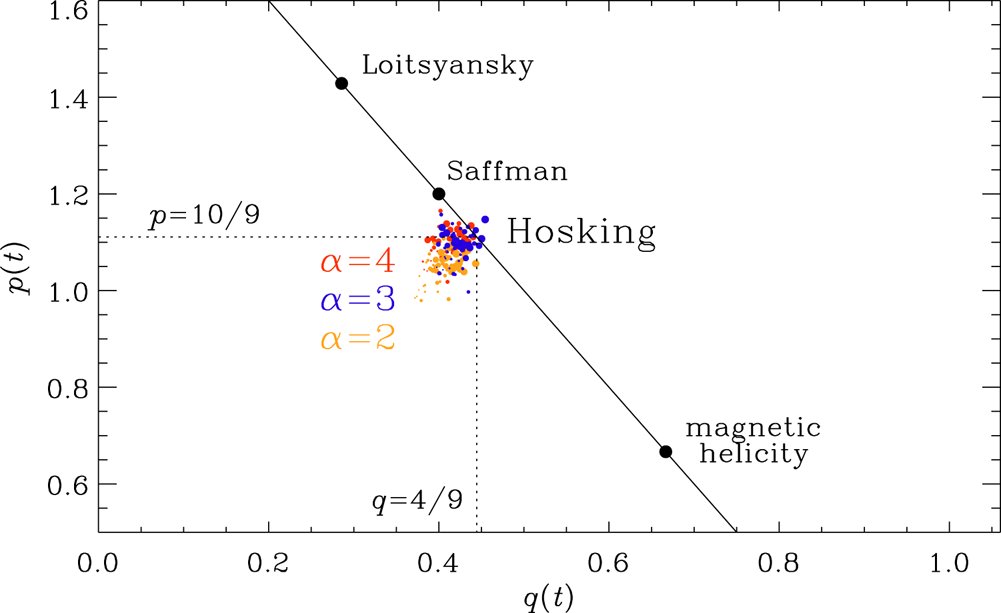
In figure 7, we show such a $pq$ diagram for runs B, C and Q. We see that the points $(q,p)$
 for different times and for both runs cluster around $(q,p)=(4/9,10/9)$
 , as expected for Hosking scaling. The locations for Loitsyansky and Saffman scalings, $(2/7,10/7)$
 and $(2/5,6/5)$
 , respectively, as well as for the fully helical case $(2/3,2/3)$
 , are also indicated for comparison. Note that, even for run Q with $\alpha =2$
 , the points are closer to Hosking scaling than to Saffman scaling.
A $pq$ diagram showing a parametric representation of $p(t)$
 vs $q(t)$
 for runs B ($\alpha =3$
 , blue), C ($\alpha =4$
 , red) and Q ($\alpha =2$
 , orange) and $10< t<60$
 . Larger symbols correspond to later times. The locations for Loitsyansky and Saffman scalings, as well as for the fully helical case, are indicated as black dots along the scale-invariance line (black solid line), $p=2(1-q)$
 , and the black dotted lines mark the position $q=4/9$
 and $p=10/9$
 .
.
A detailed assessment of the full range of scaling parameters is important for establishing the validity of Hosking scaling. Assessments based on comparisons of the parameter $p$ for different runs may not be sufficient, and have not yet confirmed this scaling; see Armua, Berera & Calderón-Figueroa (Reference Armua, Berera and Calderón-Figueroa2023) for recent results. Thus, the idea behind the Hosking phenomenology is therefore not universally accepted. Possible reasons for discrepancies could lie in an insufficiently large magnetic Reynolds number and therefore also in a lack of a sufficiently long inertial range. Therefore, it would be useful to have independent verification from other groups. In this connection, it should be noted that additional support for the validity of the Hosking scaling came from two rather different numerical experiments. First, in applications to the Hall cascade, the Hosking phenomenology predicts the scalings $q=4/13$
 and $p=10/13$
 , which was confirmed by simulations (Brandenburg Reference Brandenburg2023). Second, in relativistic plasmas where the mean magnetic helicity density is finite, but the total chirality vanishes because the helicity is exactly balanced by fermions chirality, the Hosking phenomenology predicts a decay of mean magnetic helicity $\propto t^{-2/3}$
 , which, again, was confirmed by simulations (Brandenburg, Kamada & Schober Reference Brandenburg, Kamada and Schober2023).
4. Conclusions
Our work has shown that the decay dynamics of an initial magnetic field with power-law scaling proportional to $k^3$ is similar to that for $k^4$
 . According to a simple argument involving self-similarity, we showed and confirmed that the temporal growth of the magnetic energy spectra at small $k$
 is proportional to $t^{4\alpha /9-2/3}$
 , so for $\alpha =3$
 , we have an increase proportional to $t^{2/3}$
 , while for $\alpha =4$
 , the increase is proportional to $t^{10/9}$
 . Thus, although we cannot exclude the possibility of artefacts from the finite size of the computational domain, our simulations now suggest inverse cascading even for an initial Saffman spectrum. This underlines the importance of the Hosking integral in determining the decay dynamics for a large class of initial magnetic energy spectra. We also confirmed that the non-dimensional coefficients in the empirical scaling relations for $\xi _{M}(t)$
 , ${\mathcal {E}}_{M}(t)$
 and $E_{M}(k,t)$
 are compatible with those found earlier for an initial $k^4$
 subinertial range spectrum.
At the moment, even with a resolution of $2048^3$ mesh points, we cannot make very firm statements about the case $\alpha =1.7$
 , because $I_{H}$
 is not sufficiently well conserved and the value of $\alpha$
 is close to 3/2. It would be useful to reconsider the case $\alpha =2$
 with even higher resolution to confirm the violation of the conservation of the magnetic Saffman integral, and thus weak inverse cascading $\propto t^{0.2}$
 .
.
Acknowledgements
We are grateful to D. Hosking, A. Midiri, A. Roper Pol and K. Subramanian for encouraging discussions. We are also grateful to H. Zhou for his suggestion to consider steeper spectra, as we have now discussed in Appendix A. We thank the two referees for useful suggestions and comments that have led to improvements of the paper. R.S. acknowledges the funding support provided by the ERC HERO-810451 grant. T.V. thanks CERN for hospitality during the course of this work.
Editor A. Schekochihin thanks the referees for their advice in evaluating this article.
Funding
A.B. and R.S. were supported in part by the Swedish Research Council (Vetenskapsrådet, 2019-04234); Nordita is sponsored by Nordforsk. T.V. was supported by the U.S. Department of Energy, Office of High Energy Physics, under Award No. DE-SC0019470. We acknowledge the allocation of computing resources provided by the Swedish National Allocations Committee at the Centre for Parallel Computers at the Royal Institute of Technology in Stockholm and Linköping.
Declaration of interests
The authors report no conflict of interest.
Data availability statement
The data that support the findings of this study are openly available on Zenodo at doi:10.5281/zenodo.8128611 (v2023.07.09). All calculations have been performed with the Pencil Code (Pencil Code Collaboration et al. Reference Brandenburg, Johansen, Bourdin, Dobler, Lyra, Rheinhardt, Bingert, Haugen and Mee2021); DOI:10.5281/zenodo.3961647.
Appendix A. Approach to a $k^4$ spectrum from a steeper one

In this paper, we focus on the case $\alpha <4$ . This is because for $\alpha =4$
 , the spectrum quickly develops into one that is equivalent to $\alpha =4$
 . The approach to a $k^4$
 spectrum from a steeper $k^6$
 spectrum is shown in figure 8. We see that the spectra quickly gain power at low $k$
 so that the subinertial range is $\propto k^4$
 . This happens at very early times, well before any inverse cascading has started yet.
Approach to a $k^4$ spectrum from a steeper $k^6$
 spectrum for $k_0=60\,k_1$
 using $1024^3$
 mesh points and otherwise the same parameters as for figure 1.

Appendix B. Finite-size effects
In § 3.6, we mentioned that we needed a larger scale-separation ratio to obtain reliable results for $\alpha =2$ . To demonstrate the problem, we show here the result for the usual scale separation of $k_0/k_1=60$
 . The inset to figure 9(a) shows that the growth of $E_{M}(k,t)$
 at $k=k_1$
 does not follow a clear power-law scaling. There is a decline in the slope in the range $50< t<100$
 , followed by an increase that lasts until the end of the simulation at $t=475$
 . A likely explanation for this unexpected behaviour could be finite-size effects. If that is the case, the intermediate decline in the slope could be interpreted as evidence for a levelling off, compatible with Saffman scaling.
Similar to figure 1, but for $\alpha =2$ and at $t=2$
 , 6, 15, 37, 87, 205 and 475 and with $k_0=60\,k_1$
 .
.

We should also mention that it turned out that, even for $k_0=60\,k_1$ , we had to decrease the initial magnetic field strength to $v_{A0}/c_{s}\approx 0.65$
 to prevent the code from crashing. This value of $v_{A0}/c_{s}$
 is approximately 30 % smaller than our usual value of $v_{A0} / c_{s} \approx 0.87$
 that was used for the other runs at that resolution. While these field strengths are not that different, it indicates that at early times, our simulations are close to the limit below which we can still trust them.


 Open access