


Introduction
Approximately half of the population of England was killed by plague between AD 1348 and 1350, during the outbreak commonly referred to as the Black Death (Aberth Reference Aberth2009). Wider estimates place European Black Death mortality at 30–60 per cent (Horrox Reference Horrox1994; Benedictow Reference Benedictow2004; Aberth Reference Aberth2009). The presence of Yersinia pestis ancient DNA (aDNA) in human skeletal assemblages from mass burials associated with the Black Death provides an identification for the pathogen responsible (Haensch et al. Reference Haensch2010; Spyrou et al. Reference Spyrou2019). Britain continued to experience plague outbreaks until the mid-seventeenth century; this period is known as the Second Plague Pandemic, differentiating it from the First Plague Pandemic that began with the plague of Justinian in the sixth century AD (Aberth Reference Aberth2009; Gummer Reference Gummer2010).
Studying the Black Death facilitates exploration of catastrophic mortality events and how these affected medieval populations. The most direct way of evaluating Black Death mortality is via the osteological analysis of those who died during the pandemic. Such individuals have been identified primarily within mass burials. In England, the largest mass burials associated with the Black Death are found at East Smithfield in London (Waldron Reference Waldron2001; Grainger et al. Reference Grainger2008; DeWitte Reference DeWitte2009, Reference DeWitte2010a & Reference DeWitteb), and Hereford Cathedral, near the Welsh border (Stone & Appleton Fox Reference Stone and Appleton Fox1996; Castex & Kacki Reference Castex and Kacki2016; Franklin et al. Reference Franklin2023).
A significant difference (p = 0.0496) has previously been identified between the demographic profiles of adults buried within the Hereford mass graves and within the late twelfth–sixteenth centuries attritional cemetery (i.e. reflecting ‘normal’ non-catastrophic mortality) at Hereford Cathedral, with a substantial over-representation of young adults (aged 15–24 years) within the mass graves (Franklin et al. Reference Franklin2023). This supports data from the East Smithfield mass graves generated using the same skeletal ageing techniques (DeWitte Reference DeWitte2010a), suggesting that a high prevalence of young adults may indicate plague deaths.
However, the comparative attritional sites from both analyses have contextual limitations. While the Hereford Cathedral attritional cemetery originates from the same temporospatial context as the mass graves, it saw use throughout the Second Plague Pandemic and probably contains plague victims from later outbreaks, meaning it may not provide a true example of attritional mortality (Franklin et al. Reference Franklin2023). Documentary evidence indicates that burying those who died from plague in parish cemeteries was common throughout the Black Death (Hawkins Reference Hawkins1990; Kelly Reference Kelly2005; Grainger et al. Reference Grainger2008; Gummer Reference Gummer2010) and by using such evidence or via aDNA analysis, individuals who died from plague have been identified within parish cemeteries from medieval Cambridge (Cessford et al. Reference Cessford2021) and across mainland Europe, including in the Netherlands (Haensch et al. Reference Haensch2010) and France (Raoult et al. Reference Raoult2000; Crubézy et al. Reference Crubézy2006; Passarrius et al. Reference Passarrius2008; Haensch et al. Reference Haensch2010; Kacki et al. Reference Kacki2011; Tran et al. Reference Tran2011). The overall presence of plague victims within these cemeteries is difficult to quantify, due to the variable way the Black Death affected different communities (Hawkins Reference Hawkins1990), but has the potential to introduce demographic bias. The inclusion of plague burials, and therefore catastrophic demographic traits, minimises visible variation in ‘attritional’ cemetery profiles and increases homogeneity.
The comparative attritional burials included in the East Smithfield study pre-date 1348 but are from Danish cemeteries, meaning they may not accurately reflect plague-free attritional demography in Britain (DeWitte Reference DeWitte2010a). Other comparative analyses of catastrophic and attritional demography have included only one attritional cemetery (Margerison & Knüsel Reference Margerison and Knüsel2002), limiting applicability even where the attritional burials pre-date the Black Death (Gowland & Chamberlain Reference Gowland and Chamberlain2005).
This article aims to minimise confounding variables by analysing multiple attritional cemeteries in Britain that pre-date the Black Death, thus creating a comparative dataset where no deaths can be attributed to plague. Here, we describe the demographic profiles for three such sites, produced using age estimates generated via transition analysis (Ousley et al. Reference Ousley2016), and explore their age-at-death and survivorship profiles. By including multiple attritional sites, we hope to produce a more representative sample of British medieval attritional burials spanning urban and rural contexts and socioeconomic groups. These data will aid the identification of demographic traits that are consistent across the assemblages, or traits that are different and may reflect other community variables. Minimal published data relating to pre-Black Death attritional cemeteries are currently available where individuals’ ages have been estimated using transition analysis; this research will thus also generate demographic profiles that are of interest in their own right.
Materials
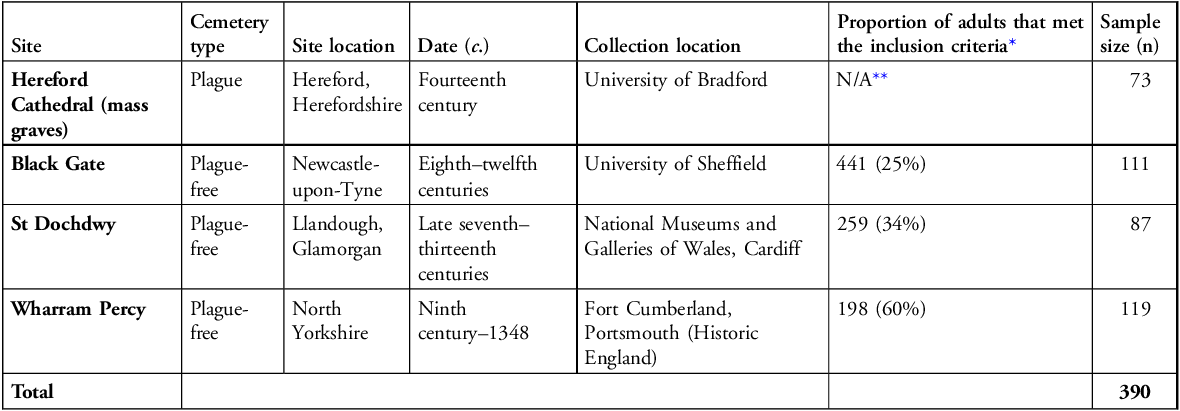
The locations of all sites included within this study are shown in Figure 1. Sample sizes are listed in Table 1. As age-at-death profiles are proportional and survivorship profiles are cumulative, any biases within the earliest age-at-death intervals influence subsequent age-at-death intervals—potentially distorting overall demographic profiles. Infants are systematically under-represented within early medieval British cemeteries (Gage Reference Gage1985; Buckberry Reference Buckberry2000; Hoppa Reference Hoppa, Hoppa and Vaupel2002), so non-adults were excluded in the present analysis to avoid skewing the demography. Details relating to the non-adults from each site are reported elsewhere (Stone & Appleton Fox Reference Stone and Appleton Fox1996; Loe Reference Loe2003; Mays Reference Mays and Mays2007; Mahoney Swales Reference Mahoney Swales2012; Castex & Kacki Reference Castex and Kacki2016).
The locations of all sites included within this study (figure by authors).

Figure 1 Long description
The map of England highlights key locations relevant to a study on the Black Death. It marks the sites of Black Gate in Newcastle-Upon-Tyne, Wharram Percy in North Yorkshire, Hereford Cathedral, and the Church of St Dochdwy in Llandough. These locations are indicated with different colored markers: a purple dot for Black Gate, a blue dot for Wharram Percy, a black dot for Hereford Cathedral, and an orange dot for the Church of St Dochdwy. The map also includes a scale bar at the bottom, showing distances up to 200 kilometers, and a compass rose indicating the cardinal directions. The map provides a geographic context for understanding the spread and impact of the Black Death in England.
Sample sizes of the skeletal collections explored in this study (data for Hereford Cathedral from Franklin et al. Reference Franklin2023).

Table 1 Long description
The table presents data on sample sizes of skeletal collections from four different sites. It includes columns for site, cemetery type, site location, date, collection location, proportion of adults that met the inclusion criteria, and sample size. The sites listed are Hereford Cathedral with 73 samples, Black Gate with 111 samples, St Dochdwy with 87 samples, and Wharram Percy with 119 samples. The table also notes the proportion of adults meeting inclusion criteria, with percentages ranging from 25 percent to 60 percent. The data for Hereford Cathedral is sourced from Franklin et al. 2023.
* Of the adult skeletons falling into the appropriate sample dates.
** Please note that for the Hereford mass graves, the inclusion criteria were relaxed due to the small sample size (Franklin et al. Reference Franklin2023).
The Hereford Cathedral Black Death assemblage
This article builds on research previously published for the Hereford Cathedral mass graves (Franklin et al. Reference Franklin2023), which were excavated in 1993 (Stone & Appleton Fox Reference Stone and Appleton Fox1996). These burials are attributed to the Black Death following the results of aDNA analysis (Haensch et al. Reference Haensch2010). Seventy-three adult skeletons were analysed, with a mean age-at-death of 31.71 years.
The pre-Black Death skeletal assemblages
As there is no evidence to indicate that infections from the First Plague Pandemic persisted in Britain beyond the late seventh century (Creighton Reference Creighton1891; Maddicott Reference Maddicott and Little2006), the collections included in this study were selected from cemeteries that were in use after this date but that had ceased to be used before the fourteenth century (or 1348 where explicitly stated). Three pre-Black Death skeletal assemblages were selected: Black Gate cemetery, Newcastle-upon-Tyne (England; eighth–twelfth centuries); the Church of St Dochdwy, Llandough (Wales; late seventh–thirteenth centuries; described as ‘St Dochdwy’ henceforth); and the cemetery of Wharram Percy, North Yorkshire (England; ninth century–1348).
Within these assemblages, skeletons were included in analyses where they fulfilled three criteria: not commingled; adult (aged approximately 18 years or older at the time of death); and with at least 50 per cent of skeletal elements present (Mays et al. Reference Mays2002). Included skeletons had an overall preservation of ‘good’ or better, and the bones of the pelvis sufficiently present to facilitate age-at-death estimation. The exclusion of less-well-preserved and less-complete skeletons could result in the under-representation of older adults, whose bones are typically more fragile and friable (Walker et al. Reference Walker1988) but as these criteria were applied across the assemblages, any potential bias should be consistent across sites. The total sample size for the pre-Black Death burials was 317 adults: 111 from Black Gate, 87 from St Dochdwy and 119 from Wharram Percy.
The Black Gate cemetery assemblage is typical of an early Christian urban lay cemetery in terms of burial practices (Nolan Reference Nolan2010), with previous osteological analysis indicating that it is demographically consistent with the later Anglo-Saxon period (Mahoney Swales Reference Mahoney Swales2012). This assemblage is from an urban community, providing an excellent comparator for the urban plague burials of Hereford Cathedral. The St Dochdwy assemblage represents a small agrarian community (Loe Reference Loe2003; Holbrook & Thomas Reference Holbrook and Thomas2005). Monastic burials are associated with the earlier stages of cemetery use, estimated between the sixth and eighth centuries (Loe Reference Loe2003), but these were excluded from analysis to minimise the inclusion of possible plague burials from the First Pandemic and to ensure that the assemblage remained comparable to the other pre-Black Death lay populations included. This site is the closest geographically to Hereford. The Wharram Percy assemblage derives from a rural settlement that was deserted during the medieval period (Mays et al. Reference Mays and Mays2007). The presence of burials that pre-date 1348 make this site an ideal candidate for exploring medieval demography in the absence of plague. By including both urban and rural cemeteries, we hoped to identify and describe any variation between settlement types and to reflect the demography of early medieval England and Wales more broadly.
Methods
Osteological analysis of the skeletal material
Osteological analysis proceeded as described by Franklin and colleagues (Reference Franklin2023). Age-at-death was estimated via transition analysis, using the Transition Analysis 2 (TA2) scoring protocol and archaeological priors within the Anthropological Database, Odense University (ADBOU) software (Boldsen et al. Reference Boldsen, Hoppa and Vaupel2002; Ousley et al. Reference Ousley2016). The archaeological prior uses data from seventeenth-century parish records from rural Denmark (DeWitte Reference DeWitte2010a; Simon & Hubbe Reference Simon and Hubbe2021). This approach applies Bayesian modelling to data relating to the degeneration of the pubic symphyses and auricular surfaces and to the closure of cranial sutures, producing a minimum likelihood point estimate (MLPE) for each individual’s age-at-death (Boldsen et al. Reference Boldsen, Hoppa and Vaupel2002; Milner & Boldsen Reference Milner and Boldsen2012; Ousley et al. Reference Ousley2016). The inclusion of cranial suture analysis is controversial (Jooste et al. Reference Jooste2016; Xanthopoulou et al. Reference Xanthopoulou2018), but there is evidence that it improves accuracy and precision when using ADBOU protocols (Milner & Boldsen Reference Milner and Boldsen2012; Simon & Hubbe Reference Simon and Hubbe2021; Kim & Algee-Hewitt Reference Kim and Algee-Hewitt2022). These discrete MLPEs permitted subsequent demographic analysis.
Transition analysis is often used by palaeodemographers (DeWitte Reference DeWitte2010a; Godde et al. Reference Godde2020) as it improves on some aspects of traditional age-at-death estimation, including by reducing ‘age mimicry’ and the systematic exclusion of older adults (Boldsen et al. Reference Boldsen, Hoppa and Vaupel2002; Buckberry Reference Buckberry2015) and thereby improving their representation within demographic profiles. While the assemblages included in this study have been analysed previously, this is the first time that transition analysis has been applied to these three pre-Black Death cemeteries.
Demographic and statistical analysis
Age-at-death profiles were produced in Microsoft Excel using calculations from the Level 3 ‘West’ life table (Coale et al. Reference Coale1983), a model life table widely used to estimate demography in pre-antibiotic populations. From their MLPEs, individuals were categorised into age-at-death intervals: 15–24.99, 25–34.99, 35–44.99, 45–54.99, 55–64.99, 65–74.99 and 75–84.99 years. Life table analysis has been used previously to explore demography across plague and attritional cemeteries (Waldron Reference Waldron2001; Margerison & Knüsel Reference Margerison and Knüsel2002; Gowland & Chamberlain Reference Gowland and Chamberlain2005) but this can introduce error when applied to non-stationary or unstable populations (Gage Reference Gage1985; Wilson Reference Wilson1985; Konigsberg & Frankenberg Reference Konigsberg and Frankenberg1992). While such an error may mean that life table distributions are not true to the original population, they remain comparable to other profiles produced using the same method.
To test whether the MLPE distributions of the assemblages differed significantly, two-sample Kolmogorov-Smirnov analysis was conducted in RStudio (Posit Team 2023; R Core Team 2023). This test permits analysis of continuous, independent and non-parametric data, and has been used previously to explore variation in MLPE distributions across catastrophic and attritional sites (DeWitte Reference DeWitte2010a; Franklin et al. Reference Franklin2023). Kaplan-Meier survival analysis was also conducted in RStudio, with profiles generated from MLPEs using the survival package (Therneau Reference Therneau2021). A log rank test was applied to calculate chi-square values and p values to compare survivorship curves. This test has been used extensively to explore survivorship patterns in past populations (Boldsen Reference Boldsen2007; DeWitte Reference DeWitte2014a & Reference DeWitteb, Reference DeWitte2018; Yaussy & DeWitte Reference Yaussy and DeWitte2019; Jones et al. Reference Jones2021). Both MLPE distributions and survivorship profiles were considered significantly different where p values were less than or equal to 0.05.
Results
The pre-Black Death cemeteries
Age-at-death profiles for the three pre-Black Death assemblages are presented in Figure 2. The proportion of individuals aged 15–24 years is highly consistent, with between 17 and 20 per cent of each assemblage falling into this age-at-death interval. Within all three cemeteries, mortality peaks at 25–34 years, though the proportion of individuals within this age-at-death interval is higher in the Black Gate assemblage (38.7%) than the St Dochdwy and Wharram Percy assemblages (both approximately 30%). This peak possibly reflects high mortality in the 25–34-year interval; there is a low proportion of adults aged 35–44 years in the Black Gate assemblage (approximately 11%), a little more than half that of St Dochdwy and Wharram Percy (both approximately 25%).
Age-at-death profiles for the Black Gate, St Dochdwy and Wharram Percy assemblages (figure by authors).
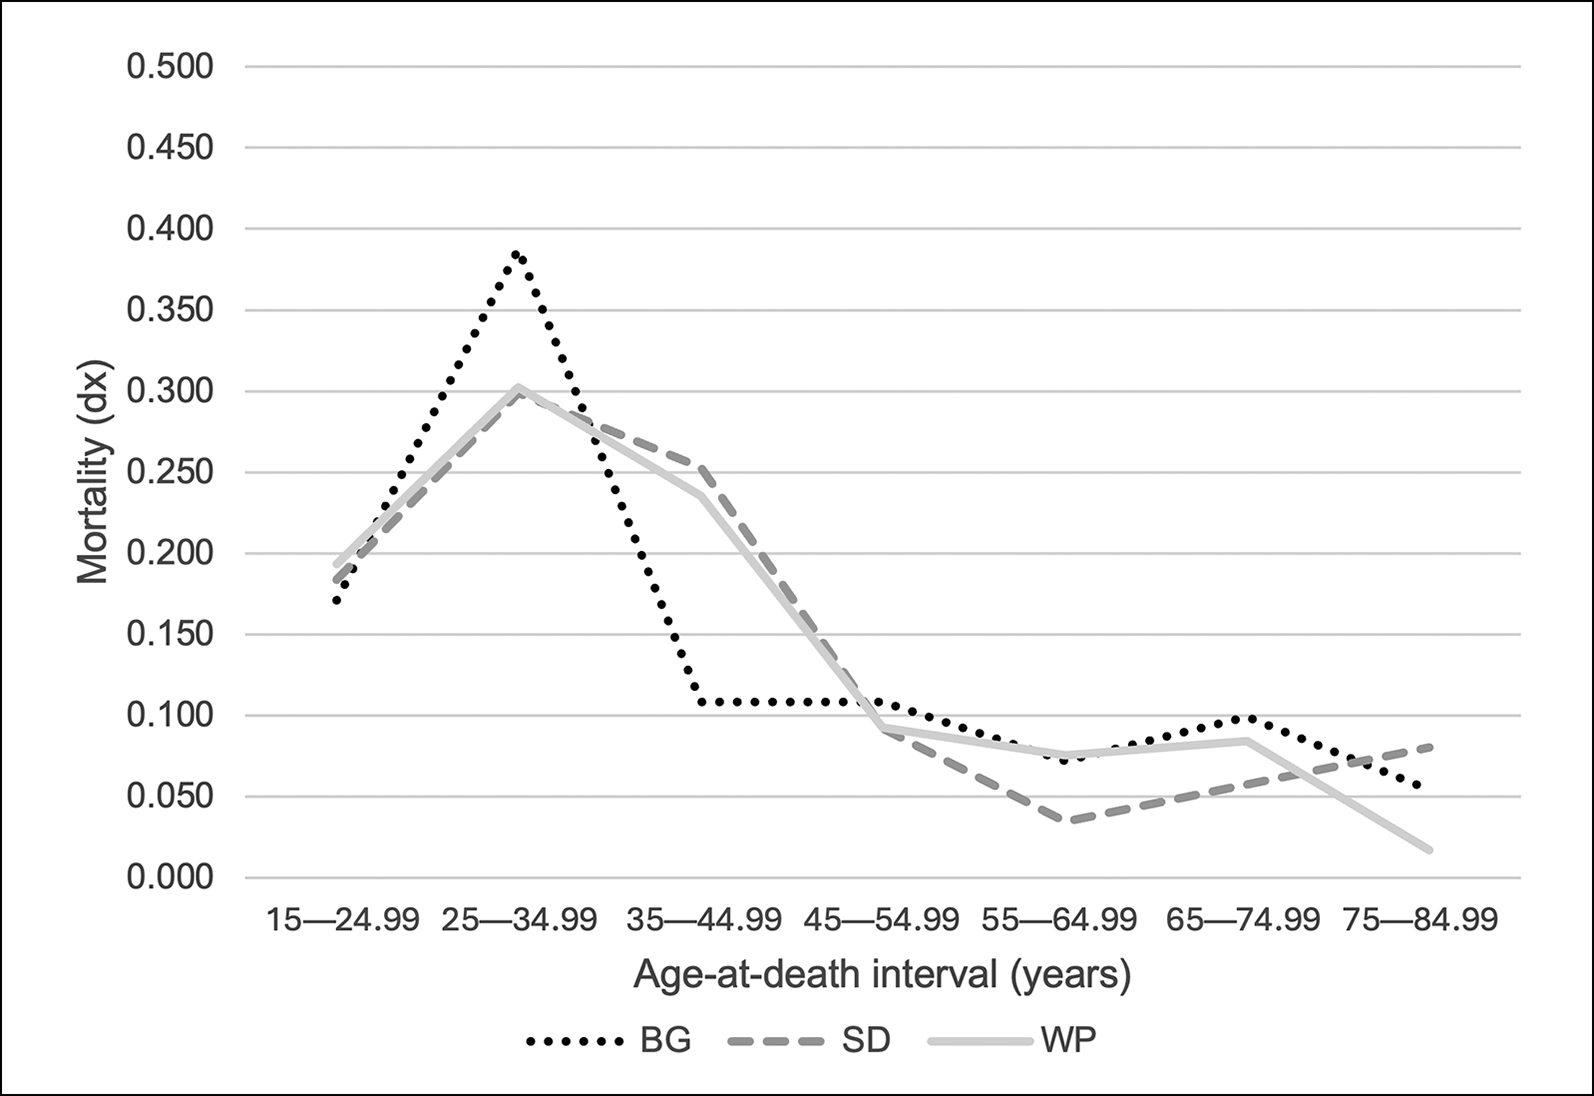
Figure 2 Long description
A line graph showing mortality rates across different age-at-death intervals for three assemblages: Black Gate, St Dochdwy, and Wharram Percy. The x-axis represents age-at-death intervals in years, ranging from 15 to 84.99. The y-axis represents mortality rates, ranging from 0.000 to 0.500. The graph includes three data lines: a dotted line for Black Gate, a dashed line for St Dochdwy, and a solid line for Wharram Percy. The mortality rate peaks between the ages of 25 and 34.99 for all three assemblages, with Black Gate showing the highest peak around 0.400. The mortality rates then decline steadily across older age groups. All values are approximated.
Mortality is low for all assemblages across all subsequent age-at-death intervals. For the 45–54-year interval, mortality is similar across all three cemeteries (approximately 10%). Within the 55–64-year interval, mortality is consistent across the Black Gate and St Dochdwy assemblages (approximately 7.5%) but slightly lower for Wharram Percy (approximately 5%), a pattern that is repeated for the 65–74-year age-at-death interval. At 75–84 years, mortality is greatest within the St Dochdwy assemblage (8%) and lowest in the Wharram Percy assemblage (approximately 2%), with the Black Gate assemblage falling between the two (approximately 5%).
Kolmogorov-Smirnov analysis indicates that the age-at-death profiles for the pre-Black Death cemeteries are not significantly different. Results for the pairwise inter-site comparisons are as follows: Black Gate and St Dochdwy (D = 0.09 and p = 0.78), Black Gate and Wharram Percy (D = 0.14 and p = 0.19), St Dochdwy and Wharram Percy (D = 0.09 and p = 0.80). The greatest level of difference, as indicated by the D values, is between the Black Gate and Wharram Percy assemblages.
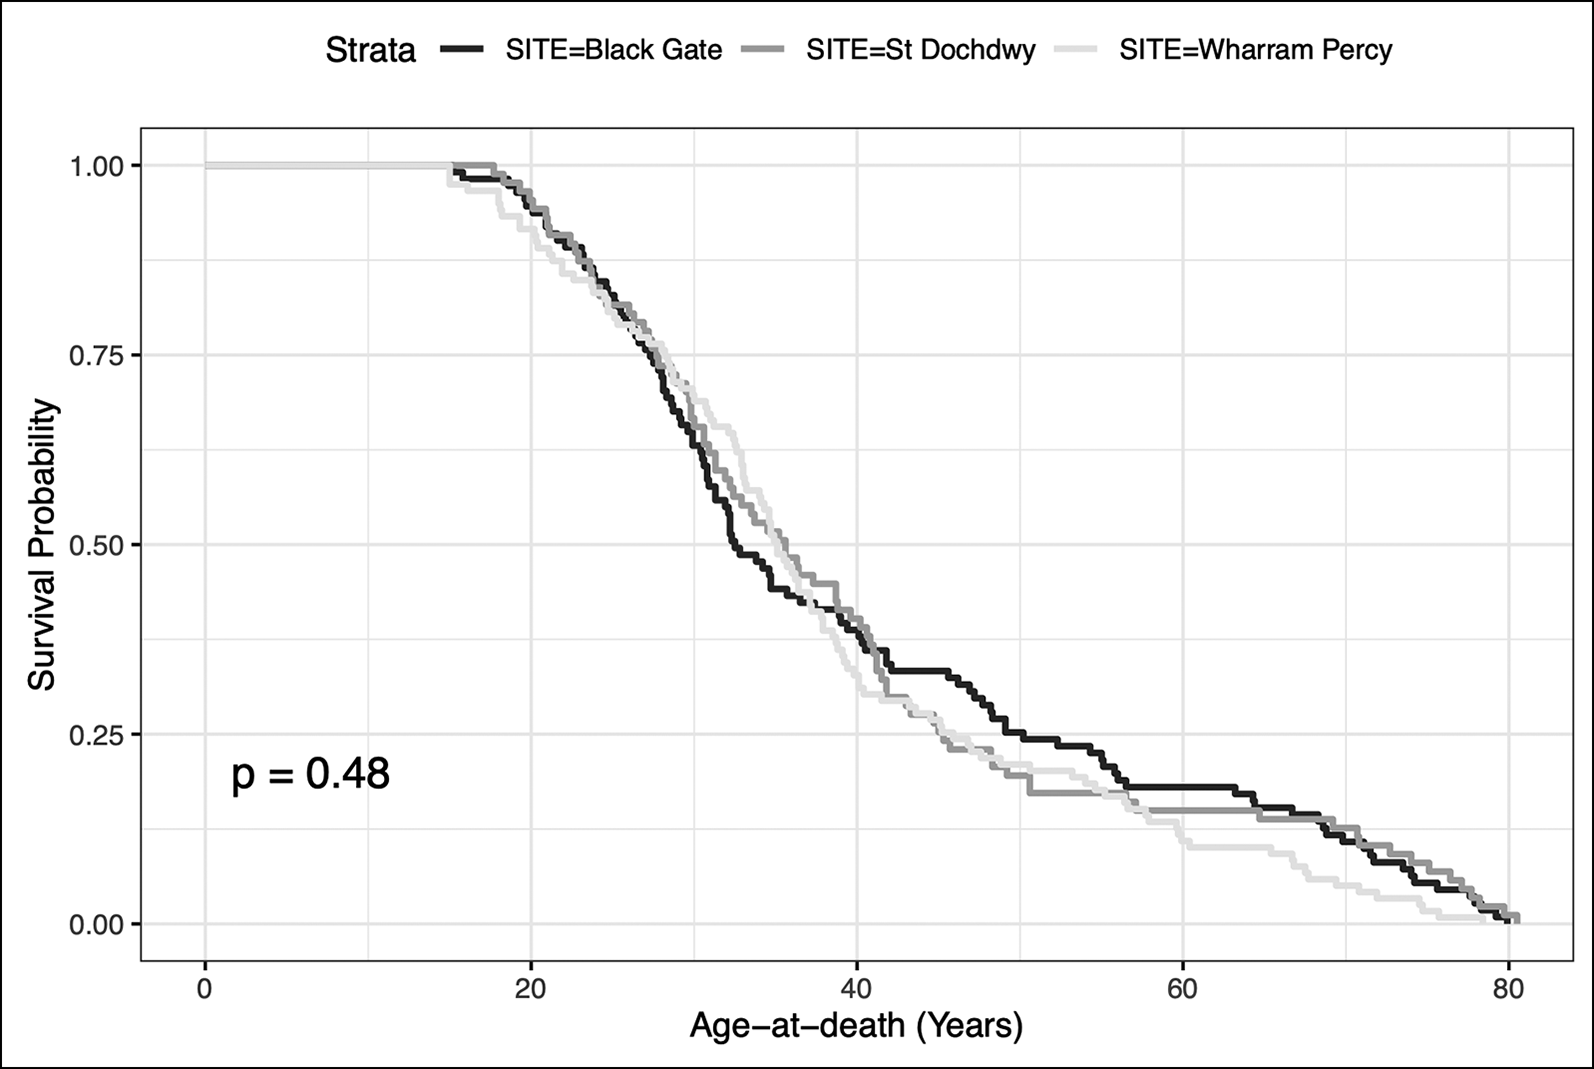
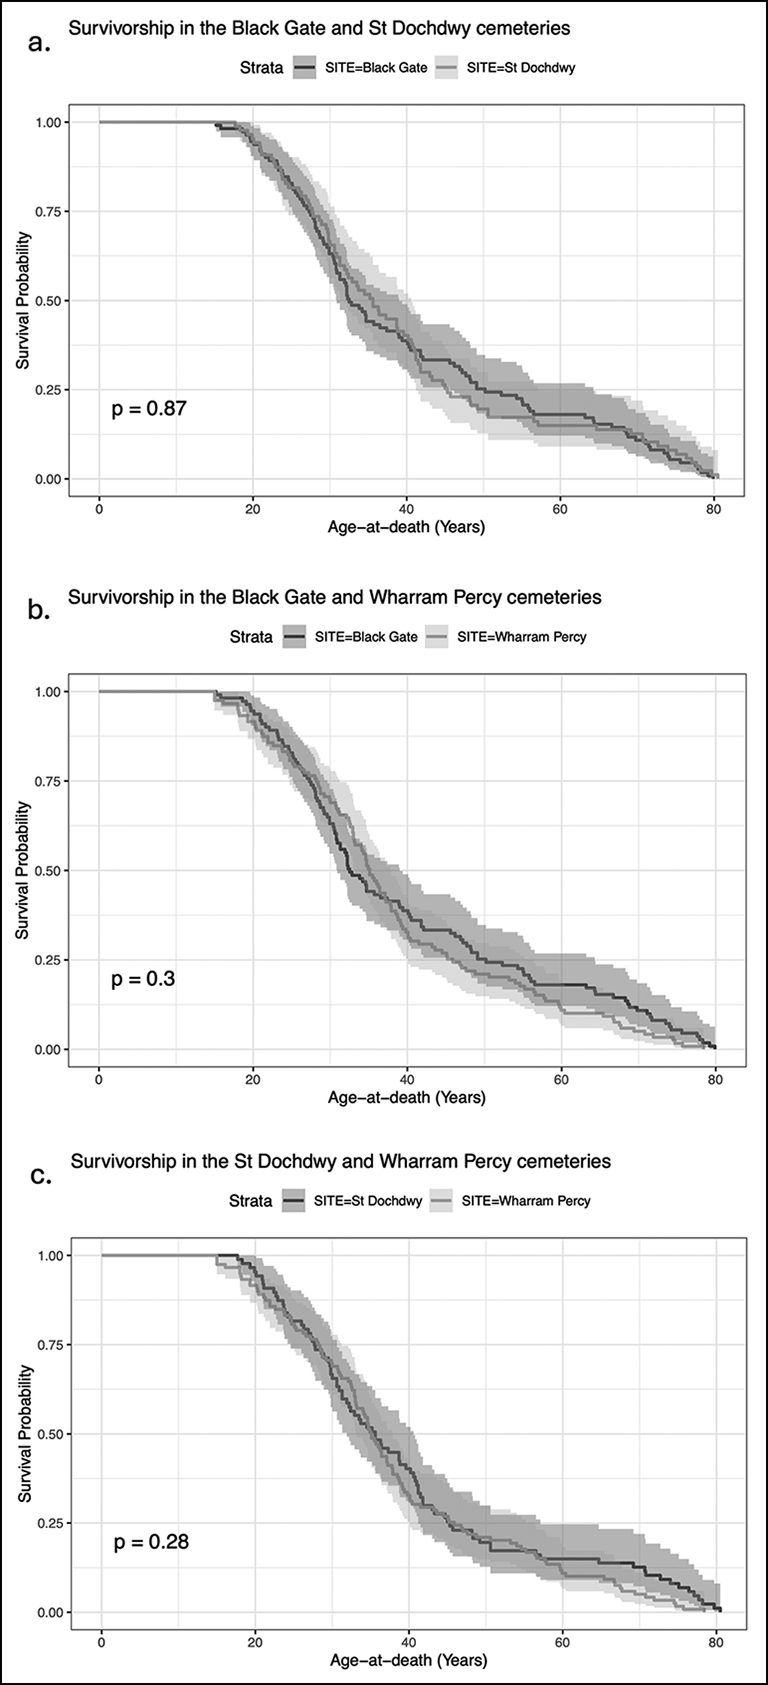
Survivorship profiles, generated from the MLPEs, are also similar across all three pre-Black Death cemeteries (Figure 3)—decreasing steadily with increasing age. Survivorship is marginally lower for the Black Gate assemblage for those aged approximately 25–40 years and then higher between approximately 40 and 70 years. The St Dochdwy and Wharram Percy survivorship profiles are similar throughout most age-at-death intervals. Survivorship for Wharram Percy falls below that of both St Dochdwy and Black Gate from approximately 60 years onwards. Kaplan-Meier analysis found no significant difference in survivorship between any of the pre-Black Death assemblages. Additionally, no significant differences were apparent between pairwise combinations of the assemblages (Black Gate and St Dochdwy, p = 0.87: Black Gate and Wharram Percy, p = 0.30; St Dochdwy and Wharram Percy, p = 0.28) (Figure 4).
Survivorship profiles for the Black Gate, St Dochdwy and Wharram Percy assemblages (figure by authors).
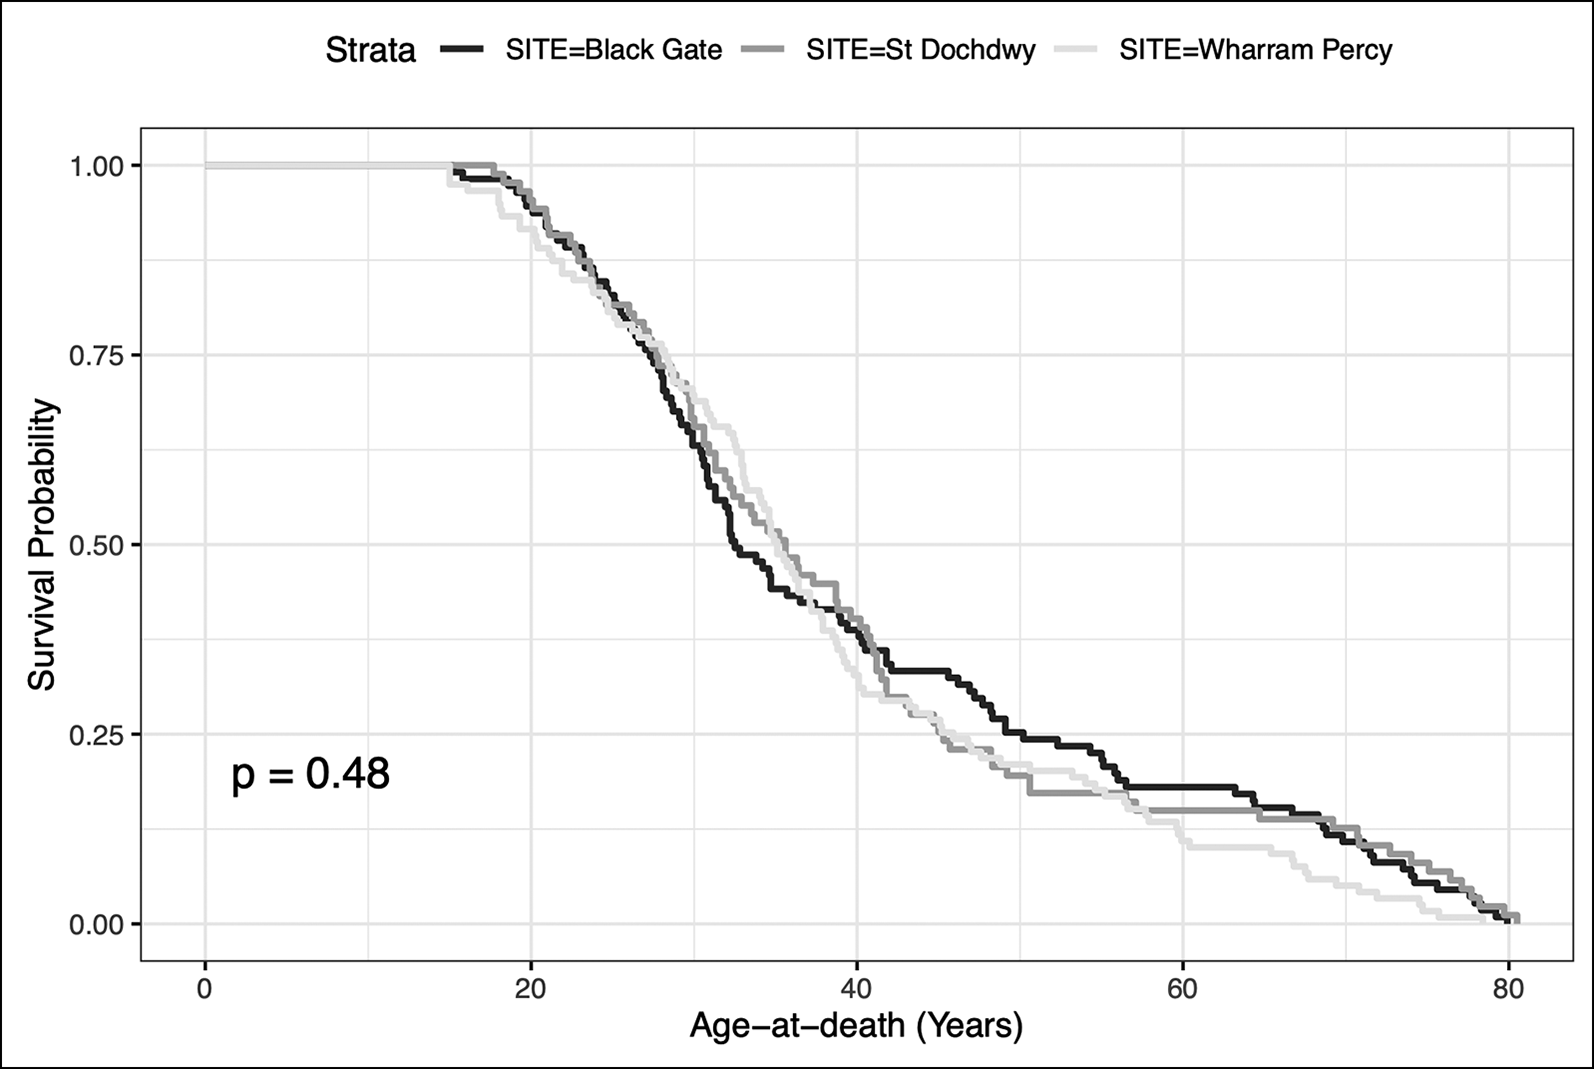
Figure 3 Long description
The line graph presents survival probability on the y-axis and age at death in years on the x-axis. Three data lines represent different sites: Black Gate, St Dochdwy, and Wharram Percy. The survival probability starts at 1.00 for all sites and decreases with age. The p-value of 0.48 indicates the statistical significance of the differences observed. All values are approximated.
Kaplan-Meier profiles comparing the pre-Black Death cemeteries: a) Black Gate versus St Dochdwy; b) Black Gate versus Wharram Percy; c) St Dochdwy versus Wharram Percy (figure by authors).

Figure 4 Long description
Three Kaplan-Meier survival graphs compare pre-Black Death cemeteries. The first graph compares Black Gate and St Dochdwy, showing survival probability over age at death with a p-value of 0.87. The second graph compares Black Gate and Wharram Percy, with a p-value of 0.3. The third graph compares St Dochdwy and Wharram Percy, with a p-value of 0.28. Each graph displays survival probability on the y-axis and age at death in years on the x-axis, with shaded areas indicating confidence intervals.
Comparing the pre-Black Death cemeteries to the Black Death burials
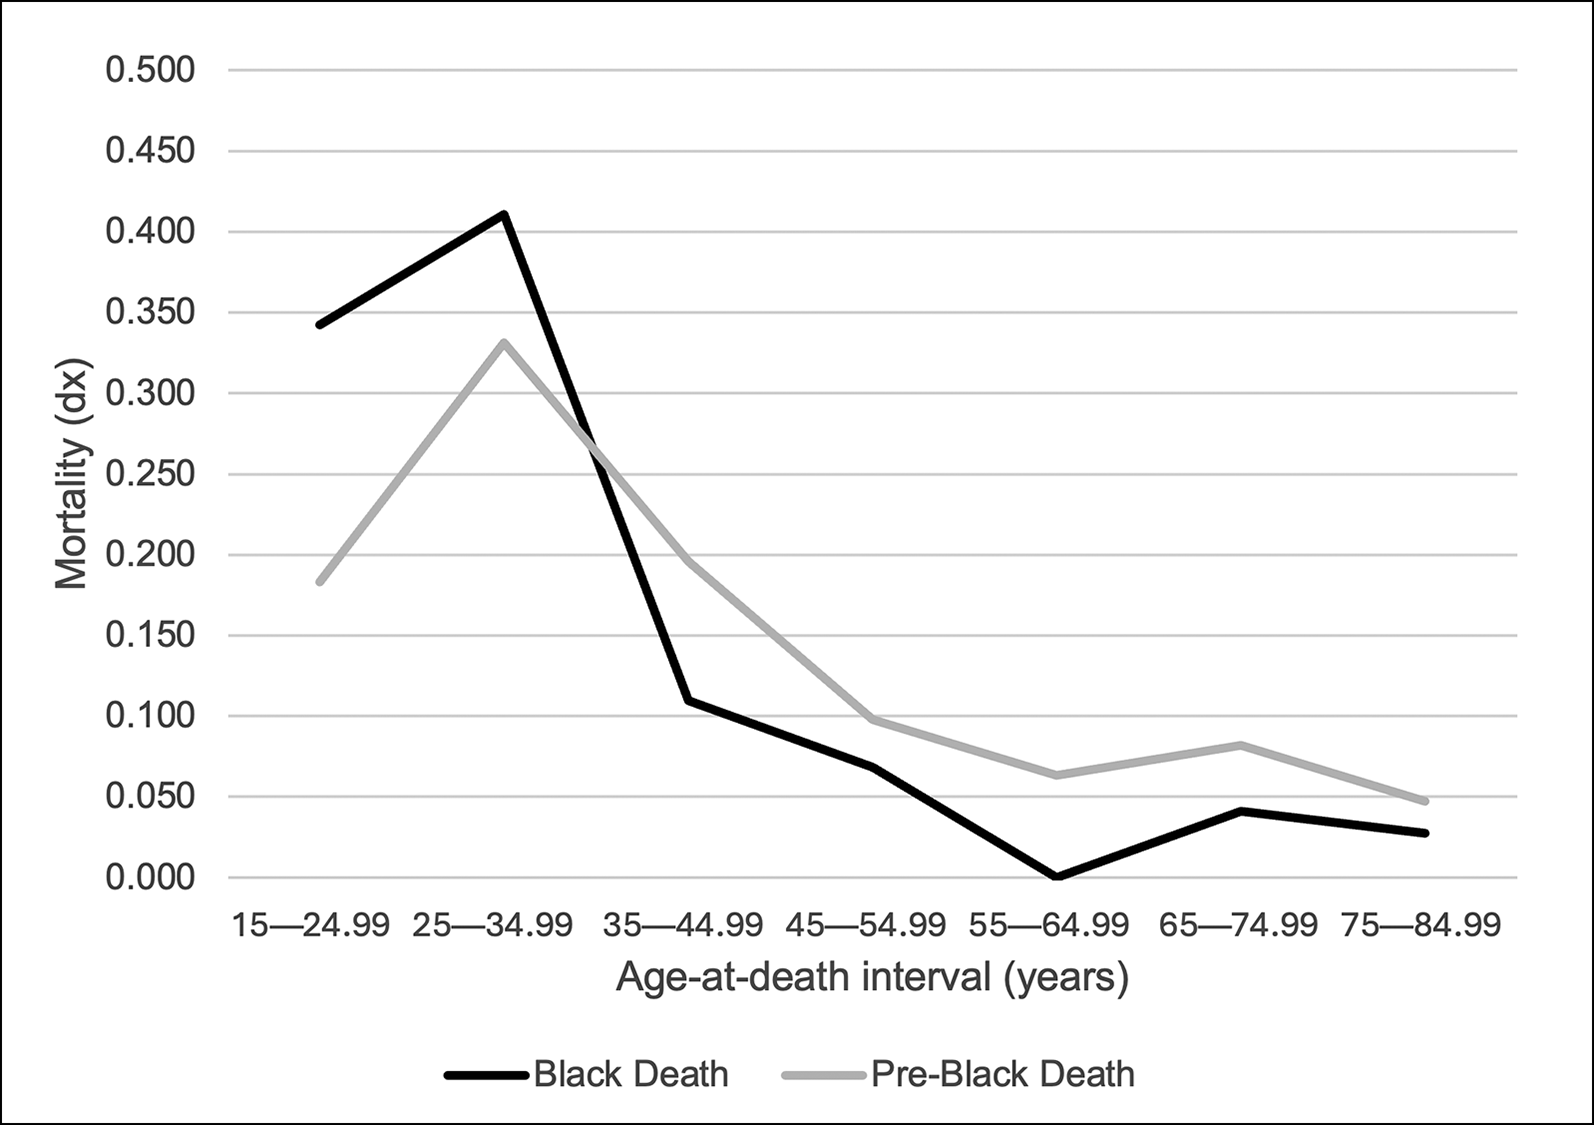
Given the lack of statistically significant differences in age-at-death distributions and survivorship profiles, the pre-Black Death cemeteries were combined into a ‘pre-Black Death aggregate’ for subsequent analysis. The greatest variation between the Hereford Cathedral Black Death burials and the pre-Black Death aggregate is apparent in the young adult cohort (Figure 5). The proportion of 15–24-year-olds in the pre-Black Death aggregate (18.3%) is nearly half that of the Black Death burials (34.2%). Although mortality peaks for both samples at 25–34 years, mortality is elevated for those in the Black Death burials (41.1%) compared to the pre-Black Death aggregate (33.1%). For all subsequent age-at-death intervals, mortality is higher within the pre-Black Death aggregate than the Black Death burials.
Age-at-death profiles for the Hereford Cathedral Black Death mass graves and the pre-Black Death aggregate (figure by authors).

Figure 5 Long description
The line graph compares mortality rates during the Black Death and pre-Black Death periods across different age groups. The x-axis represents age-at-death intervals in years, ranging from 15 to 84.99 years, divided into segments: 15-24.99, 25-34.99, 35-44.99, 45-54.99, 55-64.99, 65-74.99, and 75-84.99. The y-axis represents mortality rates, ranging from 0.000 to 0.500. Two lines are plotted: one for the Black Death period (in black) and one for the pre-Black Death period (in gray). The Black Death line shows higher mortality rates in the younger age groups, peaking at around 0.400 for the 25-34.99 age group, and then declining steadily with age. The pre-Black Death line also shows higher mortality rates in younger age groups, peaking at around 0.350 for the 25-34.99 age group, and then declining more gradually with age. Both lines converge and show lower mortality rates in the older age groups. All values are approximated.
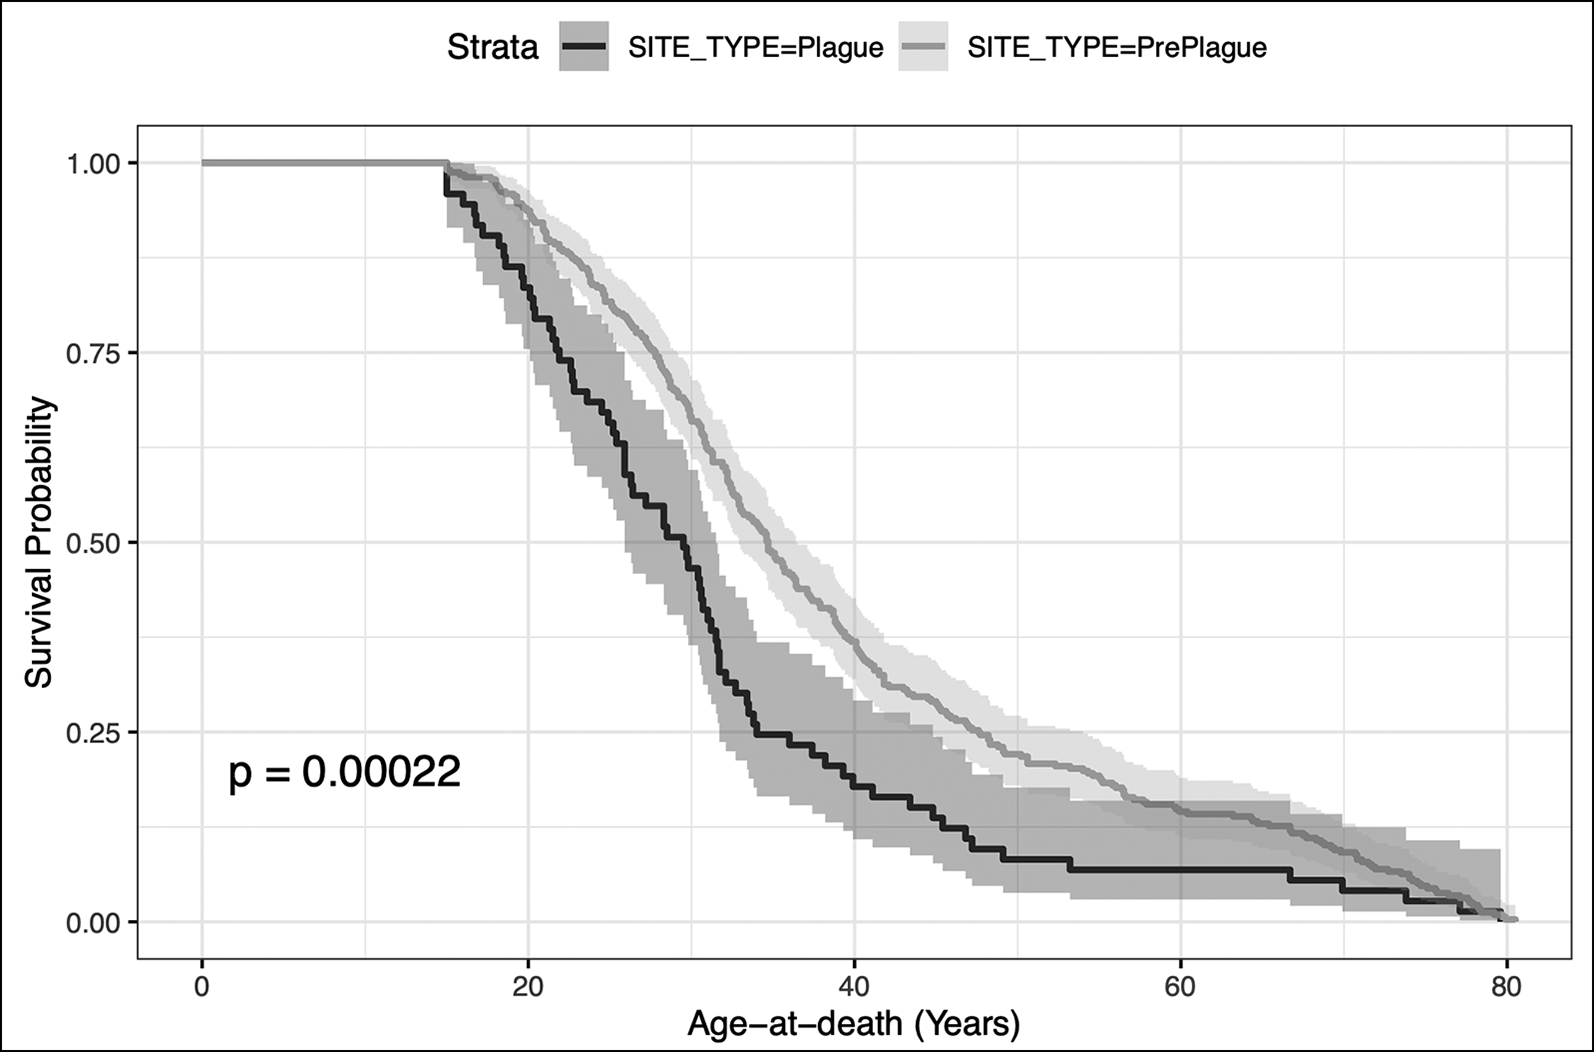
Kolmogorov-Smirnov analysis indicates that the MLPE distributions for the Black Death burials and the pre-Black Death aggregate are significantly different (D = 0.28, p < 0.01). Survivorship is lower within the Black Death assemblage than within the pre-Black Death aggregates for all ages (Figure 6). The overall survivorship profiles are significantly different (Kaplan-Meier, p < 0.01).
Survivorship profiles for the Hereford Cathedral Black Death mass graves and the pre-Black Death aggregate (figure by authors).

Figure 6 Long description
A line graph compares survival probability against age at death for two groups: Plague and PrePlague. The x-axis represents age at death in years, ranging from 0 to 80. The y-axis represents survival probability, ranging from 0 to 1. The graph includes two data lines: one for Plague sites in black and another for PrePlague sites in gray. The Plague line shows a steeper decline in survival probability compared to the PrePlague line, indicating higher mortality rates during the Plague period. The p-value of 0.00022 suggests a statistically significant difference between the two groups. All values are approximated.
Discussion
Pre-Black Death demography
Across the pre-Black Death assemblages, mortality is elevated among young adults, peaking at 25–34 years, then declining at 35–54 years and remaining low for all subsequent age-at-death intervals. The lack of significant differences between the age-at-death distributions or survivorship profiles suggests that this demographic profile is typical for pre-Black Death attritional cemeteries in Britain, when skeletons are aged using transition analysis.
Demographic comparisons using published data are difficult due to inherent variation in age-at-death estimation methods and assigned age-at-death intervals. The pre-Black Death mortality peak observed here (25–34 years) is consistent with other pre-plague assemblages where similar age-at-death intervals are used, including the eleventh–twelfth centuries cemetery of St Nicholas Shambles, London (White Reference White1998), and the AD 1120–1230 burials from St Oswald’s Priory, Gloucester (Rogers Reference Rogers, Heighway and Bryant1999). While mortality in the earlier burials from St Oswald’s peaks during young adulthood, it remains elevated for individuals estimated to be 25–44 years (Rogers Reference Rogers, Heighway and Bryant1999). As these studies used non-Bayesian techniques, this consistency is particularly revealing. It seems that a peak in mortality at 25–34 years is common to pre-Black Death attritional cemeteries in Britain, and that this is visible in age-at-death profiles regardless of whether Bayesian age-estimation methods are used.
The greatest difference between the pre-Black Death assemblages is the elevated mortality within the Black Gate sample at 25–34 years. This may reflect demographic variation across urban and rural communities, as the Black Gate cemetery served a more urban community than the St Dochdwy and Wharram Percy cemeteries (Beresford Reference Beresford, Andrews and Milne1979; Loe Reference Loe2003; Holbrook & Thomas Reference Holbrook and Thomas2005; Mays Reference Mays2007; Nolan Reference Nolan2010; Mahoney Swales Reference Mahoney Swales2012), although previous studies suggest that it is difficult to distinguish early medieval urban and rural communities osteologically via demography or stress markers (Lewis Reference Lewis2002; Mahoney Swales Reference Mahoney Swales2012). Future research examining dietary isotopes or the prevalence of stress markers within and between cemeteries will provide greater clarity around potential causes of the elevated mortality of 25–34-year-olds within the Black Gate cemetery.
Exploring Black Death demography in the context of pre-Plague demography
Previous analysis of the Hereford Cathedral mass graves assemblage suggests that the demographic profile is typical for Black Death cemeteries (Franklin et al. Reference Franklin2023); the observed large proportion of young adults is also visible within the Black Death burials from East Smithfield (DeWitte Reference DeWitte2010a) and from other sites across mainland Europe (Bramanti et al. Reference Bramanti2018).
In a previous comparison of the Hereford Cathedral ‘attritional’ cemetery and mass graves, we found that young adults were over-represented among the plague burials (Franklin et al. Reference Franklin2023). Here, we confirm that young adults remain over-represented in the Hereford Cathedral mass graves when compared to cemeteries that pre-date the Black Death and therefore do not contain plague victims. While the mortality peak at 25–34 years, which seems indicative of pre-Black Death attritional profiles, exists within the Black Death assemblage, it is the proportion of 15–24-year-olds that is the primary differentiator between plague and attritional age-at-death distributions. A high proportion of young adults followed by a mortality peak at 25–34 years likely indicates plague mortality, while a lower proportion of young adults followed by a mortality peak at 25–34 years is more likely to represent an attritional demography.
Exploring elevated young adult representation within Black Death burials
A key question in the historiography of the Black Death is whether the infection killed indiscriminately or was selective. An over-representation of young adults within plague burials compared to attritional cemeteries suggests that this age group was more vulnerable under plague mortality than attritional mortality. Yet, it is difficult to determine whether this indicates indiscriminate or selective mortality, particularly as the age distributions of living populations from the period immediately prior to the Black Death are unknown. It is possible that there was a high proportion of young adults living in Hereford in the mid-fourteenth century. Those aged 32 or older would have survived the nation-wide Great Famine of 1315–1317 and it could be that the relatively low representation of individuals aged 35 or older within the Black Death burials reflects deaths during the Great Famine. It is also possible that aspects of medieval life placed young adults at greater risk of contracting, and dying of, plague. Documentary sources indicate that those of lower socioeconomic status had elevated mortality during the outbreak (Hatcher Reference Hatcher1977; Benedictow Reference Benedictow2004; Gummer Reference Gummer2010) and younger people, with less accumulated wealth and resources, may have been particularly vulnerable.
Linear enamel hypoplasia, bands of reduced enamel formation on tooth crowns that may reflect substantial physiological disruption during early childhood, were significantly more prevalent among individuals from the Hereford Cathedral mass graves than those from the attritional burials at this site (Franklin et al. Reference Franklin2023). Linear enamel hypoplasia are also associated with an increased risk of death in the East Smithfield burials, under the Usher model (DeWitte & Wood Reference DeWitte and Wood2008) and when considered as part of a more generalised frailty index (Godde et al. Reference Godde2020). These findings suggest that those experiencing a period of ill-health during childhood, which disrupted tooth formation and immune system development, were more vulnerable to plague during adulthood.
Conclusion
This study identifies similarities across the age-at-death distributions and survivorship profiles for the pre-Black Death human skeletal assemblages from Black Gate, St Dochdwy and Wharram Percy. Age-at-death profiles from all three cemeteries, and the profile generated when the three pre-Black Death cemeteries were aggregated, show a mortality peak at 25–34 years, indicating that this demographic trait may be typical of pre-Black Death attritional medieval demography in British cemeteries. This contrasts with the mortality peak at 15–24 years observed in the assemblage from the Hereford Cathedral mass burials, suggesting that young adults may have been at higher risk of dying during plague outbreaks than they were from dying of other causes in periods when plague was not present. Generating this ‘pre-plague’ demographic profile using transition analysis facilitated a more representative analysis of medieval attritional demography, and provides a base for future comparative studies.
Acknowledgements
The authors are grateful to everybody who facilitated this research by permitting access to the included skeletal collections: Dr Jo Buckberry (Biological Anthropology Research Centre, University of Bradford); Dr Simon Mays and Dr Sarah Stark (Historic England Fort Cumberland); Dr Adelle Bricking, Evan Chapman and Jody Deacon (National Museum Cardiff); and Dr Elizabeth Craig-Akins, Dr Nina Maaranen and Dr Sophie Newman (University of Sheffield).
Funding statement
We are very grateful to the Cambridge Trust for funding this research.
Data availability
Data relating to this publication are available at: https://doi.org/10.17863/CAM.115631
Author contributions: CRediT categories
Emilia R. Franklin: Conceptualization-Lead, Data curation-Lead, Formal analysis-Lead, Funding acquisition-Lead, Methodology-Supporting, Project administration-Lead, Validation-Supporting, Visualization-Lead, Writing - original draft-Lead. John Robb: Conceptualization-Supporting, Formal analysis-Supporting, Funding acquisition-Supporting, Methodology-Lead, Supervision-Lead, Validation-Lead, Writing - review & editing-Lead. Piers D. Mitchell: Conceptualization-Supporting, Formal analysis-Supporting, Funding acquisition-Supporting, Methodology-Lead, Supervision-Lead, Validation-Lead, Writing - review & editing-Lead.


 Open access


