

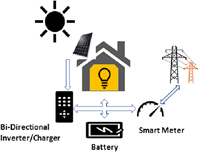

DISCUSSION POINTS
• What is the role of energy storage in renewable energy growth and grid stabilization?
• Energy storage technologies for smart grid applications.
• Economics of energy storage for demand charge applications.
• Grid-scale versus distributed energy storage.
Introduction
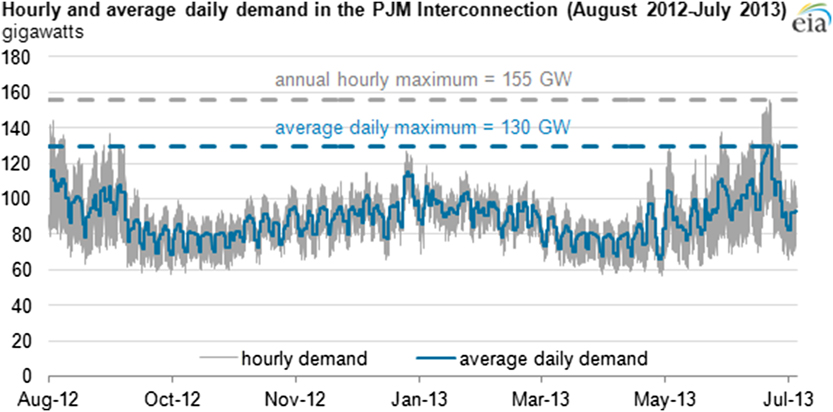
Electricity demand is not constant and generation equipment is built to serve the highest demand hour, even if it only occurs once per year (Fig. 1).Reference Booth1 Utilities help meet this peak demand by installing gas combustion turbines that run only during peak periods, usually late afternoon.Reference Lazar and Baldwin2 As a result, gas peaking turbines are underutilized and have higher levelized cost of energy (LCOE) ($179–$230/MW h) compared with base load generators like gas combined cycle ($61–$87/MW h) or coal ($66–$151/MW h).3
Hourly and average daily demand in the Eastern United States electricity transmission network: the PJM Interconnection (August 2012–July 2013). Generation and transmission equipment is built to handle the annual hourly maximum: 155 GW while the majority of the year this equipment remains underutilized, Source: W. Booth, Energy Inf. Agency (September 2013).Reference Booth1
Energy storage (ES) technology can charge during low demand periods and discharge during high demand periods to reduce peak electricity generation and therefore curtail new gas-peaking turbines and transmission equipment. When the utility installs ES technology it is referred to as ‘in front of the meter ES’ and when electricity customers install ES technology it is referred to as ‘behind the meter ES’.
In-front of the meter energy storage installations
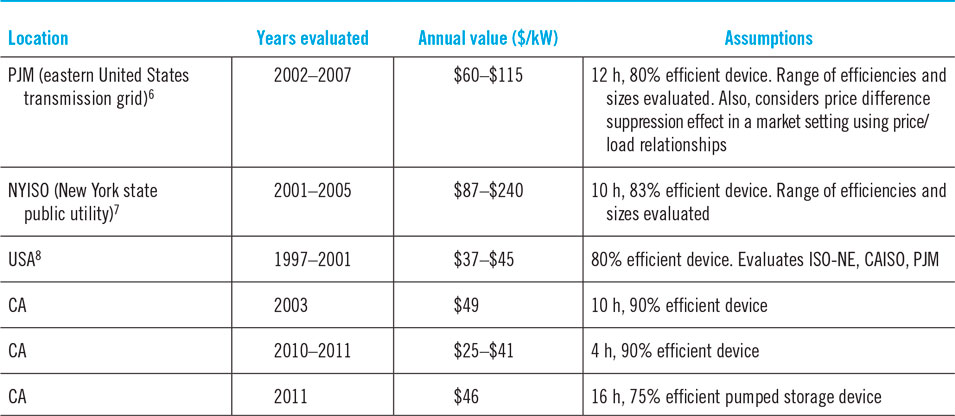
In front of the meter energy storage is relatively large in scale and project based. Traditional storage technologies include hydroelectric storage, compressed air storage, and lead acid battery storage.Reference Denholm, Jorgenson, Jenkin, Palchak, Kirby, Malley, Hummon and Ma4 Pumped hydro storage accounts for 98% of US national energy storage capacity and works by pumping water from a low elevation reservoir to a higher reservoir to charge the system and then releasing the water through a turbine between the two reservoirs to discharge the system.Reference Marcy5 Pumped hydro is economical when built into sites that already have water elevation change and is usually built into existing hydroelectric dams. Compressed air storage works by compressing air into large, underground caverns and then releasing the high-pressure air through a turbine when electricity is required. Energy storage installations provide value for the utility in price arbitrage and ancillary services. Price arbitrage is buying electricity when it is inexpensive, usually during the night, to charge storage systems and then discharge the device to sell electricity when it is more expensive. The value of price arbitrage depends on the storage efficiency, utility electricity prices, transmission costs, existing pumped storage capacity, and other factors. Researchers at the National renewable Energy Laboratory (NREL) calculated the arbitrage value at 35$/kW year. for a 300 MW storage device with 75% roundtrip efficiency providing arbitrage for a Colorado utility.Reference Denholm, Jorgenson, Jenkin, Palchak, Kirby, Malley, Hummon and Ma4 Other studies report energy arbitrage values that range from $37 to $115 $/kW year (Table 1).
Value of energy arbitrage.
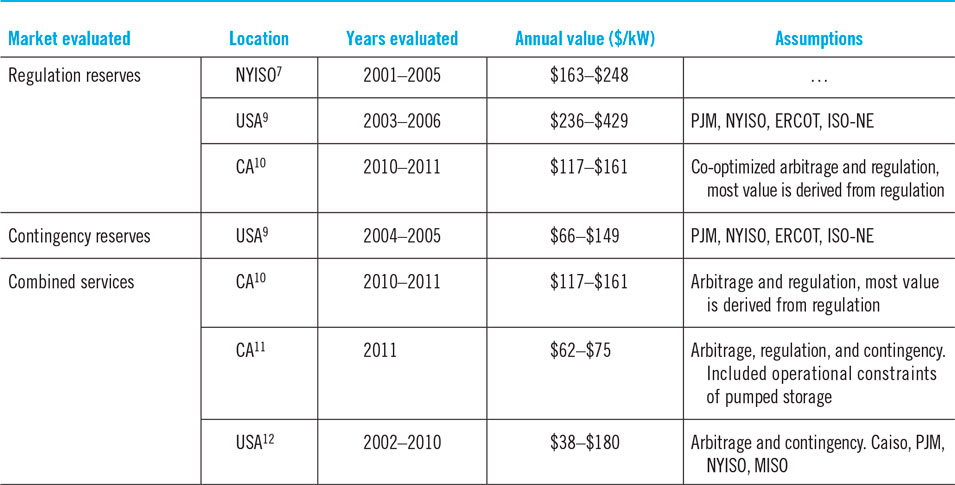
Most energy storage devices cost too much to recoup costs from energy arbitrage alone and have greater value providing ancillary services for utilities. This value comes from contracted payments to reserve power capacity for transmission system compensations, peak turbine replacement, frequency regulation, distribution services, PV integration, and other services.3 NREL valued ES devices at $65/kW year when used to provide reserve power capacity and $109.8/kW year when used to regulate grid frequency.Reference Denholm, Jorgenson, Jenkin, Palchak, Kirby, Malley, Hummon and Ma4 Other studies report values for ancillary services that range from $38 to $248/kW year (Table 2).
Value of ancillary services.
Behind the meter energy storage
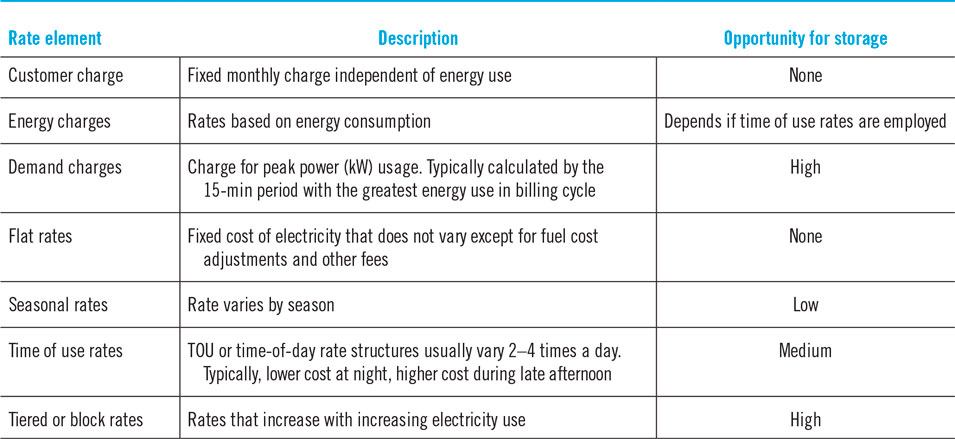
Distributed energy storage does not need to be purchased by the utility, but rather businesses and households can install energy storage and reduce monthly utility bills. Distributed energy storage technologies are located at businesses and homes and they must be deployable and efficient at small scale. Chemical energy storage (batteries) and thermal energy storage (phase change materials) are the dominant behind the meter energy storage technologies since mechanical energy storage technologies like pumped hydro and compressed air storage rely on large scales and specific geography (high water elevation, underground caverns) for high efficiency. Prices vary for customers based on energy used, power used, and time of use, providing value opportunity for energy storage devices to transfer grid energy demand to lower price times and avoid high power draws. The most common utility rate elements and their relative potential to drive behind the meter ES sales are shown in Table 3.
Utility rate categories.Reference Ong, Campbell, Clark, Ong, Campbell and Clark13
Energy and power are charged differently because they require different investments from the utility, even if the quantity of energy is the same between both cases. One 100 W bulb powered for 10 h uses the same energy as ten, 100 W bulbs powered for 1 h: 1000 W h. However, the second case requires greater utility investments in generating capacity and grid maintenance to be able to provide the higher power levels, 1000 W, for one hour versus a much smaller load, 100 W, for a longer time.
Demand charges are based on peak power, not energy, and therefore energy storage technologies have unique value potential for demand charge reduction since energy storage capital costs are a stronger function of energy stored than power delivered. For many building load profiles, it takes a relatively low amount of energy to reduce peak power levels since these peak power periods occur over a brief time. The following section presents example utility rate schedules and how demand charges can be reduced by energy storage technology. The next section reviews technologies utility customers can purchase to reduce demand charges including batteries and thermal energy storage (TES). The final section presents simulation results of lithium ion batteries and phase change cooling storage for reducing demand charges on real building load profiles.
Utility demand charges
Demand charge rates
Utilities have rate schedules for industrial, commercial, and some residential customers that incorporate both demand and energy charges. Demand and energy charges can have different pricing based on the season, time of use, and how much electricity that customer has already used. Energy charge is calculated by multiplying the energy use by the associated rate. For example, if an industrial plant consumed 10,000 kW h of electricity in July and energy is charged at $0.10/kW h, the energy charge for July is $1000. If TOU energy rate structures were applicable, then the energy consumed at different periods would be charged at different prices. In contrast, demand charges are calculated based on the 15-min period with the highest energy use per month. For example, if an industrial plant’s highest energy use in the month of July was 90,000 kW h from 3:00 p.m. to 3:15 p.m. on July 5, the maximum demand is calculated by dividing the energy by 15 min or 900 s to give 100 kW. If the utility demand charge is $30/kW, that industrial customer is charged $30/kW times 100 kW to give a $3000 demand charge for July. If TOU demand rate structures are applicable, then the customer will be billed the period demand charge based on when their maximum demand occurs.
Table 4 presents three example rate schedules for three different sized Southern California Edison (SCE) customers that includes demand and energy charges with time of use variable pricing.
2016 SCE electricity prices for industrial customers.14
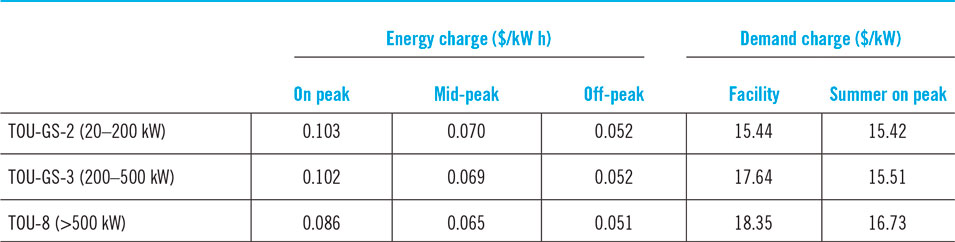
For SCE, the facility demand charge applies always while the summer on-peak rate is an additional charge that applies from June to September from noon to 6 p.m. for a total demand charge ∼$30/kW. A wider look at demand charges across utilities nationwide showed that SCE’s demand charge, ∼$30/kW during summer on-peak hours, were anomalously high. Wang and Li found 204 utilities that offered TOU programs for industrial customers distributed among 44 states. They surveyed the largest utility (by number of customers) in each of the 44 states represented in the study and compiled their peak energy and demand charges. 34 of 44 states surveyed had demand charges with the median $10.83/kW and maximum $25.47/kW (Vermont).Reference Wang and Li15 Demand charges vary based on building demand, utility, time of use, and other variables so aggregating all demand charges was challenging.
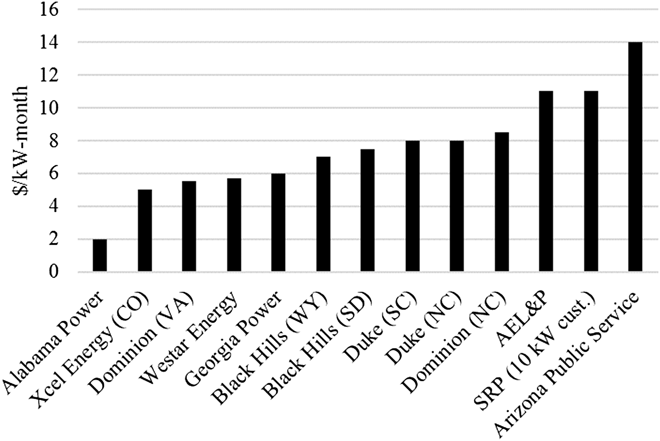
Residential customers have historically not been charged for demand because household electricity use did not vary significantly between homes. Appliances like televisions, washing machines, and lights were nearly universal and their use patterns consistent enough so that the demand cost to the utility could be incorporated into flat or tiered energy charges. However, increases in rooftop solar panels, electric cars, energy storage, and demand control software create greater variability between household demands that cannot be properly accounted for with flat rate energy charges.Reference Lehrman16 At least 13 utilities have offered rate plans with demand charges for residents and more demand charges are proposed (Fig. 2).Reference Lehrman16
Summer demand charge for residential customers.
Demand charge reduction value
Residential demand charges provide economic opportunity for peak shaving technologies (smart meters, batteries, and TES) to lower residents’ utility bills. Figure 3 is a January load profile from a Texan residence that was selected from a database of >100 anonymized Texan households due to its relatively high differences between average load and peak demand.17 While the house used more power during the summer due to higher air conditioning load, the differences between peak and average load was greater in January than in July due to the air conditioning running most of the day.
January load profile for a Texan house with high demand reduction potential.
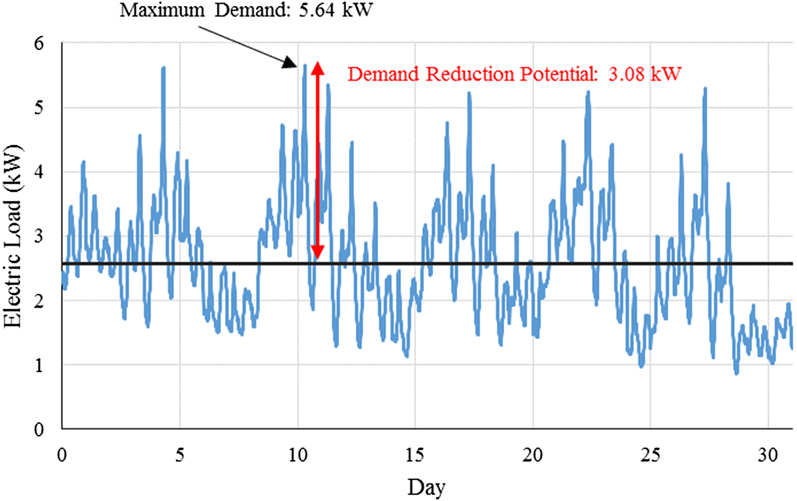
The average power for the house was 2.56 kW with demand as high as 5.64 kW and as low as 0.86 kW. Applying a demand charge of $10/kW-month, which is on the high end of residential demand charges, this household would pay $56.40 in demand charge for the month of January. Energy storage devices could level this demand by charging during low demand hours and discharging during peak demand hours. Assuming no change in energy consumption habits, the maximum possible reduction in demand charges was calculated by subtracting the average electric load from the peak electric load, which for the household in Fig. 3, was 3.08 kW. Multiplying this reduction by the demand charge gave a potential utility bill reduction of $30.8 for the month of January. This value is an upper, theoretical limit because the storage device would have to be 100% efficient and capable of matching the extreme load changes in time. Furthermore, an average Texan home would have a monthly demand charge closer to $20, which is half that of the large home in Fig. 3.
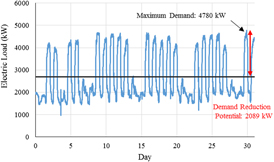
Commercial/industrial buildings have significantly greater demand charge reduction potential due to greater load variability and higher utility demand charges. Load data for commercial structures was acquired from EnerNOC’s online database which anonymously published demand information, location, building size, and building type for 98 commercial facilities in 2012.18 Figure 4 shows the load profile for a large (1.67 million sq. ft.) commercial building in Los Angeles during the month of July.
Large commercial business property July load profile.
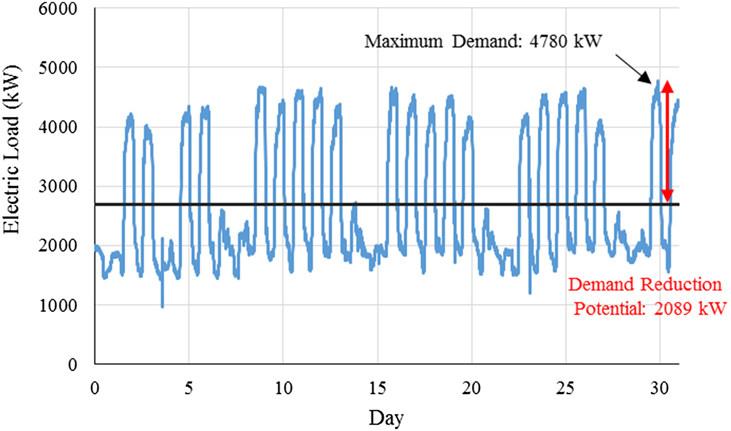
Applying SCE’s summer on-peak demand charge for buildings over 500 kW, $35.08/kW-month, the maximum possible demand charge savings is $73,282. A smaller, 48,878 sq. ft. grocer July load profile had a maximum demand charge reduction potential of $3753.
Given the greater potential demand charge reduction opportunity for commercial/industrial installations, it is likely that behind the meter energy storage devices will have the greatest market penetration in large facilities. Residential demand charges are limited and the electric bill is a relatively small cost for most homeowners. The potential savings presented above are theoretical and require a 100% efficient energy storage device with large energy and power capacity to level the variable load. Real energy storage devices have lower efficiencies, limited power capacity, and ramp periods that cannot perfectly meet all demand peaks. The final section presents results from a more complicated NREL ES model that concludes which ES parameters are most important for demand charge reduction value.
Current energy storage technologies for demand charge reduction
Energy storage parameters
Current energy storage technologies marketed for demand charge reduction divide into two categories: chemical and thermal devices. Mechanical devices like pumped hydro and compressed air storage require specific geography and therefore are not relevant for utility customer demand charge reduction. Chemical devices are batteries that charge during low demand hours and discharge during peak periods to reduce peak demand. The two battery technologies investigated here are lead acid and lithium-ion. Future lithium ion battery chemistries are also discussed. Thermal devices work by heating or cooling an insulated medium during low demand periods and then providing heating or cooling capacity during peak demand periods to avoid using electricity from the grid. The thermal devices investigated here are water heaters, ice chillers, and phase change material (PCM).
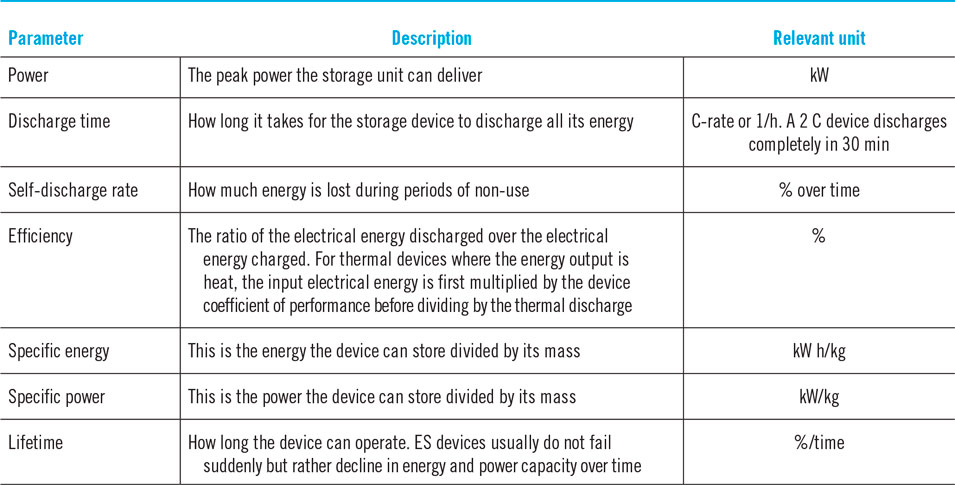
Energy storage technologies were evaluated based on parameters listed in the following table with the units most relevant for behind the meter demand charge reduction listed (Table 5).
Energy storage device parameters.
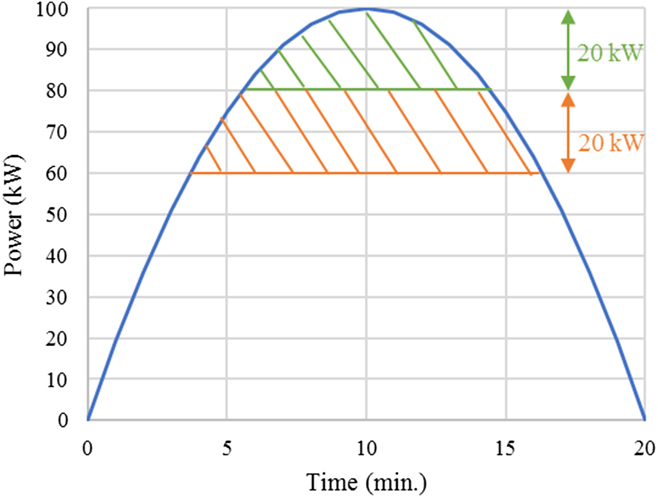
The value of energy storage technology for demand charge reduction is most sensitive to discharge time. Energy storage systems cost is primarily a function of the energy stored, or $/kW h. However, most building loads are parabolic in that increasing power use occurs over a decreased time period.17 Therefore, buildings require less energy to reduce the first kW of consumption than the second and so on etc. (Fig. 5).
The energy required to reduce demand is the area under the power versus time curve. For parabolic demand profiles, reducing demand 20 kW requires less incremental energy than further reduction to 40 kW.
System cost is proportional to both energy and power, while the demand charge reduction value is only proportional to power. Maximizing the power to energy ratio of the technology tends to minimize its payback period; however, there are limits. The energy storage system must have enough energy to meet the peak demand over it’s entire duration. Furthermore, energy storage efficiency often decreases with larger power to energy ratios. The energy storage technologies currently available for demand charge reduction are detailed below with particular attention given to their discharge time, efficiencies, and capital cost.
Battery system for demand charge reduction
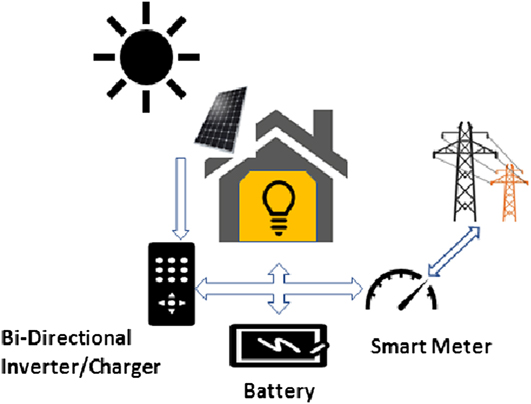
Batteries are charged during low electricity price periods from grid alternating current (AC) which is converted to direct current (DC) using an inverter. During peak periods, batteries discharge to power electric loads by again passing through the DC–AC inverter (Fig. 6).
Battery system configuration for demand charge reduction. PV integration is also possible through a charge controller.
The battery bank can be of different cell types (lead acid, lithium ion, etc.) with each cell type having different discharge time, efficiency, specific energy, and cost. Inverters are largely agnostic with respect to battery cell type and thus are often cost estimated independently from battery cells. Inverters have conversion efficiencies that range from 95 to 99%Reference Bayram and Ustun19 and typical balance of system costs for battery storage (inverter, containers, inter-connects, engineering, etc.) averages $670/kW with 41% cost reductions predicted by 2020.Reference Munsell20 The battery storage roundtrip efficiency is less than the inverter efficiency because power conversion happens twice: AC–DC when charging the battery and DC–AC when discharging the battery. Furthermore, batteries themselves are not 100% efficient and generate heat when charging/discharging. Studies on current battery energy storage systems cite roundtrip efficiencies from 83 to 89%.Reference Denholm, Jorgenson, Jenkin, Palchak, Kirby, Malley, Hummon and Ma4,Reference Kutney, Schoen and Yi21–Reference Manuel24 Battery cell cost scales largely with energy while inverter costs scale with power so systems with higher power to energy ratios generally cost more but bring greater value for demand charge reduction applications.
Therefore, it is important when discussing battery costs to distinguish between battery cell cost and balance of system costs. In addition, battery system costs can be normalized by power output or energy stored or a combination. For example, behind the meter battery costs simulated by NREL have an energy normalized price ($/kW h) and power normalized cost ($/kW) that when multiplied by the system energy and power levels respectively are then summed for the full system cost. This full system cost can be divided by the system energy or power value to give a single energy or power normalized cost.
Lead acid batteries
Lead acid batteries have the longest history compared to other battery varieties. Lead acid cells work by submerging a lead dioxide cathode and lead anode in a sulfuric acid electrolyte bath. During discharge, both electrodes convert to lead sulfate while charging converts the electrodes back to lead as water in the electrolyte is broken down into gaseous hydrogen and oxygen.Reference Al-Hallaj, Wilke, Schweitzer, Badran, Murad, Baydoun and Daghir25
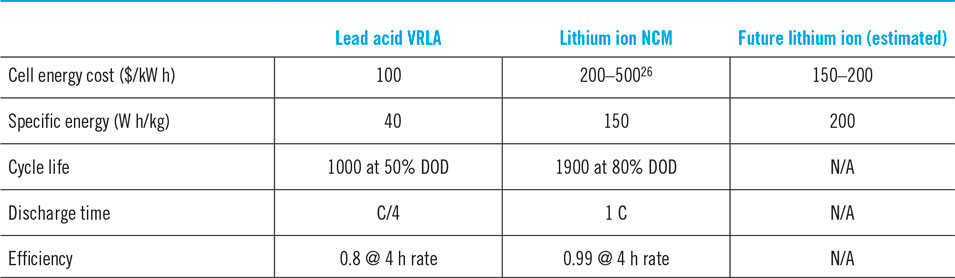
The main advantage of lead acid batteries for behind the meter energy storage is their low initial cost; however, lead acid batteries have poor efficiency at higher discharge rates (60% at 1 C rate).Reference Albright, Edie and Al-Hallaj26 For demand charge reduction, where high power is more critical than high energy, lead acid batteries are a poor choice because systems must be large to achieve higher efficiencies, which negates the economic benefit of lower initial costs. Large lead acid battery installations produce significant concentrations of Hydrogen gas which can be a significant safety hazard for energy storage installations.Reference Bhatia27 Furthermore, lead acid batteries degrade significantly above 25 °C and have reduced cycle life compared to lithium ion batteries.Reference Al-Hallaj, Wilke, Schweitzer, Badran, Murad, Baydoun and Daghir25,Reference Albright, Edie and Al-Hallaj26 Most battery types, including lead acid cells, degrade quickly if fully discharged after every charge. Therefore, battery lifecycles are rated based on a set depth of discharge (DOD) or percentage the battery was drained after each charge cycle. Battery vendor Trojan sells a 100 A h lead acid battery for $224/kW h with a cycle life of 600 cycles at 80% (DOD). Dividing the energy normalized storage cost by the DOD (0.8) and cycle life (600) gives the battery lifecycle cost of $0.47/kW h, which is significantly higher than lithium ion cells ($0.29/kW h).
Lithium ion batteries
Lithium ion batteries have received a lot of research and commercial attention over the last decade and are in most portable electronics and electric vehicles. A lithium metal oxide cathode and a graphite anode are separated by an organic liquid electrolyte.Reference Al-Hallaj, Wilke, Schweitzer, Badran, Murad, Baydoun and Daghir25 Lithium has a low density, 534 kg/m3, and a high electrode potential (−3.04 V), giving rise to large specific energy.Reference Housecroft and Constable28 Furthermore, Li-ion batteries have a longer cycle life that is more tolerant of greater DOD: 1900 cycles at 80% DOD versus lead acid batteries that sustain 1000 cycles at 50% DOD.Reference Albright, Edie and Al-Hallaj26 Most relevant for demand charge reduction, Li-ion batteries have greater power capability than lead acid batteries: they can discharge fully in 1 h with 92% efficiency.Reference Albright, Edie and Al-Hallaj26
Traditionally, the main disadvantage to lithium ion batteries were their higher cost. However, lithium-ion battery production is less mature than lead acid batteries and still cost >$300/kW h compared with ∼$100/kW h for lead acid.Reference Albright, Edie and Al-Hallaj26 However, prices have fallen dramatically in the last 10 years and further cost reductions are likely (Fig. 7).
Lithium ion battery cost over time (Source: Benchmark Mineral Intelligence).
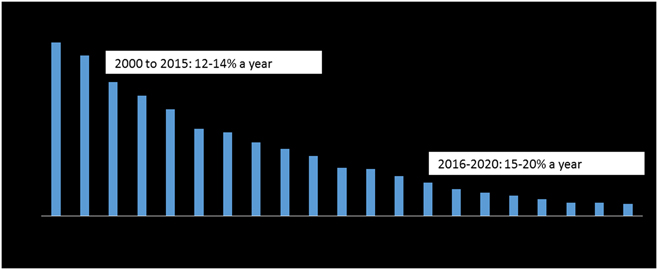
Furthermore, lithium ion batteries can undergo greater charge–discharge cycles leading to a lower lifecycle cost compared to lead acid battery technology. Vendor AllCell Technologies quotes lithium ion batteries at $470/kW h with a 2000 cycle life at 80% DOD. Dividing the energy normalized storage cost by the DOD (0.8) and cycle life (2000) gives the battery lifecycle cost of $0.29/kW h, which is significantly less than lead acid batteries ($0.47/kW h) despite higher initial costs.
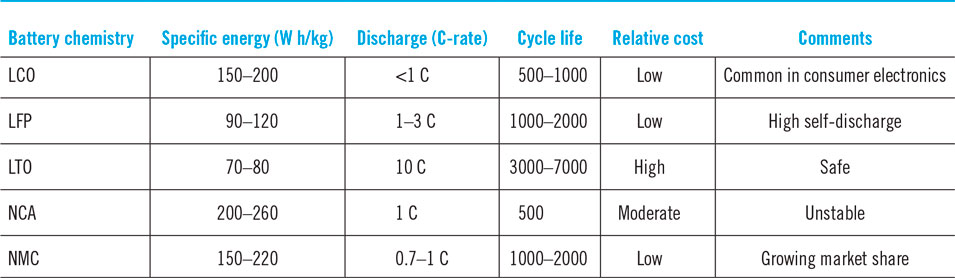
Lithium ion batteries differ primarily in their cathode chemistry creating tradeoffs in cost, specific energy, specific power, and safety.29 For most consumer electronics, LiCO2 (LCO) dominates due to their high energy density.Reference Guo, Hu and Wan30,Reference Julien, Mauger, Zaghib and Groult31 However, LiCO2 batteries have relatively low specific power and life compared to other lithium ion chemistries. High specific power batteries include LiFePO4 (LFP) batteries as well as Lithium Titanate batteries (LTO). LFP batteries can have a long cycle life and moderate energy density; however, they exhibit greater self-discharge which is a concern for energy storage applications.29,Reference Julien, Mauger, Zaghib and Groult31 LTO batteries have poor energy density and high costs, but fast discharge times and long cycle lives.29 Toshiba sells a LTO battery called the SCiB with an advertised lifetime of 10,000 charge/discharge cycles and 80% capacity charge in 6 min. If costs decrease, such a battery could work well for demand charge reduction applications where power capacity is emphasized over energy capacity.Reference Environ, Etacheri, Marom, Elazari, Salitra and Aurbach32
Tesla is focused on two battery chemistries for electricity storage batteries: LiNiCoAlO2 (NCA) and LiNiMnCoO2 (NMC).Reference Fehrenbacher33 Both chemistries can be tuned to favor a high energy density or power density based on the application.29 An NCA battery typically has a shorter cycle life, higher energy density, and higher power output than NMC batteries. Tesla envisions this battery chemistry replacing peak power generators that operate a few times a year at high power. An NMC battery generally has a longer cycle life, more stability, and less energy density. Tesla uses NMC batteries in their power wall installed in homes and businesses that cycle the battery daily.Reference Fehrenbacher33 The battery chemistries discussed here are summarized in Table 6.
Comparison between different lithium ion battery chemistries.29
Commercial integrated lithium ion battery systems exist including products from Tesla and LG that range in size from 3 to 10 kW h. Table 7 compares different battery storage options and their cost. It is important to note here that these costs and cost normalizations are for whole battery systems that include an inverter. Lithium ion cell costs are cheaper as shown in Fig. 7.
Residential energy storage options.
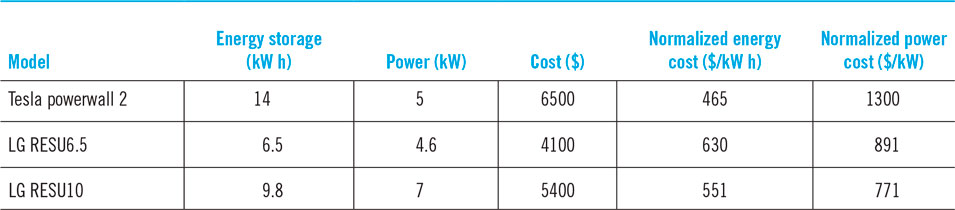
Tesla recently released higher power systems targeting commercial and industrial demand charge reduction market. A 100 kW h system that discharges in 2 h (C/2), has a total hardware cost of $60,550: $600/kW h or $1200/kW. LG markets even larger systems (1.68 MW h) for commercial demand charge reduction and frequency regulation with >2 C discharge rate (4 MW); however, price information is unavailable.
Lower discharge times compromise the safety of lithium-ion battery packs due to the increased risk of thermal runaway propagation. Thermal runaway can occur when a Li-cell reaches an abnormally elevated temperature either from a short circuit or de-stabilization of the cathode chemistry. The onset temperature for thermal runaway depends on the cathode chemistry and heating rate but ranges from 90 to 200 °C. At these temperatures, unwanted exothermic chemical reactions begin to occur inside the cell. If the reaction heat generation is not dissipated, the cell temperature continues to climb, initiating more exothermic chemical reactions. This feedback loop can quickly escalate, resulting in peak cell temperatures more than 700 °C and the expulsion of superheated gases and flames. Additionally, the heat released from the failing cell can raise the temperature of surrounding cells in a module high enough to force them into a thermal runaway, as well, causing thermal runaway propagation.Reference Al-Hallaj, Wilke, Schweitzer, Badran, Murad, Baydoun and Daghir25
For Li-ion energy storage systems, a single cell in thermal runaway could quickly turn into thousands of cells in thermal runaway, creating an emergency. Such situations are not hypothetical, as illustrated by the battery fire that occurred in a Boeing 787 Dreamliner demonstrated in January 2013.Reference Williard, He, Hendricks and Pecht34 Thermal runaway has also been identified in consumer electronics fires, including 6 Dell laptops utilizing Sony Li-ion cells that caught fire between 2005 and 2006. These fires prompted Dell to recall 4.2 million laptops and brought the issue of thermal runaway into the public spotlight.Reference Takahara35
Li-ion energy storage systems use a combination of active and passive thermal management systems to ensure heat from a single cell in thermal runaway does not heat surrounding cells to thermal runaway conditions as well. Active thermal management systems use cooled air or liquid that circulates around battery cells to absorb generated heat. While active cooling can deliver relatively high cooling flux, energy is required for the safety system to operate. Passive cooling systems rely on the thermal properties of the substrate holding Li-ion cells to dissipate generated heat. AllCell Technologies (Chicago, IL, USA) has pioneered the use of phase change materials (PCM) for cooling Li-ion batteries and has enhanced the PCM thermal conductivity by embedding it in a graphite matrix. The use of these PCM composites with Li-ion cells has been shown to be sufficient in managing the temperature rise of certain Li-ion batteries during transient operation.Reference Schweitzer, Wilke, Khateeb and Al-Hallaj36 Graphite enhanced PCM materials have also been shown to arrest thermal runaway propagation in Li-ion battery packs.Reference Kizilel, Sabbah, Selman and Al-Hallaj37
Lithium ion batteries have environmental impacts both in production and disposal. The United States EPA published a comprehensive life cycle assessment on lithium ion battery technology including LiCoO2 and LiFePO4 among other cathode chemistries. Cathodes containing cobalt and nickel metal require processing that can have adverse respiratory, pulmonary, and neurological effects in those exposed.Reference Amarakoon, Smith and Segal38 Furthermore, the manufacturing of cathode materials is energy intensive and can be a global warming contributor if the energy used for production is nonrenewable. Finding secondary use for batteries and recycling materials can significantly reduce the battery life cycle impact. Companies focused on battery recycling exist with cobalt, copper, and nickel the most commonly recycled materials.Reference Boyden, Soo and Doolan39 With the tremendous sales growth of Li-ion batteries, economists have speculated on raw material scarcity. Most of the known supply of lithium is in Bolivia, Argentina, Chile, Australia, and China.40 The supply is ample and there is little concern of global shortages. Greater concern is placed in the availability of rare earth metals for different cathode chemistries as well as for the electric motors and magnets that will grow in conjuction with the Li-ion battery industry. However, battery research is extremely active and new chemistries are forecasted.
Future lithium ion battery technology
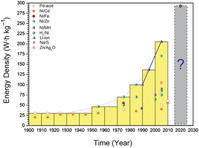
Initial lithium battery chemistry research focused on a pure lithium anode because its light weight and high chemical reactivity promised anodes with high theoretical charge storage capacity (3860 mA h/g). In 1977, Exxon found that on cycling, pure lithium anodes nucleate dendrites that grow across the electrolyte to the cathode and short circuit the battery, causing failure and the risk of fire. Despite this setback, researchers persisted with pure lithium anode chemistry in pursuit of high charge capacity and energy density. A long string of unsuccessful prototypes eventually forced a change from pure lithium to the current anode paradigm, intercalation of lithium ions in graphite and other carbon structures. These anodes can accommodate one Li for every six C atoms, leading to a significantly lower charge capacity, 372 mA h/g, compared to pure Li metal. The low Li capacity of graphite anodes fundamentally limits the energy density of today’s Li-ion batteries (Fig. 8).
Secondary battery energy density over time. Lithium ion batteries are currently the most energy dense chemistry with substantial improvement possible by 2020.Reference Crabtree, Kócs and Trahey45
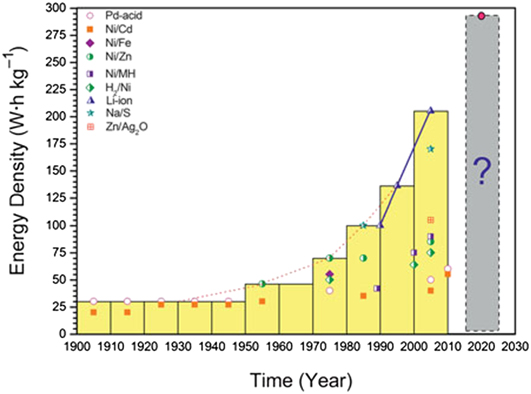
Si anodes offer an alternative to graphite, accommodating 4.4 Li ions for each Si atom for a theoretical charge capacity of 4200 mA h/g, slightly higher than for pure Li metal.Reference Wu and Cui41 Accepting so many Li ions implies a large volume expansion, over 400%; this is the major challenge for Si anodes. The large volume change on cycling leads to fatigue and fracture of the anode, electrically isolating the fragments that no longer participate in storing and releasing energy. The severe volume expansion can be accommodated without fracturing by nanostructuring in nanoparticles or nanowires, which have greater elastic range than bulk Si. Another approach is to mix Si with graphite in alloys or two phase composites, reducing the average expansion of the mixture to acceptable limits. Mixtures of order 5% Si in graphite are in commercial development, giving incremental but important increases to energy density. Much larger Si content is envisioned as techniques are refined.
Replacing the organic liquid electrolyte in conventional Li-ion batteries with a solid-state electrolyte offers compelling advantages for energy density. The rigidity of a solid electrolyte can potentially block the growth of dendrites, allowing use of a pure Li metal anode. The challenge with solid state electrolytes is Li ion conductivity, often an order of magnitude lower than liquid organic electrolytes, severely limiting charge and discharge rates. The second challenge is grain boundaries in solid state electrolytes, offering penetration pathways for dendrites that often grow through the grain boundaries in the electrolyte to reach the cathode and short circuit the battery. Despite these challenges, the combination of Li metal anode and solid state electrolyte is a promising direction actively pursued by the community.Reference Takada42
The cathode offers opportunities for significant improvement in the energy density of Li-ion batteries. The most popular cathode, LixCoO2, can reversibly intercalate Li over only half its range, limiting its practical capacity to 140–180 mA h/g, less than half the capacity of graphite anodes.Reference Whittingham22 Substituting some of the Co with other transition metals such as Ni or Mn allows incrementally higher voltage, capacity and energy density. Advances in these mixed transition metal oxide cathodes are the dominant direction in high energy density Li-ion batteries.Reference Manthiram43
Radical departures from the conventional Li-ion format, often called “beyond Li-ion batteries,” offer opportunities for a step change in energy density. The most attractive departure is replacing the intercalation cathode with a conversion cathode, where Li forms a high energy covalent bond with the cathode atoms to create a new compound. Two of the most attractive conversion cathodes are oxygen with a theoretical battery energy density of approximately 3500 W h/g and sulfur, with a theoretical battery energy density of 2567 W h/g.Reference Bruce, Freunberger, Hardwick and Tarascon44 Early stage Li–S conversion batteries are now in production for niche markets, achieving approximately 10% of their theoretical energy density, while Li–O batteries are still at the research stage. These batteries, if developed to the point of mass commercialization, would dramatically transform the energy storage landscape for electric transportation and for a smart, decentralized electricity grid.
The different cell types—lead acid, lithium ion, and future lithium ion—are compared in Table 7 with the parameters most valuable for demand charge reduction applications. Reliability data for future lithium ion technology is unavailable and technical statistics are predictions.
Thermal systems
Thermal energy storage (TES) systems differ from batteries because they store energy as heat after electric power is consumed in an air conditioner or heater to change the temperature of a thermal storage medium. TES systems are not as flexible as battery storage because the stored energy can only be used for space heating/cooling; however, TES systems can have higher efficiencies and lower storage costs since thermal storage media are less expensive than chemical storage materials. While TES can only offset cooling and heating loads, there is market potential because space cooling accounts for 9% of total electricity sales and heating accounts for 25%.Reference Michaels47
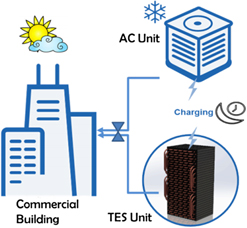
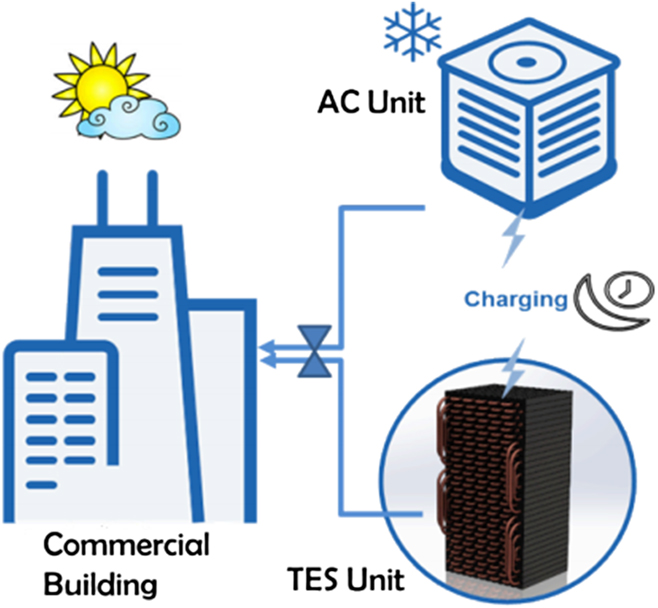
TES cooling systems work by operating an air conditioning cycle to cool a storage medium: water, ice, or a phase-change material, during low demand periods and store this medium inside an insulated container. When cooling is required during high electricity demand periods, the cooled medium heat exchanges with building air to provide space cooling and avoid operating the air conditioner (Fig. 9).
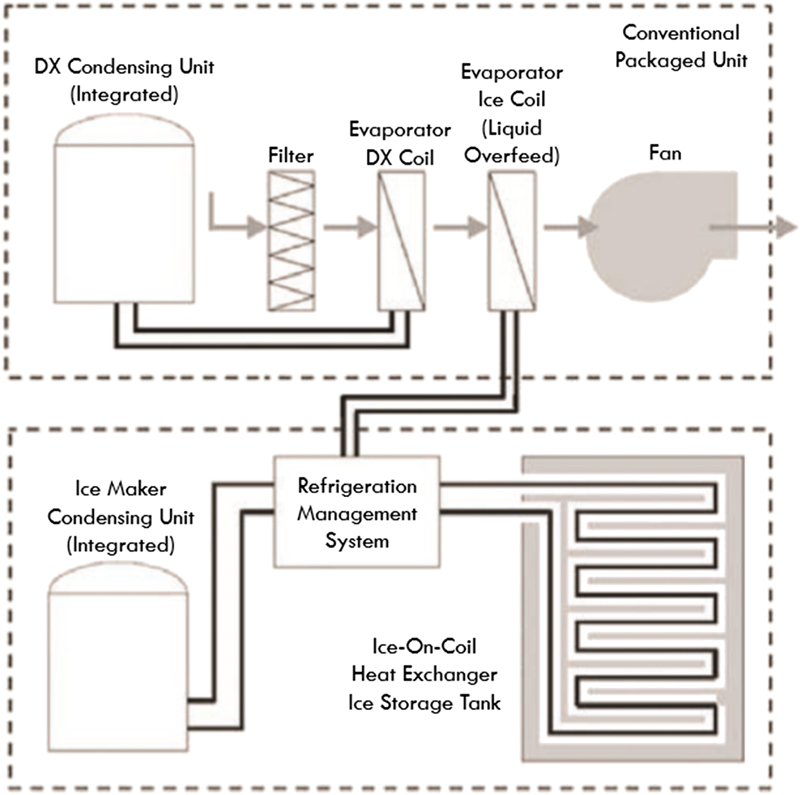
System configuration for an ice storage system operate in parallel with a direct expansion (DX) air conditioning cycle. During low demand periods, the icemaker works to cool a cycle fluid that freezes water in the ice storage tank. For demand charge avoidance, the pump cycles the fluid to the conventional evaporator to provide space cooling and avoid operation of the DX condensing unit. A phase change material with a higher melting temperature can replace ice and use the DX condensing unit for cooling. This eliminates the extra refrigeration cycle required for ice creation.Reference Willis and Parsonnet48 ©ASHRAE www.ashrae.org. ASHRAE Transactions, (Vol 116), (Part 1), (2010).
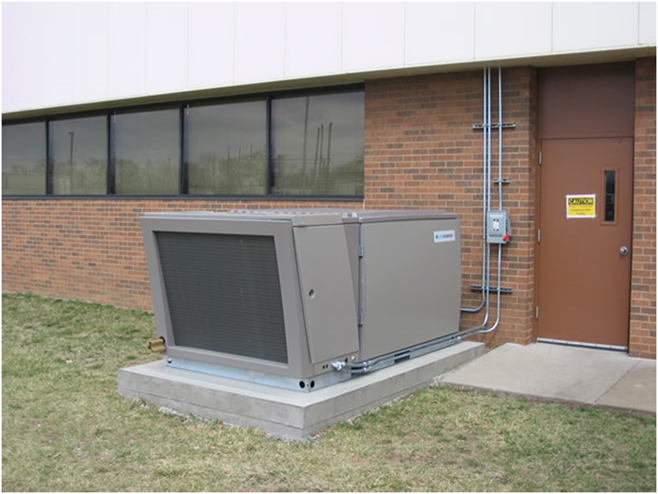
Utilities, governments, and large building owners have long used TES cooling for specific applications and it is a relatively mature technology. Some specific projects include an 8.5 million-gallon chilled-water tank to cool Chicago’s McCormick Place during the day and an ice storage system for the Pasadena Central Library and Civic Center.49 These civil projects are customized to the building size and usually require significant cooperation between the utility and site. Recently, there has been interest in developing smaller TES cooling units for commercial businesses and residences that are mass-produced and sold to building owners (Fig. 10).
Ice Bear 30 Storage unit designed for distributed TES (Source: Ice Energy, reprinted with permission).
In climates that have large daily diurnal temperature swings, TES systems can actually increase the AC efficiency because they can shift day time operation to the night where cooler ambient temperatures increase cycle efficiency.Reference Miller and Energy50,Reference Lazar51 For example, the efficiency of air conditioning cooling systems using R-22 refrigerant degrades by 1.2% per degree above 95 °F while R-410A, the refrigerant replacing R-22, degrades at 1.6% per degree above 95 °F.Reference Miller and Energy50 Heat leakage through the storage container, heat exchangers, and piping make up most roundtrip efficiency losses and can be limited through a greater use of insulating materials. The advantage over battery systems is a near 100% roundtrip efficiency conversion as the only losses for thermal energy stored is heat transfer through the insulating tank which can be inexpensively limited.Reference Denholm, Ong and Booten52 Furthermore, there is little reduction in cycle life due to full discharge and charge cycling as the thermal medium does not chemically degrade during thermal cycling. The primary difference between TES cooling systems is the storage medium; ice and encapsulated wax are common and described below.
Ice storage
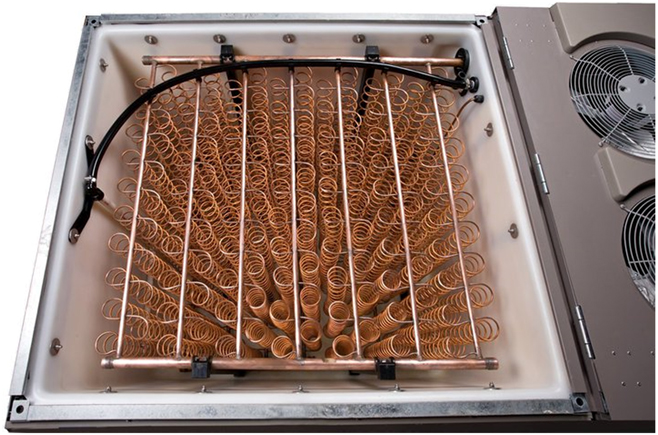
Ice storage operates a refrigeration cycle to cool water to its freezing point of 0 °C and take advantage of the high latent heat of water on freezing or melting, 93 W h/kg. Here it is important to note that the energy density is thermal energy and the input electrical energy is substantially less due to air conditioner thermodynamic efficiency. The storage medium, water, is effectively free; however, a second refrigeration cycle that operates at temperatures below standard air conditioning units is required to freeze water.53 A further challenge with ice systems is the low thermal conductivity of ice, 2.25 W/m K, which limits the cooling power of ice storage devices. Shorter discharge times require greater quantity of expensive copper fins to transfer heat from the ice to discharging fluid. Vendor Ice Energy produces units that can offset up to 6 h of air conditioning cooling per day saving at maximum 40% on cooling bills. The energy density is high given the large latent heat of fusion of ice, 334 kJ/kg, but the discharge rate is limited to C/3 by the low thermal conductivity, 2.25 W/m K, which must be enhanced with a high density of copper coils (Fig. 11).
Ice Bear Ice Storage Compartment (Source: Ice Energy, reprinted with permission).
Ice Bear uses a second refrigeration cycle for freezing ice that integrates with standard air conditioning units as shown in Fig. 12.
Ice Bear system configuration. Separate refrigeration cycles for ice generation (3) and normal air conditioning (4) (Source: Ice Energy, reprinted with permission).

Phase change materials
Phase change materials other than water used for AC cooling include paraffin, fatty acids, and salt hydrates.Reference Bruce, Freunberger, Hardwick and Tarascon44–Reference Michaels47,Reference De Gracia and Cabeza54 Focusing on paraffin wax, the advantage over water is a higher melting temperature, 4–6 °C; however, the latent heat of fusion is lower at 180 J/g and the thermal conductivity is still low at 0.1–0.3 W/m K. Paraffin wax can be encapsulated in a porous graphite structure to increase the thermal conductivity of the phase change composite material.Reference Pincemin, Olives, Py and Christ55 AllCell Technologies manufactures a graphite wax composite that is 80% paraffin wax by weight and has an in-plane bulk thermal conductivity of ∼20 W/m K and bulk latent heat of ∼150 J/g. The mass normalized storage capacity of the wax graphite composite is half that of ice; however, the increased thermal conductivity can reduce the quantity of copper necessary for fast discharge enabling system energy densities that equal ice systems.Reference Razack, Bhaskar, Shabtay, Stilman, Al-hallaj and Avenue56
Due to the higher freezing temperature, wax TES can integrate directly with current AC cooling systems via a heat exchanger between the AC refrigerant and an ethylene glycol loop that runs through the wax composite material (Fig. 13).
PCC TES System with single refrigeration cycle.
This reduces system complexity and costs compared with ice storage systems.
Hot water heating
Hot water heating is another significant electric load for consumers and offsetting water heater operation to low demand periods can reduce demand charges. Utilities have identified electric water heater control as the least expensive current energy storage solutionReference Boston57 with Sandia national labs estimating system installation cost at $110–$300 per kW of electric water heater power.Reference Podorson58 The United States has about 45 million electric water heaters in service that demand 2–3 kWReference Kepplinger, Huber and Petrasch59 with most residential hot water usage in the morning and evening hours.Reference Lazar51 A field study of controlling water heaters based on real time cost of electricity resulted in a 12.3% reduction in heating electricity cost with no reduction in user comfort.Reference Kepplinger, Huber and Petrasch59 However, the report concluded that the utility must offer significant residential demand charges for the user to experience these savings. Commercial solutions exist either as entirely new water heaters with programmable controls or control systems that can be installed on current water heaters.
Demand charge reduction simulation results
The demand charge reduction value for a commercial or residential facility depends on the storage technology, utility rate, and load profile. Simulation is required to evaluate the annual utility bill savings based on these different parameters. NREL developed a tool called Battery Lifetime Analysis and Simulation Tool (BLAST) that combines a building electricity use profile, utility demand charges, and battery costs to output the optimum battery size for the highest internal rate of return (IRR).Reference Neubauer60 The IRR can be converted to total annual utility bill cost savings as well.
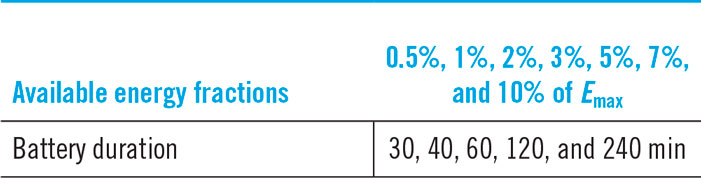
NREL simulated demand charge reduction potential for 98 different commercial buildings that range from small (∼2000 sq. ft.) food processing centers to large (1,800,000 sq. ft.) shopping malls.Reference Neubauer and Simpson61 The battery cost $300/kW and $300/kW h added together based on the simulated energy and power size of the battery. Grouping the battery and inverter cost under a single power normalization overestimates costs when simulating over a range of power values since increasing system power is primarily a function of inverter size and not battery size. At higher C-rates above 1 C, the batteries need to be upgraded to handle the larger power output so a more accurate simulation would have a power normalized cost that varies with system power. NREL used the rate structure from Southern California Edison’s TOU-GS-2 option B structure circa 2013 with similar time related costs to the 2016 rate structure detailed in Table 3 with summer on peak demand charges total $30.14/kW. Each building load was simulated with 35 different battery storage sizes: seven energy levels, each with five different power levels (Table 8). The energy capacity of the battery systems was set as a percentage of the building maximum demand charge reduction or the energy required to level the building load assuming an ideal storage device (infinite power, 100% conversion efficiency).
Battery pack type comparison.
Simulation results
All 98-load cases showed the cost reductions due to demand charge reduction exceeded the cost reductions due to energy arbitrage by one to two orders of magnitude (Fig. 14).
Impact of battery operation on energy costs and demand charge costs for all simulated load cases, Source: Neubauer, Jeremy, and Mike Simpson. Deployment of behind-the-meter energy storage for demand charge reduction. No. NREL/TP-5400-63162. National Renewable Energy Lab. (NREL), Golden, CO (United States), 2015. Reprinted with permission from the National Renewable Energy Laboratory, from https://www.nrel.gov/docs/fy15osti/63162.pdf, accessed August 25, 2017.Reference Neubauer and Simpson61

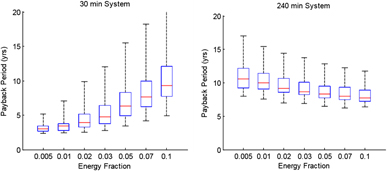
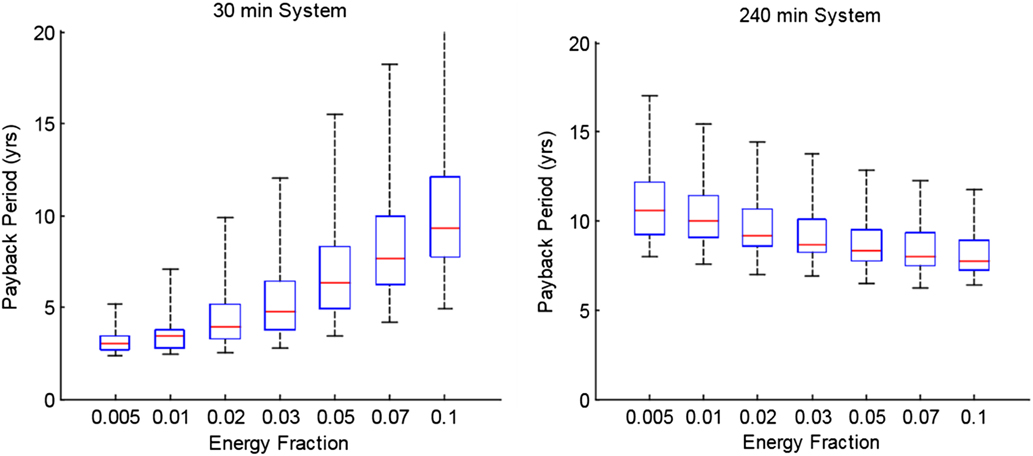
The payback period for battery systems with the lower system duration (30 min or 2 C rate) was about half that of systems with the longest system duration (240 min or C/4 rate) (Fig. 15). Given the utility rate structure with high demand charge costs, batteries’ greatest value was reducing demand charges and not offsetting energy to lower the time of use periods (arbitrage). Shorter duration systems minimized payback period because typical load profiles have a non-linear relationship between reduction in peak power and required energy (Fig. 15).
Payback period for battery systems as a function of energy fraction and power. The battery energy required to eliminate all variability in building load was calculated and different energy fractions from this total were modeled (0.005, 0.01, etc). The plot on the left were high power battery systems simulated to discharge completely in 30 min while the plot on the right fully discharged in 240 min. Each box plot shows the minimum, 25th percentile, median, 75th percentile and maximum payback period across all 98 facilities modeled in the NREL study, Source: Neubauer, Jeremy, and Mike Simpson. Deployment of behind-the-meter energy storage for demand charge reduction. No. NREL/TP-5400-63162. National Renewable Energy Lab. (NREL), Golden, CO (United States), 2015. Reprinted with permission from the National Renewable Energy Laboratory, from https://www.nrel.gov/docs/fy15osti/63162.pdf, accessed August 25, 2017.Reference Neubauer and Simpson61
Simulation discussion
At $300/kW and $300/kW h, payback periods below 5 years and as low as 3 years make battery energy storage a compelling technology for many commercial/industrial buildings. Businesses might opt for larger battery systems where the payback period is longer but the total utility bill savings are higher. Current commercial energy storage systems were compared against NREL’s simulated energy storage systems by computing their cost if NREL’s cost factors applied: $300/kW and $300/kW h. These two normalizations were combined into a single, energy normalized cost, C simulated, by multiplying the system’s C-rate by the power normalized cost ($300/kW) and adding it to the energy normalized cost ($300/kW h).
 $${C_{{\rm{simulated}}}} = {{\$ 300} \over {{\rm{kW}}\;{\rm{h}}}} + {{\$ 300} \over {{\rm{kW}}}} \times C - {\rm{rate}}\quad {\rm{.}}$$
The actual cost of commercial energy systems was then compared against what the system costs under NREL’s normalizations to see if current ES systems can provide the demand charge reduction value predicted by NREL (Table 9). It is important to note here that only a select few current commercial ES systems were evaluated to show the current economic viability of energy storage systems with NREL’s published demand charge reduction model. Equation (1) and the method described here can be applied to other or new energy storage systems with different cell technologies to evaluate if they can provide <5 years payback periods in demand charge reduction alone (Table 10).
Energy and power ratings of battery systems for BLAST simulation.
Commercial battery system costs compared with NREL simulation.

Tesla’s Powerwall 2 exceed the costs simulated in the NREL study that concluded a longer payback period for these low power systems. The demand charge reductions of high power systems, like LG RESU 10, already meet the battery costs simulated and deliver the lowest payback period. However, no commercial system was found that could deliver 2 C rates, the lowest payback period system simulated. Based on these results, there is high economic potential for small energy storage systems with high power capability; however, these systems have more challenging safety considerations.Reference Al-Hallaj, Wilke, Schweitzer, Badran, Murad, Baydoun and Daghir25
TES cooling cost
The electrical energy normalized cost for an IceBear TES cooling system was calculated to compare with a battery system cost. IceEnergy estimated the installed cost to a private sector customer for an Ice Bear 30 ton hour (105 kW h) system and a 5-ton (17.5 kW) A/C unit was about $25,000.Reference Trabish62,63 To isolate the cost of the IceBear TES system, the replacement cost for a 5-ton A/C unit was subtracted from the total installed cost. NREL’s National Residential Efficiency Measures Database gave the average cost to replace a 5 ton AC unit with a 24.5 Seasonal Energy Efficiency Ratio (SEER) at $11,000.64 Air conditioners cycle heat between two temperature reservoirs (building and outside) and therefore deliver greater cooling power than the input electric power by a factor known as the coefficient of performance (C.O.P.).Reference Moran, Kreith and Goswami65 This SEER corresponded to a C.O.P. value of 4.5, which means one watt of electricity provided 4.5 W of cooling.
Since a battery input and output is electrical energy, a battery system that can deliver the same performance as a TES system has an energy capacity equal to the TES capacity divided by the air conditioner’s C.O.P. For example, the TES system above which has a C.O.P. of 4.5, a 23 kW h battery stores the same energy as a 105 kW h IceBear TES cooling system with a C/3 discharge rate since the IceBear peak cooling power is 35 kW. The electrical energy normalized cost for the IceBear 30 is $600/kW h with a C/3 rate. This is more expensive than the current battery storage options and TES cooling is limited to demand charge reduction during summer months when air conditioning makes up a large proportion of peak electricity use.
Conclusion
Energy storage technologies can reduce demand charges for commercial and industrial customers as well as residential customers as demand charges for residential customers are growing. While mechanical energy storage technologies like pumped hydro dominate the total energy storage capacity, such technologies are too large and geographically dependent for use in behind the meter applications. Instead chemical devices like batteries and thermal devices like water heaters or ice storage have the greatest potential for demand charge reduction.
Battery storage is more flexible than TES because it can power any device that uses electricity. Lead acid is a mature battery technology with low initial capital cost; however, poor efficiency at high C-rates and low cycle life with high DOD lead to larger lifecycle costs than high initial cost lithium-ion batteries. Future lithium ion battery chemistries that use varied materials for the anode and cathode could increase the energy density by 50–100%. Battery chemistries that can solve the lifetime and safety issues pure lithium anodes could result in batteries with 10× the energy density of today’s cells and dominate the energy storage market.
The materials required for TES are less expensive and last longer than electrochemical batteries; however, the technology is limited to building climate control and cannot power other devices. Water is the most common and least expensive storage material used in both hot water heating for space heating storage and ice makers for space cooling storage. However, ice has low thermal conductivity and phase change composite materials, like graphite encapsulated wax, compromise latent heat for greater thermal conductivity and can equal storage densities of high power ice/copper systems.
Simulations with real building load profiles performed by NREL show that battery storage systems can have payback periods below 5 years in most building surveyed; however, only with high demand charges like SCE summer on-peak rate: ∼30$/kW. Fast discharge rates increase the value of ES systems for demand charge reduction and current high power commercial lithium ion battery storage marketed toward industrial and commercial customers already meet the systems cost simulated in the NREL model. IceBear was the only current commercial TES cooling system marketed to businesses for demand charge reduction and when costs were translated to NREL’s battery model, the product was not competitive with battery storage. Innovation in both battery cell and TES materials is active; however, lithium ion batteries have a larger potential for performance increases.
Glossary of terms
Anode: The negatively charged electrode in a battery.
Arbitrage: Economic benefit from buying electricity during low price periods, storing energy, and then selling electricity during high price periods.
Behind the meter: Energy storage installations owned and operated by utility customers.
Cathode: The positively charged electrode in a battery.
Chemical storage: Energy stored in chemical bonds. Batteries are chemical storage devices that use electrical energy to create chemical bonds and establish a chemical potential difference.
Coefficient of performance: The thermal energy produced by an air conditioner divided by the input electrical energy. Coefficient of performance is often greater than 1 as an air conditioner moves thermal energy between two temperature reservoirs which is a less entropic process than electrical charge transfer on an energy normalized basis.
C-rate: The inverse of the time in hours it takes to discharge an energy storage device. For example, a 2 C energy device takes 1/2 h to discharge or 30 min.
Demand charge: Electric utility cost applied to a customer based on their maximum power used over a billing cycle.
Depth of discharge: The energy discharged as a percentage of the total energy stored.
Electrolyte: Medium in between the anode and cathode with charge carriers that complete the battery circuit.
Energy charge: Electric utility cost applied to a customer based on their electrical energy usage over a billing cycle.
Energy storage device: An engineered system that can store energy.
In front of the meter: Energy storage installations owned and operated by the utility.
Inverter: Power electronics hardware that converts direct current from a battery to alternating current for the grid.
Lifetime: How many years or cycles an energy storage device can operate without significant performance degradation.
Peak shaving: Discharging energy storage device during periods of high power demand to reduce grid power usage and reduce demand charge.
Phase change material: A material that changes phase (solid, liquid, gas) when heated or cooled in a thermal energy storage device.
Ramp rate: The rate of increase in power production of an energy storage or generation device.
Roundtrip efficiency: The electrical energy discharged from a storage device divided by the electrical energy required to charge the storage device.
Self-discharge: The energy lost from an energy storage device when it is charged or at a higher energy potential yet is not discharging energy.
Specific energy: The energy storage capacity of an energy storage device divided by its mass.
Specific power: The power capacity of an energy storage device divided by its mass.
Thermal runaway: Most relevant to lithium ion batteries, it is where heat from an exothermic reaction increases the reaction rate causing further heating that eventually violently destroys the battery.
Thermal storage: Energy stored by heating or cooling a substance. If the substance changes phase (water to ice), it is latent thermal storage. If the substance changes temperature, it is sensible thermal storage.
Time of use rate: Electricity price that depends on what time the electricity is used.
Acknowledgment
This work was supported as part of the Joint Center for Energy Storage Research (JCESR), an Energy Innovation Hub funded by the US Department of Energy, Office of Science, Basic Energy Sciences.