
Neighborhood as an independent factor
Although the idea that different parts of a city sound different is popular among nonlinguists, there has been no clear evidence for this deeply entrenched belief from sociolinguistic studies. Wherever differences between neighborhoods have been discovered, they have turned out to be due to social class differences. That is, if particular parts of a city are inhabited by particular socioeconomic groups, then those neighborhoods may sound different from other parts of the city inhabited by speakers with different socioeconomic backgrounds. At the same time, speakers with the same socioeconomic backgrounds will have essentially the same sound system regardless of their geographic provenance, at least in terms of those phonetic and phonological variables that are stable in the community. In other words, there has been no evidence so far that, contrary to popular belief, neighborhood is an independent factor contributing to linguistic variation, that is, independent of social class. Brooklynese, for example, which is supposedly the accent of the borough of Brooklyn in New York City, turns out to be the accent of working-class New Yorkers, whether they grew up in Brooklyn, Queens, or the Bronx (Labov, Reference Labov2001:226-227; Labov, Ash, & Boberg, Reference Labov, Ash and Boberg2006:234). Becker and Newlin-Łukowicz (Reference Becker and Newlin-Łukowicz2018) confirmed this lack of geographic differentiation within New York City in terms of perception, showing that New Yorkers cannot correctly identify which borough speakers come from on the basis of short audio samples.
At the same time, the role of neighborhood may be slightly different in changes in progress in that some neighborhoods may be ahead of others even when social class is taken into account. Labov (Reference Labov2001:236-239) reports, for example, that the Wicket St. neighborhood in Kensington in north Philadelphia, the oldest settled and intact working-class neighborhood in the city, shows a significant advantage in new and vigorous changes, that is, the fronting of /eyC/ as in face and date and of /aw/ as in mouth and down, even when social class is included in the same model. The same significant advantage is seen in middle-range changes, such as the fronting of /owC/ as in goat and soap and the fronting of /uwC/ as in goose and boot. The effect of neighborhood is additive in that it does not compete with, but adds to, the effect of social class, increasing the amount of variance explained. However, there is no evidence that there are systematic differences between different parts of Philadelphia for stable sociolinguistic variables that are independent of social class effects. At the same time, Labov cautions that it is not clear if the neighborhood effects found to be significant in changes in progress in Philadelphia, that is, the significant advantage of the oldest settled working-class neighborhood, can be generalized to other speech communities, as “neighborhoods are particular products of particular historical events” (Reference Labov2001:259). More research is needed to ascertain the degree to which neighborhood can have a significant effect on language variation independent of social class.
One such study outside the United States was Trudgill's (Reference Trudgill1974) investigation of Norwich English, in which he noted a neighborhood effect in the diphthongization of /u:/, where for middle working-class speakers, the electoral ward Lakenham had fewer diphthongized forms than the areas of Westwick and Hellesdon. Trudgill suggests tentatively that this might be due to dialect mixture and in-migration: some areas within Norwich may have had higher levels of in-migration from Norfolk than others, or the migrants may have come from different parts of Norfolk (Reference Trudgill1974:129-130). Another study was Milroy's (Reference Milroy1980:123) investigation of Belfast English, where the Protestant area of Hammer was shown to be leading in the centralization of the kit vowel; two other variables displayed weaker neighborhood effects, which were also subject to interactions with other factors. At the same time, the Belfast study did not differentiate between neighborhood and religion (or ethnicity). In reviewing the data in Milroy's (Reference Milroy1980) study, Labov (Reference Labov2001:232) concludes that “[…] the main finding is a negative one: the absence of sharp geographic differentiation in Belfast. The three neighborhoods use the same variables in approximately the same way: they show no qualitative differences that would mark them as discretely different dialects of Belfast English.”
Manchester, UK, is one of those cities whose sound system is, at least anecdotally, said to be characterized by geographic differentiation. In particular, north Manchester is popularly believed to sound different from south Manchester. Testing the question of this geographic differentiation in Manchester is therefore one of the goals of this study. However, two qualifications need to be made at this point. The first one is illustrated by the reply from one of the informants to the question of whether north Manchester sounds different from south Manchester: “Oh, yes, Bolton, for example, has a very different accent!” The speaker is referring to one of the satellite towns ten miles northwest of Manchester, which, since 1974, has been part of the administrative region called Greater Manchester. However, although Bolton and other satellite towns such as Rochdale and Oldham, for example, currently belong to Greater Manchester, they are not part of Manchester itself, with no geographical contiguity between their urbanized areas and those of Manchester. More important, those towns have traditionally had their own sound systems, with a number of features different from those in the city of Manchester. For example, the long mid vowels face and goat may be monophthongal or ingliding diphthongs north of Manchester but upgliding diphthongs in the city itself (Baranowski, Reference Baranowski2017). Another well-known difference is the traditional presence of rhoticity in the area of Oldham and Rochdale but not in Manchester itself (Orton, Sanderson, & Widdowson, Reference Orton, Sanderson and Widdowson1978; Wells, Reference Wells1982:368). Therefore, although those satellite towns are currently designated to be part of Greater Manchester, it is no surprise that their sound systems may be different from those found in the city. The more interesting question therefore is whether within Manchester itself there may be systematic linguistic differences between the north and the south of the city.
The second qualification regards the question of the independence of the neighborhood effect. Given the results of the speech community studies mentioned above, we would expect some linguistic differences between north and south Manchester, as those two parts of the city are clearly differentiated socioeconomically. North Manchester can be characterized as a predominantly working-class area on the basis of a number of indicators, such as occupation, education, economic inactivity, average house prices, and welfare benefits (Greater Manchester Combined Authority & Salford City Council, 2020; Manchester City Council, 2020), whereas south Manchester is more mixed socioeconomically but is overall higher on the socioeconomic scale based on the same indicators. Therefore, finding differences between the sound systems of speakers from the two major parts of the city would in fact be expected, given what we know about the role of social class in language variation and change in the metropolis. The far more interesting question is then whether different parts of Manchester sound different once we have accounted for social class differences, that is, whether any geographic effect we may find is independent from social class. Put differently, the question may ultimately be simplified methodologically to whether working-class speakers from north Manchester sound different from working class Mancunians from the rest of the city. We explore this question by looking at the status of the phonemic contrast between the north and force vowels, which, in opposition to most dialects of English, is still present in Manchester.
The linguistic variable: the north-force vowels
The north and force vowels historically were different phonemes: north being a reflex of Middle English short /ɔ/, which was lengthened before /r/ (Wells, Reference Wells1982:159), as in horse, fork, for, morning, etc.,Footnote 1 and force being a reflex of Middle English long /ɔ:/ before /r/, which was raised to [o:] as part of the Great Vowel Shift, as in hoarse, fort, four, mourning, ore, etc.Footnote 2 For dialects with a distinction, therefore, there were minimal pairs such as horse-hoarse, for-four, war-wore, morning-mourning, etc., with the first vowel (north) being lower phonetically. It is worth noting that the distribution into these two vowel classes is not entirely predictable based on the spelling, because a number of words with a preceding labial had migrated to the force class early on, so that we have, for example, storm, fork, sorts in north, but port, porch, and sports in the force class (Labov et al., Reference Labov, Ash and Boberg2006:49-52; Wells, Reference Wells1982:160-162).
The two vowels have merged in most dialects of English in what Wells (Reference Wells1982:235) terms the First force Merger, ending up as [ɔ:] in many accents. The contrast is still maintained in Scottish English, Northern Irish English, and Caribbean Englishes. The distinction was also quite solid in northern dialects of American English in the first half of the twentieth century (Kurath & McDavid, Reference Kurath and McDavid1961) but has been disappearing rapidly in the last few decades, with Labov et al. (Reference Labov, Ash and Boberg2006:52) reporting that it now only occurs in “a scattering of speakers in Eastern New England, southern Illinois and Indiana, and the Gulf States.” The weakening of the north-force distinction in the Southern US is confirmed in Baranowski's (Reference Baranowski2007) sociophonetic study of Charleston, South Carolina: while speakers over the age of seventy often have a distinction, with clear phonetic separation and unambiguous minimal pair judgments, their grandchildren's generation, even in the same families, show a complete merger, both acoustically and in minimal pair tests. In Eastern New England, the phonemic contrast is rapidly disappearing as well. Once a well-known feature of Boston, for example, the distinction was already weakening in the 1970s (Laferriere, Reference Laferriere1979), and the majority of speakers in Eastern New England interviewed for the Atlas of North American English are now largely merged (Labov et al., Reference Labov, Ash and Boberg2006:226-227). Similarly, Stanford's (Reference Stanford2019) recent large-scale study reports that the vocalic distinction, while quite solid in the oldest generations, has been rapidly receding in Eastern New England since the late 1960s.
The distinction has also disappeared from most dialects in England. It was quite strong in Received Pronunciation well into the twentieth century, but it has now disappeared completely in Southern English in general. Wells (Reference Wells1982:236) summarizes the status of this phonemic contrast reporting that “the First force Merger is completed—except in some provincial, Celtic, West Indian, and American accents.” It is not clear if Wells meant to include Manchester in the provincial category, but the Survey of English Dialects (SED) data (Orton et al., Reference Orton, Sanderson and Widdowson1978) suggest that the vocalic distinction was present in the rural areas surrounding Manchester at the beginning of the twentieth century. The two SED localities closest to Manchester were Charlesworth (near Glossop in Derbyshire) and Harwood (near Bolton in Lancashire). The vowel pronunciation reported in those areas for the words forks and corn (derived from Middle English short /ɔ/) is transcribed as [ɔɹ:] (Phonological map 47, Phonological map 48), whereas the vowels in the words four and ford (derived from Middle English long /ɔ:/) are transcribed, respectively, as [oə] (Phonological map 193), and [oə] (for Charlesworth) and [uə] (for Harwood) (Phonological map 49), suggesting a north-force distinction in the area. It turns out that this contrast is indeed still present in Manchester, and, as we shall see below, quite strong in the working class.
Methods
This study is based on the speech of 122 speakers who grew up in Manchester from the age of three or younger, stratified by age, gender, social class, and ethnicity. Manchester is defined as the urbanized area within the M60 ring motorway, including neighborhoods immediately south of the M60. Importantly, the study does not include towns north of the M60 motorway, which are part of the Greater Manchester administrative region, such as Bolton, Oldham, or Rochdale.
Within Manchester defined as above, speakers were coded in terms of where they grew up as one of three major parts of the city. Central Manchester includes the city center; neighborhoods north of it, such as Pendlebury, Prestwich, Harpurhey, Crumpsall, Newton Heath, extending up to the M60, are coded as north Manchester; areas south of the city center, including neighborhoods such as Stretford, Didsbury, Wythenshawe, Northenden, Heaton Moor, and Stockport, are coded as south Manchester. As north Manchester is said, at least anecdotally, to sound different from the rest of the city, part of town in the regression analyses reported below is entered as north Manchester versus all the other parts.
Social class is operationalized in terms of five occupational levels, as occupation has been shown to be the best single indicator of socioeconomic status for explaining linguistic variation, both in the US (Labov, Reference Labov2001:180-190) and in the UK (Baranowski & Turton, Reference Baranowski and Turton2018). The occupational levels, reflecting the social status or prestige of an occupation, range from lower-working for unskilled workers to upper-middle class for lawyers, university professors, or high-level managers; the assignment to a particular class is based on the occupational history of a speaker rather than just the last job they held. Children are assigned the social class of the parents, with their career plans, where known, also taken into account. Social class is entered as either a continuous predictor (1-5) or as individual factors: lower working, upper working, lower-middle, middle-middle, and upper-middle (see Baranowsk, Reference Baranowski2017 for further information on social class stratification in the sample). The coding of ethnicity is based on speakers’ self-identification, with ninety-one White British, eighteen Pakistani, and thirteen Black Caribbean informants.
The informants were recorded during sociolinguistic interviews, focusing on eliciting narratives of personal experience, which are known to approximate speakers’ vernaculars (Labov, Reference Labov, Baugh and Sherzer1984). In addition to spontaneous speech, the interviews ended with wordlist reading and, for 112 speakers, minimal pairs for a number of vocalic and consonantal contrasts, including four minimal pairs for the north-force contrast: horse-hoarse, war-wore, morning-mourning, and for-four. The informants were asked to read each pair and say whether the words in each pair sounded the same, close but not quite the same, or different in their most natural speech; the speakers’ judgments were scored as 0, 1, or 2, respectively. Their actual pronunciation in the recording was scored in the same way by two student assistants (one a native Mancunian and one from the south of England) and cross-checked by the author, so that the average distinction scores range from 0, for no difference, to 2 for a clear distinction. The style predictor entered in the regressions reported below has two levels: spontaneous speech versus formal elicitations, that is, word list reading and minimal pair tests. The speakers’ speech was measured in terms of F1, F2, and F3 in Praat (Boersma & Weenink, Reference Boersma and Weenink2017); the dataset includes 8,057 tokens of north and force vowels. For ninety-seven of the speakers, the recordings were forced-aligned and measured automatically using the online Forced-Alignment Vowel Extraction suite developed at the University of Pennsylvania (Rosenfelder, Fruehwald, Evanini, Seyfarth, Gorman, Prichard, & Yuan, Reference Rosenfelder, Fruehwald, Evanini, Seyfarth, Gorman, Prichard and Yuan2014), with the default measurement point selection option (faav), and with mahalanobis selected as the formant prediction method. For the other twenty-five speakers, whose speech had been measured before FAVE was available, the point of measurement in Praat was selected by hand following the methods described in Labov, Ash, and Boberg (Reference Labov, Ash and Boberg2006:36-40) and Baranowski (Reference Baranowski, Bayley, Cameron and Lucas2013a).Footnote 3 Formant values were normalized using Lobanov's (Reference Lobanov1971) method and then scaled back to Hertz values. The vowel plots below were created with Plotnik 10.1 (Labov, Reference Labov2011).
It remains an empirical question whether any one method of measuring vowel mergers acoustically is optimal. Therefore, the acoustic difference between the two vowels is measured in three ways here: as the Cartesian (or Euclidean) distance between the vowels in F1-F2 space, with Pillai scores (Hall-Lew, Reference Hall-Lew2010; Hay, Warren, & Drager, Reference Hay, Warren and Drager2006), and in terms of the F1 position of each of the vowels in acoustic space.Footnote 4 Cartesian distance, following Nycz and Hall-Lew (Reference Nycz and Hall-Lew2014), is measured as the distance between F1/F2 means and between F1/F2 medians; the means results, reported below, turn out to be essentially identical to those based on medians. Pillai scores express the degree of similarity between two clouds of tokens. They are the output of a MANOVA analysis in R with two dependent variables (F1 and F2), with the result ranging in value between 0, for no difference (complete overlap), and 1, for no similarity (complete distinction). A Pillai score is calculated separately for each speaker for their north-force distinction. Importantly, in contrast to Cartesian distance, Pillai scores take into account the surrounding phonological environment, so it is potentially more accurate than distance between means (Gorman & Johnson, Reference Gorman, Johnson, Bayley, Cameron and Lucas2013; Hall-Lew, Reference Hall-Lew2010; Hay et al., Reference Hay, Warren and Drager2006; Nycz & Hall-Lew, Reference Nycz and Hall-Lew2014) in determining the degree of acoustic similarity between two vowel phonemes. The results of the minimal pair tests and of the acoustic distance and overlap measures are subjected to a series of fixed-effects linear regressions in R (R Core Team, 2022). As those acoustic similarity measures are single observations per speaker, a mixed-effects analysis would not be appropriate. F1 of the north and force vowels is explored through mixed-effects linear regression with the lmerTest package (Kuznetsova, Brockhoff, & Christensen, Reference Kuznetsova, Brockhoff and Christensen2017) in R, with speaker and word as random effects. Model comparison for nested models is conducted with anova() in R with a simpler model selected as optimal, and for nonnested models, the Akaike information criterion (henceforth AIC) is used, with lower values indicating a better model.
Results
Minimal pair tests
The results of the minimal pair tests suggest that the distinction between the two vowels is being lost in Manchester. Figure 1 shows the average distinction scores across the age spectrum in the sample for the four-for pair; similar patterns were found for the other minimal pairs. There is a trend in apparent time toward merger, but it is worth noting that the merger is not quite complete even for the youngest generation of speakers, given the apparent time pattern seen in Figure 1. At the same time, it could be that the seven-nine-year-olds in Figure 1 reflect the parental input—a more conservative form produced by their parents (see Bermúdez-Otero, Reference Bermúdez-Otero2020)—whereas the 10-19-year-olds represent the continuing direction of the merger, as found by Johnson (Reference Johnson2010) for the low-back merger.
four-for minimal pair by age (112 speakers): 2=complete distinction, 0=complete merger.

The patterns of variation become clearer when we consider the role of social class at the same time as age. Figure 2 presents the distinction scores for the three major social classes (with the lower- and upper-working classes combined into Working Class, and the middle-middle and upper-middle classes combined into Middle Class to visualize the apparent time trends more clearly). It shows that Middle-Class speakers are almost completely merged regardless of age; there is no distinction at all for any generation in the middle class, including the oldest speakers. The other social classes have a much stronger distinction, but even for them there is a trend toward merger in apparent time.
four-for minimal pair by social class and generation (112 speakers); 2=complete distinction, 0=complete merger.

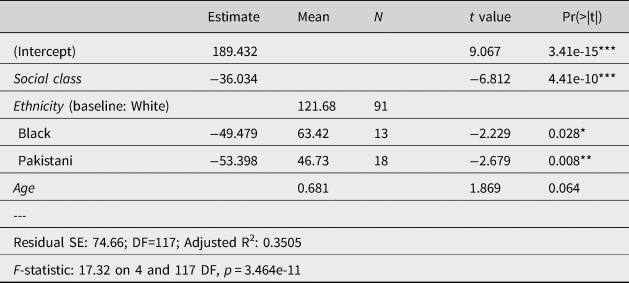
The patterns seen in Figures 1 and 2 are confirmed in a regression analysis of the four-for minimal pair in production (Table 1), where social class is entered as a continuous predictor with five levels. The positive value of the age coefficient indicates that there is less distinction with decreasing age; it decreases by 0.23 (on the two-point scale) for each generation of twenty-five years. There is also a significant effect of ethnicity, with ethnic minority speakers showing less distinction between the two vowels in comparison with White Mancunians. As regards the role of social class, the negative value of the social class coefficient indicates that the higher the social class, the smaller the distinction between the vowels. Finally, gender does not come out as significant.
Regression analysis of four-for minimal pair test
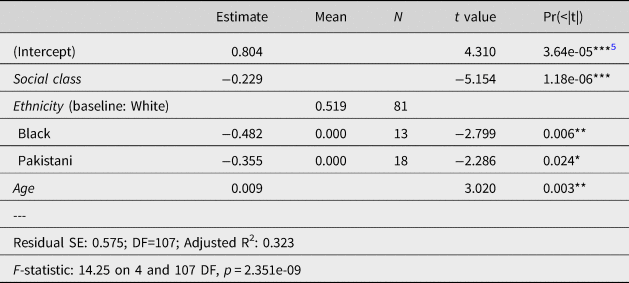
Figure 3 presents a more detailed picture of the role of social class based on a separate regression analysis where the five socioeconomic levels were entered as separate categories rather than as a continuous predictor. The figure plots the expected values of the distinction score for each social class, derived by adding the coefficient for each social class to the intercept (and to the value of the age coefficient for forty years of age). It shows a clear monotonic relationship between social class and the north-force distinction, with each social class lower on the scale having a greater distinction between the vowels. It is worth noting that the social-class patterning that we see here is not due to a difference between two major social classes only, Middle versus Working class, and in that sense, it is not a case of broad stratification. Rather, the social-class stratification is fine grained, producing a monotonic relationship consistent with the classical, or stratificational, model of social class, where each higher socioeconomic level across the socioeconomic spectrum shows a lower distinction between the vowels, and, consequently, social classes closer to each other on the socioeconomic scale are also closer to each other linguistically. A similar fine-grained pattern of social stratification has been found for other variables in Manchester, such as the fronting of goat and the fronting of goose before /l/, as in school and pool (Baranowski, Reference Baranowski2017).
Expected distinction in four-for minimal pair (Intercept + Coefficient for each social class, for age forty).

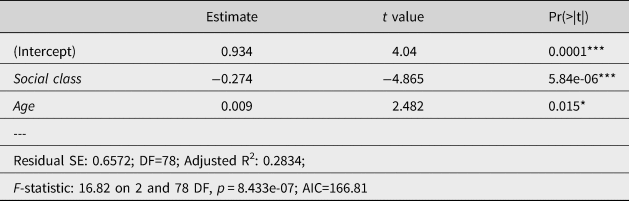
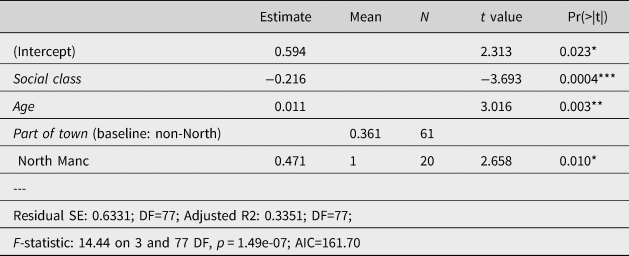
Interestingly, as Figure 2 above indicates, not all working class speakers produce a distinction between the two vowels in minimal pair tests. Even for the youngest generation in this social class, there are both speakers with a complete merger and speakers with a clear distinction, suggesting that the variation may be conditioned by more than social class. Indeed, it turns out that neighborhood or the part of town that the speakers grew up in adds to the explanation. Table 2 presents the significant predictors in a regression analysis of the minimal pair tests for the White speakers in the sample, which will be the basis of the analysis of the role of part of town, as the vast majority of ethnic-minority speakers had grown up in central and south Manchester. The social class pattern and the age effect is similar to those found for the whole sample (Table 1), with more distinction in lower social classes and less distinction in younger speakers. Table 3 presents a regression analysis with the same predictors as in Table 2 but with the additional factor of part of town, where speakers are coded as either coming from north Manchester or from other parts of the city. It shows that part of town plays a significant role, with speakers from north Manchester having a greater distinction between the vowels, as indicated by the positive value of the neighborhood estimate, 0.47 on the two-point scale. The model with part of town added is better in that it explains more of the variation as indicated by the adjusted R2 (0.335 in Table 3 versus 0.283 in Table 2). An anova() test in R confirms that adding part of town to the model significantly improves the explanation (p = 0.0096); this is also confirmed by the lower value of the AIC for the more complex model: 161.70 in Table 3 versus 166.81 in Table 2.Footnote 6
Regression analysis of four-for minimal pair test for White speakers only
Regression analysis of four-for minimal pair test for White speakers only, with part of town added
Acoustic analysis results
The extent of the distinction between north and force has also been measured acoustically in terms of the position of each of the vowels in phonetic space (F1 and F2), in terms of the distance between the vowels measured as the Cartesian distance between the means and between the medians, and in terms of Pillai scores, taking into account both the distance and the amount of overlap between the two vowels in phonetic space. The acoustic measurements corroborate the minimal pair test results discussed above with regard to the significant role of social factors such as age, social class, and ethnicity in this vocalic contrast.
Figure 4 presents the F1-F2 positions of the two vowels for Lilly R., born in 1907, interviewed by William Labov in 1971, giving us a real-time data point extending back to the early twentieth century. The two vowels are clearly separated in phonetic space, with north being much lower than force. Similarly, the vowels are clearly separated for many working-class speakers in the current sample, such as Alan K., aged sixty-eight (Figure 5) and Barbie J., forty-eight (Figure 6). For many young Mancunians, however, the vowels overlap completely, as in the speech of Paul M., aged twenty-two, in Figure 7; he confirms the lack of distinction in a minimal pair test. At the same time, there are other young speakers for whom there is still clear phonetic separation between the two vowels, as in the speech of Bobby C., aged twenty-four, in Figure 8; he confirms the distinction in a minimal-pair test. One noticeable difference between these two young speakers is their socioeconomic background: Paul M. is an upper-middle-class Mancunian, whereas Bobby C. is an upper-working class speaker. The contrast between these two speakers illustrates a social class difference indicated in the minimal pair tests above: while for middle class speaker in Manchester the two vowels show complete overlap in phonetic space, for some working-class Mancunians there is a clear acoustic difference.
Lilly R., sixty-four (b. 1907) [interviewed in 1971], working class: north-force.

Alan K., sixty-eight, lower-working class: north-force.

Barbie J., forty-eight, lower-working class: north-force.

Paul M., twenty-two, upper-middle class: north-force.

Bobby C., twenty-four, upper-working class: north-force.

The effect of social class on the acoustic difference between the two vowels in the whole sample is seen in Figures 7 and 8, which plot the Cartesian distance and Pillai scores, respectively, against age for three major social classes. The figures indicate a pattern of monotonic social stratification, with higher social classes showing less acoustic difference, along with a possible effect of age, and with working-class speakers showing less phonetic distance with decreasing age. This is similar to the effects reported for the minimal pair tests above. The significant effect of social class on the acoustic difference between north and force is confirmed in the regression analyses of Cartesian distance and Pillai scores in Tables 4 and 5, respectively. The direction of the effect is the same as reported for the minimal pair tests above: higher social classes show less acoustic difference. Similarly, ethnicity also plays a significant role in the phonetic difference between the two vowels, with Black Caribbean and Pakistani speakers showing significantly less distinction than White Mancunians (Tables 4 and 5).
Regression analysis of north-force Cartesian distance
Regression analysis of north-force Pillai scores

Interestingly, age does not come out as significant at all in the regression analysis of Pillai scores (perhaps not surprisingly given the almost flat trendlines in Figure 9), but it shows a borderline significance level (p = 0.064) in the analysis of Cartesian distance (Table 4). It is difficult to compare the accuracy of the two measures directly, that is, of Cartesian distance and Pillai scores, in that they measure slightly different things: the distance in Hz between the mean F1-F2 positions of the two vowels for Cartesian distance versus the degree of overlap between the two vowels on the F1-F2 plane. In other words, just because one shows an (albeit borderline) significant effect and the other does not, does not mean that the first is better than the other. However, it is worth noting that the age effect shown for Cartesian distance is consistent with the age effect seen in the minimal pair results—less acoustic distance with decreasing age—suggesting a change in apparent time toward merger, whereas for Pillai scores it is not. We shall return to this issue below. The effect of social class on the acoustic distance and degree of overlap between the two vowels is seen more clearly in Figures 11 and 12, respectively, which plot the effect of each social class separately, based on a regression analysis where social class levels are entered as factors. As in the case of the minimal pair test results above, we can see a monotonic pattern of fine social stratification consistent with a stratificational model of social class, where distances between social groups correspond to differences in the rates of a linguistic variant.
north-force Cartesian distance (in Hz) by social class and age.

north-force Pillai scores by social class and age; lower Pillai scores indicating less distinction.

Expected Cartesian distance between north and force by social class (Intercept + Coefficient for each social class, for age forty).

Expected Pillai score for north-force by social class (Intercept + Coefficient for each social class, for age forty).

Although social class clearly plays a role in the north-force distinction in Manchester, it is not sufficient to explain the variation in the city completely, as there are both working-class speakers with an acoustic distinction, such as Bobby C., twenty-four, in Figure 8 above, and working-class speakers with an overlap, such as Henry D., thirty-nine, in Figure 13, who confirms the lack of distinction in a minimal-pair test. Although their socioeconomic position is similar—they are both upper-working class Mancunians—they grew up in different parts of Manchester: Henry D. grew up in south Manchester, whereas Bobby C. is from north Manchester. This difference illustrates a trend found for the whole sample, with north Manchester speakers showing a greater distance and less overlap between north and force in comparison with other parts of the city, as shown in Figures 14 and 15.
Henry D., thirty-nine, upper-working class: north-force.

north-force Cartesian distance by Part of town and Age.

north-force Pillai scores by Part of town and Age; lower Pillai scores indicating less distinction.

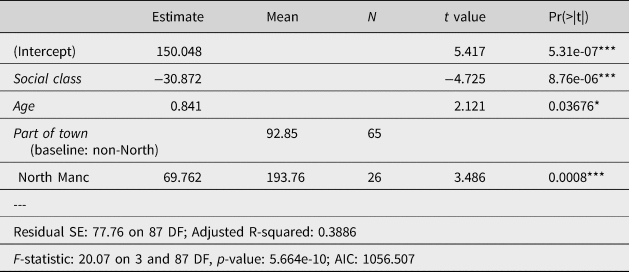
On the one hand, Figures 14 and 15 confirm the popular generalization often maintained by Mancunians that north Manchester sounds different from south Manchester. On the other hand, however, this result is not necessarily surprising, given the social class effect reported above combined with the fact that north Manchester is largely a working-class area, at least in comparison with south Manchester. The more interesting question is whether the effect of part of town, that is, north versus south Manchester, is significant independently of social class. In other words, the question is whether adding part of town, in addition to social class, can improve the explanation of the variation. Table 6 presents a regression analysis of the Cartesian distance between north and force for the White speakers in the sample that includes social class but not part of town; Table 7 presents a similar regression analysis with part of town added as a predictor. The more complex model, with part of town added, is significantly different in an anova() comparison (p = 0.0008) and is better, as indicated by the lower value of the AIC (and higher adjusted R2); it explains more of the variation. It shows that north Manchester is expected to have a greater Cartesian distance between north and force by some 70 Hz (Table 7). At the same time, the effect of age becomes significant in the model including part of town, with the age effect being consistent with the effect of age found in the minimal pair tests reported above, that is, lower Cartesian distance with decreasing age. The interim conclusion is then that indeed part of town has an effect that seems to be independent of social class.
Regression analysis of north-force Cartesian distance for White speakers

Regression analysis of north-force Cartesian distance for White speakers, with part of town added
At the same time, it is worth noting that a model with part of town only (that is, without social class) as a predictor (Table 8) is worse than a model with social class but not with part of town (Table 6), as indicated by the lower value of the AIC for the model with social class (AIC=1066 in Table 6 versus AIC=1075 in Table 8). In other words, social class based on occupation does a better job of explaining the linguistic variation than part of town on its own.
Regression analysis of north-force Cartesian distance for White speakers without Social class

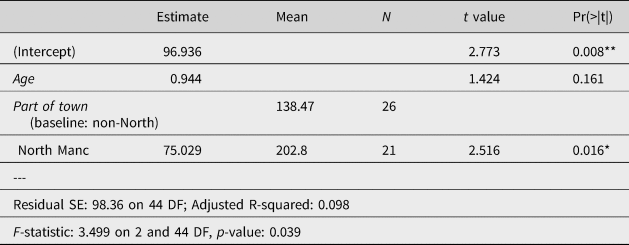
Yet another way of trying to pinpoint the effect of part of town while reducing the number of potential confounds is to focus on White working-class speakers only, as the issue ultimately boils down to the question of whether working class Mancunians from different parts of town sound different. The regression analysis of Cartesian distance in Table 9 suggests that they do, showing that even within White working-class speakers only, north Manchester has a greater expected Cartesian distance by some 75 Hz.
Regression analysis of north-force Cartesian distance for White Working Class only
A model comparison with Pillai scores as the dependent variable yields a similar result in that north Manchester shows less overlap and, importantly, that adding part of town to social class improves the explanation of the linguistic variation. The regression model in Table 11 shows that north Manchester has a higher expected Pillai score value in comparison with the rest of the city. This model also significantly improves the explanation in comparison with a simpler model including social class only (Table 10), as shown by an ANOVA comparison (p = 0.0109). In other words, part of town appears to be a significant effect independent of social class.
Regression analysis of north-force Pillai scores for White speakers

Regression analysis of north-force Pillai scores for White speakers, with Part of town added

F1 of north-force
Another way of trying to understand the variation in the north-force vowels in Manchester and of teasing apart the role of part of town as an independent factor is through a multivariate analysis of the phonetic positions of each of the vowels. One potential advantage of this approach, in comparison with the distance and overlap measures discussed above, is that it is more robust, as in modeling the variation we take into account not just one mean value per speaker but rather many observations per speaker, along with information on the phonological environment of each token. This allows us to conduct mixed-effects analyses with speaker and word included as random effects.
A comparison of Figures 7 and 8 suggests that vowel height is a potentially important dimension of the variation, with north being lower (with higher F1) than force for speakers with a distinction. As Figure 16 shows, social class plays a clear role in the F1 of the two vowels, with lower social classes showing a greater F1 distinction between north and force. It also shows that there is a monotonic pattern of social stratification for the F1 of north, with lower social classes having lower F1 values, but, interestingly, a curvilinear pattern for the F1 of force, with the class in the middle of the socioeconomic scale (class 3 in Figure 16, or lower-middle) having the lowest vowel. The multivariate analyses discussed below reveal that these two seemingly incongruent patterns make sense once we have taken into account other factors, such as age and style.
F1 of north and force by social class: monotonic social stratification in north but a curvilinear pattern in force.

The regression model reported in Table 12 confirms that social class has a significant effect on the F1 of north, with higher social classes having a lower F1. This effect is retained in the more complex model in Table 13 that also includes part of town as a predictor, which turns out to be significant. It shows that, in addition to the effect of social class, north Manchester has a higher expected F1 of north by some 60 Hz in comparison with the rest of the city. This more complex model including part of town significantly improves the explanation, as found in an ANOVA comparison (p < 0.0001); note also the lower AIC value for the more complex model in Table 13 in comparison with Table 12. This confirms the picture obtained with the other measures discussed above showing that part of town has an independent significant effect. At the same time, a comparison of the model with (only) social class with a model with part of town (but without social class) shows that, in the F1 of north, social class is a more important predictor than part of town on its own.Footnote 7
Mixed-effects regression of F1 of north (White speakers)

Mixed-effects regression of F1 of north with Part of town added (White speakers)

In addition, Table 14 confirms that the part of town difference is significant within the working class itself, with working-class speakers from north Manchester having a higher expected F1 of north by some 69 Hz in comparison with working class Mancunians from the rest of the city. In other words, the effect of part of town emerges even when we control for social class, suggesting that it is indeed independent of social class.
Mixed-effects linear regression of F1 of north for White Working Class only

Interestingly, in none of the models for the F1 of north does age emerge as a significant factor, which suggests that the height of the vowel is not changing in apparent time. At the same time, the regressions in Tables 12-14 reveal that there is a significant effect of style, with spontaneous speech showing lower F1. In more formal styles, speakers lower their F1, that is, raise the vowel, which in effect becomes closer to force in F1. This stylistic effect is similar to the style-shifting pattern found by Laferriere (Reference Laferriere1979) in her study of variation in the north vowel in Boston, where speakers would use lower proportions of the phonetically low variant (that is, would use higher phonetic realizations) in more formal styles, confirming the stigmatization of the low variant of north as stereotypical of the Boston accent (Labov, Reference Labov2001:248).Footnote 8 The style-shifting pattern in the F1 of north found in Manchester, combined with the monotonic social stratification in the direction discussed above, along with a lack of an age effect, resembles other stable sociolinguistic variables, such as (ing) (Trudgill, Reference Trudgill1974:90–103) and (th, dh) (Labov, Reference Labov2001:74–120), and another stable vocalic variable in Manchester, the fronting of goose before /l/, as in school and pool, used more by the lower social classes (Baranowski, Reference Baranowski2017).
At the same time, the regression model of the F1 of force in Table 16 reveals that the force vowel is undergoing a change in progress, lowering with decreasing age. This is consistent with the age effect discovered in the Cartesian distance between north and force discussed above (Table 7); the vowels appear to be getting close to each other in acoustic space, which is the result of force lowering, as indicated by the negative value of the age estimate in Table 15. Interestingly, in contrast to the north vowel (Table 13), there is no significant effect of style in the F1 of force (Table 15). This is not entirely unexpected, however, as the lowering of force has the hallmarks of a change from below the level of awareness: an effect of age, combined with no style-shifting, and, last but not least, a curvilinear pattern of social class (seen in the shape of the force curve in Figure 16), along the lines of those found in vowel changes in Norwich (Trudgill, Reference Trudgill1974), in Cedergren's (Reference Cedergren1973) study of lenition of (ch) in Panama City, in vowel changes in Philadelphia (Labov, Reference Labov2001), and, in another merger, in Charleston, South Carolina (Baranowski, Reference Baranowski2013b), where the backing of thought, an element of the low-back merger in progress in the dialect, was found to be led by an interior social class as well. In this way, the seemingly incongruous social class patterns seen for the two vowels in Figure 16 can be understood more easily: the north vowel is a stable variable with a monotonic pattern of social stratification and style-shifting toward the phonetic realization associated with the higher social classes (not unlike the pattern found in Boston), whereas the force vowel is undergoing a change in progress from below the level of awareness, with no style shifting and with a curvilinear pattern of social class effects.
Mixed-effects linear regression of F1 of force (White speakers)

Conclusions
The north-force distinction, in opposition to most other dialects of English, is still present in Manchester. It is strongly conditioned by social class, displaying a monotonic pattern of fine stratification, consistent with the classical, or stratificational, view of social class, with higher socioeconomic levels having less distinction. Accordingly, while the merger of the two vowels is completed in the highest socioeconomic levels, the distinction is still quite strong in working-class speech, though it may be weakening in this social group as well. This weakening is not surprising, as it is in line with Garde's (Reference Garde1961) principle and Herzog's (Reference Herzog1965) generalization, according to which mergers tend to expand at the expense of distinctions (Labov, Reference Labov1994:313). This way, Manchester is following the scenario already seen in most other dialects of English.
At the same time, however, the merger is far from complete, as there are still children and young adults with a clear distinction, both in their perception judgments and in their acoustics. This is different from the apparent-time patterns found in large-scale studies of mergers in progress in American English, such as the low back merger and the pin-pen merger in Charleston, South Carolina (Baranowski, Reference Baranowski2013b), or indeed the north-force merger in Charleston where speakers over the age of seventy may have a distinction, but their grandchildren's generation is completely merged (Baranowski, Reference Baranowski2007). The north-force merger in Manchester appears to be slower in comparison.
The progress of the merger has been particularly slow in north Manchester, which shows a significantly greater distinction between the two vowels over other parts of the city even when social class is taken into account. Accordingly, working-class speakers who grew up in north Manchester have a clearer distinction in comparison with working-class Mancunians elsewhere, both in terms of minimal pair judgments and in the acoustic measurements. This is the first report of a significant neighborhood effect that is independent of social class outside the United States, so the immediate question at this point is why there should be this geographic differentiation given that such an effect has rarely been reported before.Footnote 9 This is likely to due to differences in the socioeconomic characteristics of north versus south Manchester. North Manchester can be described as a largely working-class area, with a closer-knit, less mobile community in comparison with south Manchester and, as such, can be expected to preserve older dialect forms (Milroy, Reference Milroy1980). South Manchester, on the other hand, includes a mix of socioeconomic levels and has seen an increased influx of middle-class speakers from outside the city, including from the south of England, and of immigration from outside the UK. At the same time, middle-class Mancunians, who tend to live in central and, particularly, south Manchester, have been shown to use accent features that are closer to those found in the south of England, as in the fronting of goat (Baranowski, Reference Baranowski2017), the foot-strut distinction (Turton & Baranowski, Reference Turton and Baranowski2020), and now the merged north-force vowels, probably in part due to continued contact with relatives and with cultural and educational institutions in the south of England. In consequence, a working-class child growing up in north Manchester is much less likely to be exposed to merged speakers than a working-class child from south Manchester, and is therefore more likely to preserve the phonemic distinction heard in their parents’ and grandparents’ speech.
This scenario is consistent with the ethnicity effect reported above: Pakistani and Black Caribbean Mancunians have significantly less distinction between the two vowels (i.e., they are more merged) than White speakers in general. This way, ethnic minority Mancunians are closer to middle-class White Mancunians than to working class speakers in north Manchester. This is not surprising given that, although all the ethnic minority informants were born in Manchester, most of their parents had not been. As shown by Payne (Reference Payne and Labov1980) and Chambers (Reference Chambers1992), early parental input is helpful, and sometimes even necessary, for the establishment of phonemic categories. Even if, in the case of the Black Caribbean informants, their parents may have had the north-force distinction in their English, which is a feature of some Caribbean dialects (Wells, Reference Wells1982), the vast majority of the ethnic minority informants live in central and south, rather than north, Manchester. They were then growing up in a socioeconomically mixed part of the city, surrounded by largely merged speakers.
Interestingly, there is some social evaluation of the north-force vowels in the community in that speakers raise their realization of north in more formal styles; their phonetic realization becomes closer to force. This leads us to the vexed question of the social meaning of a merger in progress. According to Labov (Reference Labov1994; see also Eckert and Labov [Reference Eckert and Labov2017]), mergers, just like other phonological (rather than phonetic) variables, such as chain shifts, tend to be devoid of social affect. As elements of phonological structure, they are below the social radar and do not usually carry social meaning. This has been shown to be the case in the low-back merger in Charleston, South Carolina (Baranowski, Reference Baranowski2013b), for example, and is likely true of the low-back merger in general (Labov et al., Reference Labov, Ash and Boberg2006).Footnote 10 What may happen, however, is that the phonetic quality of a particular phoneme may attract attention and be subject to style-shifting or even stereotyping. Labov (Reference Labov1994:344) suggests that what may seem like the social evaluation of a phonemic contrast or lack thereof is instead due to the phonetic quality of one of the phonemes being socially evaluated. In the case of the north-force vowels in Manchester, one might argue that the style-shifting pattern seen in north, where speakers raise the vowel toward force in more formal styles, might at first glance suggest that what is socially evaluated is the phonemic distinction. That is, in formal speech, speakers produce the vowels as closer to each other by raising north, which would be consistent with the speech patterns of the higher classes. However, the fact that there is no lowering of force in formal styles suggests quite strongly, confirming Labov's point, that this is indeed a case of the phonetic quality of one of the phonemes being above the level of conscious awareness and being socially evaluated. If it were the lack of distinction between the two vowels that was positively evaluated, we would expect to see style-shifting in both vowels.
One final methodological point concerns the use of Pillai scores in comparison with Cartesian (or Euclidean) distance between the means of two vowel distributions for the study of mergers in progress. Pillai scores have been increasingly used in sociophonetic research recently for good reason, as they have been shown to offer potential advantages over Cartesian distance (Hall-Lew, Reference Hall-Lew2010; Nycz & Hall-Lew, Reference Nycz and Hall-Lew2014), taking into account the degree of overlap between two clouds of tokens. Although both methods point to essentially the same results in the north-force merger in Manchester, Cartesian distance has turned out to be more sensitive to age differences within the sample: it confirms the (albeit weak) apparent time trends detected independently in minimal pair tests (and in the F1 of force), whereas Pillai scores do not. This may be connected to the type of merger we are dealing with, which in this case appears to be a merger by approximation rather than by expansion (Trudgill & Fox, Reference Trudgill, Foxcroft and Trudgill1978) in that the merged vowels are closer to each other and occupy a smaller area in comparison with their original distributions.Footnote 11 It may be that in this type of merger, acoustic distance measures are at least as helpful as overlap measures, such as Pillai scores, in illuminating the progress of the change. Although more research is needed on this issue, the north-force results in Manchester suggest that the use of Cartesian distance for the study of mergers in progress should not be abandoned just yet.
Acknowledgments
This research was funded by the UK Economic and Social Research Council (ESRC, grant ES/I009426/1). Earlier versions of this paper were presented at Phonology of Contemporary English 2015 (PAC2015) in Toulouse, April 9-13, 2015, and at International Conference on Language Variation in Europe 8 in Leipzig, May 27–29, 2015. I am heavily indebted to Ricardo Bermúdez-Otero and Danielle Turton for their support and inspiration throughout this project. I would like to thank Bill Labov, Gillian Sankoff, and Peter Trudgill for their kind encouragement and comments on an earlier draft of this paper. Many thanks to Louise Middleton and Jess Fox for assistance with data collection and coding. I would also like to thank Jacques Durand, Katarzyna Dziubalska-Kołaczyk, Suzanne Evans-Wagner, Lauren Hall-Lew, Robert Lew, Anne Przewozny-Desriaux, Patrycja Strycharczuk, Jarek Weckwerth, and two anonymous reviewers for their helpful comments and suggestions.


 Open access