

1 Introduction
The foot–strut split is one of the most prominent sound changes dividing the linguistic systems of the North and South of England. Estimated to have taken place during the 17th century (Wells Reference Wells1982: 197; Lass Reference Lass and Blake2000: 89), the historical split never occurred in the North of England, meaning that speakers today have homophones in the following words:

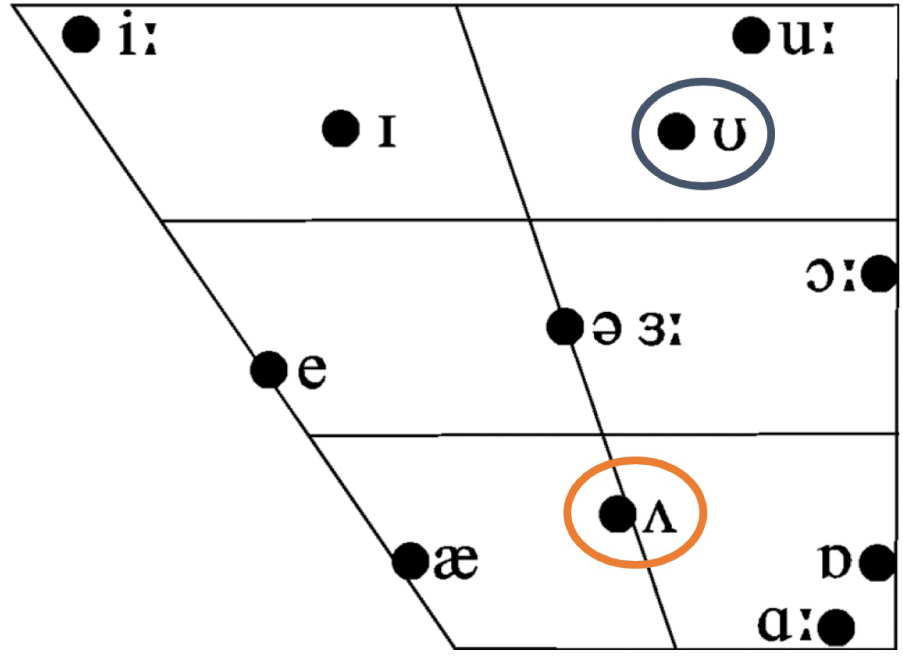
In these varieties, foot is represented by the high back lax vowel /ʊ/, and there is a five-vowel system of short vowels, excluding /ʌ/ (see Figure 1 for the monophthongs of Received Pronunciation as traditionally described).Footnote [2] As far as we know, the only other areas which report /ʊ/ for both foot and strut are some parts of Ireland, such as the local variety spoken in Dublin (Wells Reference Wells1982, Hickey Reference Hickey1999, Lonergan Reference Lonergan2015) and the areas of North-East Wales which border with the North West of England, such as Wrexham (Morris Reference Morris2013). It is important to note that the fourth pair listed above, look–luck, is not a relevant foot–strut minimal pair for all Northerners. The pronunciation of the -ook words such as book, cook with the goose vowel [uː] is found in areas such as Liverpool, Newcastle upon Tyne and Stoke-on-Trent (Figure 3 later in the paper maps these areas), but is restricted to the speech of the oldest generations in Manchester (Baranowski & Turton Reference Baranowski and Turton2015), the community under investigation here.
The representation of the foot–strut vowels in the vowel space for Received Pronunciation. foot is /ʊ/ (circled in blue) and s is /ʌ/ (circled in orange).
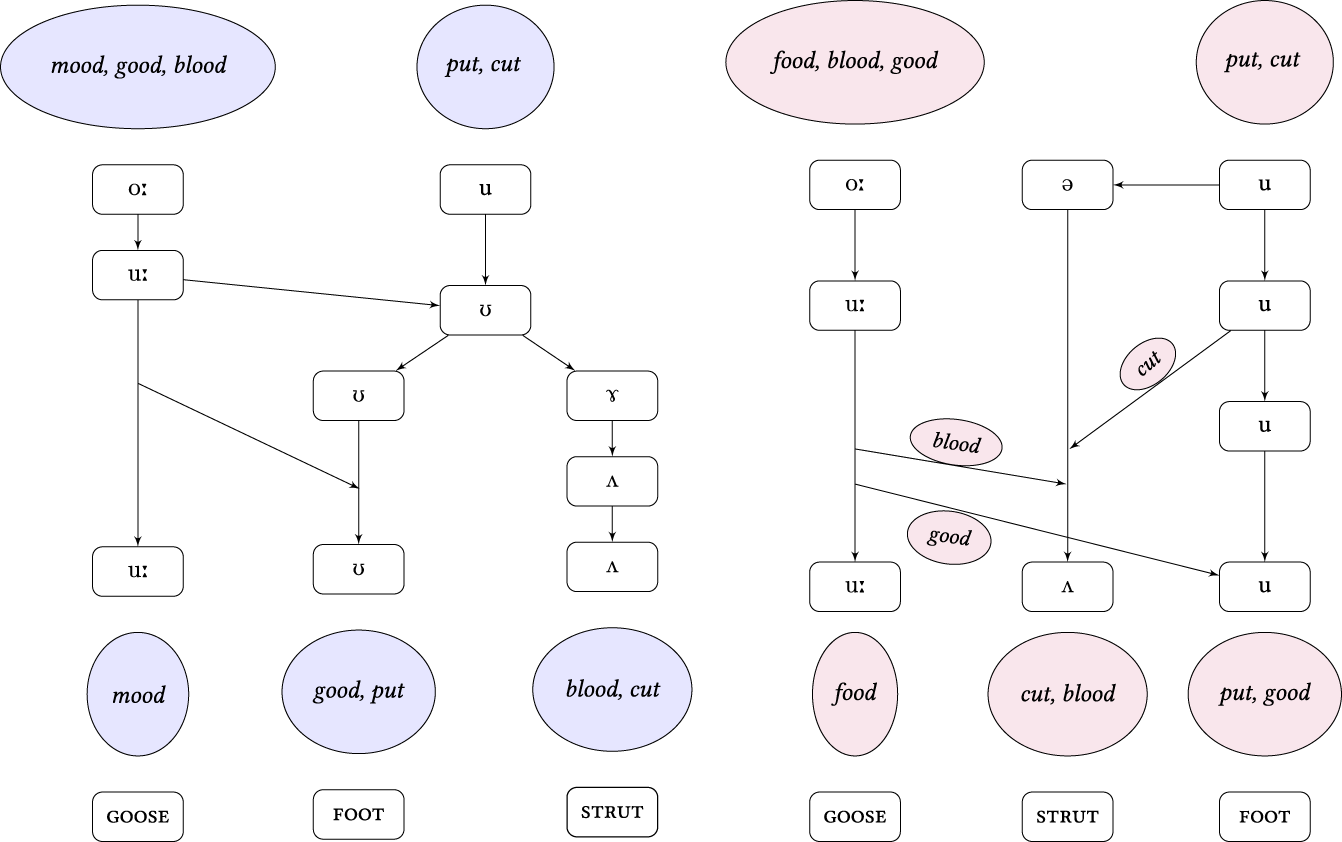
Historical trajectory of split, adapted from Wells (Reference Wells1982: 198) on the left and from Lass (Reference Lass and Blake2000: 89) on the right.
Map of foot–strut distinction from MacKenzie et al. (Reference MacKenzie, Bailey and Turton2016, Reference MacKenzie, Bailey and Turton2020) with superimposed major isophone from The Linguistic Atlas of England (Orton et al. Reference Orton, Sanderson and Widdowson1978) based on 1950s data from the Survey of English Dialects (SED). Lighter colours indicate areas with speakers who rhyme the words (i.e. have no split) and darker colours represent those who do not (i.e. have the split). Locations mentioned elsewhere in the text have been added here for reference.

The present study aims to explore the social stratification of the foot–strut vowel(s) in the accent spoken in Manchester in the North West of England. A secondary aim is to test the phonemic status of this vowel, and whether all speakers truly do show a complete lack of split in both their production and their judgement elicitation tasks. Overall, the paper seeks to contribute to our theoretical understanding of vowel categories and distinctions, as well as addressing some of the methodological considerations relevant to measuring distinctions. From a diachronic perspective, this investigation seeks to utilise present-day data and synchronic patterns to illuminate potential historical pathways of diachronic change, affording researchers a window on how splits originate. Moreover, we seek to address how constraints on the phonological grammar, such as the creation of a new phonemic category, places limits on the range afforded to variation and sociolinguistic change.
2 The foot–strut vowel(s) in English
2.1 The history of the split
The early history of the foot–strut split is unclear, with initial reports dating back to the late 16th century, but more solid evidence appearing in the 17th century (Lass Reference Lass and Blake2000: 89). The split stemmed from Middle English short /u/ unrounding in most contexts to something approximating [ˠ], with [ʊ] being retained after labials. Minkova (Reference Minkova2014: 245) points out that the phonetic rationale for this is clear: the labiality feature is kept in the transition from onset to nucleus. This would seemingly result in an allophonic distinction, and Wells (Reference Wells1982: 197) suggests this is potentially how the split began. However, the situation becomes much more complicated when we consider the intermediate stages resulting in the present-day realisations with minimal pairs, thus demonstrating that an allophonic distribution is not the case in Present-day English. Not only are there clear exceptions to the above rule (today fun, mud have [ʌ], cushion has [ʊ]Footnote [3]), these exceptions spread with the shift of Middle English /oː/ to /u/ during the Great Vowel Shift. The -oo- set contains many examples of [ʊ] after non-labials e.g. looking good. Some words in the /oː/ set shortened early on, and thus joined the /u/ category in the Great Vowel Shift, in time for the split. These tend to have /ʌ/ in Present-day English e.g. blood, gums. Those lexical items which shortened later tend to have /ʊ/, but these words varied regionally,Footnote [4] which is why many Northerners today have /uː/ for -ook words (Wells Reference Wells1982: 197–198).
The trajectory to the rather messy present-day situation is outlined in Figure 2, adapted from Wells (Reference Wells1982: 198) and Lass (Reference Lass and Blake2000: 89). Their interpretations of the trajectory are slightly different from one another. Lass argues that evidence from 17th century reports demonstrates that Middle English /u/ started to shift while it was still [u], that is, before it centralised and lowered to [ʊ], although it is probable that this tense/lax distinction was already phonetically variable at this point. Wells includes more phonetic gradience in the change. However, what is clear from the available records, such as the word lists in Ellis (Reference Ellis1874: 1001–1017), is that the evidence of the split from 17th century orthoepists is variable in nature and moreover is evident predominantly in reports from well-off speakers based in the London area. Thus, it is important to emphasise that the overall picture that we do have is based on limited evidence. Nevertheless, what is clear is that the split is phonologically and phonetically complex and that during the historical shift to the present-day pattern, vowels shifted as part of a broader mechanism, with lexical items flitting from one category to another. This, alongside gradient phonetic change and regional variability, gives us the system we have today.
From the perspective of Northern authors, Beal (Reference Beal2012) reports no evidence of the split, and quotes 18th century sources which confirm that it is not found in the North. Although the split never did occur in the North of England, understanding its diachronic trajectory may give us insight into why some of these changes occurred in the first place in the South. Of course, the historical linguistic context is completely different today, and it is unlikely that if the foot–strut split was indeed spreading northwards in 21st century England, it would be through the same mechanism. However, some understanding of the potential phonetic and lexical pathways of change may help us predict whether this split is likely to continue spreading (albeit very slowly) and the mechanisms by which this might happen.
2.2 Present-day English
Today, regional accents in the North of EnglandFootnote [5] retain the lack of distinction. In a large-scale online survey, MacKenzie, Bailey & Turton (Reference MacKenzie, Bailey and Turton2016, Reference MacKenzie, Bailey and Turton2020) found that 82% of speakers north of the Midlands claim that foot and cut rhyme, whilst Midlands speakers were at 52%. Maguire’s (Reference Maguire2009) survey reports similar numbers (72% non-distinct in the North, which includes the Midlands). The map in Figure 3, adapted from MacKenzie et al. (Reference MacKenzie, Bailey and Turton2020), demonstrates that the isophone has moved further North compared to its position in The Linguistic Atlas of England (Orton, Sanderson & Widdowson Reference Orton, Sanderson and Widdowson1978). Evidence from Britain et al.’s (Reference Britain, Leeman, Blaxter, Kolly, Grossenbacher, Calame and Wanitsch2016) English Dialects App also suggests that the split may be spreading, with the boundary being further North and the percentage of speakers with the split increasing all over the country (see also Leemann, Kolly & Britain Reference Leemann, Kolly and Britain2018). Note that these two recent surveys inherently elicit judgements from younger speakers, who will be much more likely to use mobile phone apps or take online surveys. In contrast, the data from The Linguistic Atlas of England mapped 1950s data from the Survey of English Dialects (SED), which purposely targeted the opposite demographic: Non-mobile Older Rural Males (NORMs). Thus, this change may not be as drastic as it first seems.
If the distinction is indeed spreading today, the most likely scenario is that this is happening through lexical diffusion i.e. moving through the lexicon gradually, but abruptly on the phonetic dimension. That is, speakers in the Midlands area are flipping appropriate words one by one into the strut lexical set. Trudgill (Reference Trudgill1986: 59) suggests just this: that a foot–strut distinction is spreading northwards, but only on a word-by-word basis. Reports from Wells (Reference Wells1982) would also seem to support this view, as he cites Midlands speakers as being variable, with words such as rubber having [ʊ], but butter having [ʌ] (Heath 1980, cited in Wells Reference Wells1982: 352). As the split is, synchronically, highly unpredictable by phonological conditioning, lexical diffusion is the only mechanism by which it could spread.
In terms of the phonetics and phonemic distribution of varieties which do not have the true split, very little quantitative empirical work exists. Britain (Reference Britain2015) describes the phonetic contexts in the Fens which seem to favour a more [ʊ]-like variant vs. a more [ʌ]-like realisation, as shown in Table 1 (see also Britain Reference Britain, Chambers and Schilling2013, Reference Britain, Watt and Llamas2014 for a detailed overview of foot–strut in the Fens).
Britain (Reference Britain2015: 410) on the phonetic tendencies of foot–strut variation in the Fens.

Chambers & Trudgill (Reference Chambers and Trudgill1998: 106–112) separate varieties which show intermediate forms in terms of variance and gradience into ‘mixed lects’ and ‘fudged lects’. Mixed lects are varieties which sometimes use [ʊ] and sometimes use [ʌ], somewhat interchangeably (although undoubtedly there would be predictive factors). They map data from East Anglia and the East Midlands area showing the variability of this vowel in SED informants, showing that in some areas both variants are acceptable for the same lexical item (see also Upton 1995). Fudged lects are varieties which have a phonetic realisation somewhere between [ʊ] and [ʌ]. There is plenty of evidence in the descriptive dialectology literature that many speakers of English without a phonemic distinction have these fudged variants, what Hughes, Trudgill & Watt (Reference Hughes, Trudgill and Watt2005: 60) call a ‘phonetic compromise’ between [ʊ] and [ʌ], approximating schwa. As Beal (Reference Beal2010: 13) explains, it is often middle class speakers of Northern English who may produce a compromised [ə]-like form. However, Beal is clear that presence of this lowered vowel is unlikely to indicate a phonemic contrast between /ʊ/ and /ʌ/ but rather one phoneme with an intermediate phonetic realisation.
One could infer from these descriptions that fudged variants are the result of speakers aiming for an intermediate phonetic target somewhere between the two distinct forms that they have heard in the wider (supra-local) community. Whilst this is entirely possible, the other interpretation is that in some locations, fudged forms date back to the original shift of [ʊ] to [ʌ]. Ellis (Reference Ellis1874: 17) describes ‘the intermediate country’ (which reflects areas between the northernmost boundary of [ʌ] and the southernmost boundary of [ʊ]) as being mixed or transitional. Available dialect surveys from the mid-twentieth century may also support this. Although the SED only reports fudged variants in Norfolk, the American fieldworkers in The Lowman Survey (Kurath & Lowman Reference Kurath and Lowman1970: 17) map such realisations from Norfolk to Somerset and Dorset (transcribed as ![]() where the first represents slight rounding and the second a form slightly higher than [ʌ]). It is possible that American ears are more sensitive to the variation in British strut (which traditionally is lower than in American English; although see Lindsey Reference Lindsey2019), and interestingly it can be noted that the SED fieldworker for Norfolk was one of only two American fieldworkers on the project, W. Francis Nelson (Orton Reference Orton1962: 16). Thus, it may be the case that these fudged forms likely represent fossilised transitional forms which have always been the norm in some areas of England but not necessarily noted by British ears. This story is probably not the case, however, for fudged variants in the North which, as Beal (Reference Beal2010) indicates, are associated with middle class speech. Such variants are reported for the middle classes in Hull (Williams & Kerswill Reference Williams and Kerswill1999: 146), middle class females in Newcastle (Watt & Milroy Reference Watt and Milroy1999: 28) and in self-conscious speech in Derby (Docherty & Foulkes Reference Docherty and Foulkes1999: 49), and are more likely to have arisen from speakers being aware of their own local [ʊ]-like variant in contrast with a more prestigious Southern [ʌ]-like variant. Such fudged forms are certainly not typical of Manchester speech, further analysis of vowel centralisation would be required to investigate the true picture of potential middle class fudging in the city.
where the first represents slight rounding and the second a form slightly higher than [ʌ]). It is possible that American ears are more sensitive to the variation in British strut (which traditionally is lower than in American English; although see Lindsey Reference Lindsey2019), and interestingly it can be noted that the SED fieldworker for Norfolk was one of only two American fieldworkers on the project, W. Francis Nelson (Orton Reference Orton1962: 16). Thus, it may be the case that these fudged forms likely represent fossilised transitional forms which have always been the norm in some areas of England but not necessarily noted by British ears. This story is probably not the case, however, for fudged variants in the North which, as Beal (Reference Beal2010) indicates, are associated with middle class speech. Such variants are reported for the middle classes in Hull (Williams & Kerswill Reference Williams and Kerswill1999: 146), middle class females in Newcastle (Watt & Milroy Reference Watt and Milroy1999: 28) and in self-conscious speech in Derby (Docherty & Foulkes Reference Docherty and Foulkes1999: 49), and are more likely to have arisen from speakers being aware of their own local [ʊ]-like variant in contrast with a more prestigious Southern [ʌ]-like variant. Such fudged forms are certainly not typical of Manchester speech, further analysis of vowel centralisation would be required to investigate the true picture of potential middle class fudging in the city.
There is little in the way of instrumental phonetic study of the foot–strut vowels, and almost no published work from a variationist perspective. Ferragne & Pellegrino’s (Reference Ferragne and Pellegrino2010: 14–20) analysis of numerous varieties of English based on a single speaker reports a complete lack of split for East Yorkshire English, Lancashire, Liverpool and Newcastle in their hood–hud pairs. More recently, Strycharczuk et al. (Reference Strycharczuk, Brown, Leemann and Britain2019) analysed reading passage data from the English Dialects App Corpus representing 141 speakers from seven cities across the North of England, including Manchester. They found that around a quarter of their Northern informants had some kind of split. This effect was more typical of female speakers, and those who had moved around more i.e. more mobile informants. Just four of the 25 Mancunians in their corpus were found to exhibit some kind of split, below the average for Northerners in this sample.
Intriguingly, Flynn (Reference Flynn2012) and Braber & Flynn (Reference Braber and Flynn2015), who present one of the only sociolinguistically-informed acoustic phonetic investigations of the foot–strut vowels in a Northern variety (Nottingham in the East Midlands), report that although the vowels sound the same, there is a small instrumental difference. Braber & Flynn (Reference Braber and Flynn2015: 370) point out that this unusual result warrants further research. This is something the present investigation will be able to address.
If the vowels truly are non-distinct, we may expect instances of hypercorrect foot to something approximating [ʌ] from speakers who interpret a lower vowel as what Chambers & Trudgill (Reference Chambers and Trudgill1998: 42) refer to as a more ‘statusful RP form’. Wells (Reference Wells1982: 353) cites sugar, butcher, cushion as common words in which to find speakers ‘poshing-up’ and producing hypercorrect foot.Footnote [6] Sankoff (Reference Sankoff and Fought2004) reports that her own grandmother, a Northern English speaker (from the Greater Manchester area) living in Canada, had variable hypercorrection in many foot words such as put and book, a strategy seemingly implemented to avoid the ‘hated’ [ʊ] sound. The motivation for mobile speakers to change later in life is discussed in the next section in more detail. Here in Manchester, the authors have also heard speakers hypercorrect foot, book, often to something approximating lot rather than an RP-like form. Almost always in our experience, this is heard in teachers or university lecturers, and when great attention is being paid to speech. Thus, the sociolinguistic interview format may not be the best place to find such forms.
Labov (Reference Labov1994: 347) states that the importance of Received Pronunciation (henceforth RP) as a reference accent will mean that some individuals from the North will have succeeded in striving to acquire a true distinction. The results from more recent dialect surveys support this (Britain et al. Reference Britain, Leeman, Blaxter, Kolly, Grossenbacher, Calame and Wanitsch2016; MacKenzie et al. Reference MacKenzie, Bailey and Turton2016, Reference MacKenzie, Bailey and Turton2020; Strycharczuk et al. Reference Strycharczuk, Brown, Leemann and Britain2019). Labov does note, however, that these speakers are in the minority and begin learning the rules in their pre-adolescent years. This may be at boarding school or perhaps from southern parents, although this southern influence would likely only survive in middle class areas or in the case of determined individuals. Wyld’s (Reference Wyld1936: 3–4) descriptions support this, as he asserts that speakers acquire the distinction through ‘opportunity and experience’, signifying that some individuals make a concerted effort to achieve an RP strut. His claims that RP is a regionless dialect spoken in the public school systemFootnote [7] would seem to hold for the foot–strut vowels in the North. See Halfacre (Reference Halfacre2019) for instrumental evidence of a true distinction in privately educated Northern speakers.
2.3 Plasticity, change across the lifespan and age grading
If we indeed find speakers using hypercorrect foot, and individuals acquiring a split through education, it raises the question as to whether Northerners can acquire a split later in life. If not a phonemic one, perhaps they can recreate an approximation of the phonetics. Sankoff’s (Reference Sankoff and Fought2004) paper analysing the speech of Nick and Neil from Michael Apted’s Up documentary series attempts to do just this. Nick and Neil, both from the North of England, show a large increase in the use of [ʌ] realisations as they age. Although Sankoff demonstrates that Nick and Neil have changed their phonetics, she is cautious in stating whether or not they have achieved a phonemic split. Sankoff (Reference Sankoff and Fought2004: 18) describes a scene in one episode where Nick, as an adult, slips back into his Northern [ʊ] forms when he becomes emotional whilst describing how he came to learn that his baby brother was deaf. Following Labov (Reference Labov1972) and the ‘danger of death’ question,Footnote [8] Sankoff notes how states of high emotion are the best for eliciting the true vernacular and would possibly help reverse the effect of formality that the interviewees may have felt during the filming of the documentary series. This would suggest that Nick has not truly acquired the phonemic split like a native speaker, but very successfully learnt which words contain which phonetic realisation. Sankoff states that there is clear evidence of age grading in Nick and Neil’s speech, whilst pointing out that the two men are exceptional individuals who have lived unusual lives and moved around a great deal, as opposed to the majority of speakers who tend to stay put and do not change past adolescence.
Labov (Reference Labov1994: 348) notes how the role of the mass media should not be dismissed in advance for individuals who learn to acquire a Southern-like strut vowel as they age. Although studies of sound change have shown little evidence of the media producing a community shift, Labov states that the media could serve as a template for the foot–strut split in highly-motivated individuals who may be isolated within their Northern peer group and aspire to speak the perceive educated standard. This may be further motivated by mobility, as Strycharczuk et al.’s (Reference Strycharczuk, Brown, Leemann and Britain2019) speakers demonstrate, as well as various studies analysing the speech of Northerners living in the South of England, which we turn to now.
Evans & Iverson (Reference Evans and Iverson2004, Reference Evans and Iverson2007) present a series of perception and production experiments looking at Northerners attending university in London. In their production data, they found that these Northerners would often produce the fudged variant of foot–strut, which the authors put down to speakers’ motivation to lose their regional accent in order to fit in at university. In a related vowel judgement task (Evans & Iverson Reference Evans and Iverson2004), the authors compared Northerners living in London with those still living in the North.Footnote [9] Northerners living in London were highly capable of changing their acceptability of pronunciation if they were expecting a Southern voice as opposed to a Northern voice. That is, they would accept lower vowels as acceptable in strut words when listening to a Southern voice. Northerners remaining in the North of England did not do this. These results could initially point towards the university students acquiring a new phonetic form, which may after time result in a phonemic split, even though in production speakers opt for the fudged form. However, recent results from Chiu & Evans (Reference Chiu and Evans2018) demonstrate that, indeed, if the phonemic contrast is not learnt early in life, it can never be acquired perfectly.
In a series of production and perception tasks, Chiu & Evans (Reference Chiu and Evans2018) compare Northern Freshers (i.e. students just arriving in London for university), with Northern students who have been in London for two years, and with Southern students. Using EEG, a three-way alternative forced choice discrimination task, and a vowel production task, the authors find some important results for studies of lifespan change. They find that Northerners who have been in London for two years perform, seemingly, as well as Southerners on the production of foot–strut distinction. However, in the EEG data, even though long-term Northerners are very good at detecting vowel changes (much better than the Freshers), they show considerably different Event Related Potential responses when compared to Southerners, who have acquired this phonemic distinction from birth. Chiu & Evans conclude that whilst Northerners living in the South of England can change their production very successfully given time in the area, these changes are not fully complete.
Kerswill (Reference Kerswill1996: 200) proposes a hierarchy of difficulty for language change across the lifespan, whereby new lexical items are the least difficult to learn (and can be done throughout life), regular changes (such as Neogrammarian shifts and mergers) are somewhere in the middle and seem possible in adulthood, and new phonemic distinctions have to be acquired by adolescence. The fact we are able to learn new words later in life is non-controversial, but a growing body of work also supports the idea that regular sound change may be possible in adulthood. Harrington’s (Reference Harrington2006) famous study of the Queen’s happ y-tensing demonstrated this, whereby it was shown that Queen Elizabeth II’s final unstressed vowel in words like happy, baby, city is moving away from the more conservative RP [ɪ] and further towards a modern-day RP tense [iː]. Similarly, Conn & Horesh (Reference Conn and Horesh2002) show that the fronting of the goat vowel, whereby words like goat, no, home are realised with a fronter articulation, may be acquired by adults moving to Philadelphia, a goat-fronting dialect, from Detroit, a non-fronting region. The ability to acquire regular sound changes in adulthood is also demonstrated in more recent work by Bowie (Reference Bowie2019). Thus, regular shifts that are phonetically gradual and lexically abrupt certainly seem possible post-adolescence for some speakers. This seems to hold for categorical variable rules: as long as the speaker has variability in the first place, they can shift their rates of frequency as they age (see MacKenzie Reference MacKenzie2017 on phonological variation and Raumolin-Brunberg Reference Raumolin-Brunberg2005 on morphological variation). Recent work by Hartshorne, Tenenbaum & Pinker (Reference Hartshorne, Tenenbaum and Pinker2018) demonstrates that for certain syntactic phenomena, the window may close at ‘the crux of adulthood’ i.e. 17.4 years. They note that this critical period may differ for the phonology and, perhaps, in some individuals.
Indeed, new phonological oppositions seem to be amongst the most difficult and thus less likely to be acquired post-adolescence. Like Labov, Kerswill (Reference Kerswill1996) suggests that phonological oppositions such as foot–strut would have to be acquired by 13 years of age in order for speakers to truly demonstrate the extra phonemic category. This is one of many articles in the second dialect literature arguing for a critical period for more difficult forms like foot–strut. Chambers’s (Reference Chambers1992) seminal study of Canadian children moving to the South of England also gives us a window into the hierarchy of difficulty of different changes. Chambers demonstrates how more simple changes, which do not require the learning of a new phonemic category and are orthographically distinct (e.g. the loss of t-voicing), are acquired much more successfully than those which involve a new phonemic distinction (e.g. the lot–thought distinction) or are lexically unpredictable (e.g. the trap–bath distinction). In Kerswill’s hierarchy, the learning of a new phonemic distinction is surpassed only by lexically irregular phonological rules such as the Philadelphia æ-tensing pattern whereby /æ/ tenses in a highly unpredictable set of environments (Labov Reference Labov1994). Payne’s (Reference Payne and Labov1980) study of a Philadelphia suburb demonstrated that the pattern is so difficult to learn that only children with both parents from the area did so successfully, and Sneller’s (Reference Sneller2018) recent work in Philadelphia has shown that many speakers in the community are moving towards the simpler nasal pattern of æ-tensing. From the perspective of the phonological grammar, if this evidence suggests anything, it is that the odds are stacked against speakers in acquiring a foot–strut distinction later in life. How this will play out for some members of the speech community where the social pressures are stacked in favour of a split is something which we can seek to investigate to some extent here.
2.4 The unmerging of the FOOT–STRUT vowel in Northern English varieties?
The existing literature suggests that the foot–strut vowel(s) are conditioned by contextual phonetic/phonological factors (such as neighbouring segments) and social factors (such as socio-economic class and mobility), whilst posing interesting questions for plasticity and the possibility of speakers acquiring new phonemic contrasts. Moreover, if the evidence from new dialect map data is to be believed, social pressures of the RP-like distinction may eventually outweigh the structural pressures against creating a new phonemic category. This goes some way to explaining why the spread of foot–strut distinction goes against Herzog’s corollary to Garde’s Principle: that mergers expand geographically at the expense of distinctions (Herzog Reference Herzog1965; Labov Reference Labov1994, Reference Labov2007). Indeed, Labov himself (Reference Labov1994: 342–343) asserts that it is an error to assume that mergers can never be reversed, and outlines the social conditions that would have to be present for such a rare development to occur; the foot–strut pair is not a merger, of course, but we can apply the same principles to some extent. As Eckert & Labov (Reference Eckert and Labov2017) note more recently, the reversal of mergers is an exception to the rule and they cite just one example of such a process: Baranowski’s (Reference Baranowski2007: 236) report of near–square reversal in Charleston, South Carolina. Charleston is unusual in that many aspects of its phonology are led by a prominent upper class, demonstrating that the social pressures have to be particularly strong to exert such a force on the underlying system. Labov (Reference Labov1994: 342–343) states that for Herzog’s Principle to be tested, there must be an overt campaign to ‘bestow prestige on the distinction’ but also that, as a general rule, ‘mergers and splits have no social affect associated with them’ (see also Baranowski Reference Baranowski2013 for a further discussion of the role of social factors in mergers). In terms of foot–strut, we agree with Labov on this note: it is not the presence of two separate phonemic categories that upwardly mobile speakers see as prestigious, rather it is a lower vowel articulation generally. However, it is important to underline that we do not expect our particular dataset to illuminate the debate of whether or not the foot–strut distinction is spreading North, simply because Manchester is not in close enough proximity to the foot–strut border. Although we may find aforementioned ‘motivated individuals’ in Manchester who are attempting to become split (perhaps more similar to Chiu & Evans Reference Chiu and Evans2018 and Evans & Iverson’s Reference Evans and Iverson2007 Northern Freshers), the issue of diffusion more widely in the British Isles is really best studied by researchers working far closer to the foot–strut border (e.g. Evans & Iverson Reference Evans and Iverson2004, Braber & Flynn Reference Braber and Flynn2015). These are the regions more likely to have mixing of speakers with and without the distinction, and it is this face-to-face contact which would cause wider community spread. The question of how and whether this progression will affect an area much further north, such as Manchester, is something this paper seeks to address, which leads to our research questions:

3 Methodology
This study forms part of a larger project into variation and change in Manchester. We define the speech community primarily as the area within the M60 ring road, including the neighbourhoods of Sale, Wythenshawe, and Stockport just south of the M60 (which form part of the same uninterrupted urbanised area). Crucially, we do not include the entire urban conurbation of Greater Manchester, which includes satellite towns such as Rochdale, Oldham, or Bolton. The linguistic systems of these areas are quite distinct from Manchester itself (Baranowski & Turton Reference Baranowski and Turton2015) and warrant separate sociolinguistic study.
Data for this study is based on the acoustic analysis of the speech of 122 informants, stratified by age, gender, social class, and ethnicity (see Table 2). Of those informants, 91 speakers identify themselves as White British; the other 26 represent the two largest ethnic minorities in Manchester: Pakistani (18 speakers) and Black Caribbean (13 speakers). The informants all grew up in Manchester and, in the case of the White speakers (with the exception of the upper middle class), at least one of their parents is native to the Manchester area as well.
Social stratification of speakers. Note that in plots and statistical models, class is operationalised as five factors and age is a numeric variable.

Speakers are divided into five occupational levels for statistical models and graphs (1: lower working class (LWC), 2: upper working class (UWC), 3: lower middle class (LMC), 4: middle middle class (MMC), and 5: upper middle class (UMC)) using traditional methods of occupation,Footnote [10] but this is simplified into working vs. middle class in Table 2. For a detailed debate on whether occupation is the best way to operationalise social class, see Baranowski & Turton (Reference Baranowski and Turton2018). Although social class is occasionally visualised as a continuous variable in the figures, it is always treated as a categorical variable for the purposes of the regression.
Sociolinguistic interviews were conducted, focussing around the topic of growing up in Manchester in order to elicit narratives of personal experience (Labov Reference Labov, Baugh and Sherzer1984). This spontaneous speech was supplemented with word list reading and minimal-pair tests for a range of vocalic and consonantal contrasts. Minimal-pair tests for the words book–buck and crux–crooks were collected for 112 of the speakers by asking speakers to read each pair and state whether they thought the words were the same or different. The production of this was judged by two local students. There were five speakers who pronounced the -ook words such as book, look, cook with the goose vowel instead of the foot vowel. They are not included in the minimal-pair analysis here,Footnote [11] and have had these words excluded from the dataset for casual speech.
The interviews were recorded on Sony PCM-M10 recorders with Audio-Technica ATR3350 lavaliere microphones, at a sampling rate of 44.1 kHz at 24 bits. Speakers’ complete vowel systems were measured in Praat in terms of F1 and F2. F1, or the first formant, is an acoustic measure of vowel height; F2, or the second formant, is an acoustic measure of vowel backness. F1 is the measure of interest for this study and has an inverse relationship with height: a higher F1 means a lower vowel. For 25 speakers the point of measurement was selected by hand prior to the advent of forced-alignment tools, with the remaining 97 speakers being processed through the Forced-Alignment Vowel Extraction (FAVE) Suite (Rosenfelder et al. Reference Rosenfelder, Fruehwald, Evanini, Seyfarth, Gorman, Prichard and Yuan2014). Recent research into these forced-alignment tools indicates that there is no significant difference between FAVE placed boundaries and human annotators (MacKenzie & Turton Reference MacKenzie and Turton2020). FAVE codes the foot vowel as UH1 and the strut vowel as AH1, and filters out unstressed tokens.
This process resulted in a total of 11,492 tokens. Formant values were normalised using Lobanov’s (Reference Lobanov1971) method and scaled back to Hz. Tokens elicited by word list and minimal pairs were removed from the dataset for the statistical models in order to focus on spontaneous speech (8,831 tokens). Eight speakers with the true split (confirmed in minimal-pair tests; see Sections 4.1 and 4.2 above) were also removed from the final model resulting in a final number of 8,237 tokens. Word frequency is operationalised as a centred Zipf-scaled frequency from the SUBTLEX-UK corpus (van Heuven et al. Reference van Heuven, Mandera, Keuleers and Brysbaert2014).
We used mixed-effects linear models in R (lme4 package; Bates et al. Reference Bates, Mächler, Bolker and Walker2015) to model normalised F1, with a t-value of  $\pm$2 indicating a significant effect in the output tables. In model selection, we follow Barr et al. (Reference Barr, Levy, Scheepers and Tily2013) in testing our random effects structure, that is, starting off by including the maximal random effects structure as justified by the experimental design and reducing where appropriate. We decided on a random effects structure which included a by-speaker random slope for vowel category (i.e. foot vs. strut) to account for any individuals who may have been motivated to acquire a split independently, as discussed in the previous sections. Table 3 shows the predictors factored into model selection. Following place of articulation was found to have next to no effect on F1, and was removed from the final model after a likelihood ratio test confirmed its inclusion was not making a significant contribution to the model. All continuous variables were centred around the mean. Duration was log transformed to avoid skew and to ensure the predictor conformed more closely to the normal distribution. Graphs are visualised using ggplot2 (Wickham Reference Wickham2009), and F1 values are summarised over speaker and word, to prevent speakers or words that have higher number of tokens than others from skewing the overall effect.
All considered predictors and their final factor levels. Baseline levels are italicised.
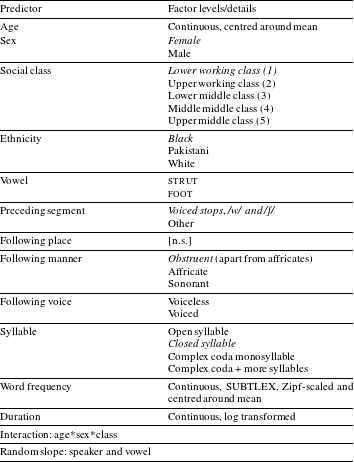
Note that the best model includes and interaction of age*sex*class, but we reserve the presentation of this model for Table A1 in the appendix, presenting the basic model without the statistical interaction in the main body of the paper. This is because a model with the interaction shows the coefficients for the baseline of the interaction predictors only (i.e. lower working class females of the mean age).Footnote [12] Thus, we deem the model without the interaction as a better overview of the variation in this dataset, but discuss the results of the interaction in Section 4.4 below.
We attempted various combinations in collapsing the preceding segment and following manner categories. We tried categorising with the in-built Plotnik (Labov Reference Labov2011) categories which are outputted with FAVE-align, but this did not seem to be the best way of capturing the variation in F1. When we had settled on all other predictors of the model, we ran additional models with preceding sound specified individually, in order to observe trends. We used the coefficients of this model to categorise similar sounds. A clear trend emerged in terms of sounds which favoured a higher vowel (lower F1) for preceding segment, which were the voiced stops, as well as /w/ and /ʃ/ which have a high tongue body and (some) lip rounding. All other sounds have a fairly wide pattern of variation which, for the most part, also seem to act in tandem with the following segment to produce an effect on the option was to keep preceding category as unspecified as possible. We opted for two categories, separating the voiced stops, /w/ and /ʃ/ from everything else. Doing so resulted in a reduced Akaike information criterion (AIC) when compared to other possible combinations.Footnote [13] For following manner, there was a straightforward division between obstruents and sonorants, although affricates were displaying some significantly different behaviour and thus were set as a third category from the rest of the obstruents. The final breakdown of the predictors and their factor levels can be found in Table 3. We plan to probe these phonetic conditions further in future work, but this may be best investigated with lab speech, as opposed to the sociolinguistic interview format.
4 Results
4.1 Minimal-pair tests
Figure 4 shows the results of the minimal-pair tests conducted at the end of the sociolinguistic interview. There were two minimal-pair tests for the foot–strut vowels: the informants were asked to read the pairs book–buck and crooks–crux, and to confirm whether the words sounded the same or different to them. In the left panel of Figure 4 under ‘judged’ is the participant response to this question, i.e. whether the speaker themselves contended that the words were the same or different. The right panel labelled ‘spoken’ shows whether the production was actually different. As explained in the methodology, speakers who have [uː] for -ook words, rather than [ʊ], have been removed. As Figure 4 shows, the vast majority of speakers report book and buck as being homophones in their judgement, which is largely matched by their production. The highest social classes are the exception to this, where these results would suggest that over half of respondents seem to have the split. There is one speaker in the upper working class group who reports these as being different, but produces them the same.Footnote [14] We revisit the production of book–buck in terms of the acoustics in Section 4.3.4.
Do book and buck sound the same to you? Results of the minimal-pair judgement tests by social class. ‘Judged’ refers to the answer given by the informant as to whether the pair sound the same or not. ‘Spoken’ means whether they produced a different or not in their elicited utterance.

The picture for the considerably less frequent minimal-pair words crooks and crux is very similar, although interestingly we have one upper middle class speaker who reports them as being the same, even though she has buck and book as different in production and perception. This is an indicator of the complexity of the potential phonemic status of this vowel in Northern Englishes. As discussed, the highest social classes may very well have some kind of phonemic distinction between the foot and strut vowels, acquired from private school, or in some cases from parents from the South. However, for very low frequency words, such as crux, speakers are likely to put this in the ‘wrong’ lexical set, as they simply do not hear it enough to be able to correctly posit its representation. This result from just one speaker is enough to support Trudgill’s (1986) claim that, if the foot–strut split is indeed moving northwards, it is doing it on a word by word basis. This is non-controversial evidence of an arguably rare example of the mechanisms behind lexical diffusion.
As expected, the vast majority of speakers report no foot–strut distinction and show no evidence for it in the minimal-pair production. Those speakers who do seem to have some kind of distinction do not necessarily have all words in the same lexical set as speakers of RP (e.g. crux remains in foot for the upper middle class speaker mentioned above). Using the results from the minimal-pair tests, along with the criteria listed below in Section 4.2, we deduced that eight of our speaker set have a true split (all middle to upper middle class speakers).
4.2 FOOT–STRUT: General findings and models
Figure 5 shows a selection of working class speakers from the sociolinguistic interview data, who clearly have one phonemic category for the foot–strut vowels (foot words are shown in blue circles and strut words in red triangles). From the youngest to the oldest speakers, male and female, it is clear that no emerging split is in progress here. Contrast this with the upper middle class speakers in Figure 6. To reiterate, eight of our 122 speakers show evidence of having a phonemic split, with six being upper middle class. Speakers were classified as having the split if they (i) reported a split in their judgement in the minimal-pair test (ii) produced a split in the minimal-pair test, and (iii) showed a consistent split in their sociolinguistic interview. These speakers were removed from the linear mixed-effects regression in Table 4.
A selection of working class speakers, demonstrating no evidence of a split. Numbers in the top row indicate age of speaker in years.

A selection of upper middle class speakers demonstrating that some are split and some are not. Numbers in the top row indicate age of speaker in years.

Final simple model without significant interaction terms of age*class*vowel. Random effect of word (sd = 14.29) and random slope of speaker by vowel class (standard deviation: strut = 40.6, foot = 36.37).  $t$-values above $\pm$2 are indicative of a significant effect when compared to the baseline factor (in parentheses).

Figure 6 shows four upper middle class speakers. Mike T, Wendy J and Matthew P were categorised as split speakers using the criteria above. Wilma L was not categorised as a split speaker: she reports book–buck as sounding the same, produces them the same, and has enough phonetic overlap in her sociolinguistic interview tokens to indicate that a phonemic split on a level with RP is not present. It is notable, however, that her productions seem to be in the direction as expected with someone with the split: strut tokens (in red) are lower than foot tokens, in blue. However, the minimal-pair items buck–book are completely overlapping in phonetic space for Wilma L. We return to this point later, in Section 4.3.4.
Table 4 shows the model from the mixed-effects linear regression on normalised F1 from the sociolinguistic interviews with the split speakers removed, leaving us with 8,237 tokens. Effects shown to be significant inclusions in the model by likelihood ratio test are social class, preceding segment, following manner, following voice, syllable category and, surprisingly, vowel class itself i.e. whether the word would be in the foot or strut category. Although age does not surface as significant in the model presented, it does in an interaction with social class and vowel (Table A1), but we save discussion of this for Section 4.4. A model including split speakers can be found in Table A2 in the appendix. The next section will discuss each of the linguistic effects in turn, starting with the most surprising effect: vowel class.
4.3 Linguistic effects
4.3.1 Vowel class
If, as we have argued, Mancunians do not exhibit the foot–strut distinction, we would expect that the predictor of vowel class would not surface as significant in our statistical model. Or perhaps that it would be significant for some more middle class speakers who do not have the split proper, but have something approximating it. In fact, both the model and Figure 7 demonstrate that there is an effect in the expected direction across the board, i.e. for all social classes.
The two vowels across five socio-economic classes (speakers with true foot–strut split removed). UH represents the foot class and AH the strut class.

As can be seen from Figures 7 and 8, although the difference is small (an effect size of just 28.7 Hz difference in the regression table in Table 4) it is still in the ‘right’ direction. This difference increases the higher up the social scale we go, as can be seen from zooming in on F1 in Figure 8.
F1 smoothed across five social classes (grouped by speaker and word), split speakers removed.

Figure 8 shows that, although the difference is small for the first three social classes (between 20 Hz and 30 Hz and arguably imperceptible) this increases for the two highest social classes, who have an average difference of around 60 Hz. Note again that speakers with a true split have been removed in these graphs and the statistical model presented above (i.e. all the speakers included claim to make no distinction between the vowels in minimal-pair tests), but the result holds for the speakers we have classified as having a non-distinct foot–strut. This is an intriguing result, as it is clear from our speaker judgements in minimal-pair tests that these vowels do not represent separate phonemic classes for the vast majority of speakers. Next, we turn to phonetic environment effects as a way of explaining some of this variation.
4.3.2 Phonetic environment effects
The phonetic environment predictors in this model are preceding segment, following manner and following voice. Following place of articulation has no significant effect on the F1 of the vowel, and is not represented in this model. It is clear that certain segments have heightening or lowering effects on F1, although these effects are not always entirely straightforward. Preceding segment results in a more foot-like vowel for preceding voiced stops, /ʃ/, and /w/. Most of these sounds are rounded or have some form of lip-rounding, which matches the rounding of [ʊ]. Why preceding /d, g/ might result in a higher vowel (lower F1) and /t, k/ do not, however, is not exactly clear, but considering this is an effect size of 20 Hz, it is not necessarily a result we are determined to find a clear interpretation for, although we would review this if the effect were to be replicated by other studies. Following manner results show that nasals and liquids result in a slightly higher F1 when compared to all obstruents, which is unsurprising given the known phonetic effects of nasals on F1, but is a very small effect (just 16 Hz). Following affricates e.g. in words like much, touch, Dutch show particularly low F1s i.e. more foot-like vowels compared to other obstruents, which again may be due to the rounding associated with these segments. The following voicing effect is potentially surprising, with voiced segments resulting in lower F1. Given that vowels are shorter before voiceless consonants, we did expect to find F1 lowering in a larger proportion of the vowel when the following consonant is voiceless. An anonymous JL referee points out that voiced obstruents are associated with lowering of the larynx, which increases pharynx length, thus lowering F1 and that it is also possible that speakers compensate for the shorter time before voiceless obstruents by opening the jaw for the vowel faster than they do before voiced consonants. In turn, this could potentially lead to vowels reaching their target values more consistently before voiceless consonants and therefore showing higher F1 values before voiceless consonants than before voiced ones. This is certainly possible and something to be considered, but we are unable to find any corroboration of this kind of effect in the existing literature. That, and the fact that most English speakers ‘voiced’ obstruents are not truly voiced, means that we present this explanation with interest, but also caution. Finally, following syllable sequence shows that open syllables have lower F1s, but closed syllables of different kinds have higher F1s, an effect which has been found in the phonetics literature and has been shown to be a cross-linguistic tendency (e.g. Storme Reference Storme2017). There is a strong effect of duration in that longer vowels have higher F1s. This, as already mentioned, is expected, given that the jaw has more time to open. There is no significant effect of word token frequency. Frequency may be expected to have a stronger effect on the F2 dimension where we would be observing reduction and centralisation.
One aspect of the phonetics which is difficult to account for in the statistical model is the combinatory ‘tag-team’ effects of certain segments flanking the vowel. For example, the summary from Britain’s analysis of the Fens (Table 1 above) indicates that adjacent segments such as /v/ can increase F1, as can following /l/ or /ð/, but in the presence of a following /g/ or /ʃ/, the F1 may be lower. Some of these findings have been replicated here. Although there is clearly some coarticulation of segments with a high tongue body (e.g. /g/) or rounded lips (e.g. /p b w/), there is no neat label by which we can categorise these. Inputting individual segments as preceding/following would cause difficulty in running in the model due to having empty cells of numerous combinations. To refine our argument, it may be worth looking at the lexical incidence of foot–strut vowels and their surrounding environments.
4.3.3 The co-occurrence of FOOT–STRUT tokens with adjacent phonetic forms
This section seeks to demonstrate that although we may not be able to provide a clear encapsulation of the phonetic environment effects to fully account for the foot–strut split in our data (as vowel class remains a significant predictor), the lexical incidence of foot–strut vowels in English with particular phonetic forms is very clear. As we will now show, foot vowels tend to occur with those sounds which lower F1 (thus resulting in a higher vowel), and strut vowels tend to occur with those sounds which result in a higher F1 (lower vowel). This argument may appear somewhat circular, but the point is this: the various heightening/lowering effects of F1 cannot be fully captured by our statistical model, but the lexical incidence of these various effects is difficult to reject.
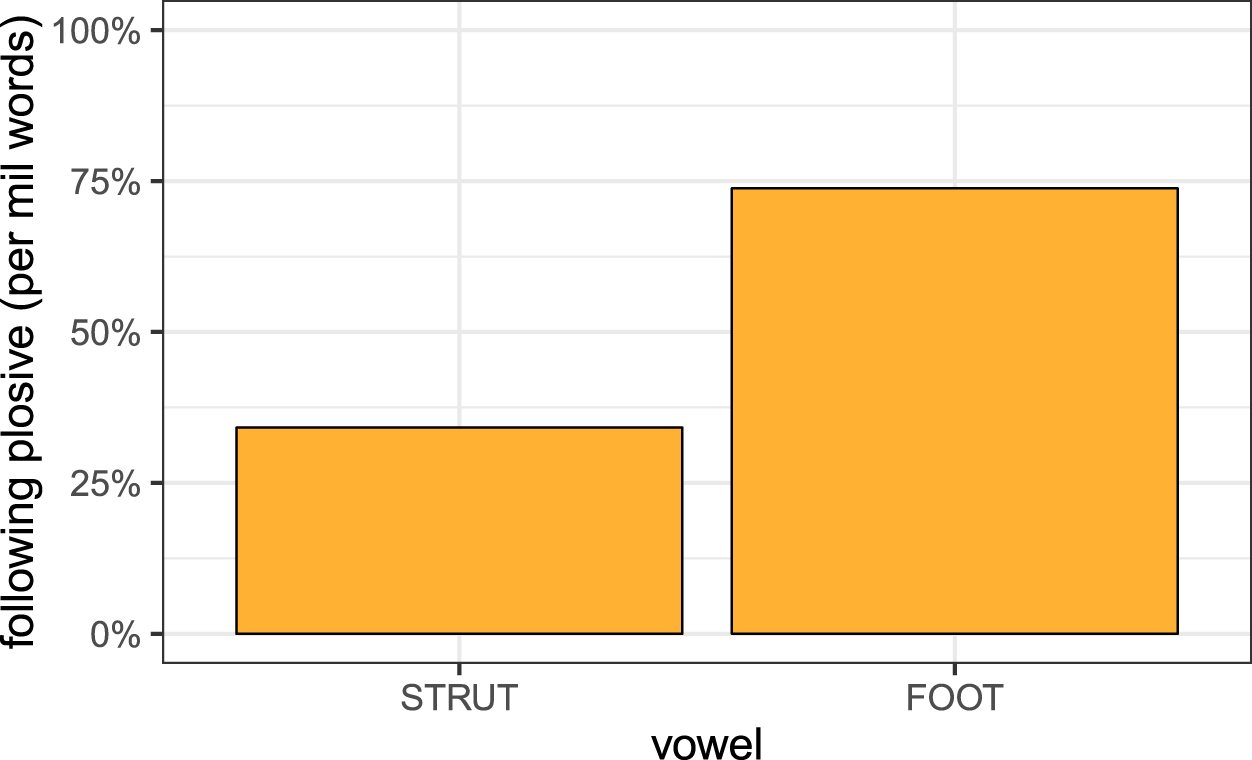
The numbers from the following graphs have been calculated as follows. Word frequency per million words was calculated for each word in the dataset using the SUBTLEX corpus. We then plotted proportional tables based on surrounding segments and frequency per million words to work out how often certain segments occur with foot vowels and how often they occur with strut vowels. For example, Figure 9 shows how often (when taking into account frequency per million words) foot–strut vowels co-occur with a following plosive. We can think of this in the following way: in a given set of one million foot tokens, 75% have a following plosive, but for the equivalent number of strut tokens, less than 35% do. Recall that our regression shows that following plosives give a lower F1, which is most likely due to the fact that vowels tend to be shorter before plosives (e.g. Peterson & Lehiste Reference Peterson and Lehiste1960) and, as discussed above for duration, the jaw has less time to open resulting in a closer vowel.
Frequency of foot–strut lexical occurrence. Following plosives tend to be found much more frequently in foot words than strut words.
Figures 10 and 11 show the frequency of occurrence of following nasals and preceding /p b w/ respectively for each lexical set. Figure 10 shows that following nasals account for over 35% of strut tokens, but very few of foot. In fact, as Table 5 shows, the only foot lexical item in our dataset with a following nasal is the word woman (with a moderate to low frequency of 166 per one million words), a disyllabic word. Syllable structure is accounted for by our statistical model, and an open syllable is more likely to result in a lower F1 (higher vowel), whereas a following nasal results in a higher F1. Finally, Figure 11 shows that preceding rounded tokens take up a much higher proportion of foot vowels than strut vowels, accounting for almost 50% of foot items in our frequency calculations. By far the most frequent words for each set according to SUBTLEX figures for this context are would for foot and but for strut. However, note that but only occurs six times in our dataset because unstressed tokens have been filtered out. This is potentially a functional explanation for why but became part of strut despite its phonetic environment favouring a more foot-like realisation: it is almost always in a reduced position syntactically, and thus is realised with a more centralised pronunciation.Footnote [15] This explanation arguably breaks down at should, would, could, but then again these modals can and do occur in stressed position much more often than but. A closer investigation of the typical prosodic context these words tend to find themselves in would give us a clearer picture of whether this hypothesis is viable.
Frequency of foot–strut lexical occurrence. Following nasals occur much more frequently in strut words than foot words.

Frequency of foot–strut lexical occurrence. Preceding /p b w/ occur much more frequently in foot words than strut words.

Examples of frequent phonetic contexts for foot and strut words. Shading indicates no examples remaining.

Although these effects alone should easily be able to be accounted for by a statistical model, it is the combinatory effect of more than one preceding and following coarticulatory segment that is difficult to capture. For example, often a following plosive occurs with a preceding round segment (would, put) which may have a cumulative effect on the vowel height, but not all cross-sections of preceding and following segments exist (e.g. preceding round, following nasal in a closed syllable does not exist) so it is problematic to enter all of this detail into the statistical model. Table 5 demonstrates frequent and infrequent occurrences in the data with example words in the favouring and disfavouring contexts. In summary, foot words consistently co-occur with phonetic environments that favour a higher vowel. strut words consistently co-occur with phonetic environments that favour a lower vowel. This is simply an observation about English.
Our results illuminate a situation that has received little attention in the field, that is the fact that classes of sounds that are not phonologically distinct can appear to be differentiated phonetically. This is not the first time an apparent separation in two seemingly non-distinct vowel classes has surfaced due to the coincidence of contexts in which the relevant words find themselves in. Fridland et al. (Reference Fridland, Kendall and Farrington2014: 345) find a similar situation in the durational measures of the lot–thought vowels in their California and Nevada speakers, who otherwise clearly have the low-back merger. They point out that findings such as these may be the key to understanding some of the more perplexing aspects of language change, and provide an explanation for the impossibility of unmerging of lexical sets. In addition, Thomas (Reference Thomas and Thomas2019: 133) notes a similar pattern in his Mexican American English speakers’ realisations of the low-back lot–thought vowels. Thomas argues that, although it may look like there is separation between the two sets acoustically for his speakers, the asymmetrical distributions of the vowel classes are responsible for the apparent distinction. Note that in American English, unlike British English, cloth words tend to fall into the thought set e.g. off, soft and thus this set has many frequent words before /f/. As Thomas explains, a following /f/ reduces F2, and these really only occur in the American English lot set in a following syllable e.g. officer.Footnote [16] On the other hand, the American English lot set tends to co-occur with contexts that promote a raised F2 i.e. a more centralised vowel. Two of the most common words lot words are not, got which not only have flanking consonants that may raise F2, but are also frequently in syntactically reduced positions, resulting in centralisation. Thomas (Reference Thomas and Thomas2019: 133) explains the effect in the following way, which is pertinent to the present study also:

This serves as a warning for researchers using large-scale datasets to unveil patterns of distinction or merger in spontaneous speech based on statistical patterns only. As Thomas argues, comparison of the pairs in the same phonetic context is required to avoid such contextual effects skewing the results. This is something we can do in the present investigation, thanks to the minimal-pair tests, which we will turn to in the next section. The fact that previous scholars (Braber & Flynn Reference Braber and Flynn2015) have observed this same pattern in non-distinct foot–strut gives us added confidence in our argument.
At this point, we conclude for the time-being that the phonetic effects on F1 are more complex than the predictors captured in our model. As Figures 9–11 show, there are various conditioning effects which team up, meaning that words which fall into the foot set tend to be those for which adjacent segments induce a lower F1 (higher vowel), and those which fall into the strut set tend to be those for which adjacent segments promote a higher F1 (lower vowel). Further corroboration of this argument should come from production in minimal-pair tests, as a prediction arising from this would be that speakers will produce minimal pairs the same, as they have identical surrounding environments despite being in different lexical sets.
4.3.4 Acoustics of minimal-pair tests
Above, we have argued that it is the cumulative effects of various phonetic effects which create apparent differences between foot and strut lexical sets in Mancunian speakers without a distinction. We demonstrate that patterns in English mean that speakers without a distinction may appear to have one in the phonetics due to the co-occurrence of phonetic segments with prescribed lexical sets. If this is truly the case, we should see that the acoustics of the minimal-pair tests, where the phonetic environment is identical, but the lexical set is different, should be the same if speakers truly do not have the split. As we shall show below, this argument is corroborated by the production of our minimal-pair tests, in which speakers produce identical tokens when the surrounding segments are the same.
Figure 12 plots the production of book and buck in acoustic space for a selection of working class and upper middle class speakers. The working class speakers in the top half of the plot (selected from lower and upper working) demonstrate that these words are identical in acoustic space, with negligible differences for some speakers. The working class speakers are representative of the vast majority of speakers in our dataset for these pairs. The upper middle class speakers have been selected to demonstrate both the contrast and lack of contrast dependent on the speaker themselves. Speakers such as Jacob A (21 years old) and Wilma L (57 years old) have no evidence of a phonemic distinction from these pairs. However, these speakers are only representative of around 50% of our upper middle class contingent. Speakers such as Helen C (45 years old), Mike T (26 years old), and Matthew P (66 years old) have a clear phonemic distinction in their production (confirmed in casual speech; see Figure 6) as well as in their own perception. This tallies with both Wyld’s (Reference Wyld1936) and Labov’s (Reference Labov1994) claims that acquisition of the distinction in Northern speakers is most likely something that will appear in a minority of speakers, with potential drivers including education, parental input or individual motivation. We discuss some of the possible mechanisms behind this below in the next section.
A selection of speakers’ minimal-pair productions of book and buck demonstrates that the vast majority of speakers have identical productions, but some upper middle class speakers have a true distinction.

4.4 Social effects
This section will primarily focus on the socio-economic class effects in the data, but first we briefly discuss additional social factors. There is a small effect of sex, with females showing a slightly higher F1 (lower vowel) than males, somewhat in line with Strycharczuk et al.’s (Reference Strycharczuk, Brown, Leemann and Britain2019) results. Note that this is an overall finding in the acoustics of both vowels combined. We find no evidence that women are more likely to have a phonemic distinction, just that they have a lower vowel (this is confirmed by likelihood ratio test of a model which includes an interaction between vowel class and sex and one that does not).
Ethnicity does not seem to play a role in this distinction, although a model which includes an interaction between ethnicity and vowel class does perform slightly better than one without. Closer inspection of this shows that Pakistani and White speakers are more likely to have a difference between the two vowel classes than Black speakers. We approach this modest result cautiously, however, as our numbers for ethnic minority speakers are not yet at a level where we are able make strong conclusions about small statistical significances, particularly when we do not have appropriate representation of ethnic minority groups across the social class spectrum (for example, British Pakistani speaker Robert S is our only non-white upper middle class speaker). This will be an avenue for future study, considering the acquisition of local forms from ethnic minority groups, particularly in relation to their arrival in the area. Drummond (Reference Drummond2013) demonstrates that Polish speakers arriving in Manchester retain a distinction between foot and strut, but the next question is whether the children of these speakers would do so. This is the situation we are in with our Black and Pakistani speakers who were born in Manchester (or have been lived there since the age of 3) but do not necessarily have parents from the area. However, many more factors will need to be taken into consideration, alongside a larger speaker set, before we are able to address these questions.
In terms of socio-economic class, the effects are clear: the higher the social class, the lower the vowel. This is a monotonic effect across the five social classes. What is more interesting is the increasing difference between the two lexical sets as we move up the social scale, even with the exclusion of the split speakers, as shown in Figures 7 and 8 above. The distance between the foot class and the strut class is bigger for the middle and upper middle classes (designated in the graphs as 4 and 5, respectively) than for the lower working to lower middle classes (1–3), and the adjacent phonetic effects cannot explain all of the variation found here. More specifically, this difference between social classes cannot be accounted for by coarticulatory effects alone. For the first three socio-economic groups, this is stable, but jumps when we get to the upper middle classes in Table 4, with the strut vowel being considerably lower (higher F1). This effect is accounted for in an additional model which includes a three-way model interaction with both socio-economic class and vowel, but also age. This model is an improvement on the model in Table 4 (confirmed by likelihood ratio test) and can be found in Table A1 in the appendix.
Figure 13 visualises the extremes of this interaction by focussing on the lowest and highest socio-economic groups (split speakers included). In the left panel, we can see the lower working class speakers who have a small difference between foot–strut vowels in the expected direction and are stable across all ages. We have argued that this small difference, around 25 Hz here, is highly unlikely to map onto any phonemic distinction. We have also argued that the difference in the expected direction reflects the fact that strut words tend to have favouring environments for a higher F1 (lower vowel). This argument, however, cannot account for the fact that the highest social classes show a stronger effect than the lower ones, unless we are to believe they are somehow more susceptible to this coarticulation. However, Figure 13 shows that the youngest speakers in the upper middle classes actually show a pattern similar to the working classes. It seems to be older speakers that have a grasp of the distinction. This is reflected in the minimal-pair individuals plot in Figure 12, where three of the four younger upper middle class speakers (age 26 years and below) show no evidence of a distinction. This result is suggestive of age grading, meaning that middle class speakers may acquire the distinction as they age. The fact that younger upper middle class Mancunians do not have the distinction is, arguably, not surprising. The vast majority of Northerners are not aware of the foot–strut distinction growing up, and it is not salient to Northerners as being a Northern form. This is discussed by Trudgill (Reference Trudgill1986) and demonstrated by Evans & Iverson’s (Reference Evans and Iverson2004) perceptual judgement tasks from Northerners still living in the North. This is in contrast to the trap–bath distinction found in RP and the South, possibly the most overtly salient form Northerners would point to as being the difference between their speech and that of Southern British English speakers.
The lowest and highest socio-economic groups’ variation in foot vs. strut words across speakers’ age.

Perhaps paradoxically, though, or perhaps not, it is the strut vowel which some upwardly-mobile Northerners do move towards when moving to the South, or entering upwardly-mobile professions. As Trudgill (Reference Trudgill1986: 18) describes:

strut falls below the radar, in a way, as it is not a phonemic category for most in the first place. Most who do become aware of it, on some subconscious level or not, do so later in life, perhaps coming into contact with Southern speakers. This is unlike the Southern /ɑː/ vowel in bath, the same vowel which Northerners have in the palm lexical set. As Sankoff (Reference Sankoff and Fought2004) puts it, Northerners can acquire the phonetics of strut with no social cost. Perhaps it is the case that Northerners do not see strut as Southern, but as educated. Social judgement and matched guise tests are possible ways to confirm this.
It may just be, as Wells (Reference Wells1982: 353) says, interpreted as a ‘poshing-up’ of foot. We do not have any clear cases of hypercorrect foot in our sociolinguistic interviews, and as contended above, the sociolinguistic interview is not the ideal corpus to investigate this due to its target of the true vernacular. However, hypercorrect foot does occur in the speech of aspiring middle class Northerners, in our everyday experience, ones who actually have little contact with the South. This would be consistent with Evans & Iverson’s (Reference Evans and Iverson2004) findings that Northerners in the South have a perceptual category for strut but Northerners in the North do not. Evans & Iverson (Reference Evans and Iverson2007: 3815) express surprise that the Northerners in the North seem to have no awareness of a lower strut vowel, given the amount of exposure to RP and Standard Southern British English accents Northern speakers get from television. As discussed above, Labov (Reference Labov1994: 348) also asserts that mass media influence should not be dismissed for individuals wishing to acquire a foot–strut distinction later in life, and it is entirely possible that certain highly-motivated individuals may use the media as a template. However, Evans & Iverson’s (Reference Evans and Iverson2004, Reference Evans and Iverson2007) results indicate that something approximating a split cannot be achieved passively, and that speaker efforts will become more successful with greater exposure to the South and southern speakers.
Thus, it is not surprising that our younger upper middle class speakers are not aware of the distinction yet. It may only be as they get older, become more mobile, enter the workplace, or have more contact with Southern speakers at university that we might expect this distinction to start taking hold (see also Baranowski Reference Baranowski2017 on goat-fronting in Manchester, another feature led by the highest-status groups in the city, arguably brought in from the South). Given enough exposure to speakers with the split, the distinction is relatively simple to work out from the spelling (although there are numerous exceptions e.g. blood vs. good, but vs. put; see Chambers Reference Chambers1992: 700). The changing demographics of some areas of the city may change the point in time that younger people are exposed to the split in future. For example, some areas of Manchester, such as Chorlton-cum-Hardy, have seen a massive influx of Southerners since the move of the British Broadcasting Corporation (BBC) to Salford in 2012. This is an area ripe for investigation, from the effect of the southern children of BBC staff attending both private and comprehensive schools in the area to the effect on the middle classes throughout South Manchester.
An alternative explanation could be that older speakers are of a generation where RP was promoted in schools, and most certainly in the kinds of prestigious private schools attended by the upper middle classes. Teachers are no longer as strict in this respect, and it is unlikely that younger students would be persecuted for lacking a split today as their parents’ generation might have been. Even without a phonemic distinction, a suitably low strut variant may pass as acceptable. The only way to confirm this would be via a lifespan investigation, for which this variable would provide fruitful study. As discussed above, it seems possible that speakers are able to shift their gradient phonetics throughout their lifespan in a regular way, and reweight the frequency of occurrence of categorical variables. The evidence thus far seems to be against a speaker’s ability to acquire a phonemic split in adulthood. Thus, the point still remains as to whether these younger speakers will be able to acquire a true split in later life. This may be down to individual speaker motivation and something Northerners do to sound more educated.
As summarised in Section 2.3, Chiu & Evans’s (Reference Chiu and Evans2018) results from Northerners living in London demonstrate the overall argument perfectly. Upwardly mobile Northerners can do a very good job of mimicking a Southern foot–strut distinction, but when it comes down to it, if this phonemic distinction is not acquired at a young age, i.e. pre-adolescence, they can never truly look like the Southerners. They can ‘fake it’ fairly well, but they cannot reach the same grammatical representation as a true native, as the EEG results unveil. Such results, alongside the results from the present investigation, open the door for a series of studies on this variable in upwardly mobile speakers in the North. These could range from the sociolinguistic judgement of a lowered strut vowel, to perceptual tests of learning a phonemic distinction vs. learning a lowered vowel overall. Chiu & Evans (Reference Chiu and Evans2018) have already gone some of the way to looking at this, but crucially they investigate speakers living in the South. How motivated speakers still based in the North perform on such tasks, or upper middle class speakers returning from university, are areas ripe for future research.
4.5 Preliminary observations: Fronting and rounding
We have not discussed possible fronting, centralisation or rounding in the present investigation. In terms of rounding, some scholars have argued that [ʊ] is not the most accurate phonetic representation for present-day Northern speech, and that something unrounded approximating [ˠ] is more accurate. The variant found in Manchester certainly has some degree of rounding, but not as rounded and high as [ʊ] would suggest. Perhaps mid-back ![]() is the closest description to the Mancunian foot (see also Wells Reference Wells1982: 352) but this remains an open question for now. Certainly some areas of the country (e.g. areas in the Midlands) auditorily sound more rounded than areas such as Manchester. In terms of F2 (fronting or centralisation), preliminary results from our data show the same monotonic effect of centralisation across social class, with upper middle class speakers having considerably fronter vowels in comparison to the lower working class (around 120 Hz between the two extremes). These initial results show no significant interaction with vowel class, demonstrating that this is a centralisation effect across the board, rather than these higher social groups being more likely to show some kind of phonemic distinction in frontness. However, these comments are tentative, as they are based on preliminary inspection of the automatic measurements provided by FAVE; we have not investigated this in any detail at this stage.
is the closest description to the Mancunian foot (see also Wells Reference Wells1982: 352) but this remains an open question for now. Certainly some areas of the country (e.g. areas in the Midlands) auditorily sound more rounded than areas such as Manchester. In terms of F2 (fronting or centralisation), preliminary results from our data show the same monotonic effect of centralisation across social class, with upper middle class speakers having considerably fronter vowels in comparison to the lower working class (around 120 Hz between the two extremes). These initial results show no significant interaction with vowel class, demonstrating that this is a centralisation effect across the board, rather than these higher social groups being more likely to show some kind of phonemic distinction in frontness. However, these comments are tentative, as they are based on preliminary inspection of the automatic measurements provided by FAVE; we have not investigated this in any detail at this stage.
5 Conclusion
This investigation of the foot–strut vowel(s) in Manchester has demonstrated that the vast majority of speakers have no phonemic split between the two lexical sets, but that lower, more Southern-like, articulations of the vowel are found in the higher social classes. Speakers with a true phonemic distinction are in the minority (just eight of our 122 speakers) and are restricted to the middle and upper middle classes. Even for these speakers, there is evidence that not all words are assigned to the expected lexical set (recall that crux was pronounced with the foot vowel for one of our speakers who otherwise demonstrated a true split). However, the statistical models show a small but robust phonetic effect in the expected direction: foot vowels are consistently higher than strut vowels (lower F1) for all social classes. We have argued that this is down to combinatory coarticulatory effects of the surrounding segments, which are not fully accounted for in our model, and examples from frequency of co-occurrence in English are presented from the SUBTLEX corpus to support this argument. Our results are a potential warning to researchers attempting to diagnose the presence or absence of mergers by purely statistical means, as claims of lack of merger may be premature and due to unaccounted-for phonetic effects. Nevertheless, the upper middle classes show a larger effect of lexical set, which cannot be explained away by coarticulation. We suggest that this is due to age grading, as younger upper middle class speakers do not show the same phonetic differences in their vowel categories when compared to middle aged and older speakers. This result is consistent with upper middle class speakers being exposed to more Southern forms as they age, perhaps coming into contact with speakers from other areas of the country. If the strut vowel carries connotations of educated speech, rather than Southern speech, they can acquire this form without necessarily being aware of abandoning their Northern vowel. Of course, perceptual judgement tests would be needed to test this further. We have cast doubt on the ability of such speakers to truly acquire a phonemic contrast, although the dataset presented here cannot confirm or deny such a fact.
This study has illuminated various avenues for future research, from a phonetic, sociolinguistic and cognitive perspective. There are many questions we raise here for which we are unable to answer with our current corpus of sociolinguistic interviews. In terms of our own dataset, the results of this study are based purely on the acoustics correlates of vowel height and we highlight preliminary results for alternative acoustic measures.
Overall, we have argued that the phonetic conditioning of the foot–strut split is as complex synchronically as it was diachronically. The possibility that vowel class remains significant should perhaps not be entirely surprising after all, as it is the best summary of the forces behind the historical split: it encapsulates the various phonetic effects responsible for the change.
APPENDIX Statistical models including interaction terms
Model building on Table 4 with additional interaction of age*sex*class.
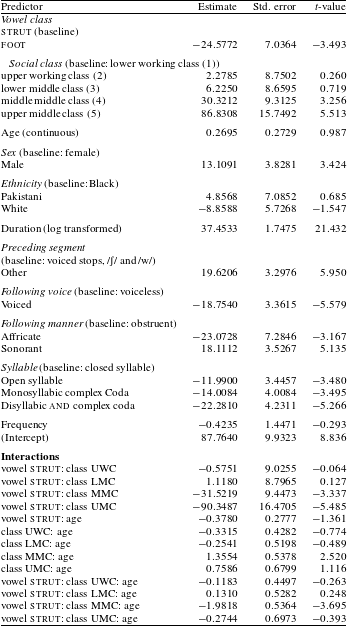
Final model including speakers with the split but without significant interaction terms of age*class*vowel.
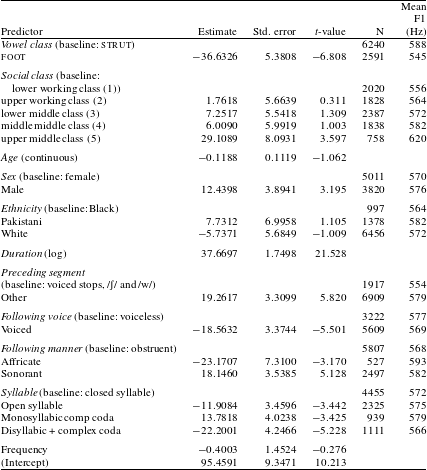


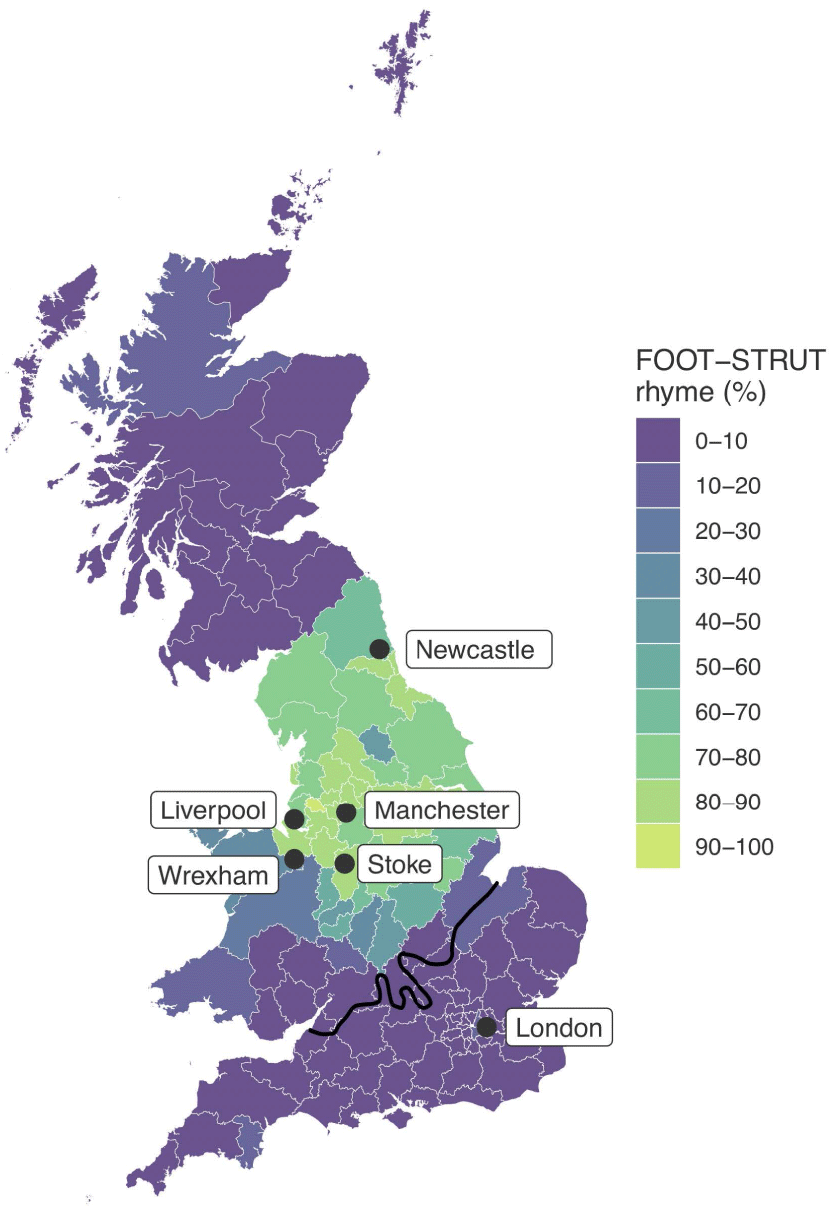


 Open access