


The development of fish farming to meet the requirements of the aquatic product market(1) is strongly impacted by the decreasing availability of marine ingredients(Reference Tacon and Metian2). The design of new fish feeds based on sources other than fisheries is, thus, crucial to ensure that aquaculture production will increase while sustaining breeding performances, product quality, low impacts on the environment and the acceptability of such production(3).
The incorporation of significant quantities of ingredients of plant origin as a replacement for fishmeal (FM) and fish oil (FO) into the feed of high-trophic-level fish, such as salmonids and marine fish, has progressed rapidly. Albeit the growth performances are still not satisfying enough, salmonids can now be raised experimentally without the need for marine ingredients(Reference Panserat, Hortopan and Plagnes-Juan4) and using only plant-based ingredients; this is already being practised for low-trophic-level fish, such as cyprinids, cichlids and silurids(3). Investigations into the long-term effects of plant (P)-based diets have already begun,(Reference De Francesco, Parisi and Médale5,Reference Lazzarotto, Corraze and Leprevost6) and even if the growth of fish fed the P-based diet was markedly reduced, such investigations appear to be a promising way to assess the potential adaptation of fish nutrition and metabolism to these diets.
Nutritional limits for the total substitution of FM and FO in marine fish require that minimal quantities of ingredients of marine origin be maintained, essentially to cover the specific need of long-chain fatty acids (FAs) of the n-3 series(Reference Geay, Ferraresso and Zambonino-Infante7,Reference Le Boucher, Vandeputte and Dupont-Nivet8) . This is not the case in salmonids, although limitations to the adaptation of the fish to plant-based ingredients are also observed at different levels, i.e. ingestion, digestion and metabolism. Replacing marine oil with a mixture of vegetable oils has been shown to have no deleterious effect on salmonids, whether on their growth performance or on product quality, except an alteration of their nutritional quality. The FA composition of lipids in the edible part of fish is generally adjusted to that of the diet, meaning a lower content of long-chain poly-unsaturated FA, namely EPA and DHA, as well as a lower n-3/n-6 FA ratio(Reference Nasopoulou and Zabetakis9).
The replacement of marine protein sources by plant-based proteins can be easily managed(Reference Hardy10), although the supply of essential amino acids for protein metabolism must be fine-tuned(Reference Yamamoto, Unuma and Akiyama11,Reference Larsen, Dalsgaard and Pedersen12) . Plant-based proteins are supplemented with crystalline amino acids to reach an amino acid composition close to that of FM. We know, however, that the amino acid stability, bioavailability and the uptake of supplemented crystalline amino acid are different from those of intact protein(Reference Schuhmacher, Wax and Gropp13,Reference Ambardekar, Reigh and Williams14) . Furthermore, due to the limited potential for carbohydrate utilisation in fish(3), proteins are also preferentially used to supply energy substrates for priority metabolic pathways in fish(Reference Jia, Li and Zheng15) compared with non-carnivorous mammals and birds. Thus, the development of alternative fish feeds has to ensure the adequate supply of amino acids both for energy metabolism and for protein synthesis.
The metabolic pathways of essential nutrients have thoroughly been characterised in main farmed fish species in order to assess their food requirements(3). However, metabolic pathways are often studied separately – energy v. nutrient metabolism or protein v. lipid metabolism – and an integrated analysis of these different metabolic pathways is rarely conducted(Reference Bar and Radde16). Furthermore, there is a growing interest in a non-targeted metabolism analysis to decipher the main drivers of fish metabolism and the potential interconnection between pathways under non-limiting farming conditions(Reference Panserat and Overturf17). Significant progress on the impact of P-based diets on nutrition and metabolism has been achieved by using various targeted and non-targeted omic approaches such as transcriptomics and proteomics(Reference Panserat, Hortopan and Plagnes-Juan4,Reference Geay, Ferraresso and Zambonino-Infante7,Reference Le Boucher, Vandeputte and Dupont-Nivet8,Reference Veron, Panserat and Le Boucher18) . Metabolomics is a complementary genomic approach used in human, livestock and bird nutrition(Reference Zduńczyk and Pareek19–Reference Claus and Swann21). This approach has begun to be used in fish to characterise product quality(Reference Gribbestad, Aursand and Martinez22,Reference Mannina, Sobolev and Capitani23) , and it is now widely used to assess the overall metabolic imprint of various environmental stresses such as hypoxia or environmental contaminants(Reference Dove, Leisen and Zhou24,Reference Lardon, Nilsson and Stecyk25) . Metabolomics has recently begun to be used in fish nutrition to analyse the effects of feeding(Reference Kullgren, Samuelsson and Larsson26,Reference Gil-Solsona, Nácher-Mestr and Lacalle-Bergeron27) , the impact of a wild v. a natural diet(Reference Mannina, Sobolev and Capitani23) and the effects of feed ingredients(Reference Picone, Balling and Savorani28–Reference Egea, Toledo-Guedes and Sanchez-Jerez32), and more recently, to evaluate the development of new diets(Reference Schock, Newton and Brenkert33–Reference Wei, Liang and Mai36). The two main metabolomic approaches are proton nuclear magnetic resonance (1H-NMR) and mass spectrometry, each having their own advantages and technical limitations(Reference Roques, Deborde and Richard37). NMR is not sensitive and selective with only a few dozens of metabolites detected and identified requiring a significant sample size. NMR is nevertheless preferentially used in fish nutrition due to minimal sample preparation, easy metabolite identification and good reproducibility(Reference Roques, Deborde and Richard37). On the other hand, MS permits the detection and identification of thousands of metabolites, but the interpretation of profiles with numerous biochemical compounds is not easy. Thus, this approach is instead used to target specific compounds and to identify biomarkers of nutrition impairment(Reference Gil-Solsona, Nácher-Mestr and Lacalle-Bergeron27). The simultaneous analysis of metabolites involved in various metabolic pathways has begun to identify some of the underlying mechanisms related to changes in metabolism following a dietary manipulation of the fish(Reference Schock, Newton and Brenkert33,Reference Kullgren, Jutfelt and Fontanillas34) . Thus, this powerful and integrative tool can helpfully be implemented to characterise the impact of P-based diets on metabolism. However, there needs to be a focus more on the fish metabolome that could account for the long-term adaptation of metabolism(Reference Roques, Deborde and Richard37,Reference Roques, Debordes and Richard38) than on food metabolome.
Finally, limiting factors of plant ingredient quality remain in field conditions related to an imbalance in key nutrients, the stability of feedstuffs, numerous anti-nutritional factors(Reference Urán, Schrama and Jaafari39) and specific contaminants, which could all induce digestion disorders(Reference Borey, Panserat and Surget40) and impaired metabolism(Reference Veron, Panserat and Le Boucher18). To overcome these difficulties will require significant progress in feed formulation and the further characterisation of feed. Analyses of ingredients and feeds are still based on proximal composition to assess their nutritive value, and, thus, the metabolomic approach, through a more detailed and comprehensive molecular analysis, could offer new perspectives for the development of alternative feeds.
The present study uses 1H-NMR metabolomics to characterise differences in rainbow trout metabolism fed a P-based diet from the first feeding up to commercial size and that of those fed a marine FM–FO diet (M) and a commercial-like diet (C). Integrative 1H-NMR metabolomics was implemented to further characterise the diet and to assess a metabolic response at the level of fish plasma, and liver and muscle tissues. The effect on lipid metabolism has already been characterised(Reference Lazzaroto, Médale and Larroquet41), and this study focuses on the protein and energy metabolism through the characterisation of the metabolome in the polar extract of tissues.
Materials and methods
Source of fish
The fish used in this experiment came from a study supported by the FP7 programme of the European ARRAINA project (Advanced Research Initiatives for Nutrition and Aquaculture) (N_288925). The aim was to study the long-term effects of diets free of FM and FO from the first feeding onwards(Reference Lazzarotto, Corraze and Leprevost6,Reference Lazzaroto, Médale and Larroquet41) . Rainbow trout was produced at the INRAE experimental fish hatchery of Lées Athas (Pyrénées-Atlantiques, France). At the stage of yolk-sac larvae, the rainbow trout fry was separated randomly into twelve groups and fed three experimental diets in quadriplicate for each diet. The fish were reared from 0.14 g body weight (BW) during 7 months in 50 l tank (310 fish per tank) in the same experimental farm with a natural photoperiod and a constant water temperature of 7 ± 1°C. At an average body weight of 12⋅5 g, the fish were then transferred to the INRAE experimental fish farm in Donzacq, Landes, France. Fish within each dietary group were split randomly into three groups (nine groups in total) and fed with the three experimental diets. They were reared in 200 l tanks (150 fish per tank maximum stocking densities: 26 kg/m3), with a natural photoperiod and a constant water temperature of 17 ± 1°C, for another 8 months until final sampling.
Diet and experiment design
The experiment was carried out in strict accordance with the EU legal framework relating to the protection of animals used for scientific purposes (Directive 2010/63/EU) and according to the National Guidelines for Animal Care of the French Ministry of Research (Decree No. 2001-464, 29 May 2001). It was approved by the INRAE ethics committee (INRA 2002-36, 14 April 2002). The INRAE experimental facility is certified for animal services under Permit No. A40 2281 by French veterinary services – the competent authority – while the scientist in charge of the experimentation received training and a personal authorisation (No. B64 10 003).
Fish were fed from the first feeding up to 15 months with one of three diets: two experimental diets i.e. a marine (M) and a P-based diet formulated by UMR NuMeA (France) and manufactured at the INRAE experimental facility (Donzacq, Landes, France), and a control C diet from ‘the Cooperative Le Gouessant’ (Lamballe, Côte d'Armor, France). Each treatment was tested in triplicate.
The ingredients and compositions of the diets are presented in Table 1 and Supplementary Table S1 of Supplementary material. The M diet was composed mainly of FM (co-fishery products – all species) and FO (co-fishery products – sardines). The P-based diet was composed exclusively of plant ingredients, i.e. plant protein sources supplemented with lysine and methionine to cover the requirement of these essential amino acids, and a blend of vegetable oils (50 % rapeseed oil, 30 % linseed oil and 20 % palm oil) which aimed at providing an overall amount of FA classes similar to those of FO. The C diet contained a mixture of FM, FO and plant ingredients, with 45 % of FM and 50 % of FO replaced by plant ingredients. All diets were isoproteic, isolipidic and isoenergetic (Table 2).
Crude diet composition (g/kg)

a FM origin co-fishery products – all species.
b FO origin co-fishery products – sardine.
c Mix attractant: glucosamine 5 g/kg; taurine 3 g/kg; betaine 3 g/kg; glycine 2 g/kg; alanine 2 g/kg.
d Mineral premix and vitamin premix compositions are given in Supplementary Table S1 of Supplementary material.
Chemical composition of the diet

FW, fresh weight; DM, dry matter
The fish were fed ad libitum throughout the experiment continuously during the early stages, and then manually fed three, then two, meals per day. Diet characteristics were maintained during the experiment, except for pellet size, which was adjusted according to the stage of the fish. The experimental diets were sampled to analyse their chemical composition during each pellet preparation. Once the pellets reached their final size (6 mm in diameter), the diets were also sampled at 0, 2 and 4 weeks in order to assess the compositional stability of the diet. Samples were stored at −20°C until extraction and analysis by 1H-NMR.
Fish sampling
At the end of the experiment, the fish were starved for 1 day and then fed one meal of the corresponding experimental diet. At 6 and 48 h after the meal, fifteen fish per treatment were randomly sampled (five fish per triplicate group). The fish were first sedated by immersion in a 2 % benzocaine solution, measured and weighed. Blood samples were taken from the caudal vein of each fish by means of a heparinised syringe and centrifuged in a microtube containing 20 μl of heparin solution (1 mg/ml) at 2400 g for 10 min, while the plasma was collected and frozen in liquid nitrogen. Then the fish were killed by sectioning the spinal cord. The fish were then dissected to weight the liver and the visceral mass. The liver was washed in cold saline solution and then dried on wrapped paper. A sample of the dorsal white muscle was taken after removal of the skin and the superficial red muscle. The liver and the muscle tissues were directly frozen in liquid nitrogen. Plasma and tissues were then stored at −80°C until analysis.
Sample preparation
The diet samples were treated according to a protocol usually applied to plant samples(Reference Moing, Maucourt and Renaud42). Four replicates of each sampling date, at 0, 2 and 4 weeks after the last formulation of the diets, were ground in liquid nitrogen and then freeze-dried. An ethanolic extraction was performed for each diet at each stage of sampling (in quadruplicate) by successive extraction with ethanol–water 80:20, 50:50 and 0:100 (% v/v). Fifty milligrams of the diet were mixed in 2 ml of solvent and then left for 15 min at 80°C before being centrifuged (30 000 g, 10 min, 4°C). The resulting supernatants were collected, combined and resubmitted to centrifugation (30 000 g, 10 min). The supernatant was then freeze-dried (Savant SC210A SpeedVac, Milford, CT, USA) and lyophilised. The extract was dissolved in 500 μl of deuterated phosphate buffer solution (200 mm, apparent pH 7⋅4), and the pH was adjusted to an apparent pH of 7⋅40 ± 0⋅02 when necessary with deuterated KOD deuterated analog of KOH 0⋅1 M or DCL deuterated analog of HCL 0⋅1 M solutions, by means of BTpH (Bruker BioSpin GmbH, Rheinstetten, Germany), before being lyophilised once more. For the 1H-NMR analysis, the hydro-alcoholic extract was dissolved in 500 μl of deuterated water (D2O) with 5 μl of sodium trimethylsilyl [2,2,3,3-d 4] propionate (TSP; 0⋅5 mm final concentration for chemical shift calibration), homogenised and centrifuged (14 000 g, 5 min; Centrifuge A14, Jouan, France), and the supernatant was transferred to a 5-mm NMR tube (507-PP-7, Wilmad, Buena Vista Township, NJ, USA) for direct analysis.
Each trout plasma sample was incubated on ice for 2 h to complete thawing. Immediately before analysis, 300 μl of plasma were mixed with 300 μl of D2O and then transferred to a 5-mm NMR tube for direct 1H-NMR analysis.
The liver (approximately 2 g, exactly weighed) and muscle frozen tissue samples (approximately 2 g, exactly weighed) were treated using a classical extraction by dichloromethane–methanol (2:1, v/v), containing 0⋅01 % of butylated hydroxytoluene as antioxidant, according to Folch et al. (Reference Folch, Lees and Sloane-Stanley43). The polar phase, containing water–methanol-soluble compounds, and the non-polar phase, containing lipid-soluble compounds, were separated and stored at −80°C before preparation for 1H-NMR analysis. A calculated volume of polar extracts was sampled according to the initial weight of the liver or muscle samples used for extraction and then freeze-dried (Savant SC210A SpeedVac, Milford, CT, USA). The dried extract was dissolved in 140 μl of deuterated phosphate buffer solution (200 mm, apparent pH 7⋅4), 460 μl of D2O and 5 μl of 5 mm TSP solution. After homogenisation and centrifugation (14 000 g, 5 min; Centrifuge A14, Jouan, France), the supernatant was transferred to a 5-mm tube for 1H-NMR analysis.
Plasma metabolite assay kit analysis
Plasma glucose (Glucose RTU; BioMérieux, Marcy-l'Etoile, France), lactate (Lactate-PAP; BioMérieux, Marcy-l'Etoile, France) and cholesterol (CHOL100; Sobioda, Montbonnot, France) concentrations were determined by enzymatic analysis using commercial kits adapted to a micro-plate format, according to manufacturer recommendations.
Growth and tissue parameter calculations
The condition factor was calculated using the BW (g)/body length (mm)3 formula. Somatic indices were also calculated: the hepatosomatic index (HSI) was calculated using liver weight (g)/BW (g) %, and the viscerosomatic index (VSI) was calculated using digestive tract weight (g)/BW (g) %.
1H-NMR spectra acquisition and processing
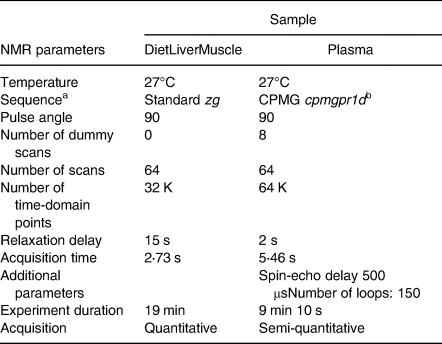
1H-NMR analyses were performed on a 500-MHz Avance III spectrometer (Bruker, Wissembourg, France) fitted with an ATMA BBI 5-mm Bruker probe at 300 K flushed with nitrogen and a BACS120 autosampler. Acquisition parameters were adapted from Kullgreen et al. (Reference Kullgren, Samuelsson and Larsson26) and Gatesoupe et al. (Reference Gatesoupe, Fauconneau and Deborde44) using a Carr-Purcell-Meiboom-Gill CPMG – relaxation editing pulse sequence with presaturation (cpmgpr) for plasma – and from Moing et al. (Reference Moing, Maucourt and Renaud42) using a quantitative single pulse sequence (zg) for tissue extracts. The acquisition conditions of plasma and extracts (diet, liver and muscle) are summarised in Table 3. To optimise NMR acquisitions, automated tuning and matching, locking, shimming (TopShim) and 90° hard pulse calibration (pulsecal) were performed for each sample. A Fourier transformation was applied to the signal after zero-filling (64k) for extracts and apodization (LB 0⋅3 Hz) for extract and plasma spectra. The resulting spectra were manually phased with TopSpin (v. 3⋅0, Bruker).
1H-NMR analytical protocols
a Bruker denomination.
b Presaturation of water signal.
For plasma, diet and tissue extracts, chemical shift calibration, baseline correction, peak realignment, non-uniform bucketing and signal-to-noise ratio were determined using the NMRProcFlow web tool (www.nmrprocflow.org)(Reference Jacob, Deborde and Lefebvre45). Each spectral region of interest was determined manually, using either the intelligent bucketing module or the variable size bucketing module of the NMRProcFlow for each dataset. For plasma spectra, this was performed within the 8⋅7–0⋅1 ppm region, and 212 spectral regions were determined for the initial analysis of time after-feeding effect, and then 398 spectral regions were determined for the analysis of the diet effect at each time after feeding, excluding the residual signals of water, lipids and lipoprotein resonances. The spectral regions were named according to the following example: B5_1811 for a spectral region centred on 5⋅1811 ppm. Total sum normalization was applied to minimise minor differences due to the total plasma metabolite concentration and/or variation in acquisition conditions among samples. The determination of spectral regions for tissue extract 1H-NMR spectra was also performed as described above in diet (n 74), in liver tissue (n 252) and in muscle tissue (n 268) using the NMRProcFlow with the exclusion of the residual water area. The data were then standardised and normalised to the total intensity of the spectra.
Compounds were identified by comparing the spectra of individual compounds – analysed under the same conditions of preparation (solvent and/or pH) – to those available in the home database, the NMR HMDB (www.hmdb.ca), BMRB (http://www.bmrb.wisc.edu/metabolomics/) and Chenomx (Chenomx Metabolite Reference Libraries, www.chenomx.com) databases, and based on data from the literature(Reference Dove, Leisen and Zhou24,Reference Kullgren, Samuelsson and Larsson26) and their annotation status according to MSI Metabolomic Standards Initiative (Reference Sumner, Amberg and Barrett46). For a selection of metabolites, identification was confirmed by spiking commercially available reference compounds on representative samples and by the acquisition of 2D 1H-NMR spectra on a selection of samples. Patterns of resonance that could not be identified were named according to the following example: unkDD6.15, meaning the unknown doublet of a doublet pattern of resonances centred on 6⋅15 ppm.
For the diet 1H-NMR spectra, resonance groups were selected and integrated using the NMRProcFlow(Reference Jacob, Deborde and Lefebvre45), then the absolute concentration of each compound was calculated using the electronic reference (TopSpin ERETIC2 module), and the calibration of signals with glucose (2⋅5–100 mm) and glutamate (2⋅5–30 mm) standard curves. The concentration in mol/l was then converted to g/l and transformed into a content by dividing it by the amount of lyophilised powder used for extraction. The content of each organic or amino acid was expressed as g of the acid form per weight unit. The content of NMR unknown compounds was calculated, hypothesising that the observed resonance corresponded to one proton and using an arbitrary molecular weight of 100 Da.
Data reduction and statistical analyses of spectra
The size of fish sampling (n 15) was selected to permit a potential 20 % dropout for fish outliers (maturing male) or for abnormal spectral distribution (liver and muscle). The resulting sample size (n 11 per treatment) is sufficient to detect a minimum 20 % difference between diets with a 95 % confidence for NMR variables. Statistical analyses were performed using BioStatFlow (v. 2⋅8, www.biostatflow.org). Multivariate principal component analyses (PCAs) were performed on normalised data to visualise the discrimination between treatments and diets and to identify the compounds or spectral regions related to the discrimination. Supervised analysis such as ANOVA were performed on raw data to assess the significance of the differences observed between diets and, when relevant, MANOVA to assess the combined effect of other factors (a duration of storage for diet and time after feeding for plasma), as well as their interactions. A statistical threshold level of 5 % was retained. Data are presented as mean values with their standard deviation.
Results
Fish characteristics
The BW and the body length of fish fed a P-based diet were significantly lower than those of fish fed a M diet and a C diet (Table 4), but the condition factor was not significantly different between the diets (data not shown). The relative weight of the liver (HSI) was significantly higher in fish fed the M diet than in those fed the P-based diet and the C diet. The gut relative weight (VSI) was significantly higher in fish fed the C diet than in those fed the two other diets.
Characteristics of rainbow trout fed three different diets from the first feeding: marine M, plant-based P and commercial C diets (mean (SD) n 30)

This is the whole set of experimental fish sampled at 6 and 48 h after the meal.
ANOVA on diet effect: ***P < 0⋅001; **P < 0⋅01; *P < 0⋅05). Data with different letters are significantly different (Student's t test).
Contrasted 1H-NMR quantitative profiling of diets
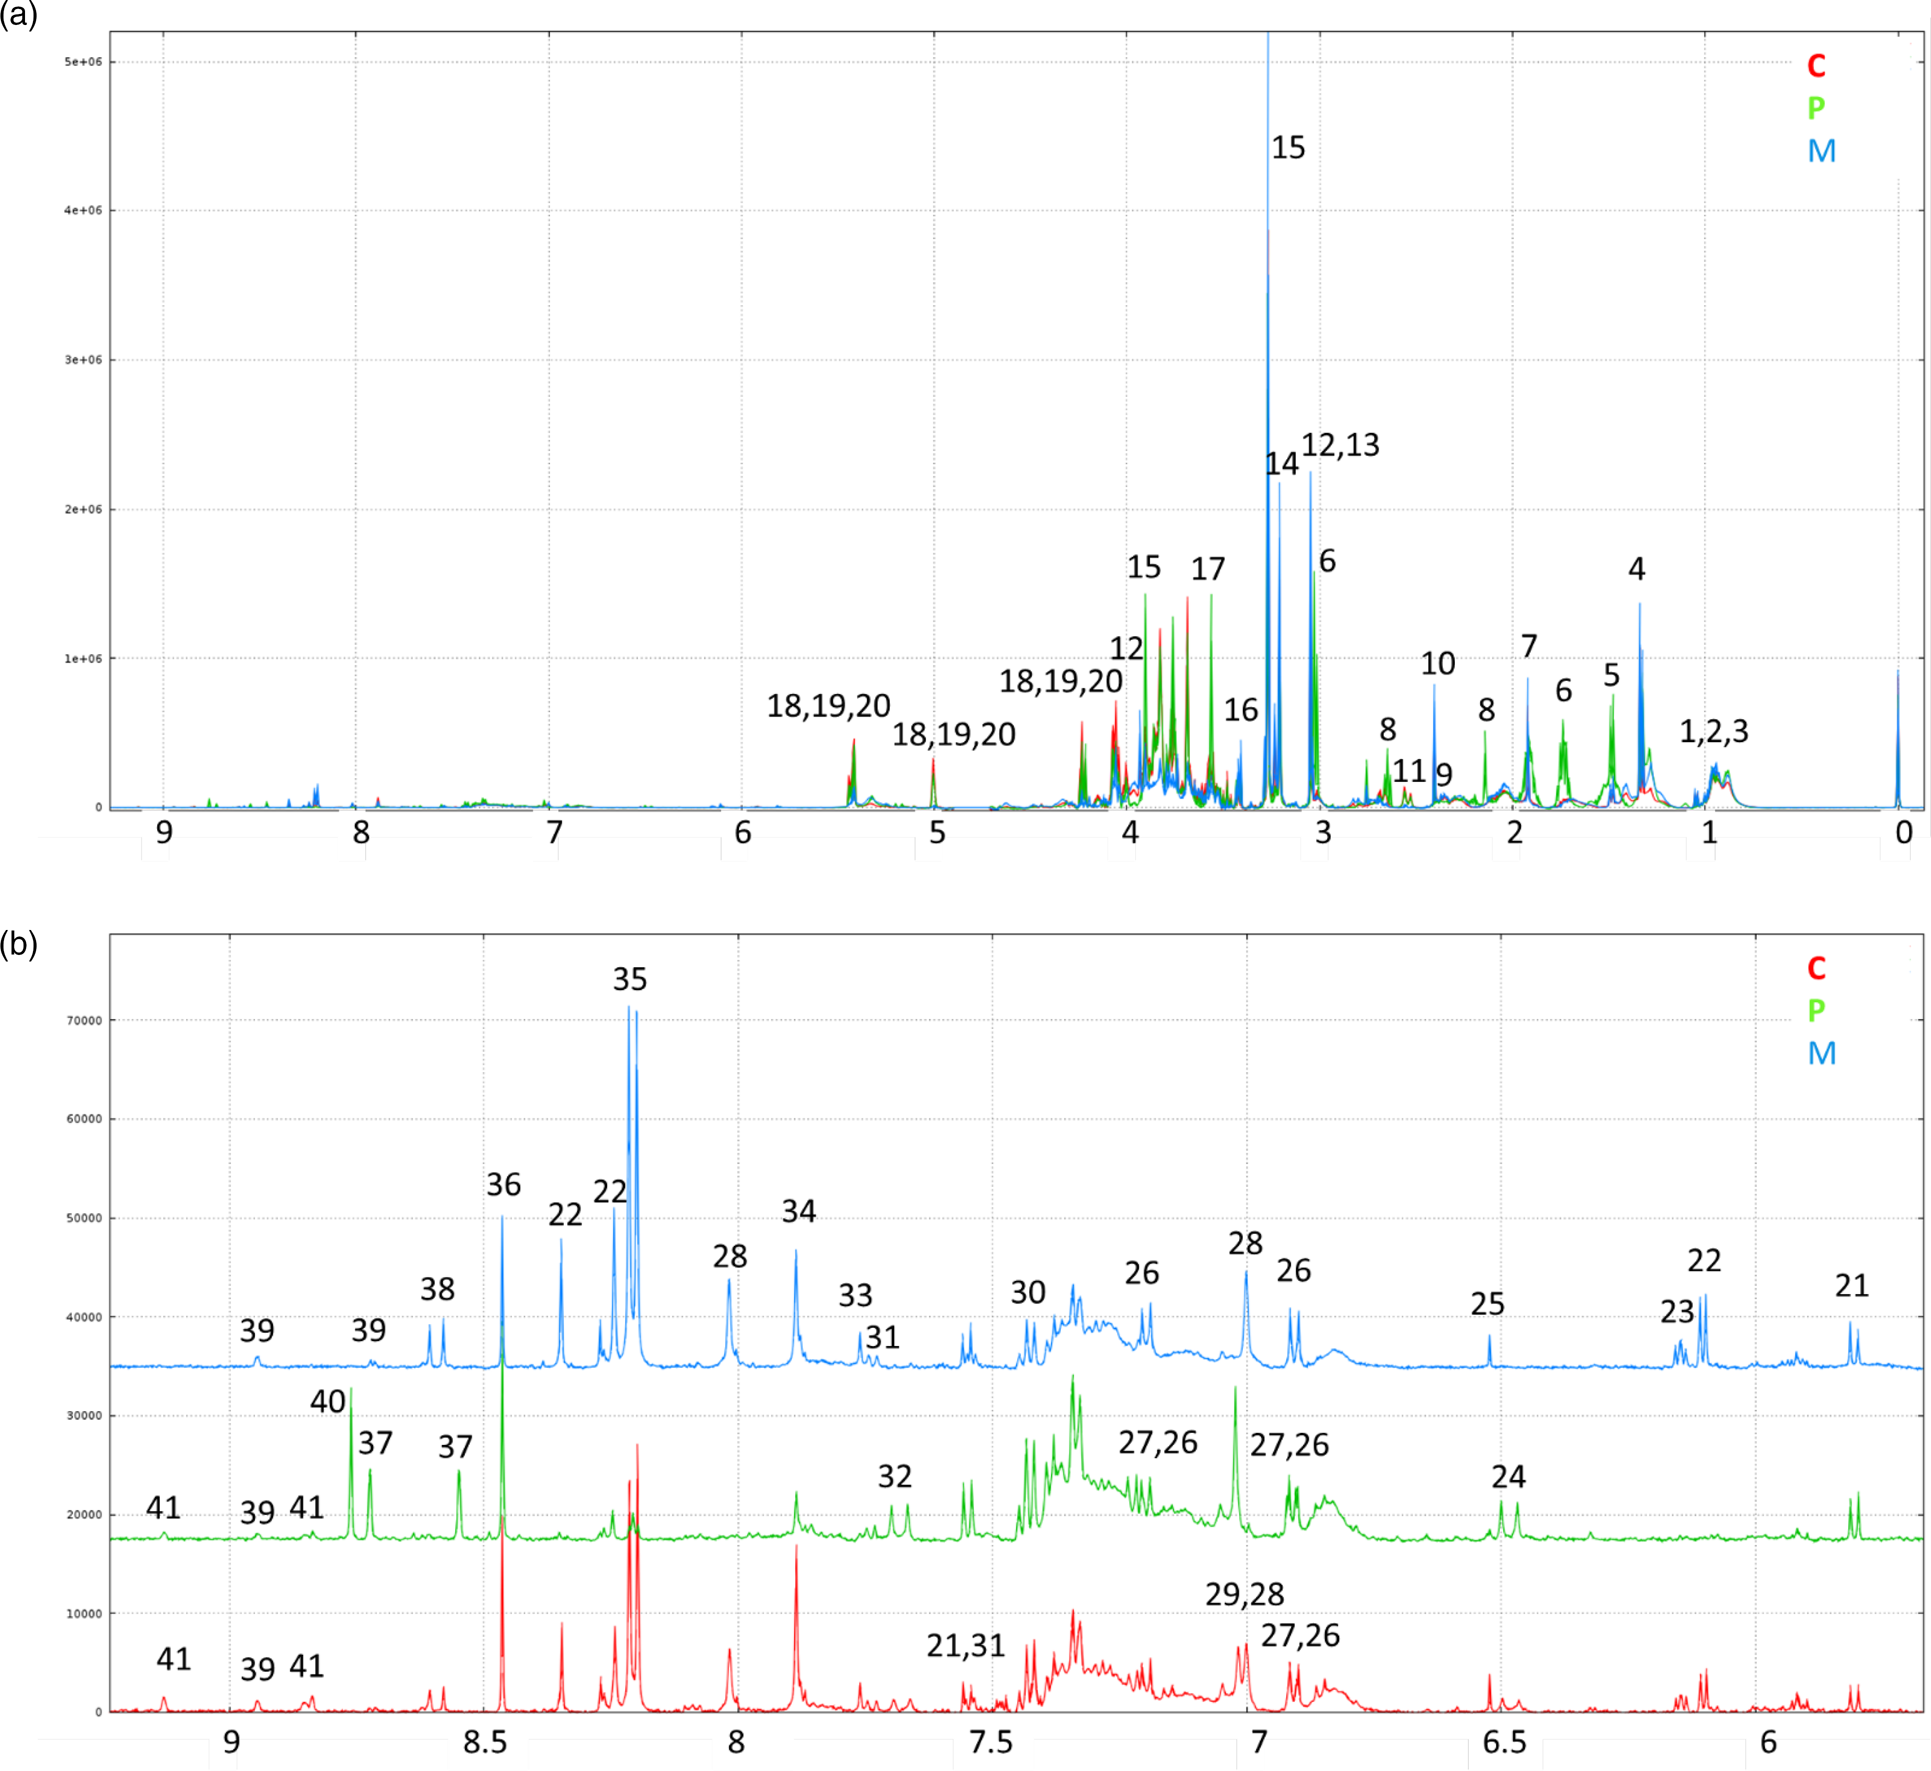
1H-NMR spectra annotations of water–ethanol diet extracts made it possible to identify thirty-six soluble compounds (Fig. 1; Table 5) comprising amino acids and derivatives, sugars, organic acids, nucleosides, alkaloids and vitamin precursors. Thirty-one patterns of resonances remain unknown (Supplementary Table S2 of Supplementary material).
(a) Representative 500 MHz 1D 1H-NMR spectra of ethanolic extracts of C, P-based and M diets and (b) representative expanded spectra of the (δ 9⋅2–5⋅7 ppm) range. Legend: 1 LEU; 2 ILEU; 3 VAL; 4: lactate; 5 ALA; 6 LYS; 7 acetate; 8 MET; 9 GLU; 10 succinate; 11 citrate; 12 creatine; 13 unkS3.04; 14 choline; 15 betaine; 16: taurine; 17 GLY; 18: sucrose; 19: stachyose; 20: raffinose; 21: uracil; 22 adenosine; 23 unkDD6.15; 24 unkD6.48; 25 fumarate; 26: TYR; 27 tyramine; 28 anserine; 29 HIS; 30 PHE; 31 TRP; 32 unk D7.68; 33 unkS7.76; 34 xanthine; 35 hypoxanthine; 36 formate; 37 pterin; 38 unkD8.59; 39 niacinamide; 40 biopterin; 41 trigonelline (see Table 5).
Cumulative list of annotated compounds in the 1H-NMR spectra of hydro-alcoholic extracts of the three diet pellets

s, singlet; d, doublet; dd, doublet of doublets; t, triplet; q, quadruplet; m, multiplet (not solved). MSI status from Sumner et al. (Reference Borey, Panserat and Surget40): 1 refers to an identified compound; 2 refers to a putatively annotated compound.
The 1H-NMR profiles differed based on the diets. Some signals related to alanine, lysine, methionine, betaine, glycine, sucrose and stachyose were more specific to the P-based diet. In the 6–9 ppm range, signals corresponding to anserine, adenosine, xanthine and hypoxanthine were more specific to the M diet and the C diet. The signals corresponding to pterin and biopterin were very specific to the P-based diet.
The PCA, performed on the main identified and unknown compound contents determined by 1H-NMR, demonstrated a clear discrimination between the three diets on the first two PCs (89 % of the total variability; Fig. 2). The main PC1 differences (69 % of total variability) were related to the M and P-based diets, C showing intermediate results, and secondary differences were observed on PC2 (20 % of the total variability) between the P and M diets, on the one hand, and the C diet, on the other hand. Differences due to diet storage for 2 weeks or 1 month were relatively low and non-significant, although such differences related to the PC2 axis seemed to be higher in the C and the P-based diets than in the M diet.
PCA on compound contents determined by 1H-NMR spectra of polar extracts of experimental diets. Scores of the three diets, M, C and P-based, sampled at 0 (circle), 2 weeks (triangle) and 1 month (square) after the last formulation.

The main identified compounds (Table 6) as well as unknown compounds (Supplementary Table S2 of Supplementary material) were quantified with putative 100 g/mol for unknown compounds. Sugars –stachyose and sucrose – were present at a very high content (>9⋅8 g/kg of dry matter (DM) and >4⋅6 g/kg DM, respectively, in the P and C diets compared with the M diet approximately 1 g/kg DM), as well as lysine (>10 g/kg DM in the P-based diet). Other compounds were also present at a high content (>1 g/kg DM): choline, taurine and lactate in all three diets; anserine, creatine, glutamate, alanine and hypoxanthine in the M diet; and alanine, glycine, lysine, methionine and betaine in the P-based diet. Some compounds, such as raffinose, were detected only in the M diet at a relatively high content of >1 g/kg DM. On the contrary, two other compounds – pterin and biopterin – were detected only in the P-based diet at a low content.
Compound contents (μg/g DM) in diet polar extracts

The number 0 is not detectable (mean (sd); n 12).
ANOVA significance of diet effect: ***P < 0⋅001; **P < 0⋅01; *P < 0⋅05.
The differences between the M and the P-based diets were highly significant (P < 0⋅001) for most of the compound content, except for tryptophan (Table 6). The content of creatine, anserine, adenosine, xanthine, hypoxanthine, niacinamide and various unknown compounds (unkS2.74, unkS3.03, unkS3.23, unkS7.76, unkS7.87 and unkS8.59; Supplementary Table S2 of Supplementary material) was significantly higher in both the M diet and the C diet than in the P-based diet, whereas the content of histidine and various unknown compounds (unkS2.86, unkD5.17, unkD5.20, unkD6.48; unkD7.15 and unkD7.68) was significantly higher in both the P-based and the C diets than in the M diet. The C diet generally showed intermediate results between the M and the P-based diets, except for the content of stachyose, sucrose, choline, xanthine and several unknown compounds (unkS5.89, unkS5.91, unkS5.93, unkS5.92, unkD7.15and unkS7.86), which was lower in the C diet than in the other two diets.
Lysine and methionine were added to the P-based diet to compensate for the imbalanced amino acid composition of plant-based proteins. The ratio between the contents of compounds measured by 1H-NMR in the diet and the content in the diet was calculated. The ratios were, respectively, of 0⋅73 and 0⋅68 for lysine and methionine. Other compounds were added to the P-based diet as a mix attractant. Only four of these compounds – taurine, betaine, glycine and alanine – were detected and quantified with a recovery ratio of 0⋅96, 0⋅72, 0⋅75 and 1⋅32, respectively.
Significant differences in a classical set of circulating metabolites in plasma
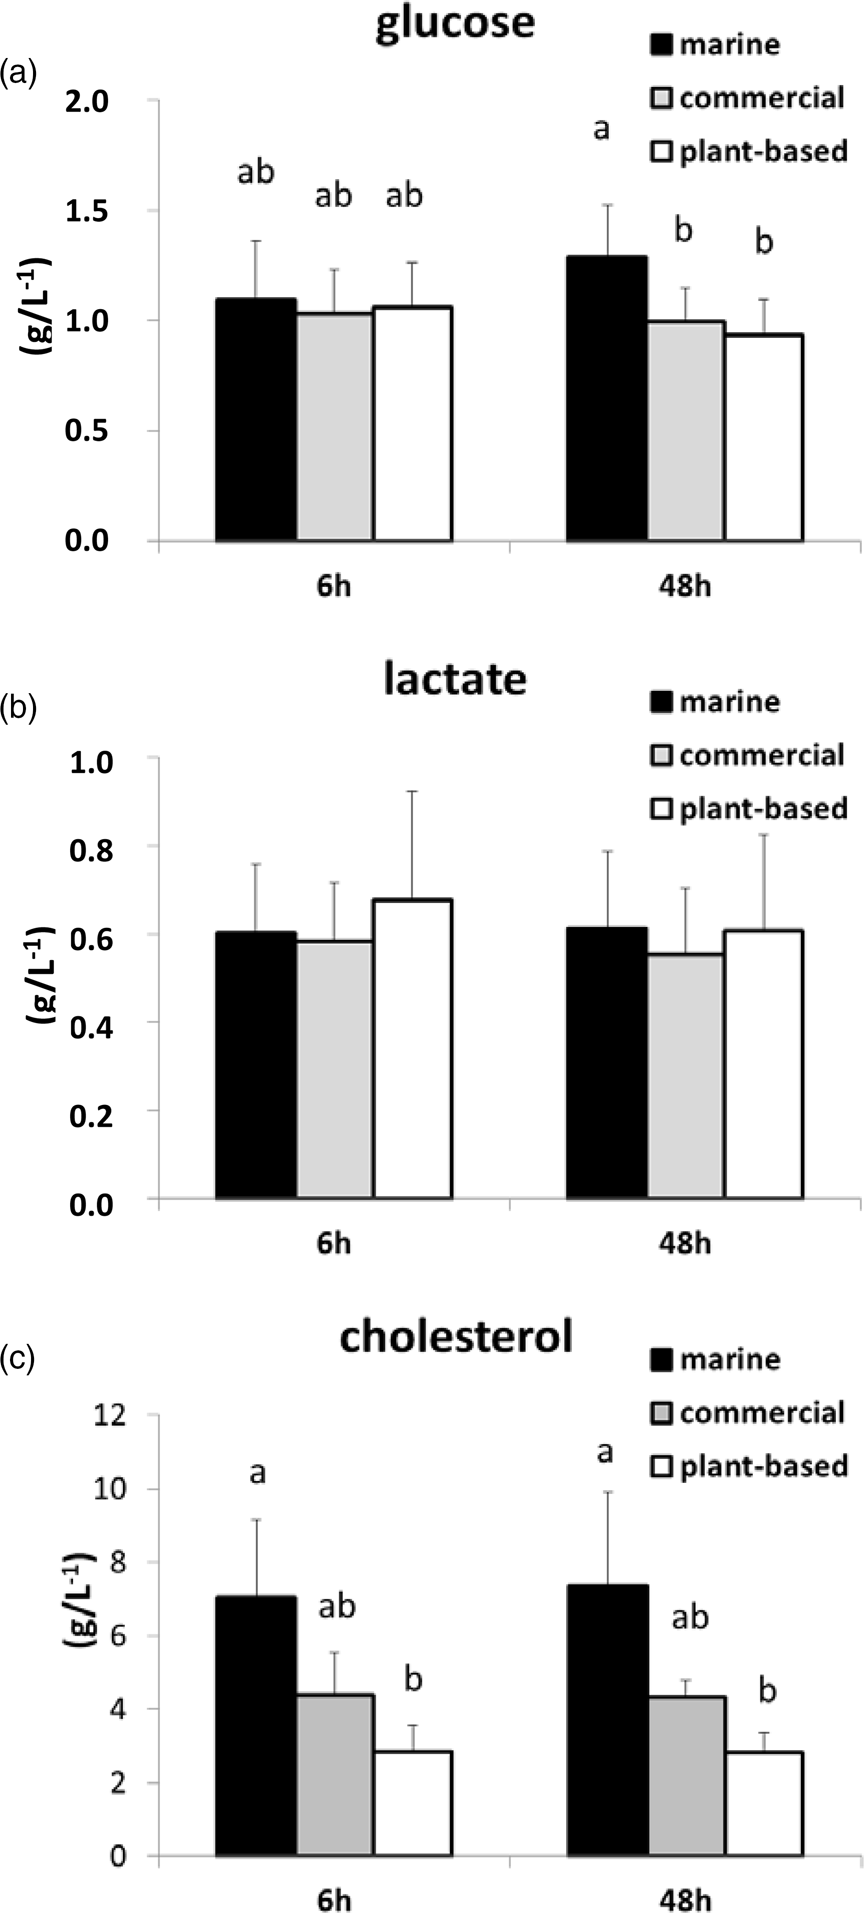
Glucose, lactate and cholesterol concentrations in plasma were not significantly different between 6 and 48 h after feeding. Glucose concentrations were significantly higher in the M diet than in the P-based diet and the C diet (Fig. 3) at 48 h after feeding, whereas the concentration of cholesterol in the M diet was significantly higher than that in the P-based diet at both 6 and 48 h after feeding. Lactate concentration was not significantly different between diets.
Concentration (g/l) determined by assay kits of selected metabolites (a) glucose, (b) lactate and (c) cholesterol in plasma at 6 and 48 h after feeding in rainbow trout fed either a M diet, a P-based diet or a C diet. Mean and standard deviation: n 15. Data affected by different letters were significantly different (two factors: MANOVA analysis and Student's t test; P < 0⋅05 for pairwise comparison), knowing that the time effect and the interaction with diet effect were not significant.
1H-NMR profiling of plasma relevant to both post-prandial changes and long-term diet effects
The 1H-NMR plasma spectra using a ‘water presaturation’ sequence showed generally broad resonances of the circulating macromolecules (lipids and lipoproteins); thus, a ‘cpmg’ sequence was used to attenuate the signal of these macromolecules and to highlight small metabolite molecules. Twenty-seven circulating compounds were detected, including main amino acids, sugars, organic acids, vitamins, nucleotide and nucleosides, while residual signals of lipids and lipoproteins were still observed (Supplementary Fig. S1 and Table S3 of Supplementary material).
Each spectrum was segmented into 212 variable spectral regions on which putative specific compounds were assigned according to the annotation. The PCA demonstrated a significant discrimination of plasma profiles between 6 and 48 h after the last meal (in Fig. 4(a), PC1 represents 32 % of the total variability). The compounds related to post-prandial differences are the essential amino acids, such as methionine, phenylalanine and tyrosine, which were higher at 6 h post feeding, and glucose and non-essential amino acids, such as alanine, which were higher at 48 h post feeding (Fig. 4(b)). The status of branched-chain amino acids on this first PCA axis was, however, contrasted, with leucine showing higher values at 6 h post feeding and valine showing higher values at 48 h post feeding. The PCA did not show a significant discrimination between the fish fed different diets on the first two axes (cumulated 44 % of the total variability), although the third axis (PC3 9 % of the total variability; Supplementary Fig. S2A of Supplementary material) suggested a discrimination between the fish fed the P-based diet and those fed the M diet, while the fish fed the C diet showed intermediate results. These differences were due to higher scores of creatine, dimethylamine and serine in the M diet and higher scores of glucose, lysine, leucine, inositol and pterin in the P-based diet (Supplementary Fig. S2B of Supplementary material).
Multidimensional PCA of 1H-NMR spectra (‘CPMG’ sequence) of plasma segmented into 212 variable size spectral regions: (a) representation on the first two PC axes of the scores of plasma of individuals fish fed a M diet (triangle), a P-based diet (circle) and a C diet (diamond) either 6 h post feeding (straight line) or 48 h post feeding (dotted line) n 15 per treatment and (b) representation of the main significant spectral regions involved in the PC1-axis differences related to time after feeding.

Due to highly significant interactions between diet and time after feeding for most of the spectral regions (54 % of the whole set of spectral regions), a separate analysis was performed at 6 h post feeding and 48 h post feeding. At 6 h after feeding, the PCA (Fig. 5(a)) showed significant profile discriminations between the fish fed different experimental diets, particularly on the second principal axis (12⋅6 %). Volcano plot analyses (Fig. 5(c)) show a few compounds with a higher content in the fish fed the M diet, such as dimethylamine and creatine, while the content of numerous compounds was significantly higher in the fish fed the P-based diet, such as glucose, lysine, methionine, inositol, pterin and various unknown compounds (Tables 7; Supplementary Table S4 of Supplementary material). At 48 h after feeding, the PCA (Fig. 5(b)) did not show a significant discrimination between the fish fed different diets, although the fish fed the M diet and those fed the P-based diet seemed to be on opposite sides of the first principal axis (25⋅6 %). The volcano plot analysis (Fig. 5(d)) shows numerous compounds with content that was significantly higher in fish fed the P-based diet, such as inositol, alanine, lysine, valine, isoleucine, leucine, pterin and various unknown compounds, while only a few compounds had a significantly higher content in fish fed the M diet, such as glutamine and glucose (Tables 7; Supplementary Table S4 of Supplementary material). The significant interactions between post-feeding time and diet were related mainly to glucose, inositol, glutamine, alanine, methionine, valine, lysine, phenylalanine, tyrosine and various unknown compounds.
Multidimensional PCA of 1H-NMR spectra (CPMG sequence) of plasma segmented in 388 spectral regions. (a) Score plot on the first two principal components of individual rainbow trout at 6 h after feeding on a M diet (triangle), a P-based diet (circle) and a C diet (diamond) n 15 per treatment. (b) Score plot on the first two principal components of individual rainbow trout at 48 h after feeding on a M diet (triangle), a P-based diet (circle) and a C diet (diamond) n 15 per treatment. (c) Volcano plot representations of the differences at 6 h between M and P-based diets with the M diet used as a reference. (d) Volcano plot representation of the differences at 48 h between M and P-based diets with the M diet used as a reference. Circle, significantly higher signal (P < 0⋅05); triangle, significantly lower signal (P < 0⋅05); dash, non-significant differences. Each bucket was assigned to a given metabolite compound or a group of metabolite compounds, except for unidentified signals: unkS2.18 (singlet at 2⋅18), unkT3.99 (triplet at 3⋅99 ppm), unkD1.008 (doublet at 1⋅008 ppm) and unkM (multiplet of resonances).

Significant effects of diet (M v. P-based) on semi-quantitative assessment of representative annotated spectral regions or bucket of the 1H-NMR spectra of plasma at 6 and 48 h after feeding

unk, resonance(s) from unknown metabolite(s) (an un-annotated bucket with significant effects of diet is listed in Supplementary Table S4 of Supplementary material).
ANOVA on diet effect (n 15): ***P < 0⋅001; **P < 0⋅01;*P < 0⋅05.
a unk + leucine + lysine diet C and M; leucine + lysine diet P.
1H-NMR liver tissue analysis
The 1H-NMR spectra of aqueous polar extracts in liver made it possible to identify eighteen water–methanol-soluble compounds, including main amino acids (phenylalanine, tryptophan, histidine, lysine, isoleucine, leucine, valine, glutamic acid, glutamine, alanine and taurine), carbohydrates (glucose and mannose), organic acids (lactate and acetate), peptides and amino acid derivatives (anserine and phosphocreatine), vitamin precursors and derivatives (niacinamide, choline and betaine) and nucleoside (inosine) (Supplementary Fig. S3 and Table S5 of Supplementary material). Some compounds were difficult to identify because their NMR signals overlapped each other, and this is the case for the arginine signal that overlapped the choline signal.
The whole spectrum was segmented in 252 variable spectral regions on which putative specific compounds were assigned according to the annotation. The PCA showed a clear discrimination between the fish fed different experimental diets (in Fig. 6(a), PC1 represents 26 % of the variability). The volcano plot analysis (Fig. 6(b)) shows that numerous spectral regions contributed to the differences observed between the fish fed the M diet and those fed the P-based diet.
Multidimensional PCA of 1H-NMR spectra of liver aqueous polar extracts segmented in 341 spectral regions. (a) Representation of the scores on the two first principal components of rainbow trout 48 h after feeding on a M diet (triangle n 10), a P-based diet (circle n 11) and a C diet (diamond n 9). (b) Volcano plot representation of the differences of the signals of spectral regions between M and P-based diets with the M diet used as a reference. Circle, significantly higher signal (P < 0⋅05); triangle, significantly lower signal (P < 0⋅05); dash, non-significant differences.

The relative quantification of the more representative spectral regions (Table 8; Supplementary Table S6 of Supplementary material) revealed at least twenty-four signals significantly higher in the M diet and forty-three signals significantly higher in the P-based diet. The compounds more specifically related to the M diet were glutamine, mannose and uridine derivatives, while some signals were related to a mixture of compounds and numerous signals were not associated with any compounds. Some of the latter were observed in a relatively high content in liver tissue (unkS3.91, unkD3.79 unkS3.43 and unkD1.32). The compounds specifically related to the P-based diet were glucose, threonine, isoleucine, tryptophan, glutamate, uracile, inosine, putrescine, formate and ethanol, and there were numerous signals for which no associated compounds were identified. Some of these unknown compounds were shown to be in a relatively high content in liver tissue such as unkS3.42 and unkS3.27.
Significant effects of diet (M v. P-based) on semi-quantitative assessment of representative spectral regions or bucket of the 1H-NMR spectra of a hydro-alcoholic extract of liver in rainbow trout
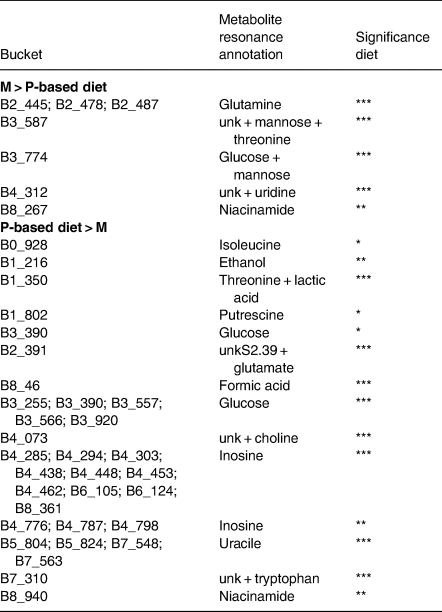
ANOVA on the diet effect (for M diet, n 10; for P-based diet, n 11): ***P < 0⋅001; **P < 0⋅01; *P < 0⋅05.
1H-NMR muscle tissue analysis
The 1H-NMR spectra of polar aqueous extracts of muscle tissue made it possible to detect sixteen water–methanol-soluble compounds identical to those detected in the liver tissue (mannose and ethanol were not detected in muscle tissue) (Supplementary Fig. S4 and Table S4 of Supplementary material).
The whole spectra were segmented in 268 variable spectral regions on which putative specific compounds were assigned according to the annotation. The PCA showed a clear discrimination between diets (in Fig. 7(a), PC1 represents 32 % of the variability). Numerous spectral regions contributed to differences between the fish fed the M diet and those fed the P-based diet, as indicated on the volcano plot figure (Fig. 7(b)).
Multidimensional PCA of 1H-NMR spectra of muscle tissue aqueous polar extracts segmented in 276 spectral regions. (a) Representation of the scores on the first two principal components of rainbow trout 48 h after feeding on a M diet (triangle n 10), a P-based diet (circle n 11) and a C diet (diamond n 9). (b) Volcano plot representation of the differences of the signals of spectral regions between M and P-based diets with the M diet used as a reference. Circle, significantly higher signal (P < 0⋅05); triangle, significantly lower signal (P < 0⋅05); dash, non-significant differences.

The quantification of the more representative spectral regions (Table 9; Supplementary Table S6 of Supplementary material) revealed at least forty-two signals significantly higher in fish fed the M diet and seventy-eight signals significantly higher in fish fed the P-based diet. Signals more specifically related to fish fed the M diet were assigned to the following compounds: niacinamide, choline and uridine derivatives. One strong signal was associated with a mixture of compounds (choline, anserine, taurine, betaine and histidine) and was difficult to solve, although it could be associated mainly with taurine. Numerous signals had no associated compounds, and some of these were detected only in the M diet (unkD9.14, unkD8.86 and unkD5.45) at low levels. Signals specifically related to fish fed the P-based diet were attributed to the following compounds: histidine, threonine, lysine, leucine, valine, isoleucine, glutamate, taurine, creatine, lactate and inosine, and there were also numerous signals for which no associated compounds were identified. A few of these unidentified compounds were in a relatively high content in muscle tissue (unkM3.79).
Significant effects of diet (M v. P-based) on semi-quantitative assessment of representative spectral regions or bucket of the 1H-NMR spectra of a hydro-alcoholic extract of muscle in rainbow trout

ANOVA on the diet effect (M: n 10; P: n 11): ***P < 0⋅001; **P < 0⋅01; *P < 0⋅05.
a B4_0690 = choline +ε 13C creatine.
b B2.4073 = unkS2.39 + glutamate.
Interconnections between metabolites in plasma, and liver and muscle tissues
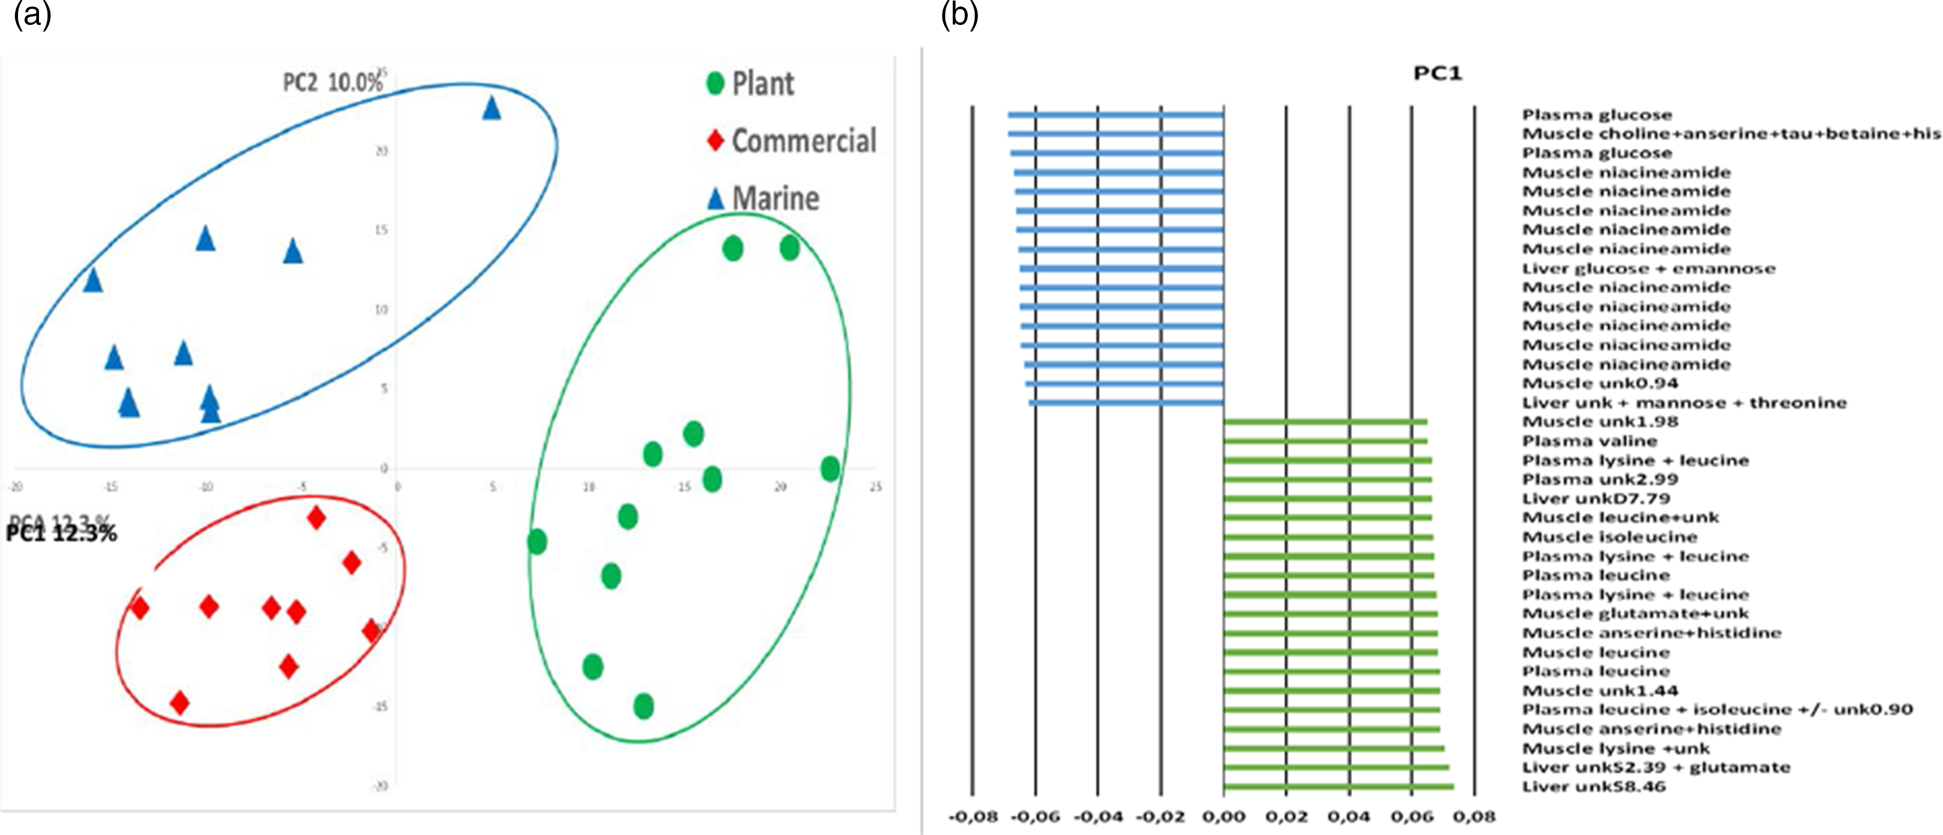
The global PCA on 1H-NMR profiles of plasma, and liver and muscle tissues at 48 h post feeding showed a clear discrimination of the fish fed different diets, particularly between those fed the M diet and those fed the P-based diet (Fig. 8). The differences in signals related to amino acid accumulations in the plasma of fish fed the P-based diet at 48 h post feeding were correlated with signals associated with amino acid accumulations in muscle tissue. The differences in signals related to plasma glucose in the fish fed the M diet were correlated with signals associated with the presence of glucose in the liver and of niacinamide in muscle tissue.
Multidimensional PCA analysis of 1H-NMR spectra of plasma, liver and muscle polar extracts. (a) Representation of the scores on the first two principal components of rainbow trout 48 h after feeding on a M diet (triangle n 10), a P-based diet (circle n 11) and a C diet (diamond n 9). (b) Representation of the main significant spectral regions involved in the PC1-axis differences.
Discussion
This study was performed on rainbow trout whose growth performance, after having been fed a full P-based diet for 15 months, was relatively good, although it was still significantly lower than that of the control fish fed the FM/FO diet (M) and the reference C diet. The growth reduction due to the P-based diet was observed since the first feeding stage but was still effective in the on-growing stage of the present study(Reference Lazzaroto, Médale and Larroquet41).
The plant ingredients were supplemented with specific compounds, such as lysine and methionine, to re-equilibrate essential amino acid profile. The differences in the growth performance of the P-based diet is often related to reduce feed intake(Reference Panserat, Hortopan and Plagnes-Juan4,Reference Geay, Ferraresso and Zambonino-Infante7) . To mitigate such a negative effect, a set of selected compounds comprising glucosamine, taurine and betaine, a priori not found in plant-based ingredients, complemented with glycine and alanine was also intentionally added to mimic the expected composition in the M diet(Reference Lazzarotto, Corraze and Leprevost6). Betaine and glucosamine are known to feed attractants and growth-promoting compounds in fish(Reference Tiril, Alagil and Yagci47,Reference Chowdhary, Srivastava and Mishra48) . Furthermore, some of these compounds have specific biological functions such as preserving tissue osmotic pressure for taurine(Reference Shen, Huang and Dong49) and contributing to C1 metabolism for betaine(Reference Obeid50). Taurine is now considered as an essential nutrient, especially in species that could not synthesise taurine(Reference Salze and Davis51). Thus, the adequate supplementation with specific compounds most likely contributes to the relatively good performances of fish fed with the P-based diet(Reference Lazzaroto, Médale and Larroquet41) offering optimum condition to assess the long-term effects of the P-based diet.
The objective of this study was to characterise feeds and fish metabolic response by NMR metabolomic approaches in order to explain the differences observed in the growth performance. Metabolomic approaches in plasma and tissues helped to identify which tissues and which metabolic pathways were mainly altered in fish fed the P-based diet and how this could be used for making further improvements to the alternative diets.
Soluble compounds in experimental feeds as putative diet biomarkers
Although 1H-NMR analyses are often used to characterise food and feed ingredients(Reference Mannina, Sobolev and Viel52) and to assess fish product quality and origin(Reference Vidal, Manzanos and Goicoechea53), they have only just started to be implemented on fish feed(Reference Roques, Debordes and Richard38,Reference Cheng, Müllner and Moazzami54,Reference Gil-Solsona, Calduch-Giner and Nácher-Mestre55) . The alcoholic extracts of the diets contained a rich and complex mixture of soluble compounds representative of free soluble compounds originally present in marine products and plant products. Some compounds constitute markers of feedstuffs and ingredients of the diet. Creatine, anserine, niacinamide and adenosine detected only in M and C diets are known to be present in FM(Reference Souci, Fachmann and Kraut56,Reference Wu and Bechtel57) . These compounds were also detected in the plasma of fish fed M and C diets as well as dimethylamine. Secondary amines, dimethylamine and trimethylamine, which are specific to marine resources fish and seafood(Reference Shen, Huang and Dong49,Reference Cheng, Müllner and Moazzami54,Reference Arvanitoyannis58) , have been specifically detected in the plasma of fish fed an FM-based diet(Reference Jasour, Wagner and Sundekilde59). Some other compounds, such as sugar compounds, trigonelline and biopterin, are specific to plant-based ingredients. Indeed, the P-based and the C showed large quantities of sugar sucrose and stachyose. Stachyose is suspected to be involved in the gut enteritis related to soyabean meal ingestion, but in the present conditions, it did not induce any differences in the growth of fish fed with the C diet compared with the M diet. Further investigations are required to conclude on the effect of this oligosaccharide in gut alteration(Reference Sørensen, Penn and El-Mowafi60).
Two compounds, identified as pterin and biopterin, specific to plants(Reference Basua and Burgmayerb61) were detected only in the P-based diet and in the plasma of fish fed the P-based diet. The metabolic effects of pterin and biopterin are not known, contrary to those of folic acid, an analogue(Reference Hemre, Lock and Olsvik62). Pterin found in plants is supposed to be distinct from biopterin and neopterin, which are metabolites of guanosine found in animals and particularly in fish, where they contribute to skin pigmentation(Reference Wu and Bechtel57). Pterin detected in plasma could, thus, be considered as a specific biomarker of the P experimental diet. Other unknown compounds detected only in the plasma of fish fed P-based diet are also putative biomarkers of plant feedstuffs, as they get to be revealed by means of metabolomic approaches(Reference Roques, Debordes and Richard38,Reference Obeid50) .
The combined metabolomic analysis of the diet and the plasma, thus, appears to be promising tools to identify a set of plant-based soluble compounds presumably accounting for known and suspected alterations or stimulation in the ingestion and digestion of the P-based diet.
Delay in amino acid absorption and imbalanced supply of essential amino acids to tissues in fish fed the P-based diet
The substitution of marine feedstuffs by plant-based feedstuffs, particularly plant-based protein feedstuffs, is generally associated with limitations in fish digestion and metabolism(Reference Urán, Schrama and Jaafari39). These limits are thought to be attributed to the physical and chemical characteristics of plant-based feedstuffs with regard to specific anti-nutritional factors(Reference Urán, Schrama and Jaafari39). Our data strongly support this hypothesis.
On the one hand, the metabolite plasma profile at 6 h post feeding is mainly influenced by the diet. It depends essentially on diet composition reflecting both food metabolome combined with the efficiency of the digestion and absorption processes of the last meal. This was illustrated by the status of lysine and methionine, which were supplemented in their free form in the P-based diet. These two purified amino acids are absorbed before the bolus of amino acids from intact protein digestion(Reference Schuhmacher, Wax and Gropp13,Reference Ambardekar, Reigh and Williams14) , and this was attested in the present work by their higher plasma content at 6 h post feeding and a significant interaction between post-feeding time and diet.
On the other hand, the plasma profile at 48 h post feeding, equivalent in fish to a short fasting period, is mainly influenced by fish metabolism and, thus, reflects rather the fish metabolome. Moreover, there could be still an influence of the diet, as at the end of the trial, only a single meal was distributed, and this could slow down the transit. The higher concentration and accumulation of compounds – mainly amino acids – in the plasma of fish fed the P-based diet observed at 48 h post feeding compared with those fed the M diet could, thus, be the result of a delay in the delivery of these essential nutrients in the fish fed the P-based diet compared with those fed the M diet. These results are in accordance with previous studies performed using classical analytical approaches in rainbow trout(Reference Yamamoto, Unuma and Akiyama63–Reference Rolland, Larsen and Holm65). The late accumulation of amino acids is suspected to be induced by the physical matrix of plant-based feedstuffs, which reduced amino acid availability and delayed their delivery. Indeed, this could induce a reduced metabolism, either due to an imbalance in amino acid supply to tissues or due to the non-synchronicity of amino acid supply with other energy substrate supplies. This hypothesis has begun to be formalised in human nutrition through the concept of ‘fast’ and ‘slow’ proteins that account for differences in the digestive and metabolic efficiency of meat v. plant-based protein, especially in elderly people(Reference Dangin, Boirie and Guillet66). This concept needs to be taken into consideration in fish nutrition for the development of alternative diets such as the P-based diets but also of new ingredients (micro-algae, insects, etc.). Alternatively, the higher concentration of amino acids in plasma could also result in an accumulation of amino acids in tissues, as was observed in muscle tissue, suggesting an alteration in amino acid utilisation.
Thus, the early delivery of supplemented essential amino acid in fish fed the P-based diet, associated with the delay observed in the delivery of amino acids from the digestion of plant-based protein, would induce an imbalanced supply of essential amino acids to the tissues.
Minimised but targeted contribution of liver to whole-body metabolism
Liver is orchestrating the delivery of metabolites to other tissues, but, in the present study, its contribution seems to be minimal if one considers the faint diet separation between diets in this tissue. It means that liver metabolism was slightly affected by P-based diet diet compared with plasma and muscle even taking into account that at 48 h post feeding, the contribution of liver to metabolite exchanges could be largely reduced.
The increased status of choline in liver and the corresponding decrease in the muscle tissue of fish fed the P-based diet should be considered. Choline is a precursor of phospholipid metabolism, and we found in a previous study that the metabolisms of lipid and cholesterol are stimulated in the liver of fish fed the P-based diet(Reference Lazzaroto, Médale and Larroquet41). On the other hand, choline and related compounds are well known to contribute to one-carbon metabolism in interaction with methionine metabolism. It has been demonstrated in fish that the sub-deficiency of methionine requires an increased supply of choline to maintain methionine status(Reference Espe, Zerrahn and Holen67). Choline and its metabolites are specifically affected in other fish species fed P-based diet diets(Reference Cheng, Müllner and Moazzami54,Reference Cheng, Wagner and Moazzami68) . Betaine (trimethylglycine), dimethylglycine and serine are intermediate metabolites of the choline metabolic pathway, where they act as –CH3 and –CH2OH donors, particularly for methionine synthesis(Reference Chao, Huo and Cheng69). Furthermore, early absorption of free-form methionine probably stimulates its use as a methyl donor in the liver. This will contribute to the preservation of choline but could, however, induce, a further deficiency of methionine in other tissues such as muscle.
Long term adaptation of muscle tissue to unbalanced supplies of amino acids
The adaptation of fish to long term feeding with only plant-based ingredients has been demonstrated in salmonids(Reference De Francesco, Parisi and Médale5,Reference Lazzarotto, Corraze and Leprevost6,Reference Veron, Panserat and Le Boucher18) and several marine fish(Reference Geay, Ferraresso and Zambonino-Infante7), but growth performances are generally lower than with marine ingredients. Muscle metabolism would, thus, be specifically affected by a P-based diet and in the present study, muscle demonstrated a better discrimination of the P-based diet with the M and C diets than in plasma and liver. The main differences observed in muscle tissue at 48 h after feeding were an accumulation of essential amino acids in the fish fed the P-based diet. This suggests an amino acid imbalance for protein synthesis due to the limited supply of certain essential amino acids to muscle tissue. Changes observed in muscle tissue were related to other differences observed, i.e. a delay in amino acid release in fish plasma fed the P-based diet and an imbalanced supply of essential amino acids observed in plasma and liver tissue due to the early absorption of methionine and lysine in fish fed the P-based diet. These results clearly show that both an overall balanced supply of essential amino acids and the synchronic delivery of all essential amino acids to muscle tissue are crucial for protein turnover and muscle growth.
Further alterations in energy and vitamin status
The P-based diet also induced alterations in energy metabolism. It is noteworthy that glucose levels are not significantly different at 6 and 48 h after feeding, and this could be due to the fact that all diets comprise a significant amount of starch ingredients. Due to the low utilisation of dietary glucose, it is generally observed that plasma glucose can be maintained at high levels during post-prandial time, even 12–24 h after the last feeding in rainbow trout fed either M or P-based diet(Reference Veron, Panserat and Le Boucher18,Reference Borey, Panserat and Surget40) . All diets contained high levels of starch, and, thus, the differences observed in plasma glucose at 48 h between M and P-based diets could not be attributed simply to the plant-based ingredients. Furthermore, the same reduction in plasma glucose was observed in cobia fed experimental diets with an increased substitution of FM (25 and 75 %) by plant-based protein(Reference Egea, Toledo-Guedes and Sanchez-Jerez32). Specific changes in the liver metabolism of fish fed a P-based diet have also been observed using transcriptomic and proteomic approaches. These changes concern mainly the intermediary metabolism, through lipid and carbohydrate metabolism interactions for neoglucogenesis, and lipid and protein metabolism interactions for the control of protein catabolism(Reference Panserat, Hortopan and Plagnes-Juan4,Reference Geay, Ferraresso and Zambonino-Infante7) . In our analysis of liver tissue, 48 h after feeding, the main differences concerned glucose, inosine and even ethanol, which were found to be higher in the liver of fish fed the P-based diet. This is consistent with an alteration of the liver's energy metabolism towards neoglucogenesis from amino acids, as demonstrated in previous transcriptomic studies(Reference Panserat, Hortopan and Plagnes-Juan4,Reference Geay, Ferraresso and Zambonino-Infante7) . Furthermore, the lower content of glutamine in the liver of fish fed the P-based diet could also account for a higher contribution of amino acids to the energy metabolism. The accumulation of amino acids observed in fish plasma fed the P-based diet could lead to their use to produce energy substrate in the liver, particularly through glutamate as an entry point into the TCA cycle. Finally, the creatine and the niacinamide status of muscle were altered in fish fed the P-based diet. This has already been observed for creatine in fish fed a P-based diet(Reference Wagner, Trattner and Pickova30,Reference Wei, Liang and Mai36) but had not yet been demonstrated for niacinamide, a vitamin B metabolite involved in the NAD synthesis. The global analysis showed that the main differences observed in plasma, liver and muscle energy status, and those observed in liver choline cycle and muscle protein metabolism were connected. Thus, these alterations in energy metabolism could account for the adaptation of fish metabolism to an imbalanced and delayed supply of nutrients.
Conclusions
This study shows the great interest of implementing metabolomic approaches on biological fluids and tissues in order to assess the long-term effects of P-based diets on rainbow trout metabolism. Metabolomics helps to draw a coherent picture on the concomitant alterations of amino acid metabolism by feeding P-based diets: (i) an early supply of free-form lysine and methionine, (ii) an accumulation of amino acids in fish fed a P-based diet observed at the plasma level, (iii) an alteration of choline-related metabolites for –CH3 supply to the liver and (iv) an imbalance in amino acids for protein synthesis in muscle tissue. This constitutes relevant targets for future research on protein digestion, amino acid metabolism and protein metabolism that should be considered to improve P-based diets for rainbow trout and farmed fish in general.
Supplementary material
The supplementary material for this article can be found at https://doi.org/10.1017/jns.2021.3.
Acknowledgments
The authors wish to thank Dr Sadasivam J. Kaushik for his invaluable support, his ideas and the design of the experimental diets; Dr Viviana Lazzaroto for her help and discussion on the experiment; and the technical staff for their great contribution, especially Frederic Terrier for the experimental part and Laurence Laroquet for the analytical part.
This work was supported by the ARRAINA European project (No. FP7-KBBE 288925) and the French MetaboHUB project (No. ANR-11-INBS-0010).
G.C. and F.M. have designed and managed the fish nutrition part; B.M.H. and B.F. have contributed to biofluid and tissue sampling; B.M.H. has contributed to tissue extraction; B.M.H., C.D. and M.M. have managed the metabolomic part (NMR acquisition, spectral analysis, quantification and annotation) under the supervision of A.M.; D.J. has contributed to the statistics for the metabolomic part, including the development of software such as BioStatFlow and NMRProcFlow; and B.F. has supervised this work, contributed to tissue sampling, spectral analysis and statistical analysis and written the manuscript. All authors read and approved the final manuscript.
The authors declare that they have no conflicts of interest.


 Open access

