


I. Introduction
A growing body of research shows that options trading contains valuable information, with price discovery often occurring in the options market before appearing in the equity market (Black (Reference Black1975), Amin and Lee (Reference Amin and Lee1997), Cao, Chen, and Griffin (Reference Cao, Chen and Griffin2005), and Augustin, Brenner, and Subrahmanyam (Reference Augustin, Brenner and Subrahmanyam2019)). In this article, we examine options trading surrounding the release of 10-K filings—an important yet complex source of publicly available information. By focusing on a single type of information rather than various news releases, we can better pinpoint the nature of options traders’ information advantages. Cohen et al. (Reference Cohen, Malloy and Nguyen2020) document a “lazy prices” phenomenon in the stock market: Despite changes to the language and construction of 10-Ks containing (mostly negative) information about future profitability and financial health, stock market investors appear to be inattentive to such changes and only slowly incorporate the new information into stock prices. We hypothesize that, compared to stock market investors, options traders are more sophisticated at parsing 10-K textual changes and incorporate them into options pricing more quickly after release. Our findings show that options traders do respond to these changes in a timely manner, especially among firms with higher information asymmetry and greater arbitrage restrictions. This suggests that advanced information-processing skills represent an important source of competitive advantage for options traders.
We use changes in option volatility smirks to proxy for options trading around 10-K releases. Bates (Reference Bates1991) argues that the set of index call and put option prices across all exercise prices reflects market participants’ aggregate subjective distribution of future price realizations. Consequently, out-of-the-money (OTM) puts become unusually expensive compared to at-the-money (ATM) calls if traders expect large price declines, resulting in steep option volatility smirks. In an option pricing model incorporating both jump risk and volatility risk, Pan (Reference Pan2002) shows that investors’ aversion toward negative price movements drives option volatility smirks as they tend to buy OTM puts to express their concerns about downside risk. Focusing on individual stock options, Xing, Zhang, and Zhao (Reference Xing, Zhang and Zhao2010) show that the shape of volatility smirk has significant cross-sectional predictive power on future equity returns. Stocks exhibiting the steepest smirks in their traded options underperform stocks with the least pronounced ones, and such predictability on future stock returns is persistent for at least 6 months. We, therefore, conjecture that attentive traders who derive insights from 10-K textual changes prefer to trade OTM put options and that the newly revealed negative information is only slowly incorporated into equity prices due to limits to arbitrage.
To investigate options traders’ response to the negative information contained in 10-K textual changes, we keep firm-year observations with volatility smirk information available within 3 months both before and after the 10-K release date.Footnote 1 Following Brown and Tucker (Reference Brown and Tucker2011), Peterson, Schmardebeck, and Wilks (Reference Peterson, Schmardebeck and Wilks2015), and Cohen et al. (Reference Cohen, Malloy and Nguyen2020), we quantify textual changes in 10-Ks between 2 consecutive years using the cosine similarity. A lower cosine similarity score indicates more extensive textual changes in 10-Ks. Following Xing et al. (Reference Xing, Zhang and Zhao2010), we define volatility smirk as the difference in implied volatilities between OTM put options and ATM call options. To capture incremental options trading in response to new 10-K information, we focus on the changes in volatility smirk immediately after the 10-K release relative to at least 8 weeks before the release date.
We first sort firms into quintiles based on their 10-K textual similarity scores and compare changes in option volatility smirks. Firms with the most textual changes show a significant increase in volatility smirks after their 10-K release compared to firms with minimal changes. We then run Fama–MacBeth regressions (Fama and MacBeth (Reference Fama and MacBeth1973)) controlling for additional textual features—including tone optimism and file size—along with firm-level financial variables. We again find a highly significant and positive effect of textual changes on option volatility smirk changes. The economic magnitude is similar to the univariate analysis results. Our analysis of weekly options trading before and after 10-K releases shows that abnormal volatility smirk responses occur primarily in the weeks following the release. Our results are robust to different measures of annual report similarity as well as fixed effects regressions. Together, these results provide supporting evidence that sophisticated investors trade options in response to new information in 10-K releases, which in turn drives changes in option volatility smirks.
To better understand how textual changes relate to volatility smirk changes, we analyze the tone of 10-K textual changes. Empirical evidence in Cohen et al. (Reference Cohen, Malloy and Nguyen2020) suggests that textual changes on average contain negative information about future firm profitability. While not all textual changes convey negative news, our proposed mechanism suggests that the negative relationship between cosine measures and volatility smirk changes stems primarily from textual changes containing negative information. To test this, we construct a negative sentiment change measure based on the number of negative words in textual changes. Indeed, we find a much stronger effect in the subsample with larger increases in negative sentiment. We also show that the open interest of OTM put options is significantly higher for the same subsample. This result aligns with the conjecture that higher volatility smirks following textual changes with negative tones are driven by increased demand for OTM put options.
Next, we explore the effects of textual changes for different items in 10-Ks. We examine text similarity in product descriptions of firms’ own and competitors’ 10-Ks in neighboring years by utilizing two measures of product market fluidity from Hoberg, Phillips, and Prabhala (Reference Hoberg, Phillips and Prabhala2014). Our findings using textual changes to product descriptions in firms’ own 10-Ks are consistent with those using textual changes to the entire 10-Ks. By contrast, textual changes to product descriptions in competitors’ 10-Ks have limited effect on a firm’s option volatility smirk changes. Cohen et al. (Reference Cohen, Malloy and Nguyen2020) document that firms’ reporting changes are largely concentrated in the Management’s Discussion and Analysis (MD&A) section (Item 7), the Legal Proceedings section (Item 3), the Quantitative and Qualitative Disclosures about Market Risk section (Item 7a), and the Risk Factors section (Item 1a). These sections provide greater managerial discretion in reporting, which may account for the observed pattern. Our findings confirm that changes in these sections significantly impact option volatility smirk changes.
The evidence thus far is consistent with options traders demonstrating superior skills in processing negative information from annual report changes and profiting from trades in OTM put options. This information advantage is likely to be more pronounced among firms with greater information asymmetry and higher short-sale costs. Following prior studies, we measure a firm’s information environment using abnormal idiosyncratic volatility (Yang, Zhang, and Zhang (Reference Yang, Zhang and Zhang2020)) and analyst coverage (Hu (Reference Hu2014)). We find that the sensitivity of volatility smirks to 10-K textual changes is concentrated among informationally asymmetric firms—those with high abnormal idiosyncratic volatility and low analyst oversight. Furthermore, since options are informationally more valuable for trading hard-to-short stocks, we find that volatility smirks respond more strongly to textual changes among firms with higher short-selling costs (Hu (Reference Hu2014)).
Finally, we investigate the return predictability of 10-K textual changes and option volatility smirk changes. While options trading offers several well-documented advantages, we acknowledge that sophisticated investors may also exploit their information advantage through stock trading. This is especially relevant for stocks without tradable options, as it affects how quickly stock prices incorporate new information. We, therefore, compare optionable and nonoptionable stocks to assess the difference in the lazy-prices effect between the two groups. Our results show that the lazy-prices effect is primarily driven by optionable stocks, with no significant evidence among nonoptionable stocks. This indicates that informed trading of nonoptionable stocks could accelerate price adjustment, thereby diminishing the lazy-prices effect. In contrast, with optionable stocks, informed investors prefer trading options to leverage their information advantage. This leads to a delayed response of stock prices to 10-K textual changes, likely reflecting arbitrage limitations between the two markets.
We also examine whether changes in option volatility smirks have additional predictive power for future returns. Since not all textual changes contain price-relevant information, if options traders truly possess superior skills in extracting trading signals from textual changes, then combining cosine measures with option volatility smirk changes should yield stronger return predictability. To test this hypothesis, we double-sort stocks into quintile portfolios based on the cosine measures and also divide them into two groups based on the median volatility smirk change. We find that stocks with low cosine similarity and high smirk changes show negative alphas on average, underperforming all other groups—particularly those with high cosine similarity and low smirk changes. Our results suggest that the underperformance of stocks with greater 10-K textual changes is mainly driven by stocks exhibiting a steeper increase in volatility smirks.
Our article contributes to three strands of literature. First, we contribute to the literature on informed options trading and particularly the sources of options traders’ information advantage. There is a large literature on informed options trading around major corporate events and macroeconomic announcements (Augustin and Subrahmanyam (Reference Augustin and Subrahmanyam2020)). Empirical evidence strongly indicates that these preevent trading patterns stem from private information. Other studies show that measures derived from option volumes, prices, and volatility strongly predict future stock returns and events in the equity market (Easley, O’Hara, and Srinivas (Reference Easley, O’Hara and Srinivas1998), Pan (Reference Pan2002), Chakravarty, Gulen, and Mayhew (Reference Chakravarty, Gulen and Mayhew2004), Ofek, Richardson, and Whitelaw (Reference Ofek, Richardson and Whitelaw2004), Cao et al. (Reference Cao, Chen and Griffin2005), Pan and Poteshman (Reference Pan and Poteshman2006), Xing et al. (Reference Xing, Zhang and Zhao2010), Bali and Murray (Reference Bali and Murray2013), and Kim and Zhang (Reference Kim and Zhang2014)). However, research on informed options trading based on public information remains limited. We provide evidence that trading around 10-K releases is primarily driven by options traders’ ability to process complex information disclosed in these filings.
Second, our article contributes to the growing literature on the use of public information by sophisticated investors. Cohen and Frazzini (Reference Cohen and Frazzini2008) and Menzly and Ozbas (Reference Menzly and Ozbas2010) argue that outside shareholders have limited capacity to fully comprehend the impact of public information across firms and industries and show that this leads to return predictability across economically linked firms. Engelberg, Reed, and Ringgenberg (Reference Engelberg, Reed and Ringgenberg2012) find that a substantial portion of short sellers’ trading advantage comes from their ability to analyze publicly available information using a database of news releases. Alldredge and Cicero (Reference Alldredge and Cicero2015) provide evidence that some profitable insider stock selling is motivated by public information on disclosed sales relationships. Dugast and Foucault (Reference Dugast and Foucault2025) develop a theoretical framework and show that improvements in information technology lead to lower information search costs, resulting in more precise performance predictions by quantitative investors. Regarding the use of EDGAR filings by investors, Drake, Roulstone, and Thornock (Reference Drake, Roulstone and Thornock2015) and Gibbons, Iliev, and Kalodimos (Reference Gibbons, Iliev and Kalodimos2021) show that Forms 10-K, 10-Q, and 8-K are important information sources for sophisticated investors. Our study builds on this literature by demonstrating how options traders respond to and profit from new information revealed in 10-K textual changes through their superior information processing skills.
Third, our article sheds new light on the “lazy prices” phenomenon documented in Cohen et al. (Reference Cohen, Malloy and Nguyen2020) and explores the interconnection between options and equity markets (Detemple and Selden (Reference Detemple and Selden1991), Duffie, Gârleanu, and Pedersen (Reference Duffie, Gârleanu and Pedersen2002), Lamont and Thaler (Reference Lamont and Thaler2003), and Ofek et al. (Reference Ofek, Richardson and Whitelaw2004)). We show that the lazy-prices effect is mainly driven by optionable stocks and is insignificant for stocks without tradable options. This pattern suggests that informed investors prefer trading options when available, and the limited arbitrage between the two markets leads to a delayed response of stock prices to new information.
The remainder of this article is organized as follows: Section II develops testable hypotheses. Section III presents the data sample and summary statistics. Section IV describes our research design and presents the main empirical results. Section V explores the heterogeneous effects of 10-K textual changes. Section VI investigates the return predictability of textual and option volatility smirk changes. Section VII provides concluding remarks.
II. Hypothesis Development
Our research builds on two strands of literature on information acquisition via EDGAR filings and investor sophistication in the options market. Recent research has highlighted the importance of information acquisition via EDGAR filings. Drake et al. (Reference Drake, Roulstone and Thornock2015) document that a small group of users frequently access a substantial amount of information from EDGAR, especially around major corporate announcements and after a period of poor stock performance. Moreover, EDGAR requests for filings related to earnings disclosure are positively associated with the speed at which the market impounds earnings news. Gibbons et al. (Reference Gibbons, Iliev and Kalodimos2021) focus on sell-side equity analysts and document that they actively acquire information via EDGAR prior to making earnings forecasts. Such information acquisition is related to a significant reduction in forecasting errors and a stronger market reaction following the recommendation. Both studies show that Forms 10-K, 10-Q, and 8-K are among the most highly accessed filings and contain information pertinent to major corporate events and firm profitability in general. Compared to 10-Q and 8-K filings, 10-K reports are generally much longer and more complex, requiring advanced information processing skills to fully understand their value implications. Our article extends this strand of literature by examining options traders’ information acquisition via textual changes in 10-K filings.
There is ample evidence on informed options trading around major corporate events (e.g., M&As, earnings news, and leveraged buyouts) and macroeconomic announcements (e.g., Federal Open Market Committee meetings). Augustin and Subrahmanyam (Reference Augustin and Subrahmanyam2020) provide a comprehensive survey of this literature. Another strand of research provides evidence consistent with informed options trading unconditional on major news announcements. These studies (Easley et al. (Reference Easley, O’Hara and Srinivas1998), Chakravarty et al. (Reference Chakravarty, Gulen and Mayhew2004), Pan and Poteshman (Reference Pan and Poteshman2006), Xing et al. (Reference Xing, Zhang and Zhao2010), and Ge, Lin, and Pearson (Reference Ge, Lin and Pearson2016)) find that information-based measures derived from options trading volume and prices have strong predictive power for future stock returns. These studies suggest that sophisticated investors prefer using options trading (especially OTM options) to exploit their information advantage, possibly due to several distinctive characteristics of options trading: high embedded leverage, low margin requirements, low implicit borrowing rates, low commissions, and limited downside risk (Black (Reference Black1975), Amin and Lee (Reference Amin and Lee1997), Cao et al. (Reference Cao, Chen and Griffin2005), and Ge et al. (Reference Ge, Lin and Pearson2016)).
Recently, Cohen et al. (Reference Cohen, Malloy and Nguyen2020) document the “lazy prices” phenomenon consistent with the inattentiveness of unsophisticated stock market investors. Although changes to the language and construction of 10-Ks predict future earnings, major news announcements, and bankruptcy risk, stock prices tend to react slowly to these changes. We hypothesize that options traders possess superior information processing skills and thus a comparative advantage over average stock market investors in extracting relevant information from complex 10-K filings. Building on Cohen et al. (Reference Cohen, Malloy and Nguyen2020), who find that textual changes in 10-K filings typically convey negative news about future firm profitability, we conjecture that this information prompts options traders to purchase more OTM put options, leading to an increase in volatility smirks. Furthermore, if options traders profit from extracting relevant information from these textual changes, the corresponding responses in option volatility smirks should predominantly occur after the 10-K release.
We formulate our first hypothesis regarding the relation between textual changes in 10-K filings and changes in option volatility smirks as follows:
Hypothesis 1. Negative information in 10-K textual changes leads to an increase in option volatility smirks following 10-K releases.
We next investigate the heterogeneous effects of 10-K textual changes on options trading. Since not all changes provide valuable trading signals, we expect traders to focus more on sections that reveal fundamental changes in the firm and where managers have greater discretion in their reporting. Hoberg et al. (Reference Hoberg, Phillips and Prabhala2014) show that product market descriptions contain useful information about a firm’s competitive position, in addition to the standard industry classification codes. The MD&A, Legal Proceedings, Quantitative and Qualitative Disclosures about Market Risk, and Risk Factors sections often provide subtle and soft information reflecting management’s perceptions of business prospects and risk exposures. Cohen et al. (Reference Cohen, Malloy and Nguyen2020) find that firms’ reporting changes are mainly concentrated in these sections. We therefore conjecture that textual changes in these segments have a disproportionate impact on changes in option volatility smirks.
A firm’s information environment can also impact the speed of stock price adjustment to new information in 10-K textual changes. For firms with high information asymmetry, information dissemination tends to be noisy, leading stock investors to respond slowly to reporting changes. Sophisticated investors can more effectively leverage their information advantages by trading options on such firms. Cremers and Weinbaum (Reference Cremers and Weinbaum2010) find that option expensiveness is a significantly stronger predictor of future stock returns among firms with more opaque information environments. Wittenberg-Moerman (Reference Wittenberg-Moerman2008) also provides evidence that information asymmetry and financial reporting quality play a key role in bond trading. We, therefore, hypothesize that 10-K textual changes will have a stronger effect on changes in volatility smirks for firms with higher information asymmetry.
Short-sale constraints represent another factor that may influence the impact of 10-K textual changes on options trading. Although short selling provides an alternative avenue for sophisticated investors to act on negative information, options are often used in practice to circumvent short-sale constraints in the securities lending market, given the fluctuating costs of short selling over time and across firms. Even large institutional investors may find it difficult and costly to short certain stocks. Therefore, we expect option volatility smirks to react more strongly to 10-K reporting changes for firms facing higher short-selling costs.
We summarize the heterogeneous effects of textual changes with the following set of hypotheses:
Hypothesis 2a. Option volatility smirks respond more strongly to textual changes in 10-K sections that are more informative about firm fundamentals and subject to greater managerial discretion.
Hypothesis 2b. Option volatility smirks respond more strongly to 10-K textual changes among firms with greater information asymmetry and higher short-selling costs.
Finally, we examine whether the “lazy prices” phenomenon documented in Cohen et al. (Reference Cohen, Malloy and Nguyen2020) differs between stocks with and without tradable options. In developing the hypothesis, we assume that sophisticated investors prefer trading options to capitalize on price-relevant information in 10-K textual changes. While the advantages of options trading are well-documented, we acknowledge that sophisticated investors may also exploit their information advantage through stock trading. This is especially relevant for stocks without tradable options, where greater textual changes in 10-K filings may prompt more informed trading in the stock market. As a result, information may be incorporated into stock prices more quickly, leading to a weaker lazy-prices effect. However, the availability of tradable options does not necessarily explain the lazy-prices effect. Even if informed investors mainly use OTM puts to trade optionable firms, the speed of price discovery in the stock market depends on the degree of integration between the two markets. Under perfect integration, the no-arbitrage relation in put-call parity predicts that any information produced through options trading should be swiftly transmitted to the underlying stock prices. In contrast, with limited arbitrage, stock prices could deviate from the values implied by put-call parity for extended periods.
Limited arbitrage between the stock and options markets can arise from a combination of factors including market segmentation, transaction costs, and short sale constraints. First, market segmentation occurs when the two markets attract different types of investors. For example, sophisticated investors may prefer trading options, while inattentive investors mainly trade in the stock market. Although sophisticated investors may participate in both markets, price divergences can still emerge if the marginal investors differ. In such cases, there is often no immediate mechanism to correct the mispricing (Shleifer (Reference Shleifer2000)). Second, several factors may prevent investors from replicating the payoff of the underlying stock using bonds and call-put option combinations. Transaction costs, in particular, can be substantial in the options market—especially during periods of severe market dislocation—making such arbitrage strategies less feasible (Lamont and Thaler (Reference Lamont and Thaler2003)). Alternatively, there may be hidden values associated with owning shares (Duffie et al. (Reference Duffie, Gârleanu and Pedersen2002)) or options (Detemple and Selden (Reference Detemple and Selden1991)). Third, short-sale restrictions are among the most commonly cited frictions leading to the breakdown of put-call parity. When short selling becomes too expensive or unavailable, arbitrage opportunities that would normally drive overvalued stock prices toward their options-implied values vanish. For example, Ofek et al. (Reference Ofek, Richardson and Whitelaw2004) show that violations of put-call parity are strongly related to short sales constraints as measured by the rebate rate spread.
For optionable stocks with limited arbitrage between the stock and options markets, the predictability of 10-K textual changes on future stock returns is likely to depend on the magnitude of changes in option volatility smirks. Cohen et al. (Reference Cohen, Malloy and Nguyen2020) show that the strong predictive power of 10-K textual changes on future stock returns persists more than 6 months following the filing’s release. Xing et al. (Reference Xing, Zhang and Zhao2010) find that option volatility smirks predict stock returns up to 6 months. This implies that options traders can exploit the information revealed in textual changes before it is slowly incorporated into stock prices. However, it is unlikely that all textual changes carry the same amount of negative information. A more plausible scenario is that some textual changes are more informative than others. If sophisticated investors have the ability to identify and act on information-relevant textual changes, then the predictability on future stock returns should be stronger for changes that are accompanied by large shifts in option volatility smirks.
We state our third set of hypotheses about the return predictability of 10-K textual changes as follows:
Hypothesis 3a. Compared to stocks without tradable options, the predictability of 10-K textual changes on future stock returns is stronger for optionable stocks due to limited arbitrage.
Hypothesis 3b. For optionable stocks, the predictability of 10-K textual changes on future stock returns is stronger when accompanied by larger changes in option volatility smirks.
III. Data and Summary Statistics
In this section, we describe our data sample, key variable definitions, and summary statistics.
A. Data Sample
Our data sample includes all public firms with information on options trading available during the period from 1996 to 2017 as a result of combining different databases. We obtain options data from OptionMetrics, accessed via WRDS. For these firms, we download all 10-K filings during the same period from the EDGAR website maintained by the Securities and Exchange Commission (SEC) and construct textual similarity measures. Finally, we construct firm-level financial variables, such as market capitalization, book-to-market ratio, stock return, return on assets (ROA), cash holdings, capital expenditure (CAPEX), and tangibility, based on items from Compustat. All variable definitions are provided in the Appendix. We keep firm-year observations with information on options trading available both before and after the 10-K release. Our final data sample consists of 4,604 unique firms and 28,704 firm-year observations.
B. Main Variables
Our primary outcome variable is the change in volatility smirk ( $ \Delta Smirk $
) before and after the 10-K release date. Motivated by prior research, we use the smirk change to capture options trading in response to new information disclosed in the most recent 10-K. Specifically, we first calculate daily volatility smirk as the difference in implied volatilities between OTM put options and ATM call options. Following Xing et al. (Reference Xing, Zhang and Zhao2010), we classify moneyness between 0.95 and 1.05 as ATM call options and moneyness between 0.80 and 0.95 as OTM put options. For stocks with multiple ATM (OTM) options trading on a given day, we use the average of implied volatilities to compute the difference.
$ \Delta Smirk $
) before and after the 10-K release date. Motivated by prior research, we use the smirk change to capture options trading in response to new information disclosed in the most recent 10-K. Specifically, we first calculate daily volatility smirk as the difference in implied volatilities between OTM put options and ATM call options. Following Xing et al. (Reference Xing, Zhang and Zhao2010), we classify moneyness between 0.95 and 1.05 as ATM call options and moneyness between 0.80 and 0.95 as OTM put options. For stocks with multiple ATM (OTM) options trading on a given day, we use the average of implied volatilities to compute the difference.
Next, we compute changes in volatility smirk as follows: We keep firm-year observations with volatility smirk information available within 3 months both before and after the 10-K release date. We use the first available option volatility smirk, which is at least 8 weeks (i.e., 56 days) before the 10-K release date, as the “Baseline Smirk.” The baseline smirk is defined sufficiently before the 10-K release to alleviate the concern that trading driven by proprietary information and/or other information events (e.g., earnings announcement) may cause the smirk change ahead of the release date. We use the first available option volatility smirk immediately after the 10-K release as the “Post-release Smirk.” The difference between the two smirks reflects changes in options trading surrounding the 10-K release, that is, $ \Delta Smirk=``Post{\textstyle \hbox{-}}release\ Smirk" $
-
$ \Delta Smirk=``Post{\textstyle \hbox{-}}release\ Smirk" $
- $ ``Baseline\ Smirk" $
.Footnote
2 Alternatively, we use the “Post-release Smirk” (
$ ``Baseline\ Smirk" $
.Footnote
2 Alternatively, we use the “Post-release Smirk” ( $ Smirk $
) as the outcome variable and obtain similar results.Footnote
3
$ Smirk $
) as the outcome variable and obtain similar results.Footnote
3
Our main explanatory variable is a textual similarity measure of 10-Ks between two consecutive fiscal years. Following Brown and Tucker (Reference Brown and Tucker2011), Peterson et al. (Reference Peterson, Schmardebeck and Wilks2015), and Cohen et al. (Reference Cohen, Malloy and Nguyen2020), we measure textual changes based on the cosine similarity between the current year’s 10-K and the prior year’s 10-K. A lower such cosine similarity implies more year-to-year textual changes. Suppose that the two 10-Ks have $ n $
unique words,Footnote
4 each 10-K is then represented by an
$ n $
unique words,Footnote
4 each 10-K is then represented by an $ n $
-dimension vector—
$ n $
-dimension vector— $ {v}_1 $
for the current year and
$ {v}_1 $
for the current year and $ {v}_2 $
for the previous year:
$ {v}_2 $
for the previous year:
 $$ {v}_1=\left({w}_1,{w}_2,\dots, {w}_n\right),\mathrm{and}\;{v}_2=\left({z}_1,{z}_2,\dots, {z}_n\right), $$
where $ {w}_i $
and
$ {w}_i $
and $ {z}_i $
are counts of each word
$ {z}_i $
are counts of each word $ i\in \left[1,n\right] $
. The cosine similarity score is computed as follows:
$ i\in \left[1,n\right] $
. The cosine similarity score is computed as follows:
 $$ Cosine\left(\theta \right)=\left({v}_1/\left\Vert {v}_1\right\Vert \right)\left({v}_2/\left\Vert {v}_2\right\Vert \right)=\left({v}_1\cdot {v}_2\right)/\left(\left\Vert {v}_1\right\Vert \left\Vert {v}_2\right\Vert \right), $$
where $ \theta $
is the angle between
$ \theta $
is the angle between $ {v}_1 $
and
$ {v}_1 $
and $ {v}_2 $
,
$ {v}_2 $
, $ \left(\cdot \right) $
is the dot product operator,
$ \left(\cdot \right) $
is the dot product operator, $ \left\Vert {v}_1\right\Vert $
is the vector length of
$ \left\Vert {v}_1\right\Vert $
is the vector length of $ {v}_1 $
, and
$ {v}_1 $
, and $ \left\Vert {v}_2\right\Vert $
is the vector length of
$ \left\Vert {v}_2\right\Vert $
is the vector length of $ {v}_2 $
. This score is bounded between 0 and 1 with a lower score indicating lower similarity.
$ {v}_2 $
. This score is bounded between 0 and 1 with a lower score indicating lower similarity.
We retrieve from WRDS SEC Analytic Suite the cosine measures constructed based on the entire 10-K documents.Footnote 5 We use the same method to construct cosine measures for individual items in 10-Ks. Other qualitative measures, such as log file size and tone optimism, are also constructed based on 10-Ks following the method of Loughran and McDonald (Reference Loughran and McDonald2011), (Reference Loughran and McDonald2014). Figure 1 shows the time pattern of average annual report cosine similarity for our sample firms. Year-to-year similarity in 10-K filings exhibits a clear upward trend, consistent with the findings in Brown and Tucker (Reference Brown and Tucker2011) based on a smaller sample.Footnote 6
Figure 1 shows the time-series pattern of annual cosine similarity measures averaged across all sample firms. The cosine similarity measure for a firm quantifies textual changes between the current year’s 10-K and the prior year’s 10-K. A lower value implies more year-to-year textual changes.

C. Summary Statistics
Table 1 presents the descriptive statistics for the main variables. Consistent with prior studies (Xing et al. (Reference Xing, Zhang and Zhao2010)), the post-release option volatility smirks are on average positive at around 5%. The year-to-year changes in option volatility smirks exhibit a slightly negative mean (–0.047%) and median (–0.149%), indicating a modest decrease on average after the release of 10-K filings. However, there are considerable variations in smirk changes across firm-years with a high standard deviation of 7.134%. Our primary explanatory variable is the annual report cosine similarity with a mean of 0.971 and a median of 0.988.Footnote 7

We also report two other variables related to 10-K filings. The first is tone optimism, which represents the number of Loughran–McDonald positive words minus negative words scaled by the total number of words in a filing. The second variable is log file size, which denotes the logarithm of the total number of words in a 10-K filing. Overall, the file tone measure is slightly negative, indicating that managers tend to adopt a neutral or slightly pessimistic tone in their 10-K reports.
IV. Empirical Design and Main Results
In this section, we present our research design, main empirical results, and robustness checks. We also conduct additional analyses to explore the mechanism driving our key results.
A. Baseline Results
We use both sorting and Fama–MacBeth regressions to examine the response of option volatility smirks to 10-K textual changes. Sorting relies less on parametric assumptions, and Fama–MacBeth regressions allow us to control for various firm-level characteristics that may impact options trading.
We first sort all firms by the annual report cosine similarity into quintile groups and compare average changes in volatility smirks between the top and bottom quintiles. Note that Q1 (Q5) consists of firms with the most (least) textual changes to 10-Ks. Table 2 presents the sorting results. The average changes for Q1 are positive, suggesting an increase in volatility smirk for firms with the most textual changes. By contrast, we find the opposite for Q5. The equal- and value-weighted spreads in volatility smirk changes are –0.299 and –0.361, respectively. These are around 2–2.5 times the median volatility smirk change and are statistically significant for both equal- and value-weighted portfolios. Hence, these results are consistent with Hypothesis 1 that options traders buy more OTM put options on firms with more textual changes.

We next examine the effect of 10-K textual changes on volatility smirks using the following Fama–MacBeth regression model:
 $$ \Delta {Smirk}_{it}={\beta}_0+{\beta}_1{Cosine}_{it}+\phi {X}_{it}+{\varepsilon}_{it}, $$
where $ i $
indexes a company and
$ i $
indexes a company and $ t $
indexes a certain fiscal year.
$ t $
indexes a certain fiscal year. $ \Delta Smirk $
is the option volatility smirk right after the 10-K release minus the option volatility smirk at least 8 weeks before the release date.Footnote
8
$ \Delta Smirk $
is the option volatility smirk right after the 10-K release minus the option volatility smirk at least 8 weeks before the release date.Footnote
8 $ Cosine $
, our main variable of interest, is the cosine similarity between the current and previous fiscal year’s 10-Ks. As a lower such cosine similarity implies more textual changes to 10-Ks, which on average contain more negative information regarding future stock returns and firm fundamentals, we expect a negative sign of the estimated coefficient
$ Cosine $
, our main variable of interest, is the cosine similarity between the current and previous fiscal year’s 10-Ks. As a lower such cosine similarity implies more textual changes to 10-Ks, which on average contain more negative information regarding future stock returns and firm fundamentals, we expect a negative sign of the estimated coefficient $ {\beta}_1 $
.
$ {\beta}_1 $
.
The control variables, $ X $
, include log file size, tone optimism, log market cap, book-to-market, 1-year stock return, ROA, cash, CAPEX, and tangibility. All variables are measured at the previous fiscal year-end. Prior research shows that these firm characteristics could also induce options market reactions and are likely correlated with 10-K textual changes (Ertugrul, Lei, Qiu, and Wan (Reference Ertugrul, Lei, Qiu and Wan2017), Cohen et al. (Reference Cohen, Malloy and Nguyen2020)). Large and mature firms tend to have relatively stable operations, lower information asymmetry, and therefore lower downside risk. Firms with high book-to-market and tangible-to-total assets ratios are likely more transparent and easier to value. These firms are, therefore, less likely to experience widening of volatility smirks driven by investors with information advantages. Moreover, cash holdings and investment expenditures may also affect firm risk, though the direction likely depends on investment efficiency (Cheng, Gawande, and Qi (Reference Cheng, Gawande and Qi2021)).
$ X $
, include log file size, tone optimism, log market cap, book-to-market, 1-year stock return, ROA, cash, CAPEX, and tangibility. All variables are measured at the previous fiscal year-end. Prior research shows that these firm characteristics could also induce options market reactions and are likely correlated with 10-K textual changes (Ertugrul, Lei, Qiu, and Wan (Reference Ertugrul, Lei, Qiu and Wan2017), Cohen et al. (Reference Cohen, Malloy and Nguyen2020)). Large and mature firms tend to have relatively stable operations, lower information asymmetry, and therefore lower downside risk. Firms with high book-to-market and tangible-to-total assets ratios are likely more transparent and easier to value. These firms are, therefore, less likely to experience widening of volatility smirks driven by investors with information advantages. Moreover, cash holdings and investment expenditures may also affect firm risk, though the direction likely depends on investment efficiency (Cheng, Gawande, and Qi (Reference Cheng, Gawande and Qi2021)).
Table 3 presents the Fama–MacBeth regression results. Column 1 includes only the cosine similarity measure, and column 2 adds tone optimism and log file size to control for the effects of other textual information. Column 3 is our main specification and includes firm-level financial variables as additional controls. The estimated effect of textual changes is very similar across different specifications. The coefficient estimates of the cosine measure are all negative and statistically significant at the 1% level. This confirms that more textual changes (proxied by a lower cosine measure) are associated with larger increases in option volatility smirks. Regarding the economic magnitude, if the cosine measure decreases from the 90th percentile (0.998) to the 10th percentile (0.924), the coefficient in column 3 would imply a twofold increase in the change of option volatility smirks relative to the sample median. This magnitude is quite similar to the one obtained in the sorting analysis.

As to control variables, most of the firm-level financial variables do not bear a significant relation with changes in option volatility smirks. Consistent with our conjecture, we find that firms with higher book-to-market ratios and more tangible assets tend to have significantly smaller smirk changes. Because the estimated effects of these control variables are very similar across regressions, we omit reporting them in the following tables for brevity.
We conduct several additional tests to ensure that our results are robust to alternative measures of textual changes and econometric specifications. Despite being widely used in measuring textual similarity, the cosine measure is subject to the criticism that it does not have the triangle inequality property and violates the coincidence axiom. To address such concerns, we use three alternative measures of annual report similarity: Jaccard similarity, modified Jaccard similarity, and minimum edit distance. More textual changes to 10-Ks are associated with lower Jaccard or modified Jaccard similarity but higher minimum edit distance. Table A3 in the Supplementary Material presents the Fama–MacBeth regression results, which are consistent with the findings in Table 3. Option volatility smirk changes are negatively related to Jaccard or modified Jaccard similarity and positively related to minimum edit distance. All of the estimated effects are statistically significant at the 1% level. Therefore, our baseline results are robust to alternative measures of textual similarity.
To ensure that our findings are not affected by unobserved industry and time factors, we estimate pooled regressions with industry (4-digit SIC code) and year fixed effects. We cluster standard errors at the firm level. Table A4 in the Supplementary Material reports the estimation results. Consistent with the baseline results in Table 3, more textual changes to 10-Ks are associated with larger option volatility smirk changes. The coefficients of the cosine measure are statistically significant at the 5% level. Moreover, the magnitudes of estimated coefficients are similar to those obtained from Fama–MacBeth regressions.
B. Timing of Changes in Volatility Smirks
To provide further evidence on the timing of changes in volatility smirks, we conduct the Fama–MacBeth regression in equation (1) for each week during the 8-week period before and after the 10-K release. To reduce missing observations, we use the option volatility smirk on the day closest to the 10-K release date in a given week as the weekly measure ( $ {Smirk}_{wt} $
). Then, we compute the weekly change in option volatility smirk (
$ {Smirk}_{wt} $
). Then, we compute the weekly change in option volatility smirk ( $ \Delta {Smirk}_{wt} $
) as the difference between the weekly smirk (
$ \Delta {Smirk}_{wt} $
) as the difference between the weekly smirk ( $ {Smirk}_{wt} $
) and the baseline smirk measured at least 8 weeks before the 10-K release date (
$ {Smirk}_{wt} $
) and the baseline smirk measured at least 8 weeks before the 10-K release date ( $ `` Baseline\ Smirk" $
):
$ `` Baseline\ Smirk" $
): $ \Delta {Smirk}_{wt}={Smirk}_{wt}- Baseline\ Smirk $
.Footnote
9
$ \Delta {Smirk}_{wt}={Smirk}_{wt}- Baseline\ Smirk $
.Footnote
9
Table 4 presents the weekly Fama–MacBeth regression results. Panel A reports the responses in option volatility smirks to textual changes during weeks before and after the 10-K release, respectively. In general, the coefficients of cosine measure have smaller magnitude and lack statistical significance during prerelease weeks. By contrast, the coefficients are much larger in magnitude and statistically significant during each of the first 7 weeks after the 10-K release. This suggests that the significant relation between option volatility smirks and 10-K textual changes is mainly driven by postrelease trading.

Note that the response in option volatility smirks to 10-K textual changes in week [–2] is statistically significant and has a magnitude comparable to the postrelease responses. One interpretation is that some options traders have access to proprietary information before the public release. Although we cannot rule out the possibility of informed trading based on private information, it is difficult to reconcile with why such trading occurs in week [–2] but not in week [–1] or other weeks. A more plausible explanation is that the spike in trading activity stems from a separate information event that coincides with the content later disclosed in the 10-K filing. This is likely because many firms disclose their fourth-quarter earnings approximately 2 weeks before releasing their 10-Ks. As extensively documented in the accounting and finance literature (e.g., Amin and Lee (Reference Amin and Lee1997), Campbell, Ramadorai, and Schwartz (Reference Campbell, Ramadorai and Schwartz2009), Truong and Corrado (Reference Truong and Corrado2014), and Barron, Schneible, and Stevens (Reference Barron, Schneible and Stevens2018)), trading around earnings announcements is often heavy in both the stock and options markets, driven by the anticipation and arrival of new information about a firm’s profitability. The subsequent 10-K filing contains more detailed financial results and price-relevant information that can help investors better understand the earnings result. This drives additional trading during the post 10-K release weeks.
To test this explanation, we exclude firms reporting their fourth quarter earnings within 2 weeks before 10-K releases and re-estimate the weekly Fama–MacBeth regressions. As shown in Panel B of Table 4, the cosine coefficient for week [–2] is now much smaller in magnitude and no longer statistically significant. By contrast, the postrelease cosine coefficients remain large and statistically significant for most weeks. This finding helps address concerns that option volatility smirk changes might be driven by pre-10-K release trading activity. The overall evidence thus supports our hypothesis that options investors gain a competitive advantage through their superior skill in processing public information.
C. Mechanism
Our hypothesis about the relation between textual changes in 10-K filings and changes in option volatility smirks relies on several implicit assumptions. These assumptions are grounded in existing literature on the informational content of 10-K textual changes and the determinants of option volatility smirks. In this section, we present additional evidence to support the proposed mechanism.
The key assumption is that 10-K textual changes typically signal negative information about a firm’s profitability, leading sophisticated investors to increase their demand for OTM put options.Footnote 10 Cohen et al. (Reference Cohen, Malloy and Nguyen2020) provide evidence that greater textual changes predict negative news, including lower future earnings and a higher likelihood of bankruptcy. It is plausible, however, that not all textual changes convey negative news. If options traders truly possess superior information processing skills, then volatility smirk increases should primarily stem from textual changes containing new negative information.
Our first test examines whether it is the negative information that drives the relation between cosine measures and volatility smirk changes in Table 3. Following Cohen et al. (Reference Cohen, Malloy and Nguyen2020), we measure the negative sentiment of changes by calculating the ratio of negative words to total words in the changed text.Footnote 11 This measure serves as our proxy for negative news content in textual changes. After dividing our sample at the median value of negative sentiment measure, we run the regression in Table 3 separately for each subsample. As reported in Table 5, the coefficient of cosine measure is much more negative and statistically significant only for the subsample with above-median changes in negative sentiment. In other words, greater textual changes predict increased volatility smirks only when 10-K filing reveals substantially negative information.

We next test whether more textual changes lead to higher demand for OTM put options. Following Lakonishok, Lee, Pearson, and Poteshman (Reference Lakonishok, Lee, Pearson and Poteshman2007), we compute delta-adjusted open interest by multiplying an option’s open interest by its delta and dividing the result by the number of outstanding shares of the underlying stock. This adjustment converts open interest into equivalent underlying shares and normalizes it by the total shares outstanding. We then average the delta-adjusted open interest across all OTM put options on the first day after the 10-K release. Table 6 reports the Fama–MacBeth regression results on the relation between the delta-adjusted open interest and the cosine measure. As shown in column 1 for the full sample, the coefficient of cosine is negative and statistically significant, confirming that greater textual changes are associated with higher open interest for OTM put options. Columns 2 and 3 report regression results for above- and below-median negative sentiment subsamples, respectively. The results indicate that the positive relation is primarily driven by textual changes containing substantially negative information. These findings align with our volatility smirk change results reported in Table 5.

The results in Tables 5 and 6 suggest that negative information disclosed through 10-K textual changes increases the demand for OTM puts, subsequently resulting in higher option prices (as reflected by implied volatility). However, if competitive market makers can perfectly hedge inventory risk, the option supply curves are essentially flat and option prices are determined by no-arbitrage conditions, irrespective of demand pressure. Upward-sloping supply curves will arise if market makers are risk averse and unable to hedge perfectly. Bollen and Whaley (Reference Bollen and Whaley2004) is the first paper to empirically link changes in demand to changes in option prices via limits to arbitrage. Increased demand for certain options results in higher prices to compensate market makers for the elevated hedging risk they bear. As market makers gradually rebalance their portfolios and/or demand pressure subsides, option prices revert at least partially to their previous levels.
Motivated by the findings in Bollen and Whaley (Reference Bollen and Whaley2004), Gârleanu, Pedersen, and Poteshman (Reference Gârleanu, Pedersen and Poteshman2009) formally develop a demand-based option pricing model in which competitive, risk-averse dealers cannot hedge perfectly. The market incompleteness could be driven by various factors, including discrete trading, stochastic volatility, jump risk, and transaction costs. The model predicts that equilibrium option prices increase with demand pressure from end-users. Essentially, higher prices reflect the premium required by market makers to supply the volume of options contracts demanded by end-users. The model remains agnostic regarding the sources of end-users’ demand pressure—whether motivated by hedging or driven by information. The magnitude and duration of these demand-based price effects depend on the nature of market incompleteness, which in turn determines the speed at which market makers rebalance their inventory positions.Footnote 12
The evidence of our article is broadly consistent with Bollen and Whaley (Reference Bollen and Whaley2004) and Gârleanu et al. (Reference Gârleanu, Pedersen and Poteshman2009). In Table 4, we examine changes in option volatility smirks during the 8-week period following the 10-K release. To examine the longer term behavior of volatility smirks, we extend the window to 13 weeks in Table A7 in the Supplementary Material, covering approximately one quarter following the 10-K release. We limit the postrelease horizon to one quarter to avoid any confounding information events, such as new earnings announcement, that may affect option prices. As shown in Table 4 and Table A7 in the Supplementary Material, the coefficients for cosine measure are negative and statistically significant for the first 7 weeks and become statistically insignificant after week 8.Footnote 13 This suggests that the price impact on OTM puts, driven by informed options traders’ demand, persists for several weeks before reverting to pre-10-K release levels. The evidence thus supports the limits-to-arbitrage interpretation, as it takes time for options market makers to rebalance their inventory and/or to attract more market makers to provide liquidity in response to increased demand pressure.
Our final test examines how options trading responds to textual similarities in 10-K filings. If higher textual similarity (fewer textual changes) signals nonnegative or positive news, we expect stronger demand for bullish call options relative to protective puts. This, in turn, should lead to higher implied volatility for calls compared to puts. Similar to the baseline model, we measure the change in reverse volatility smirk from the first day after the 10-K release and the baseline day, which is set at least 8 weeks before the release. Table A6 in the Supplementary Material reports the Fama–MacBeth regression results on the relation between reverse volatility smirks and cosine measures. The coefficients of the cosine measure are positive and statistically significant at the 10% level.Footnote 14 This suggests that higher textual similarities in 10-K filings predict larger increases in reverse volatility smirks. The result contrasts with the changes in volatility smirks reported in Table 3. The evidence is thus consistent with informed investors buying OTM call options to trade on positive signals indicated by minimal or no textual changes in 10-K filings.
In summary, we find that negative information in 10-K textual changes leads to an increase in option volatility smirks. This reflects options traders buying more OTM put options in response to negative news extracted from 10-K textual changes. These results support our conjecture that sophisticated options traders have superior skills in processing public yet complex information disclosed in EDGAR filings.
V. Heterogeneous Effects of Textual Changes
In this section, we explore whether the effects of 10-K textual changes on options trading vary by specific reporting items and across firms with differing information environments and arbitrage constraints. This analysis sheds light on how options traders respond to various types of textual information and diverse trading opportunities.
A. Textual Changes by Reporting Items
We first explore whether textual changes in the product market description segment, usually displayed in Item 1 (Business) of 10-Ks, are related to options trading. Hoberg et al. (Reference Hoberg, Phillips and Prabhala2014) show that product market descriptions contain useful information on the firm’s competitive position in the industry, in addition to the standard industry classification codes. We utilize two measures of product market fluidity developed by Hoberg et al. (Reference Hoberg, Phillips and Prabhala2014) to capture changes in own and competitors’ product descriptions, respectively. To ensure consistent interpretation of textual change coefficient, we use 1 minus the product market fluidity measure in regressions so that lower values reflect greater textual changes in product descriptions. Accordingly, a negative coefficient suggests that more such changes are associated with steeper volatility smirks. Table 7 reports the Fama–MacBeth regression results with the product description similarity measures. We find that greater textual changes to a firm’s own product descriptions are associated with larger increases in option volatility smirks. In contrast, changes in competitors’ product descriptions have a limited impact on volatility smirk movements.

Next, we examine textual changes across different items in 10-K filings, acknowledging that managers have varying levels of discretion over specific sections. For example, Cohen et al. (Reference Cohen, Malloy and Nguyen2020) document that firms’ reporting changes are mainly concentrated in Item 7 (Management’s Discussion and Analysis), Item 3 (Legal Proceedings), Item 7a (Quantitative and Qualitative Disclosures about Market Risk), and Item 1a (Risk factors). We expect changes in these discretionary items to be more informative and, therefore, to have a greater impact on options trading. To test this, we construct cosine similarity measures for each item based solely on the textual content within the respective section.
Table 8 shows the coefficients of cosine measures estimated from equation (1) for four 10-K items: Item 7, Item 3, Item 7a, and Item 1a.Footnote 15 Consistent with the strong return predictability documented by Cohen et al. (Reference Cohen, Malloy and Nguyen2020), we find that option volatility smirks respond more strongly to textual changes in these discretionary 10-K items. Moreover, the average cosine coefficient for these four items is significantly larger in magnitude compared to other sections of the 10-K. This difference is statistically significant at the 1% level.Footnote 16 These findings support our Hypothesis 2a, suggesting that options traders actively respond to textual changes in parts of the 10-K that are both more informative about firms’ fundamentals and more subject to managerial discretion.

B. Information Environments
Previous studies find that the predictive power of option expensiveness for future stock returns is particularly pronounced among firms with higher levels of information asymmetry (Hu (Reference Hu2014)). This is because option traders are more likely to profit from information advantages in firms with more diverse investor opinions. Therefore, we expect that option volatility smirks will react more strongly to 10-K textual changes for these firms.
Drawing from the existing literature, we use the following two measures to proxy for information asymmetry: abnormal idiosyncratic volatility (AIV) and analyst coverage. Morck, Yeung, and Yu (Reference Morck, Yeung and Yu2000) and Durnev, Morck, and Yeung (Reference Durnev, Morck and Yeung2004) relate the idiosyncratic volatility (IV) of stock returns to firm-specific information flows. To isolate abnormal price variation stemming from informed trading, Yang et al. (Reference Yang, Zhang and Zhang2020) propose the AIV measure, defined as the IV prior to information events in excess of its normal levels. Specifically, we compute AIV as the difference between IV measured during preearnings-announcement windows and IV measured during nonearnings-announcement periods using daily returns for each fiscal year. Following Yang et al. (Reference Yang, Zhang and Zhang2020), we define the preearnings-announcement periods as the 5 business days preceding each of the four earnings announcement dates. The nonearnings-announcement periods comprise all days excluding the 11-day window surrounding each earnings announcement. Our next measure is analyst coverage (Hu (Reference Hu2014)), defined as the number of analysts following a firm, with data sourced from IBES. We compute these variables at the end of the previous fiscal year and partition the sample into high and low information asymmetry groups based on their respective median values.
Table 9 reports the regression results based on equation (1), estimated separately for the high versus low information asymmetry subsamples. The coefficients for the cosine measure are consistently negative but statistically significant only for firms characterized by high AIV and low analyst coverage. Hence, an increase in textual changes leads to significantly higher volatility smirk only among firms with greater information asymmetry. This finding is consistent with the conjecture in Hypothesis 2b.

C. Short-Sale Constraints
Options trading is not the only way sophisticated investors can exploit negative information in 10-K textual changes. Short selling offers informed traders another method to express bearish views. However, unlike options trading on centralized exchanges, the securities lending market is fragmented, and even large institutions often face high borrowing costs or may be unable to secure shares to borrow. Hence, informed investors are more likely to rely on options when short-sale constraints are binding. Consistent with this, Hu (Reference Hu2014) finds that options trading conveys more information about future stock prices for firms facing greater short-sale constraints. We conjecture in Hypothesis 2b that the effect of 10-K textual changes on option volatility smirks is stronger when short-sale constraints are more severe.
Following D’Avolio (Reference D’Avolio2002), Asquith, Pathak, and Ritter (Reference Asquith, Pathak and Ritter2005), and Hu (Reference Hu2014), we use institutional ownership as a proxy for short-selling costs. This is because lower institutional ownership is often associated with substantially higher costs for short sellers. We divide the sample into high-cost and low-cost groups based on the median of fiscal-year-end institutional ownership and estimate equation (1) separately for each group. Table 10 presents the regression results. The coefficient estimates of the cosine similarity measure are negative and statistically significant for both groups. However, the effect of 10-K textual changes is approximately four times larger for the high-cost group compared to the low-cost group. This finding supports that informed investors rely more on OTM puts to trade on negative information for firms facing greater short-sale constraints.

VI. Return Predictability of Textual Changes and Option Volatility Smirk Changes
Our tests thus far have focused exclusively on stocks with tradable options, assuming that informed investors prefer trading options. However, informed investors can also trade directly in the stock market, which is particularly relevant for stocks without tradable options. The presence of informed trading in either or both markets can have different implications for the lazy-prices effect between optionable and nonoptionable stocks. In this section, we extend Cohen et al. (Reference Cohen, Malloy and Nguyen2020) by examining the “lazy prices” phenomenon separately for stocks with and without tradable options. We also expand the return predictability test to include option volatility smirk changes in addition to 10-K textual changes.
To examine whether the lazy-prices effect depends on the availability of tradable options, we follow a procedure similar to Flippou, Garcia-Ares, and Zapatero (Reference Flippou, Garcia-Ares and Zapatero2022) and match stocks with and without options based on industry, size, trading volume, and return volatility. For each optionable stock, we identify matched nonoptionable stocks that have similar average market capitalization, trading volume, and return volatility during the 12-month period before the optionable stock begins option trading. Specifically, we require the distance between the optionable stock and the matched nonoptionable stock to be less than 10% of the standard deviation of the predicted propensity scores.Footnote 17 We then require the matched nonoptionable stocks to be in the same sector based on the Fama–French 48 industry classifications and retain the three stocks with the nearest propensity scores.
We construct quintile portfolios based on 10-K textual changes, separately for optionable and nonoptionable stocks. Following Cohen et al. (Reference Cohen, Malloy and Nguyen2020), we compute monthly quintiles using the prior month’s distribution of cosine similarity measures. Stocks enter the portfolio 1 month after their 10-K release and remain for 9 months. Portfolios are rebalanced monthly, and value-weighted returns (multiplied by 100) are calculated. Portfolio performance is evaluated using excess returns, as well as alphas from Fama–French three-factor (market, size, and value), four-factor (market, size, value, and momentum), and five-factor (market, size, value, momentum, and liquidity) models.Footnote 18 Quintile 1 (Q1) contains firms with the lowest similarity between current and prior 10-Ks, while Quintile 5 (Q5) includes those with the highest similarity. “Q5 – Q1” represents a long–short portfolio that takes a long position in Q5 and a short position in Q1.
The results in Table 11 show that, consistent with the prediction in Hypothesis 3a, the lazy-prices effect is primarily driven by optionable stocks and is insignificant for stocks without options. As shown in Panel A, the average risk-adjusted returns for Q1 are all negative and statistically significant at the 1% level. This suggests that more textual changes predict lower future returns for optionable stocks. The long–short portfolio generates on average 46–58 basis points abnormal return per month, statistically significant at the 5% level. In contrast, for nonoptionable stocks in Panel B, the risk-adjusted returns for Q1 and the long–short portfolio are no longer statistically significant. The absence of a lazy-prices effect for stocks without options suggests that when options trading is unavailable, more informed trading based on textual changes occurs directly in the stock market. Such trading leads to a faster stock price adjustment to new information in textual changes and therefore attenuates the lazy-prices effect. The contrasting result for optionable stocks suggests that informed investors prefer to trade on negative information using OTM put options (Black (Reference Black1975), Easley et al. (Reference Easley, O’Hara and Srinivas1998)) and that limited arbitrage contributes to a delayed stock price response to 10-K textual changes.

One remaining question is why sophisticated stock market investors appear to overlook the information embedded in option quotes. Notably, this information transfer does not rely on active arbitrage between the two markets; instead, it hinges on the attentive monitoring of option signals by stock market makers. We attribute this phenomenon to the lack of liquidity and price noise prevalent in many individual equity options. For example, Duarte, Jones, and Wang (Reference Duarte, Jones and Wang2024) document that most individual equity options trade infrequently, with the top quintile stocks accounting for approximately 90% of option trading volume. Moreover, options tend to have wide closing bid–ask spreads—averaging 12%–13% of the quote midpoint—compared to an average of 0.15% for the underlying stocks. Further, the spreads are particularly substantial for deep OTM options. Consequently, the excessive noise inherent in OTM put prices may impede the ability of stock market makers to extract informative signals from changes in volatility smirk.
We acknowledge that the extent of informational segmentation likely depends on the precision of price signals. Extant research shows that firm size is an important determinant of option liquidity (Christoffersen, Goyenko, Jacobs, and Karoui (Reference Christoffersen, Goyenko, Jacobs and Karoui2018))—larger firms generally have more actively traded options and receive more intensive monitoring from market participants. We therefore conjecture that information dissemination from options to stock markets is more efficient for large-cap stocks. To test this prediction, we sort optionable stocks into large- and small-cap groups based on the median fiscal-year-end market capitalization and examine the lazy-prices effect for each subsample. In addition, we distinguish between S&P 500 and non-S&P 500 stocks, expecting the lazy-prices effect to be stronger for small-cap and non-S&P 500 stocks.
Table 12 presents the results. As shown in Panel A, there is no significant difference in returns between Q1 and Q5 for large-cap stocks. In contrast, Panel B shows that Q1 significantly underperforms Q5 by about 60 bps per month in risk-adjusted returns for small-cap stocks. A similar pattern manifests in Panels C and D, where the effect is significant only for non-S&P 500 stocks. These findings suggest that the lazy-prices effect is most evident in less transparent segments, where pervasive price noise and limited monitoring compromise price discovery.

Next, we examine whether the return predictability of 10-K textual changes is stronger for stocks with larger changes in option volatility smirks. Cohen et al. (Reference Cohen, Malloy and Nguyen2020) show that textual changes have strong predictive power on future stock returns up to 6 months after the 10-K release, and the effect exhibits no reversal. Xing et al. (Reference Xing, Zhang and Zhao2010) find similar return predictability for option volatility smirks. Our baseline result suggests that more textual changes predict a significant increase in volatility smirk immediately after the 10-K release. If textual changes indeed convey negative information on firm fundamentals that motivates options trading, these changes should have stronger predictive power for future stock returns when accompanied by larger increases in option volatility smirks.
We double-sort stocks into portfolios based on the prior month’s distribution of similarity measures and changes in volatility smirks. Stocks are sorted into quintile groups based on the same procedure as in Table 11. In addition, we independently sort stocks into high-smirk (HS) and low-smirk (LS) change groups, where “high” versus “low” is relative to the median change of volatility smirk after the 10-K release. For each of the 2-by-5 portfolios, we report value-weighted portfolio excess returns and alphas estimated using various factor models across 1-, 3-, 6-, 9-, and 12-month horizons.
Table 13 presents the results of the double-sorted portfolio analysis. We observe that stocks with low volatility smirk changes tend to outperform those with high smirk changes. In particular, within the low cosine (Q1) group, HS stocks underperform LS stocks across all horizons. The difference becomes statistically significant for the 6-, 9-, and 12-month horizons. For example, HS stocks underperform LS stocks by 2%–3% for the 12-month period. This finding aligns with Xing et al. (Reference Xing, Zhang and Zhao2010) that the shape of volatility smirk has significant cross-sectional predictive power for future stock returns.

We are particularly interested in the Q1-HS portfolio (high textual changes and high smirk changes), which exhibits significantly negative alphas and underperforms other portfolios. Specifically, the Q1-HS portfolio significantly underperforms the Q5-LS portfolio (low textual changes and low smirk changes) across all horizons. The magnitude of underperformance grows from 50 to 70 bps over 1 month to 6%–7% over 12 months. By contrast, we find no significant difference between the Q1-LS and Q5-HS portfolios. This indicates that the underperformance of stocks with the most textual changes in 10-K filings is mainly driven by those that also exhibit the steepest increases in volatility smirks. Moreover, there is no evidence of return reversal, consistent with the conjecture that the combination of 10-K textual changes and higher volatility smirks contains new negative information regarding future firm performance.Footnote 19
Table 14 presents return predictability regressions that include both the cosine measure and the change in volatility smirk, along with an interaction term between the two. We examine return predictability across multiple time horizons. For each window, we present results first with only the cosine measure, then with the addition of the volatility smirk change and the interaction term.

The cosine measure yields positive and statistically significant coefficients (except for 1- and 3-month horizons), with the magnitude increasing over the predicative horizon up to 12 months following the 10-K release. This suggests that firms with more textual changes generally earn lower future returns. However, the statistical significance of the cosine measure disappears once we control for volatility smirk changes and the interaction term. In comparison, we find strong evidence that an increase in the volatility smirk predicts a significant decline in future returns. Moreover, the interaction term is positive and statistically significant, indicating that firms with both extensive textual changes and larger increases in the volatility smirk exhibit the most pronounced declines in future returns. This finding aligns with the double-sorted portfolio results in Table 13. Consistent with Hypothesis 3b, these results suggest that the joint signal from the cosine measure and volatility smirk changes provides a stronger indicator of negative news regarding future firm profitability.Footnote 20
In summary, our findings on return predictability are twofold. First, the “lazy prices” phenomenon documented by Cohen et al. (Reference Cohen, Malloy and Nguyen2020) appears to be primarily driven by stocks with tradable options. This suggests that informed investors prefer the options market to exploit their information advantage, while limited arbitrage delays the incorporation of this information into stock prices. Second, the predictive power of 10-K textual changes for future stock returns is especially pronounced when accompanied by substantial changes in option volatility smirks.
VII. Conclusions
This article investigates whether options traders demonstrate timely reactions to the negative public information contained in 10-K textual changes—in contrast to the “lazy prices” phenomenon documented for stock market investors in Cohen et al. (Reference Cohen, Malloy and Nguyen2020). We find that textual changes containing new negative information lead to a significant increase in option volatility smirks after the 10-K release, reflecting options traders’ concerns about future negative price movement. By contrast, the evidence on prerelease volatility smirk changes is largely muted. Collectively, the evidence suggests that options traders possess superior skills in processing information from public filings and extracting profitable trading signals, and these results are robust to different measures of annual report similarity as well as fixed effects panel regressions.
We next examine whether the effect of textual changes varies in informational content and across firms with different characteristics. We find that option volatility smirks respond more strongly to textual changes that are more informative about firm fundamentals and subject to more managerial discretion, for example, changes in sections on product market description, MD&A, Legal Proceedings, Quantitative and Qualitative Disclosures about Market Risk, and Risk Factors. Moreover, the effect is mainly concentrated among firms with higher information asymmetry and greater short-sale constraints.
Finally, we investigate the return predictability of 10-K textual changes and option volatility smirk changes. Our findings are twofold. First, the lazy-prices effect documented in Cohen et al. (Reference Cohen, Malloy and Nguyen2020) is mainly driven by optionable stocks. Our interpretation is that such stocks attract informed investors to the options market, which—coupled with limits to arbitrage—delays the incorporation of new information into stock prices. Second, we find that textual changes have a greater predictive power for future stock returns when accompanied by large increases in option volatility smirks. This suggests that textual changes combined with volatility smirk changes provide a more potent indicator of negative information regarding future firm profitability.
Taken together, our results demonstrate that sophisticated investors possess the ability to analyze complex 10-K textual changes and capitalize on these insights through options trading. This information advantage is particularly pronounced among firms with asymmetric information environments and high short-selling costs. Collectively, our study sheds light on the “lazy prices” phenomenon and highlights options traders’ superior ability to process public information.
Appendix. Variable Definitions
- Abnormal Idio. volatility:
-
Idiosyncratic volatility prior to information events in excess of its normal levels (Yang et al. (Reference Yang, Zhang and Zhang2020)). Source: Self-calculation.
- Analyst coverage:
-
The number of analysts covering the firm. Source: IBES.
- Book-to-market:
-
Total book value of assets scaled by market capitalization plus total liabilities. Source: Compustat.
- CAPEX:
-
Capital expenditure scaled by total assets. Source: Compustat.
- Cash:
-
Cash holding scaled by total assets. Source: Compustat.
- Cosine:
-
Cosine similarity of the current and previous fiscal years’ 10-Ks. Source: SEC Analytic Suite.
- Cosine (by items):
-
Cosine similarity of the same item in the current and previous fiscal years’ 10-Ks. Source: Self-calculation.
- File size:
-
The file size of the 10-Ks. Source: SEC Analytic Suite.
- Market cap:
-
Number of shares outstanding multiplied by stock price. Source: Compustat.
- Negative sentiment:
-
The ratio of negative words to total words in 10-K changes (Cohen et al. (Reference Cohen, Malloy and Nguyen2020)). Source: Self-calculation.
- Open interest:
-
Delta-adjusted open interest is calculated by multiplying an option’s daily open interest by its delta, then dividing by the number of outstanding shares of the underlying stock (Lakonishok et al. (Reference Lakonishok, Lee, Pearson and Poteshman2007)). Source: OptionMetrics.
- Return:
-
Stock returns in the previous 12 months. Source: Compustat.
- Reverse smirk:
-
Difference between the implied volatilities of out-of-the-money call options and implied volatilities of at-the-money put options. Reverse smirk change is computed in the same way as volatility smirk change. Source: OptionMetrics.
- ROA:
-
Net income scaled by total assets. Source: Compustat.
- SUE:
-
The difference between announced earnings and the latest consensus earnings forecast before the announcement, normalized by the standard deviation of the consensus earnings forecast. Source: IBES.
- Tangibility:
-
Total tangible assets scaled by total assets. Source: Compustat.
- Tone optimism:
-
Number of Loughran–McDonald positive words minus negative words scaled by the total words of 10-Ks. Source: SEC Analytic Suite.
- Volatility smirk:
-
Difference between the implied volatilities of out-of-the-money put options and implied volatilities of at-the-money call options. Source: OptionMetrics.
- Volatility smirk change:
-
Volatility smirk right after the 10-K release date minus the volatility smirk at least 8 weeks before the 10-K release date. Source: OptionMetrics.
Supplementary Material
To view supplementary material for this article, please visit http://doi.org/10.1017/S0022109026102804.

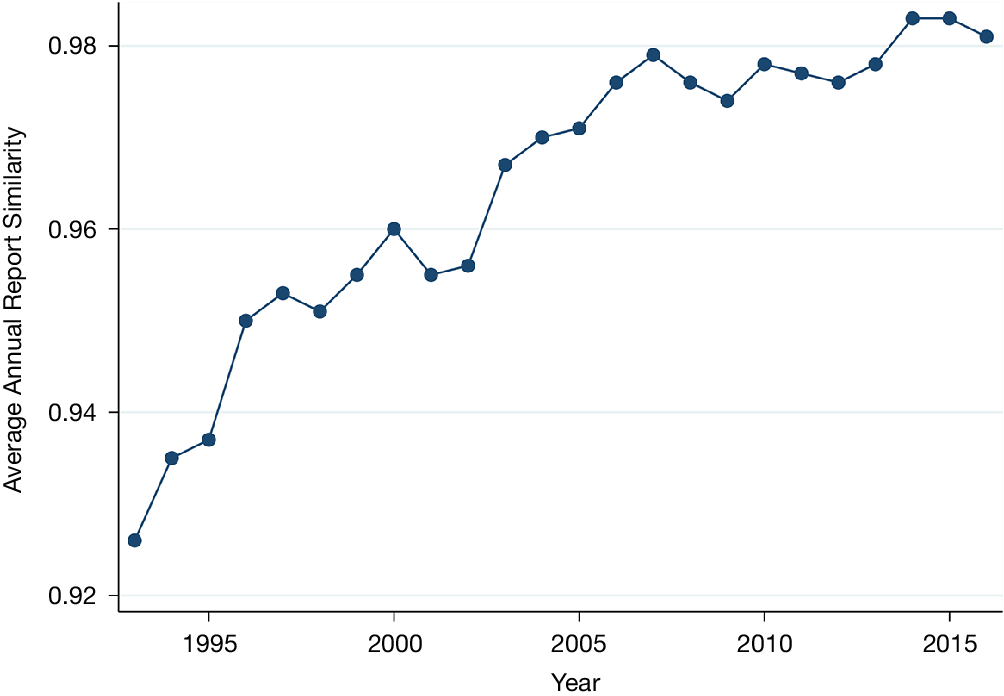
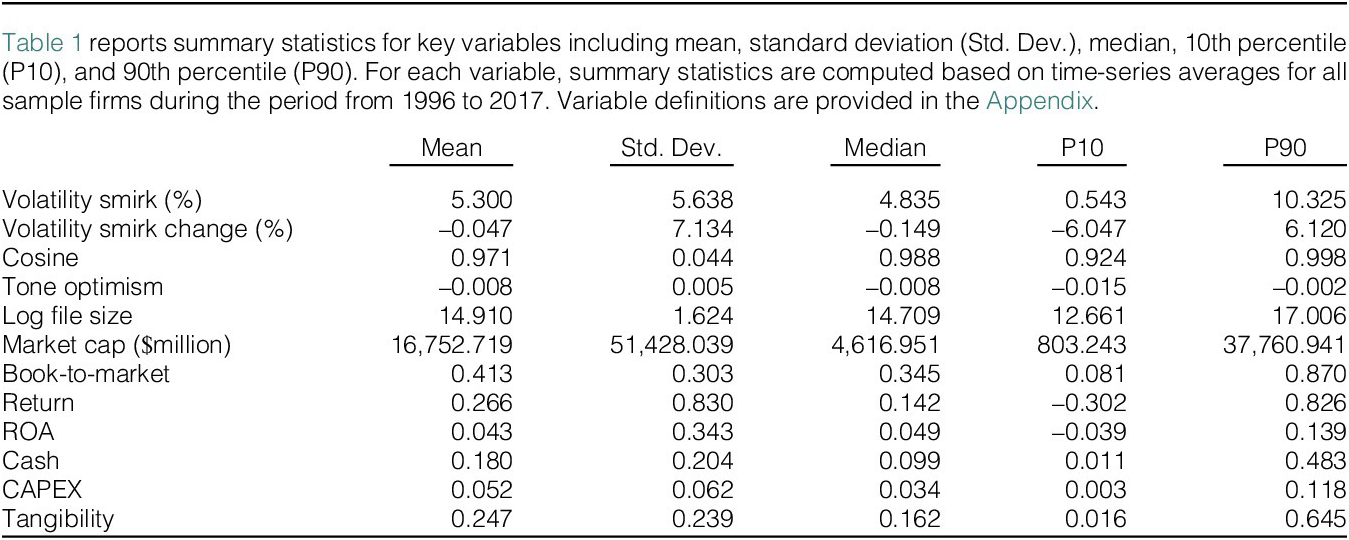
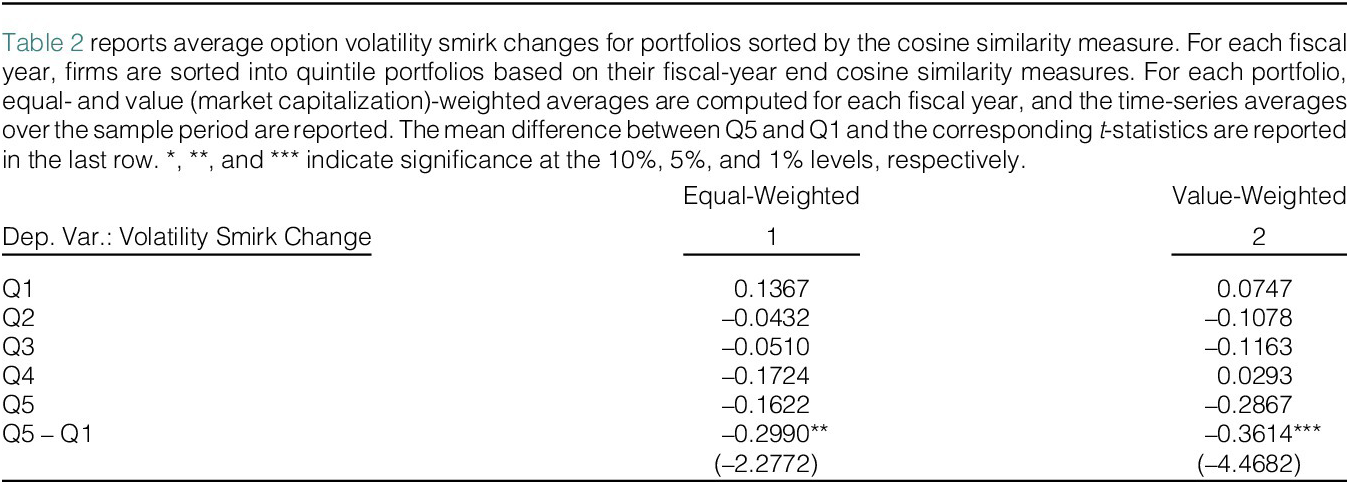
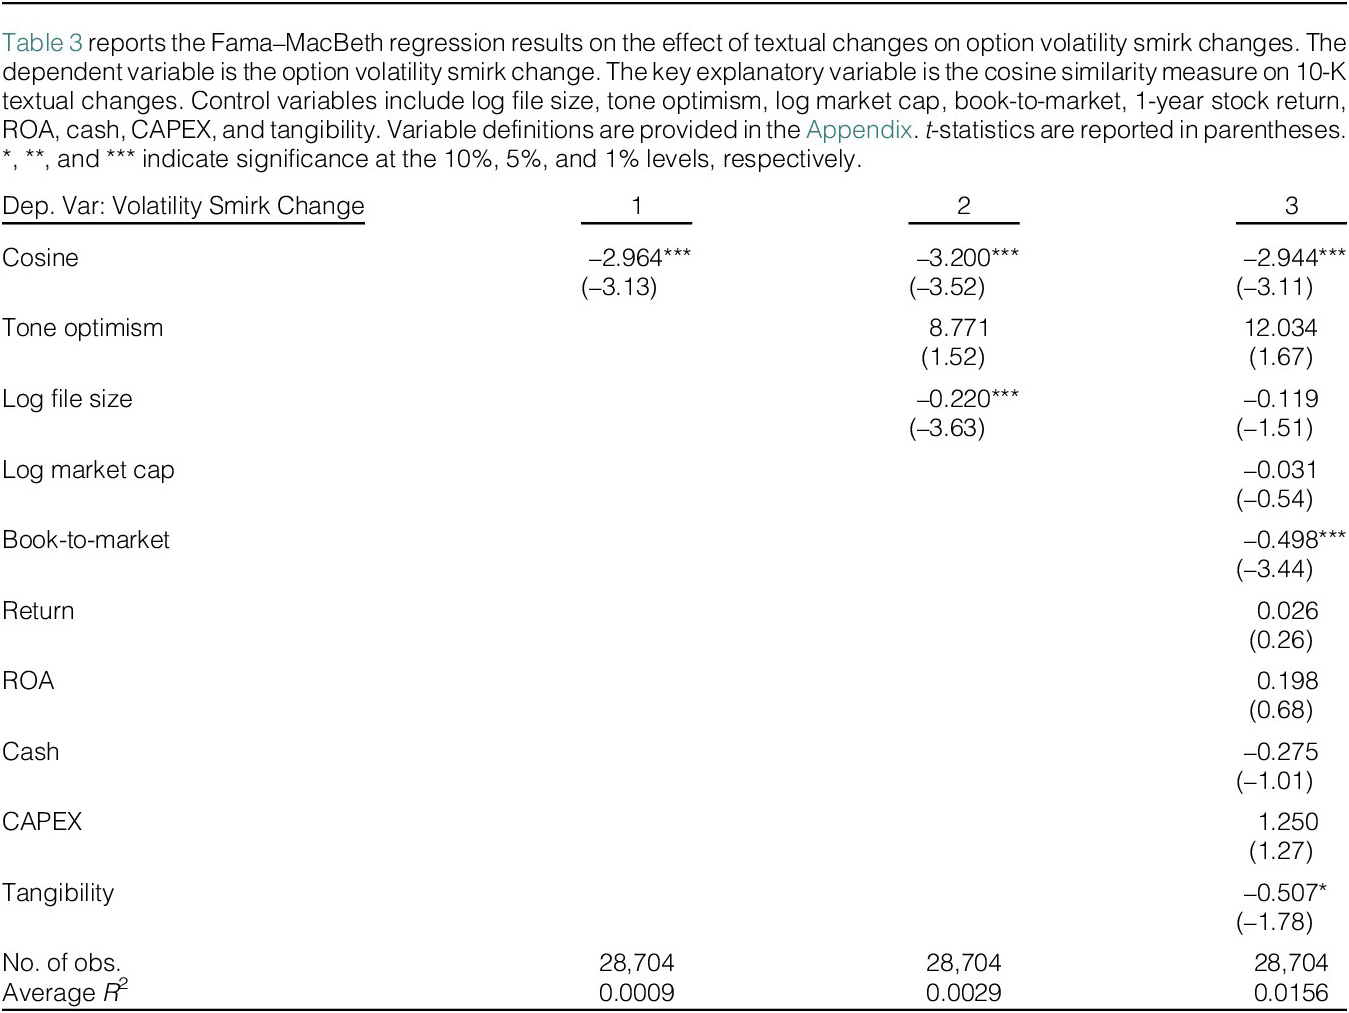
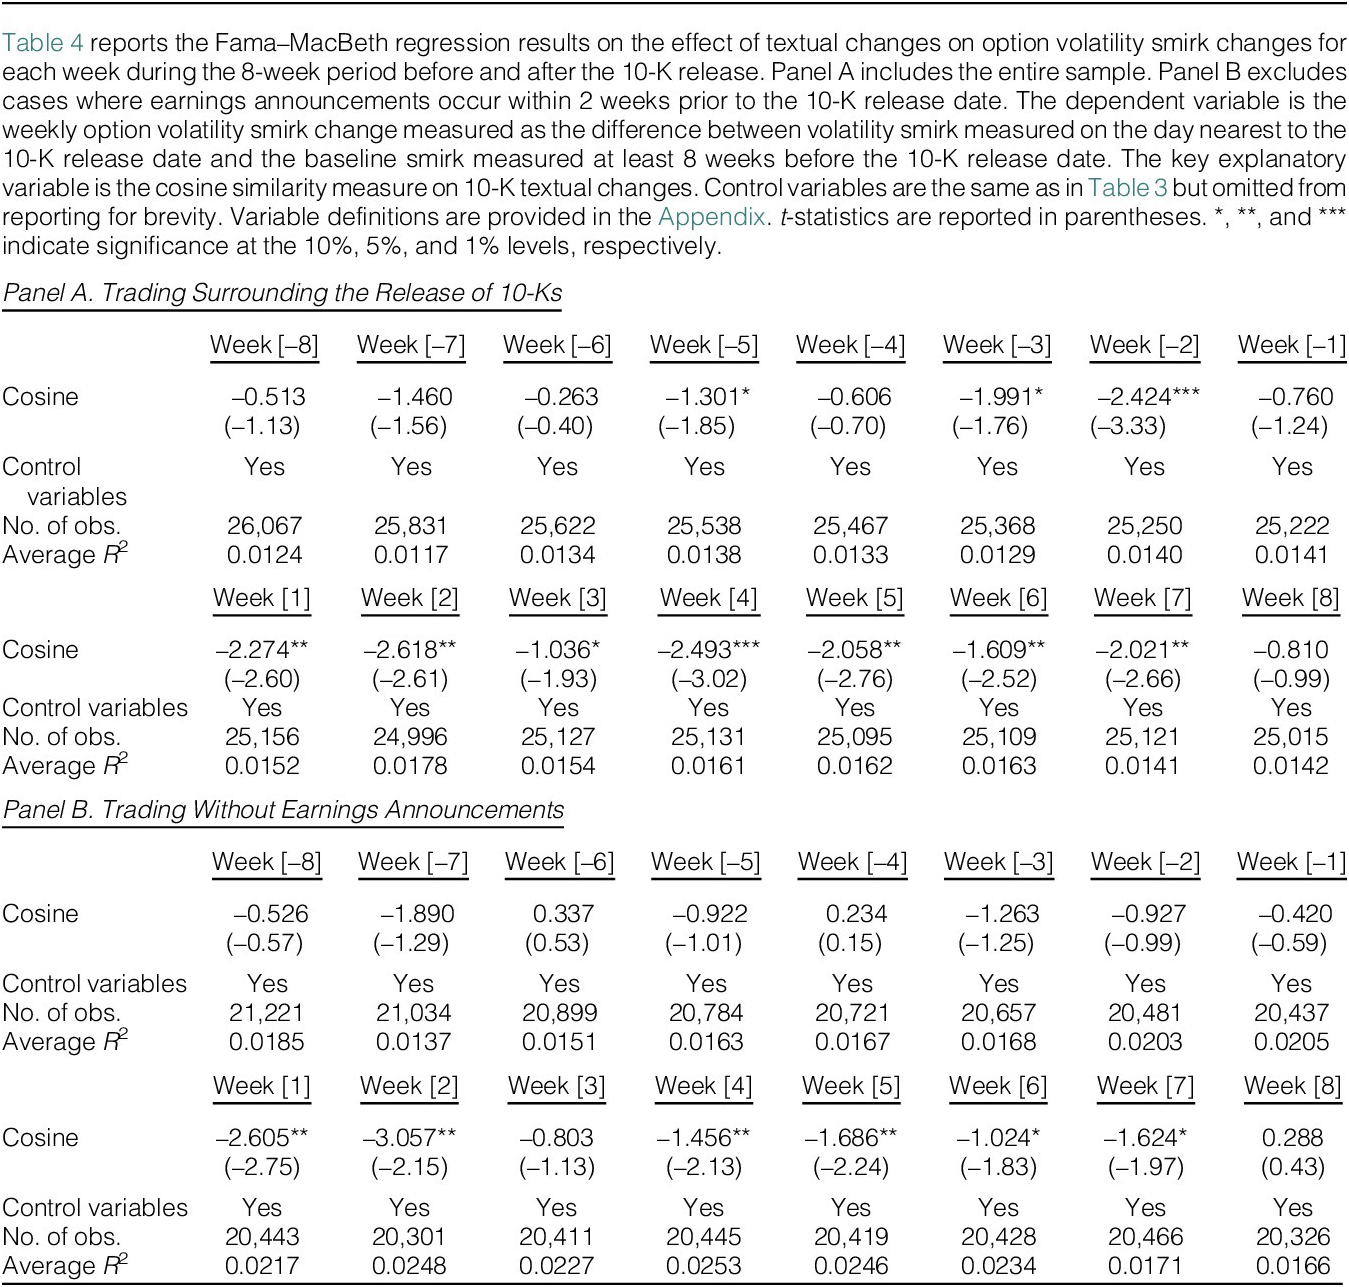
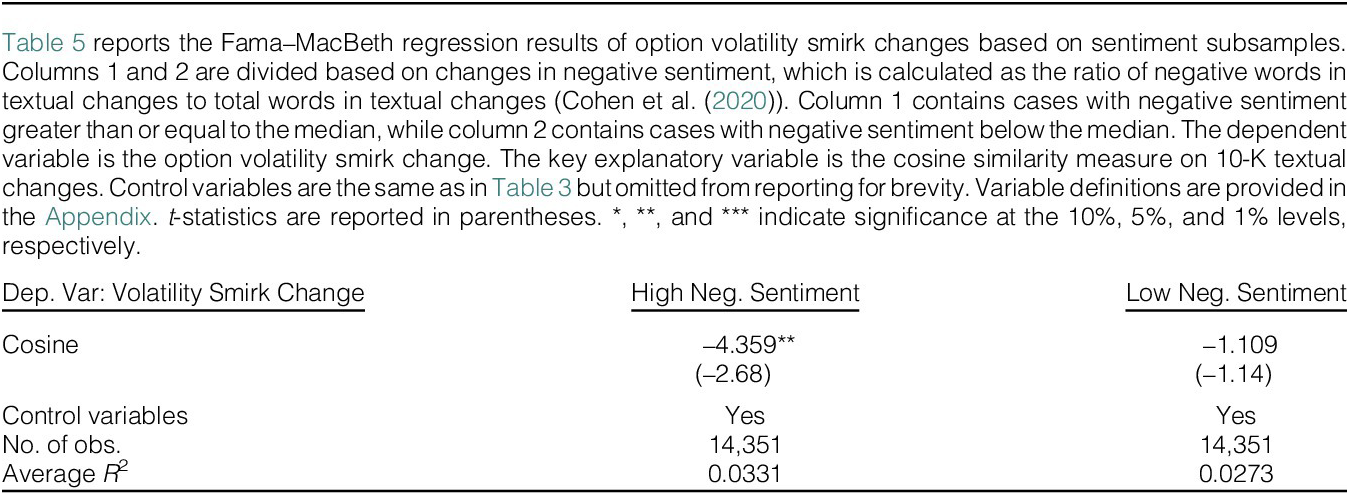
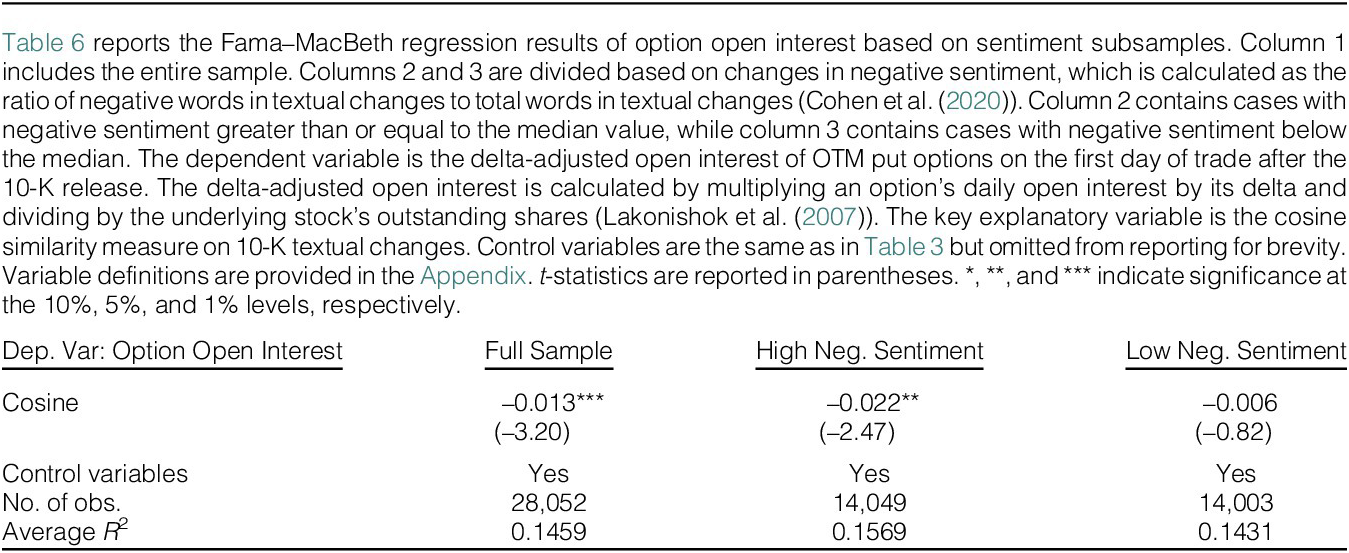
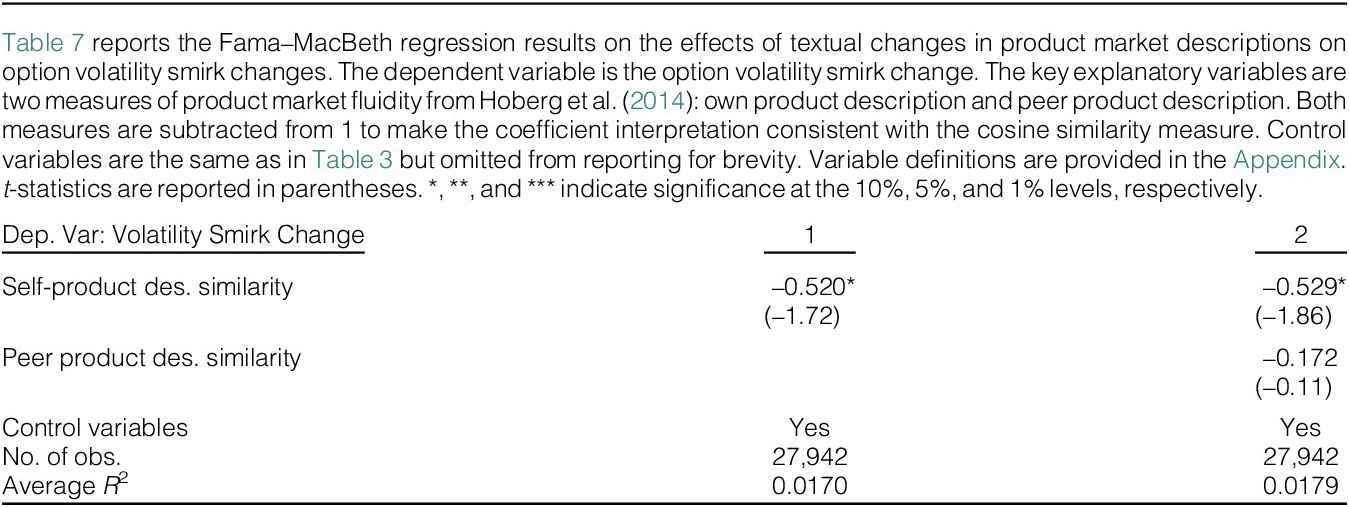
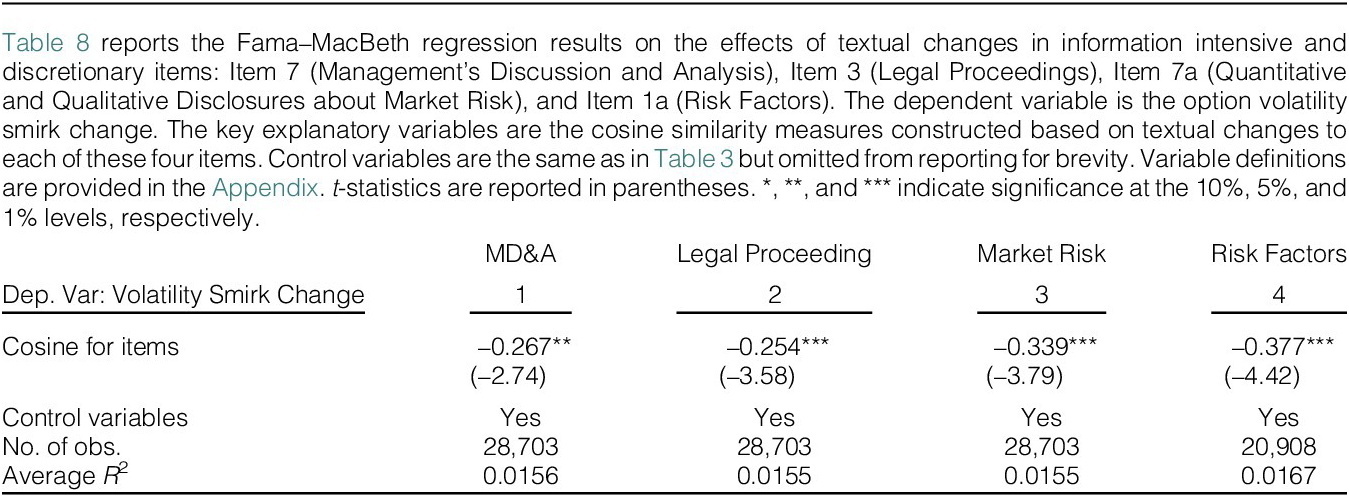
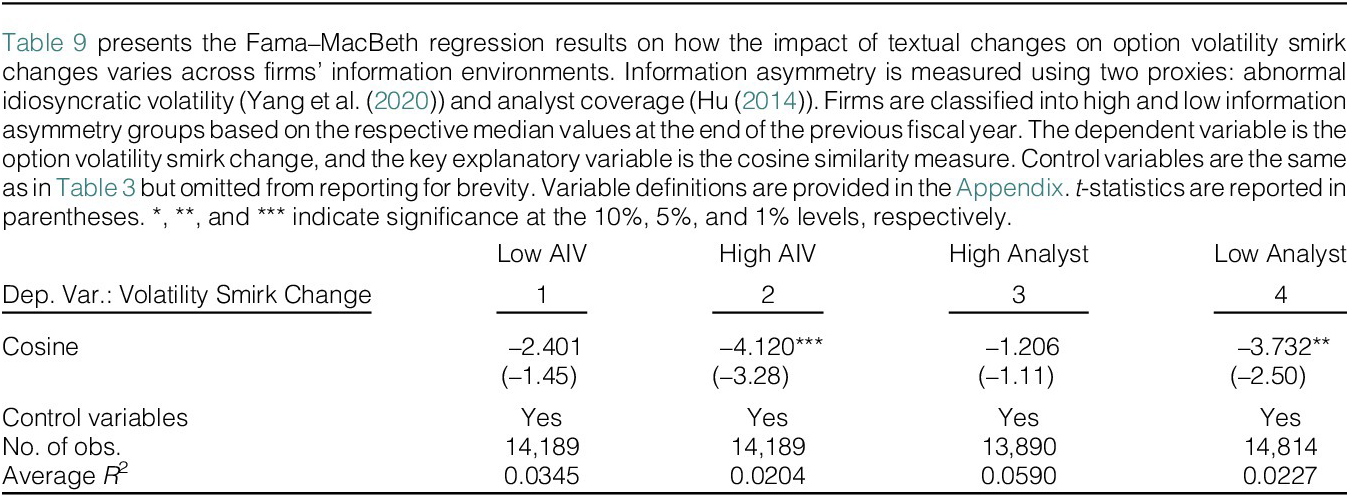
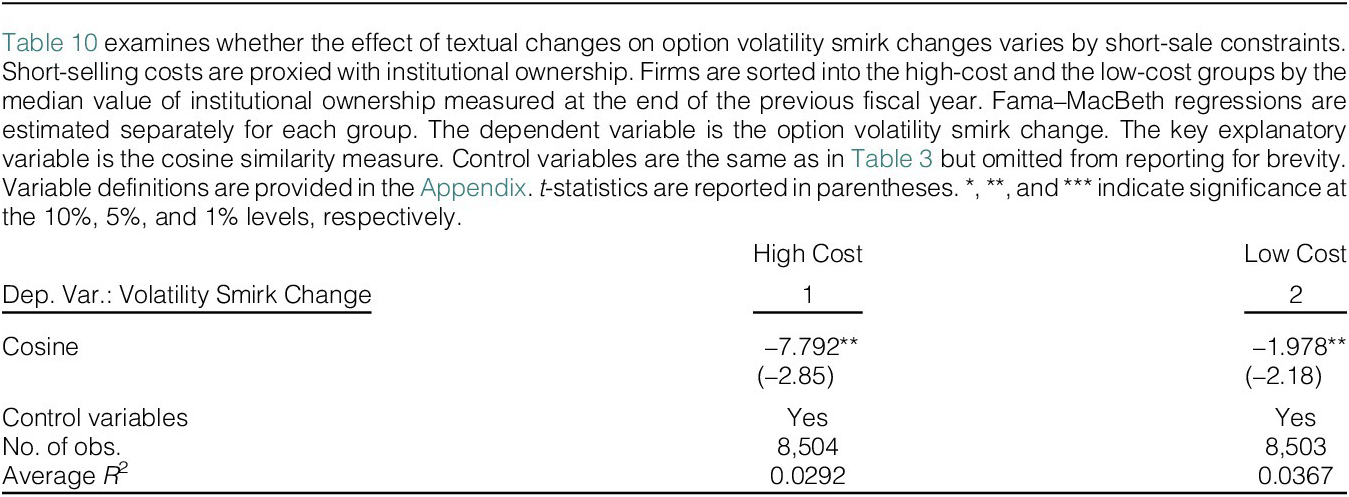
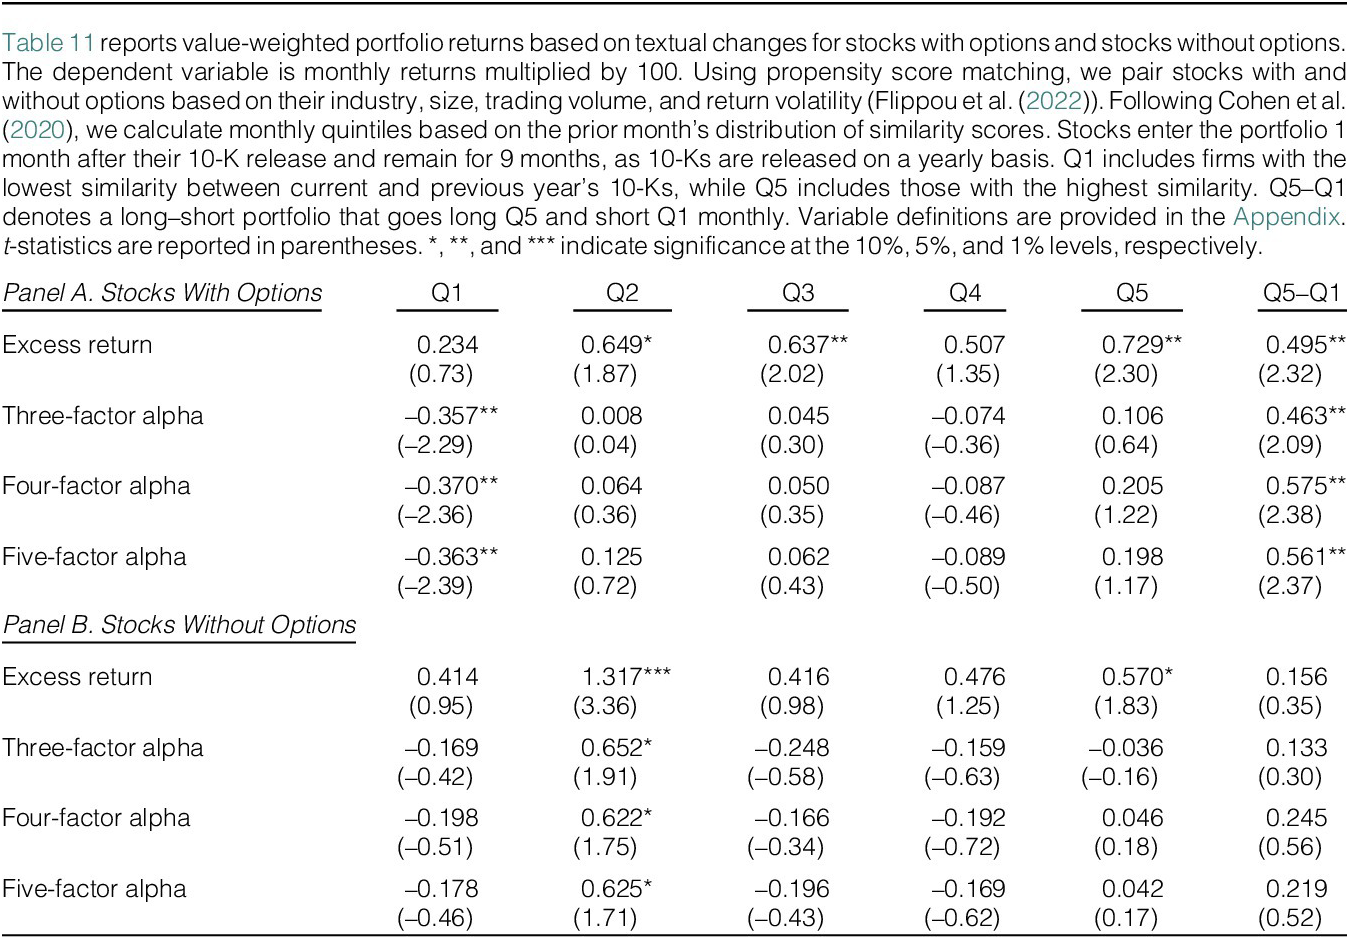
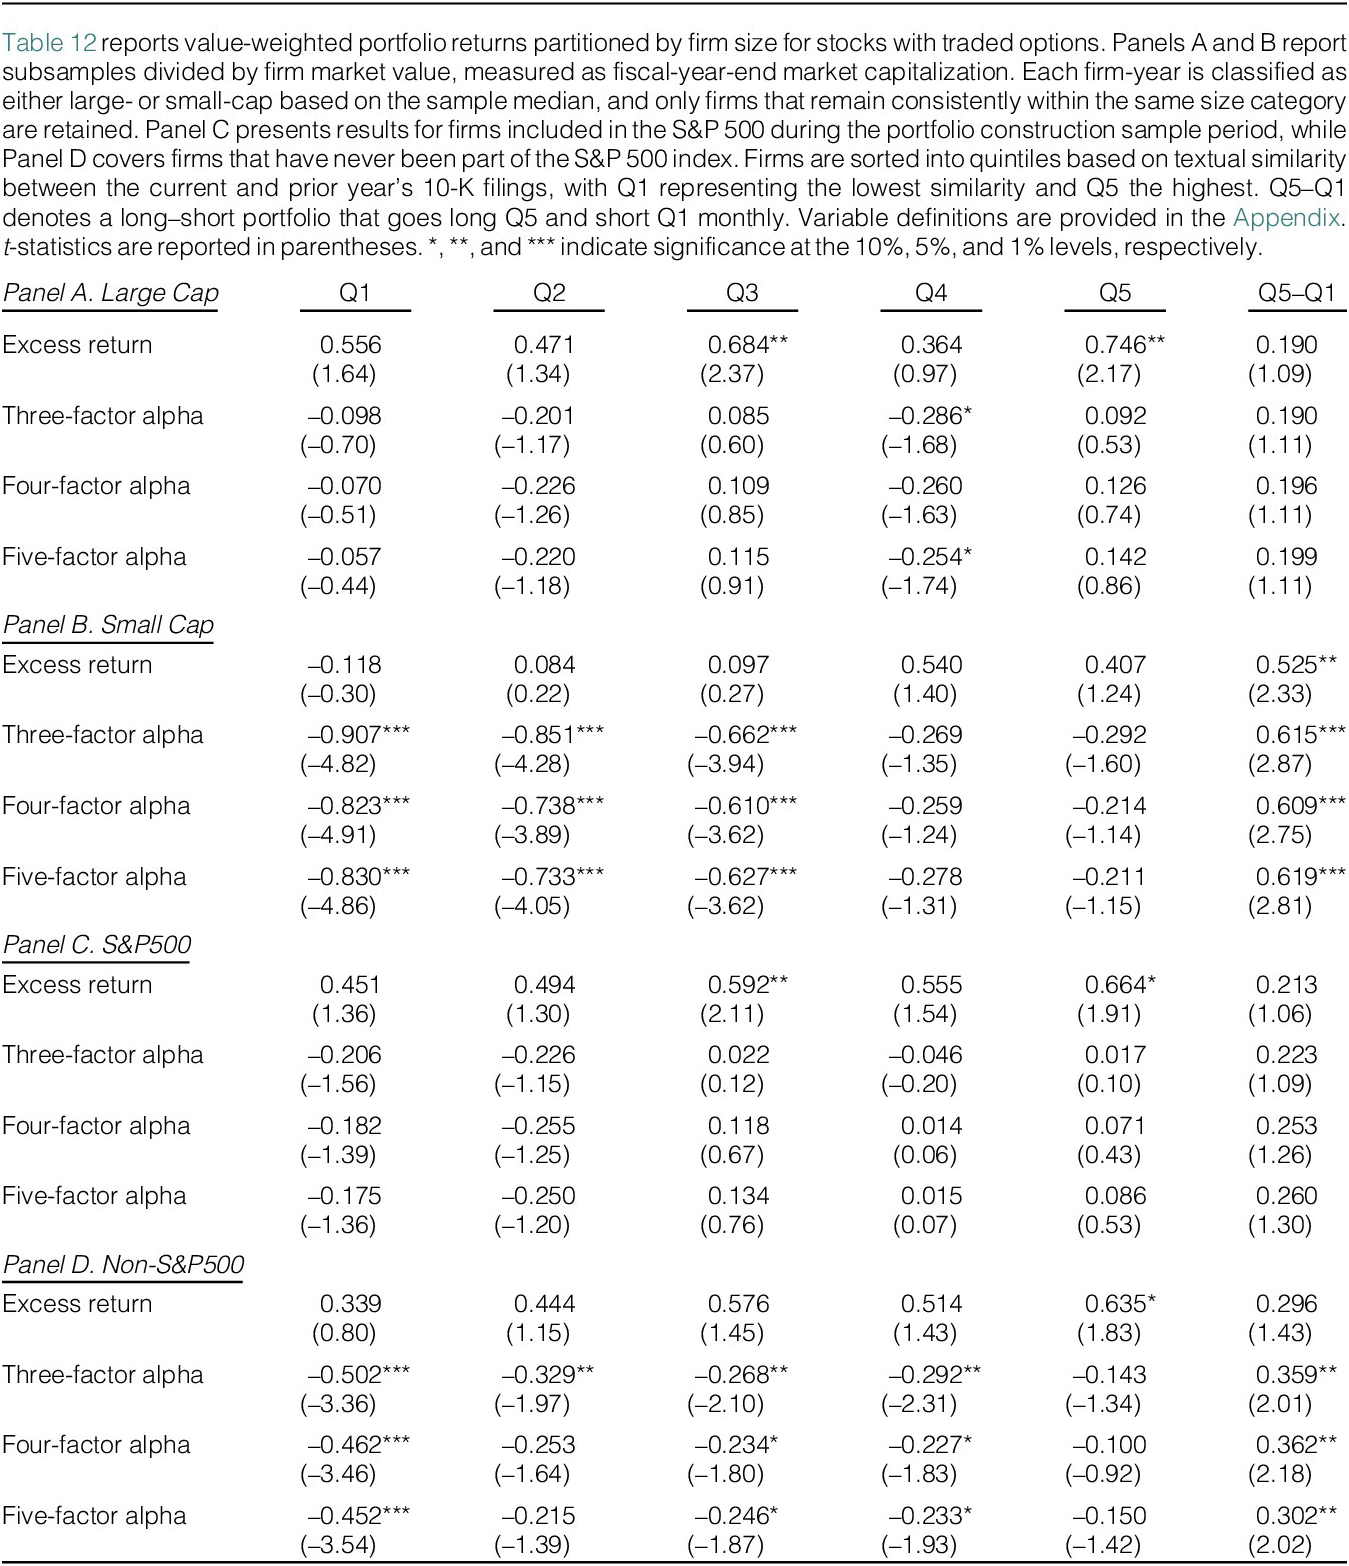
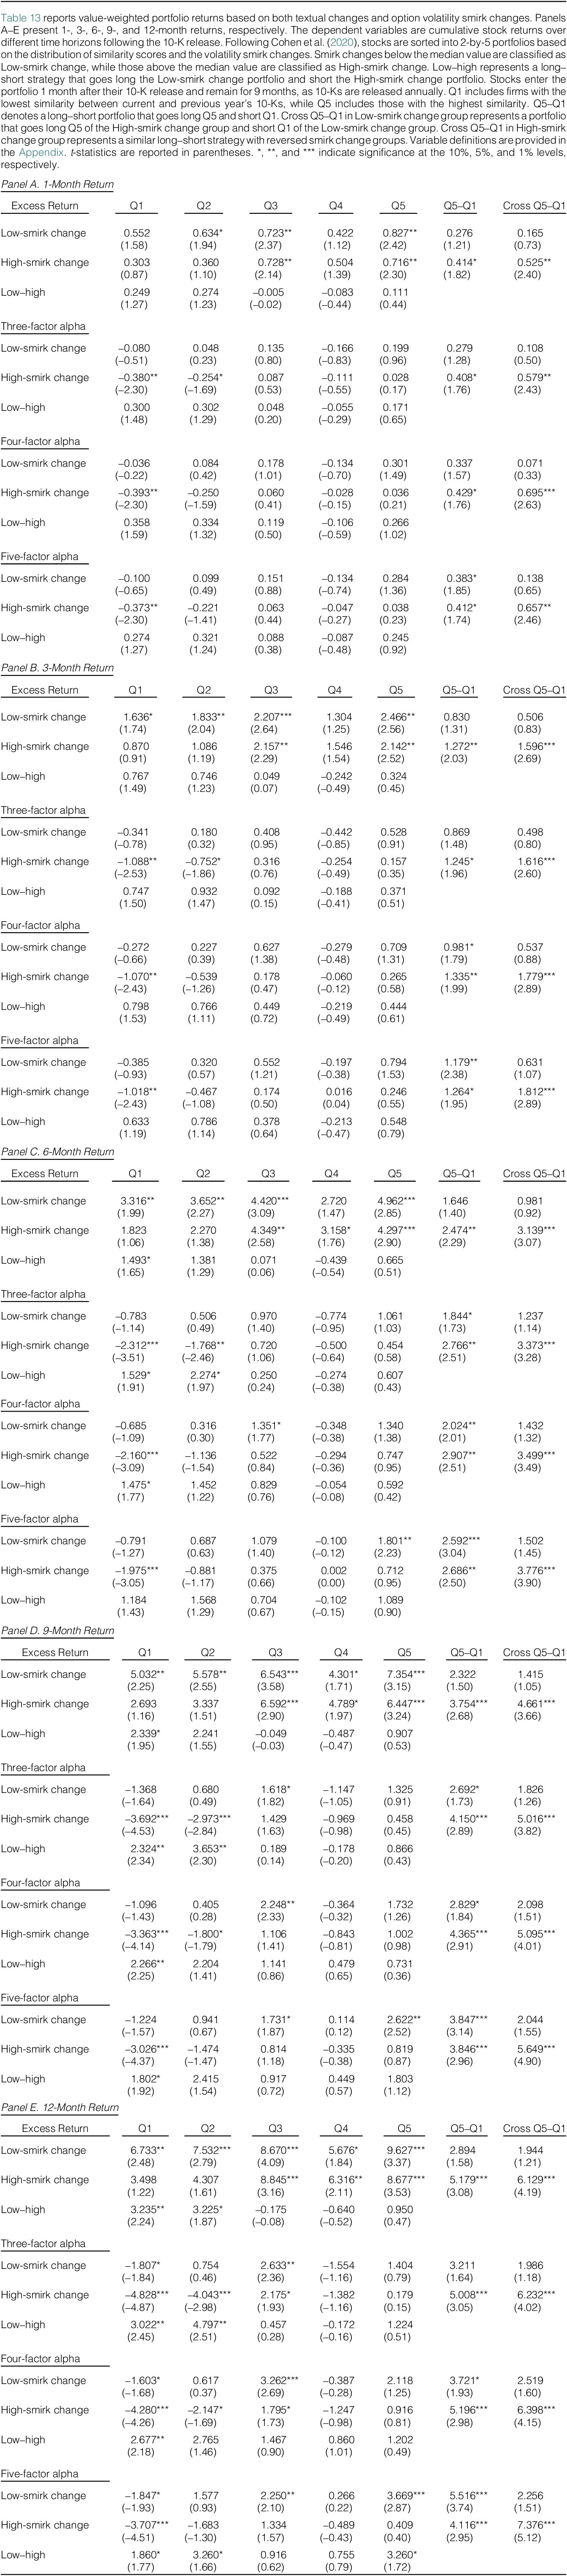
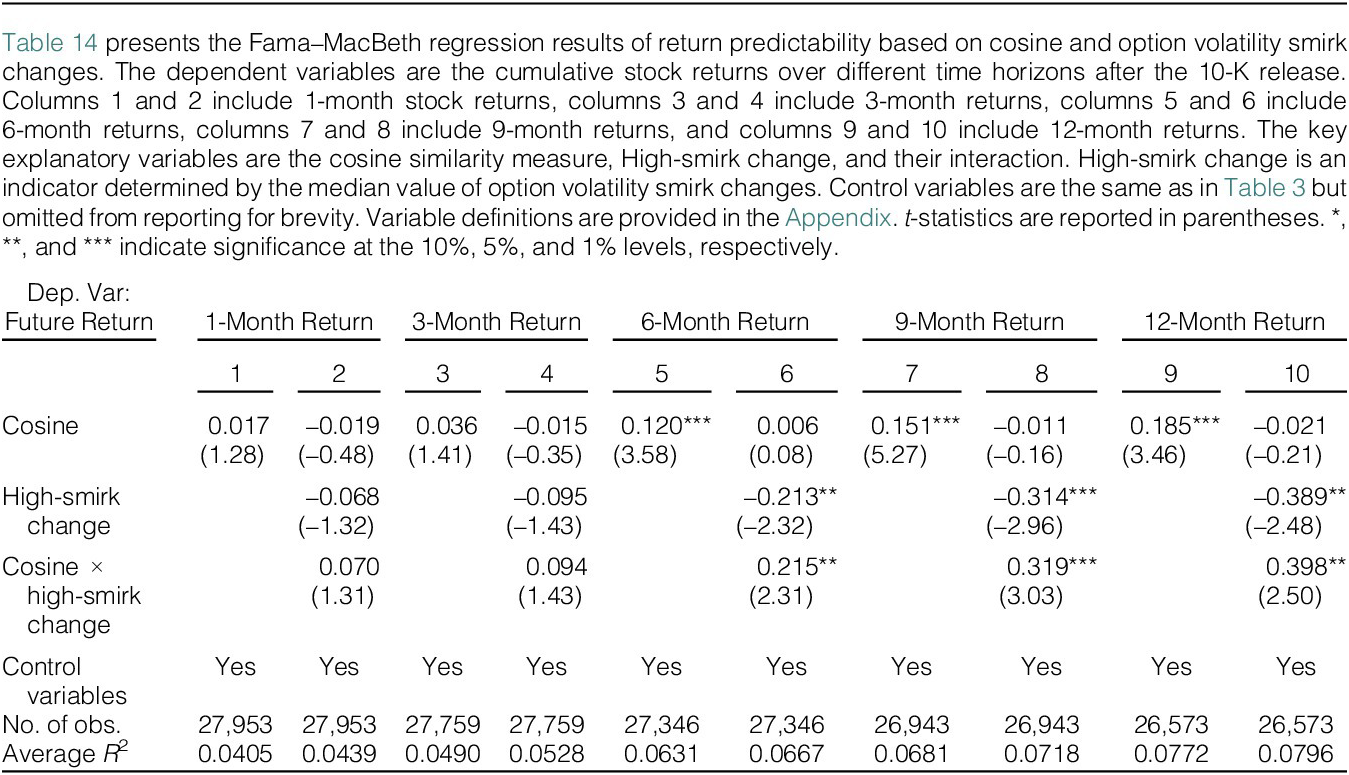


 Open access

