





1. Introduction
Propulsion is the action required to move a fluid through a conduit or to move a body through an expanse of a fluid. A propulsion system must have a source of mechanical power, and converting this power into a propulsive force represents a classical problem in fluid mechanics. One can divide propulsive systems into concentrated propulsion, e.g. pumps, fans, jets and propellers, and distributed propulsion, where the driving force is distributed along the surface of a solid body. Most technical applications rely on concentrated propulsion. Many biological systems involving ‘large’ objects involve concentrated propulsion, e.g. flapping foils for birds and fishes (Mannam & Krishnankutty Reference Mannam and Krishnankutty2019), but small-scale systems rely on distributed propulsion, e.g. cilia and flagella (Taylor Reference Taylor1951; Blake & Sleigh Reference Blake and Sleigh1974; Katz Reference Katz1974; Brennen & Winet Reference Brennen and Winet1977; Lauga Reference Lauga2016), and snail locomotion (Chan, Balmforth & Hosoi Reference Chan, Balmforth and Hosoi2005; Lee et al. Reference Lee, Bush, Hosoi and Lauga2008). Bowel movement represents a ‘large’ biological system relying on distributed propulsion. In general, distributed propulsion can be found in systems with slow movement, with scaling up to faster motions presenting a challenge. The use of distributed propulsion in technical applications has been limited mainly to the peristaltic effect (Fung & Yih Reference Fung and Yih1968; Shapiro, Jaffrin & Weinberg Reference Shapiro, Jaffrin and Weinberg1969; Jaffrin & Shapiro Reference Jaffrin and Shapiro1971; Ali, Ullah & Rasool Reference Ali, Ullah and Rasool2020), with recent results showing that fast, short peristaltic waves can provide novel applications (Floryan, Faisal & Panday Reference Floryan, Faisal and Panday2021; Haq & Floryan Reference Haq and Floryan2022).
Distributed propulsion can be used in parallel with concentrated propulsion to achieve a combined performance level not attainable otherwise. Active flow control fits into this category, but the vast literature on this topic is focused on expending energy on the reduction of shear resistance (Cattafesta & Sheplak Reference Cattafesta and Sheplak2011) with the somewhat futile goal of achieving net energy savings, i.e. energy savings which are larger than the energy cost required to achieve this saving. It is more appropriate to look at this area of research as the development of propulsion augmentation techniques. Net energy savings cannot be achieved using wall transpiration applied to a smooth conduit (Bewley Reference Bewley2009), but it might be possible with other distributed forcing forms and non-smooth conduits. It is known that modifications of surface topography can result in a resistance reduction (Walsh Reference Walsh1983; Fukagata, Sugiyama & Kasagi Reference Fukagata, Sugiyama and Kasagi2009; Moradi & Floryan Reference Moradi and Floryan2013; Mohammadi & Floryan Reference Mohammadi and Floryan2013a,Reference Mohammadi and Floryanb) and can go as far as producing chaotic stirring at an energy cost less than that required by the unmodified flow (Gepner & Floryan Reference Gepner and Floryan2020).
The distributed propelling force can be created using externally imposed forcing (actuation) patterns applied along the fluid–solid boundaries to increase the relative velocity of the fluid and the solid wall. Older concepts involve plasma-based (Inasawa, Ninomiya & Asai Reference Inasawa, Ninomiya and Asai2013) and piezo-driven (Fukunishi & Ebina Reference Fukunishi and Ebina2001) actuators. The recently identified effects, beyond the peristaltic waves, include thermal drift created by the interaction of groove and heating patterns (Abtahi & Floryan Reference Abtahi and Floryan2017; Inasawa, Hara & Floryan Reference Inasawa, Hara and Floryan2021) through the pattern interaction effect (Floryan & Inasawa Reference Floryan and Inasawa2021), and nonlinear streaming created by distributed wall transpiration (Jiao & Floryan Reference Jiao and Floryan2021). The propulsive force can also be created by modulating body forces, e.g. using heating patterns that modify the flow topology and reduce friction drag (Hossain, Floryan & Floryan Reference Hossain, Floryan and Floryan2012; Floryan & Floryan Reference Floryan and Floryan2015; Hossain & Floryan Reference Hossain and Floryan2016). A judicious combination of heating and groove patterns can significantly increase the magnitude of this effect (Hossain & Floryan Reference Hossain and Floryan2020). The use of sound represents another form of volume actuation (Kato, Fukunishi & Kobayashi Reference Kato, Fukunishi and Kobayashi1997) whose potential remains to be explored.
This paper describes another effect capable of creating propulsion. It relies on patterned heating, which activates nonlinear thermal streaming. The description of the model problem used to demonstrate this streaming is given in § 2. Its basic properties are discussed in § 3. Section 4 demonstrates that the streaming can be generated by heating from above or below. Section 5 provides a summary of the main conclusions.
2. Problem formulation
Consider two parallel plates separated by a gap of thickness  $2h^\ast$ filled with fluid, as shown in figure 1. The gap extends to ${\pm} \infty $ in the $x^\ast$-direction, the gravitational acceleration ${g^\ast }$ acts in the negative $y^\ast$-direction, the fluid has thermal conductivity ${k^\ast }$, specific heat ${c^\ast }$, thermal diffusivity ${\kappa ^\ast } = {k^\ast }/{\rho ^\ast }{c^\ast }$, kinematic viscosity ${\nu ^\ast }$, dynamic viscosity ${\mu ^\ast }$, thermal expansion coefficient ${\varGamma ^\ast }$, variations of its density ${\rho ^\ast }$ follow the Boussinesq approximation, and stars denote dimensional quantities. Please assume that the upper plate can move within its plane while the lower plate is stationary.
Schematic diagram of the flow system. The upper plate is isothermal and free to move. The fixed lower plate is exposed to periodic and uniform heatings.

This analysis determines if introducing external patterned heating can result in plate movement. We assume that the heating applied to the lower plate results in a simple sinusoidal temperature distribution while the upper plate is kept isothermal, i.e.
 \begin{equation}T_L^\ast ({x^\ast }) = T_{mean,L}^\ast + 0.5\, T_{per}^\ast \cos ({\alpha ^\ast }{x^\ast }),\quad T_U^\ast ({x^\ast }) = T_U^\ast ,\end{equation}
where  ${\alpha ^\ast }$ is the wavenumber characterizing spatial temperature distribution, subscripts ‘mean’ and ‘per’ refer to the mean and periodic parts, respectively, $T_{per}^\ast $ is the peak-to-peak amplitude of the periodic component, and subscripts L and U refer to the lower and upper plates, respectively. We use $T_U^\ast $ for reference with all material properties evaluated at this temperature and define the relative temperature ${\theta ^\ast } = {T^\ast } - T_U^\ast $ to get the relative temperatures of both plates in the form
 \begin{equation}\theta _L^\ast (x) = \theta _{uni}^\ast + 0.5\, \theta _{per}^\ast \cos ({\alpha ^\ast }{x^\ast }),\quad \theta _U^\ast ({x^\ast }) = 0,\end{equation}
where  $\theta _{uni}^\ast = T_{uni}^\ast = T_{mean,L}^\ast - T_U^\ast $, $\theta _{per}^\ast = T_{per}^\ast $. Finally, we use half of the mean gap height ${h^\ast }$ as the length scale and ${\kappa ^\ast }{\nu ^\ast }/({g^\ast }{\varGamma ^\ast }{h^{{\ast} 3}})$ as the temperature scale to find the dimensionless expressions for the relative temperatures of the form
 \begin{equation}y = - 1{:}\ {\theta _L}(x) = R{a_{uni}} + 0.5\, R{a_{per}}\cos (\alpha x),\quad y = 1{:}\ {\theta _U}(x) = 0,\end{equation}
where  $R{a_{uni}} = {g^\ast }{\varGamma ^\ast }{h^{{\ast} 3}}T_{uni}^\ast{/}({\kappa ^\ast }{\nu ^\ast })$ is the uniform Rayleigh number measuring the intensity of the uniform heating and $R{a_{per}} = {g^\ast }{\varGamma ^\ast }{h^{{\ast} 3}}T_{per}^\ast{/}({\kappa ^\ast }{\nu ^\ast })$ is the periodic Rayleigh number measuring the intensity of the periodic heating.
Heating produces convection within the gap. If the upper plate does not experience any external resistance, the shear force produced by this convection may accelerate this plate until it reaches a constant velocity  ${U_{top}}$ which eliminates the mean shear. The question if the upper plate moves or not is determined by solving the following system of the field equations:
 \begin{gather}\frac{{\partial u}}{{\partial x}} + \frac{{\partial v}}{{\partial y}} = 0,\quad u\frac{{\partial u}}{{\partial x}} + v\frac{{\partial u}}{{\partial y}} = - \frac{{\partial p}}{{\partial x}} + {\nabla ^2}u,\end{gather}
 \begin{gather}u\frac{{\partial v}}{{\partial x}} + v\frac{{\partial v}}{{\partial y}} = - \frac{{\partial p}}{{\partial y}} + {\nabla ^2}v + P{r^{ - 1}} \theta ,\quad u\frac{{\partial \theta }}{{\partial x}} + v\frac{{\partial \theta }}{{\partial y}} = P{r^{ - 1}}{\nabla ^2}\theta , \end{gather}
where  $(u,v)$ are the velocity components in the (x, y) directions, respectively, scaled with $U_v^\ast = {\nu ^\ast }/{h^\ast }$ as the velocity scale, p stands for the pressure scaled with ${\rho ^\ast }U_\nu ^{{\ast} 2}$ as the pressure scale and $Pr = {\nu ^\ast }/{\kappa ^\ast }$ is the Prandtl number. The relevant boundary conditions are
 \begin{equation}\left. {\begin{array}{@{}c@{}} {y = - 1{:}\ u = v = 0,\quad \theta = R{a_{uni}} + 0.5\, R{a_{per}}\cos (\alpha x),}\\ {y = 1{:}\ {{\left. {\dfrac{{\partial u}}{{\partial y}}} \right|}_{mean}} = 0,\quad {u_{per}} = 0,\quad v = 0,\quad \theta = 0.} \end{array}} \right\}\end{equation}
A constraint in the form
 \begin{equation}{\left. {\frac{{\partial p}}{{\partial x}}} \right|_{mean}} = 0,\end{equation}
has to be added to eliminate any external pressure gradient contributing to the fluid movement.
Equations (2.4)–(2.6) were solved numerically. Velocities were expressed in terms of a stream function defined in the usual manner, i.e.  $u = \partial \psi /\partial y, v = - \partial \psi /\partial x$, and pressure was eliminated, resulting in the following system:
 \begin{gather}{\nabla ^4}\psi - P{r^{ - 1}}\frac{{\partial \theta }}{{\partial x}} = {N_{vv}},\quad \frac{{{\partial ^2}\theta }}{{\partial {x^2}}} + \frac{{{\partial ^2}\theta }}{{\partial {y^2}}} = Pr {N_{v\theta }},\end{gather}
 \begin{gather}\textrm{where}\ {N_{vv}} = \frac{\partial }{{\partial y}}\left( {\frac{\partial }{{\partial x}}\widehat {uu} + \frac{\partial }{{\partial y}}\widehat {uv}} \right) - \frac{\partial }{{\partial x}}\left( {\frac{\partial }{{\partial x}}\widehat {uv} + \frac{\partial }{{\partial y}}\widehat {vv}} \right),\quad {N_{v\theta }} = \frac{\partial }{{\partial x}}\widehat {u\theta } + \frac{\partial }{{\partial y}}\widehat {v\theta },\end{gather}
with hats denoting products of quantities under the hat. The relevant boundary conditions were written as
 \begin{gather}y = - 1{:}\ \psi = \frac{{\partial \psi }}{{\partial y}} = 0,\quad \theta = R{a_{uni}} + 0.5\, R{a_{per}} \cos (\alpha x),\end{gather}
 \begin{gather}y = 1{:}\ {\left. {\frac{{\partial \psi }}{{\partial y}}} \right|_{per}} = { \psi |_{per}} = 0,\quad {\left. {\frac{{{\partial^2}\psi }}{{\partial {y^2}}}} \right|_{mean}} = 0,\quad \theta = 0,\end{gather}
and were supplemented with the proper form of the pressure gradient constraint (2.6). The x-dependencies of all unknowns, as well as other required quantities, were captured by expressing them as Fourier expansions based on the heating wave number α, i.e.
 \begin{align} & [{u,v,p,\theta ,\psi ,\widehat {vv}, \widehat {uu},\widehat {uv},\widehat {u\theta },\widehat {v\theta }} ](x,y)\nonumber\\ & \quad = \sum\limits_{n = - {N_m}}^{n = + {N_m}} {[{{u^{(n)}}, {v^{(n)}},{p^{(n)}},{\theta^{(n)}},{\psi^{(n)}},{{\widehat {vv}}^{(n)}},{{\widehat {uu}}^{(n)}}, {{\widehat {uv}}^{(n)}},{{\widehat {u\theta }}^{(n)}},{{\widehat {v\theta }}^{(n)}}} ](y)\,{\textrm{e}^{\textrm{i}n\alpha x}},} \end{align}
where all modal functions  ${u^{(n)}}, {v^{(n)}},{p^{(n)}},{\theta ^{(n)}},{\psi ^{(n)}},{\widehat {vv}^{(n)}},{\widehat {uu}^{(n)}}, {\widehat {uv}^{(n)}},{\widehat {u\theta }^{(n)}},{\widehat {v\theta }^{(n)}}$ satisfy the reality conditions, e.g. ${u^{(n)}}$ is the complex conjugate of ${u^{( - n)}}$. The expansions were truncated at ${N_M}$ whose acceptable value was determined through numerical convergence studies. Substitution of (2.10) into (2.7) and separation of Fourier modes led to a system of ordinary coupled differential equations for the modal functions ${\theta ^{(n)}},{\psi ^{(n)}}$ of the form
 \begin{align} [{D^4} &- 2{n^2}{\alpha ^2}{D^2} + {n^4}{\alpha ^4}]{\psi ^{(n)}}(y) - \textrm{i}n\alpha P{r^{ - 1}}{\theta ^{(n)}}(y)\nonumber\\ &\quad = \textrm{i}n\alpha D{\widehat {uu}^{(n)}}(y) + [{D^2} + {n^2}{\alpha ^2}] {\widehat {uv}^{(n)}}(y) - \textrm{i}n\alpha D{\widehat {vv}^{(n)}}(y),\end{align}
 \begin{gather}{D^2}{\theta ^{(n)}}(y) - {n^2}{\alpha ^2}{\theta ^{(n)}}(y) = Pr[\textrm{i}n\alpha {\widehat {u\theta }^{(n)}}(y) + D{\widehat {v\theta }^{(n)}}(y)],\end{gather}
where  $D = \textrm{d}/\textrm{d}y$, $- {N_M} \le n \le {N_M}$ and terms on the right-hand side originate from the nonlinearities. The above system was solved using a fixed point iterative technique with the right-hand side taken from the previous iteration. The boundary conditions expressed in terms of modal functions were
 \begin{gather}\left. {\begin{array}{@{}c@{}} {y = - 1{:}\ {\psi^{(n)}} = \dfrac{{\textrm{d}{\psi^{(n)}}}}{{\textrm{d}y}} = 0\quad \textrm{for}\ 0 \le |n|< + \infty ,}\\ {{\theta^{(0)}} = R{a_{uni}},\quad {\theta^{(1)}} = {\theta^{( - 1)}} = \tfrac{1}{4}R{a_{per}},\quad {\theta^{(n)}} = 0\quad \textrm{for}\ 2 \le |n|< + \infty ,} \end{array}} \right\}\end{gather}
 \begin{gather}y = 1{:}\ {\psi ^{(n)}} = \frac{{\textrm{d}{\psi ^{(n)}}}}{{\textrm{d}y}} = {\theta ^{(n)}} = 0\quad \textrm{for}\ 0 < |n|< + \infty ,\quad \frac{{{\textrm{d}^2}{\psi ^{({(0)} )}}}}{{\textrm{d}{y^2}}} = 0,\quad {\theta ^{(0)}} = 0,\end{gather}
 \begin{gather}{D^2}{\psi ^{(0)}}(1) - {D^2}{\psi ^{(0)}}( - 1) = [{\widehat {uv}^{(0)}}(1) - {\widehat {uv}^{(0)}}( - 1)],\end{gather}
with (2.12l) expressing the pressure gradient constraint and  ${U_{top}} = \textrm{d}{\psi ^{(0)}}/\textrm{d}y{|_{y = 1}}$ being the unknown quantity of interest. The modal functions were represented as Chebyshev expansions, and the Galerkin projection method was used to construct algebraic equations for the expansion coefficients. The boundary conditions were accommodated using the tau method. The discretization process provided spectral accuracy with the absolute error controlled by the number of Chebyshev polynomials and Fourier modes used in the computations. Using 10 Fourier modes and 45 Chebyshev polynomials provided a minimum of five digits accuracy for all quantities of interest (Panday & Floryan Reference Panday and Floryan2021).
3. Discussion of results
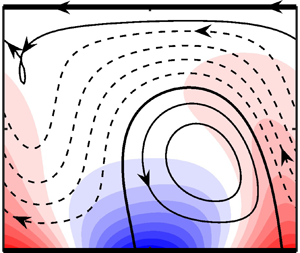
Lighter fluid above hot spots moves upward, forming heated plumes and drawing fluid along the lower plate from its left and right sides, resulting in the formation of counter-rotating rolls whose size is dictated by the heating wavelength (see figures 2a and 2b). The rolls have the left/right symmetry producing zero mean shear stress at the upper plate, which results in no movement of this plate for small enough heating intensities.
Flow and temperature fields for  $R{a_{uni}} = 0$, $Pr = 0.71$, $\alpha = 2$ and $R{a_{per}} = (a)\;790,\;(b)\;855,\;(c)\;900,\;(d)\;1100$. Dashed lines mark stream tubes carrying fluid in the horizontal direction. The background colour illustrates the temperature field scaled with its maximum.

An increase in heating intensity produces stronger plumes which may either remain vertical or tilt to the right or left. Plume tilting results in a loss of the flow symmetry leading to the formation of a stream tube carrying the fluid either to the left or to the right (figures 2c and 2d). This movement produces mean shear pulling the upper plate in the direction of fluid moving in the stream tube. The change in the character of fluid motion is best represented by plotting variations of  ${U_{top}}$ as a function of $R{a_{per}}$. This plot demonstrates that the system response is a pitchfork bifurcation (see figure 3). We shall refer to the flow corresponding to the bifurcation branches as nonlinear thermal streaming. This streaming produces a propulsive force causing the plate's movement.
Variation of the upper plate velocity  ${U_{top}}$ as a function of $R{a_{per}}$ for $R{a_{uni}} = 0$ and $Pr = 0.71$. Points A, B, C and D identify flow conditions used in figure 2, and points D, E and F identify flow conditions used in figure 4. Bifurcation points are $R{a_{per,cr}} = 884.5,\, 1151.22,\,1120$ for $\alpha = 2,\,2.8,\,1.2$, respectively.

Figure 2(a) illustrates flow and temperature patterns for  $R{a_{per}} = 790 < R{a_{per,cr}}$, which is far below the bifurcation point $R{a_{per,cr}} = 884.5$, figure 2(b) for $R{a_{per}} = 855 < R{a_{per,cr}}$, which is just below the bifurcation point, figure 2(c) for $R{a_{per}} = 900 > R{a_{per,cr}}$, which is just above the bifurcation point, and figure 2(d) for $R{a_{per}} = 1100 > R{a_{per,cr}}$, which is far above the bifurcation point. The gradual increase of the plume's height with $R{a_{per}}$ and its eventual tilting are well visible. The increase of the width of the stream tube weaving between the rolls as $R{a_{per}}$ increases is also well visible (figures 2c and 2d). The onset conditions (bifurcation point) were determined using linear stability theory explained later in this presentation.
Replacing the zero mean shear with the no-slip condition at the upper plate eliminates flow asymmetries – the upper plate ‘holds’ the plume in a vertical position preventing its tilting in agreement with Hossain & Floryan (Reference Hossain and Floryan2013).
Points D, E and F in figure 3 identify three types of flows that may occur for the same flow conditions with their topologies illustrated in figure 4. Existence of multiple flows under nominally identical conditions leads to the question of their stability as only stable flow can be observed in nature. Stability of flows was tested using linear stability theory, where disturbances in the form
 \begin{align}[{u_D},{v_D},{p_D},{\theta _D},{\psi _D}](x,y,t) = {\textrm{e}^{\textrm{i}(\delta x - \sigma t)}}\sum\limits_{n = - \infty }^{n = + \infty } {[u_D^{(n)}, v_D^{(n)},p_D^{(n)},\theta _D^{(n)},\psi _D^{(n)}]} (y)\,{\textrm{e}^{\textrm{i}n\alpha x}} + \textrm{c}\textrm{.c}\textrm{.},\end{align}
were superimposed on the stationary state (Floryan Reference Floryan1997; Hossain & Floryan Reference Hossain and Floryan2013, Reference Hossain and Floryan2015). In the above, subscript D denotes the disturbance quantities,  $\delta $ is the disturbance wavenumber, $\sigma = {\sigma _r} + \textrm{i}{\sigma _i}$ is the complex frequency with ${\sigma _i}$ describing the rate of growth of disturbances and ${\sigma _r}$ describing their frequency, summation accounts for the heating-induced spatial modulations and $u_D^{(n)}, v_D^{(n)},p_D^{(n)},\theta _D^{(n)},\psi _D^{(n)}$ are modal functions corresponding to mode n. The relevant boundary conditions have the form
 \begin{gather}y = 1{:}\ {u_{D,per}} = {\left. {\frac{{\partial {u_D}}}{{\partial y}}} \right|_{mean}} = {v_D} = {\theta _D} = 0,\end{gather}
 \begin{gather}y = - 1{:}\ {u_D} = {v_D} = {\theta _D} = 0.\end{gather}
Substitutions of (3.1) into the field equations, linearization and separation of Fourier modes lead to a system of modal equations of the following form
 \begin{align} {A^{(n)}}\psi _D^{(n)} - \textrm{i}{t_n}P{r^{ - 1}}\theta _D^{(n)} & = \textrm{i}\sum\limits_{m = - \infty }^{ + \infty } {[{t_m}D{\psi ^{(n - m)}}{H^{(m)}}\psi _D^{(m)} + (n - m)\alpha {I^{(n - m)}}{\psi ^{(n - m)}}D\psi _D^{(m)}} \nonumber\\ & \quad - (n - m) \alpha {\psi ^{(n - m)}}{H^{(m)}}D\psi _D^{(m)} - {t_m} {I^{(n - m)}}{\psi ^{(n - m)}}\psi _D^{(m)}],\end{align}
 \begin{align} {C^{(n)}}\varTheta _D^{(n)} & = \textrm{i}\,Pr\sum\limits_{m = - \infty }^{ + \infty } {[{t_m}D{\psi ^{(n - m)}}\theta _D^{(m)} + (n - m) \alpha {\theta ^{(n - m)}}D\psi _D^{(m)}}\nonumber \\ & \quad - (n - m) \alpha {\psi ^{(n - m)}}D\theta _D^{(m)} - {t_m} D{\theta ^{(n - m)}}\psi _D^{(m)}]. \end{align}
In the above,  ${\psi _D}$ stands for the disturbance stream functions defined in the usual manner, ${A^{(n)}} = {({D^2} - t_n^2)^2} + \textrm{i}\sigma ({D^2} - t_n^2)$, ${C^{(n)}} = {D^2} - t_n^2 + \textrm{i}\,Pr\sigma $, ${I^{(n - m)}} = {D^2} - {(n - m)^2}{\alpha ^2}$, ${H^{(n)}} = {D^2} - t_n^2$, ${t_n} = \delta + n\alpha ,D = \textrm{d}/\textrm{d}y$. It can be shown that movement of the upper plate is allowed only when $\delta = 0$. The eigenvalue problem for the modal equations was solved by representing modal functions in terms of Chebyshev expansions and using the Galerkin projection method to develop a matrix eigenvalue problem which was then solved using standard techniques. The middle branch was found to be stable below the bifurcation point and unstable above this point. The side branches were found to be stable. Table 1 gives the top five eigenvalues for the middle branch under subcritical conditions, and the top and middle branches under supercritical conditions. The numerical values suggest a weak instability.
Flow and temperature fields that may exist for  $R{a_{uni}} = 0,\alpha = 2$, $Pr = 0.71$ and $R{a_{per}} = 1100$. Dashed lines mark stream tubes carrying fluid in the horizontal direction. The background colour illustrates the temperature field scaled with its maximum. Panels (a)–(c) correspond to flow conditions marked as points D, E and F in figure 3, respectively.

Complex amplification rates for the top five eigenvalues.

The critical conditions leading to bifurcation depend on the heating pattern quantified by the heating wavenumber, as illustrated in figure 5. This problem can be viewed as an interaction of thermal plumes forming a spatial pattern. The most effective pattern producing bifurcation at the lowest  $R{a_{per,cr}}$ occurs for $\alpha \approx 2$, as demonstrated in figure 5. Plumes, which are either too far from each other or too close, do not produce bifurcation in the range of $R{a_{per}}$ used in this analysis.
Variations of the critical periodic Rayleigh number  $R{a_{per,cr}}$ resulting in the movement of the upper plate as a function of the wavenumber $\alpha $ for $Pr = 0.71$ and $R{a_{uni}} = 0$.

Here,  $R{a_{per,cr}}$ strongly depends on the Prandtl number, whose reduction decreases the minimum heating intensity required to effect bifurcation, as shown in figure 6. This demonstrates the relevance of the horizontal temperature gradients, which decrease with an increase of Pr everywhere except in the thermal boundary layer in the vicinity of the lower plate. These gradients, displayed in figure 7, directly measure the horizontal gradient of buoyancy force that drives the fluid movement. They must increase significantly with an increase of Pr to produce the same ${U_{top}}$, as illustrated in figure 7.
Variation of the upper plate velocity  ${U_{top}}$ as a function of $R{a_{per}}$ for $\alpha = 2$, $R{a_{uni}} = 0$ and $Pr = 0.15,\,0.71,\,1$. Circles identify flow conditions used in figure 7. Bifurcation points are $R{a_{per,cr}} = 224,\,884.5,\,1204,\,1755$ for $Pr = 0.15,\,0.71,\,1,\,1.5$, respectively.

Flow fields and horizontal temperature gradients for  $R{a_{uni}} = 0$, $\alpha = 2$ and (a) $Pr = 0.15,\,R{a_{per}} = 261$, (b) $Pr = 0.71,\,R{a_{per}} = 1140$ and (c) $Pr = 1,\,R{a_{per}} = 1685$. Dashed lines mark stream tubes carrying fluid in the horizontal direction. Background colours illustrate the horizontal gradients of the buoyancy force scaled with $R{a_{per}}$.

Data in figure 8 illustrate the effects of uniform heating added to the lower plate. A modest increase in such heating results in a significant reduction of  $R{a_{per,cr}}$, i.e. the use of $R{a_{uni}} = 100$ reduces $R{a_{per,cr}}$ from 882 to 605. Uniform cooling has the opposite effect by increasing $R{a_{per,cr}}$ from 882 at $R{a_{uni}} = 0$ to 1170 at $R{a_{uni}} = - 100$.
Variation of the upper plate velocity  ${U_{top}}$ as a function of $R{a_{per}}$ for $\alpha = 2$, $Pr = 0.71$ and $R{a_{uni}} = 100,\, 50,\,0, - 50, - 100$. Bifurcation points are $R{a_{per,cr}} = 605,\,745,\,884.5,\,1027,\,1170$ for $R{a_{uni}} = 100,\,50,\,0, - 50, - 100$, respectively.

The above predictions require experimental verification. We recommend using a small Prandtl number liquid, such as Galinstan, placing a light sheet on the upper surface and measuring its movement. A suitable combination of periodic and uniform heating can generate a sufficient floating sheet velocity to permit accurate measurements. An estimate based on periodic heating with amplitude  $A^* = 10{^\circ}\textrm{C}$, ${Ra_{per} = 500}$, ${g^* = 9.81\,\textrm{m s}^{-2}}$, ${k^*= 16.5\ \textrm{W m}^{-1}\ {^\circ}{\rm C}}$, ${\rho^* = 6.44 \times 10^3\,\textrm{kg m}^{-3}}$, $c^* = 296\,\textrm{J kg}^{-1}\,{^\circ}{\rm C}$, ${\kappa}^* = 8.66\times 10^{-6}\,\textrm{m}^2\,{\rm s}^{-1}$, $v^* = 3.73 \times {10^{-7}}\,\textrm{m s}^{-2}$, ${\mu}^* = 0.0024\,\textrm{Pa s}$ and ${\varGamma}^* = 18.3 \times{10^{-6}}\ {^\circ}{\rm C}^{-1}$ gives the expected plate velocity of order mm s−1. The above represents an estimate, as Galinstan is a mixture of different materials, and its properties may change with the details of the composition.
We shall now consider more complex temperature distributions, which require using several Fourier modes for their characterization. All temperature distributions can be presented as
 \begin{equation}{\theta _L}(x) = R{a_{per}} H(x),\end{equation}
where H is the known shape function describing their spatial distributions satisfying condition
 \begin{equation}\max [H(x)] - \min [H(x)] = 1,\end{equation}
which maintains  $R{a_{per}}$ as a measure of the intensity of the heating. We shall focus on shapes involving just two wavenumbers, i.e. $\beta $ and $\gamma $, to illustrate the complexity and unpredictability of possible flow responses. The shape function has the form
 \begin{align}H(x) = K(x)/\{ \max K(x) - \min K(x)\} ,\quad K(x) = {B_\beta }\ \textrm{cos}(\beta x) + {B_\gamma }\ \textrm{cos(}\gamma x + \varOmega \textrm{)},\end{align}
where  ${B_\beta }$ and ${B_\gamma }$ denote the amplitudes of each component, and $\varOmega$ is the phase difference between them. We shall classify possible shapes using the commensurate index defined as
 \begin{equation}CI = \gamma /\beta ,\end{equation}
where  $CI = n$ and $CI = 1/n$, with n being an integer, describe distributions formed by subharmonic/superharmonic components and represent particular forms of commensurate systems. More complex rational values lead to complicated distributions – the resulting flow systems are periodic, with wavelengths varying by several orders of magnitude. The irrational values describe aperiodic distributions (the non-commensurate systems). Truncation inherent to computer architecture prevents accessing the latter systems as the resulting CI terms become rational. If one assumes that the system wavelength is ${\lambda _s}$, then such a system must contain an integer number of wavelengths of each component, i.e. ${\lambda _s} = m{\lambda _\beta } = n{\lambda _\gamma }$. Once $\beta $ and $\gamma $ have been selected and assuming for simplicity that ${B_\beta } = {B_\gamma } = 1$, the temperature distribution $H(x)$ depends only on $\varOmega$ which varies in the range $0 \le \varOmega \le 2{\rm \pi}$.
Responses of flow system to heatings involving two wavenumbers are illustrated in figure 9 for two cases, i.e.  $(\beta ,\gamma ) = (2,6),(2,4)$, which lead to the same system wavelengths ${\lambda _s} = {\rm \pi}$. The magnitude of ${U_{top}}$ is significantly smaller when compared with the one-mode heating, and its direction changes as a function of $\varOmega$ in an antisymmetric manner with respect to $\varOmega = {\rm \pi}$. The phase difference between the modes plays a control parameter changing both the magnitude and the direction of ${U_{top}}$.
Variations of the upper plate velocity  ${U_{top}}$ as a function of the phase difference $\varOmega $ for $R{a_{per}} = 1200$, $R{a_{uni}} = 0$, $Pr = 0.71$ and $(\beta ,\gamma ) = (2,6),\,(2,4)$. The dotted lines show the reference case of ${U_{top}}$ achieved using heating with a single wavenumber $\alpha = 2$.

Horizontal temperature gradients determine the horizontal gradients of buoyancy force driving convection. When heating involves one Fourier mode, these gradients change direction only once per wavelength (see figure 10a). Using two Fourier modes doubles the number of direction changes producing weaker convection (see figure 10b,c). The use of still more complex temperature distributions requiring multiple Fourier modes further increases the frequency of direction changes of the driving force, thus reducing the effectiveness of convection. One may conclude that the best propulsion is achieved when all heating energy is placed in one Fourier mode or, at the least, temperature distributions leading to multiple changes of direction of the horizontal temperature gradient are avoided.
Flow and horizontal temperature gradients for  $R{a_{per}} = 1200,\,R{a_{uni}} = 0,\,Pr = 0.71,\varOmega = 3{\rm \pi}/2$ for $(\beta ,\gamma ) = (a)\;(2,0),\;(b)\;(2,4),\;(c)\;(2,6)$. Dashed lines mark stream tubes carrying fluid in the horizontal direction. Background colour illustrates the horizontal temperature gradient scaled with $R{a_{per}}$.

These limited results demonstrate that a wide range of possible behaviors of the flow system arises when it is subject to heating governed by multiple wavenumbers. We intended to highlight the wealth of possible phenomena rather than prosecuting an exhaustive analysis. It is not straightforward to infer the likely properties of the flow under such conditions without the use of a combination of analysis and computations.
4. Heating of the upper plate
Consider moving periodic heating from the lower to the upper plate, making the upper plate stationary and allowing the lower plate to move. Boundary conditions (2.5) need to be replaced with
 \begin{align}y &= - 1{:}\ {\left. {\frac{{\partial u}}{{\partial y}}} \right|_{mean}} = 0,\quad {u_{per}} = 0,\quad v = 0,\quad \theta = 0,\nonumber\\ y &= 1{:}\ u = v = 0,\quad \theta = 0.5\ R{a_{per}} \cos (\alpha x).\end{align}
It is relatively simple to show that the governing systems for the two problems are closely related. If we move the heating to the upper plate and then make transformation  $u \to - U$, $v \to - V$, $p \to P$, $\theta \to - \theta $, $x \to - X + {\rm \pi}$, $y \to - Y$, we find that the underlying equations are unchanged, but the thermal boundary conditions are reversed in sign. Given this relationship between the two cases, there is no need to dwell further on the stationary heated upper plate and moving lower plate, as all the interesting properties can be inferred directly from the results when the lower plate is stationary and heated. The same relative movement of the plates can be created by heating the lower or the upper plate.
5. Summary
It has been demonstrated that patterned heating can be used to generate a propulsive effect. The model problem consisted of two parallel horizontal plates, with the upper plate being free to move and not exposed to any external resistance. The lower plate was subject to simple sinusoidal heating, and the resulting convection created shear at the upper plate, which accelerated this plate until the mean shear was eliminated. This effect is referred to as thermal streaming. The plate motion was possible only for sufficiently intense heating with the proper spatial distribution. The diagram showing variations of the upper plate velocity as a function of the heating intensity is a pitchfork bifurcation. The effectiveness of thermal streaming decreases when either too long or too short heating wavelengths are used. Reducing the Prandtl number increases its effectiveness, similar to adding a uniform heating component. It was further shown that the best effect is achieved by concentrating the heating energy in a single Fourier mode. Finally, it was shown that the thermal streaming effect occurs regardless of the heated plate.
Declaration of interests
The authors report no conflict of interest.
Funding
This work has been carried out with the support of NSERC of Canada.


 Open access

