


Highlights
-
• Bilinguals often speak a language they can use only among family and with friends
-
• The regional language we studied was of this kind
-
• We compared it to the national language that our bilinguals could use in any other context
-
• Stronger emotional responses were elicited by the regional than the national language
-
• This difference was found in a variety of emotions
1. Introduction
Millions of bilinguals around the world speak different languages whether they are in their family or outside their household. This is the typical language experience of immigrants and their children who speak their mother tongue only at home (Montrul, Reference Montrul2016; Polinsky & Kagan, Reference Polinsky and Kagan2007) or in communities where the household language differs from the national language used in public institutions and by the media (Auer, Reference Auer2005). Such a split in language use has potential implications for language and cognition. Here, we investigate its effects on emotion, asking whether languages spoken in these distinct contexts induce emotions of different intensities. The question is, in part, motivated by studies showing that, compared to native tongues, emotions are weaker with foreign languages learned in school and used sporadically (for a review, see Thoma, Reference Thoma2024). This lack of emotional grounding has been attributed to the limited opportunities to experience foreign languages in emotional contexts (Caldwell-Harris, Reference Caldwell-Harris2015; Pavlenko, Reference Pavlenko2017). The two languages we compared in this study are spoken in Italy; both are acquired early in life and are used proficiently, differing crucially in their contexts of use. The regional language can only be spoken among family and people in the community who learned it, whereas the national language is required in all other circumstances, including in print and digital media as a written language (Tuttle, Reference Tuttle, Maiden and Parry1997). We examined whether the regional language, which is rooted in the family and the community, induces stronger emotions. Such a difference in emotional intensity would likely reflect the quality and richness of the emotions experienced among relatives and acquaintances, a difference that the regional language is able to recreate to some extent. A greater emotional intensity with the regional language would contrast with the decreased emotional intensity observed with foreign languages. Accounts explaining the language effects on emotion as depending on the richness of the emotion experienced in the language (Caldwell-Harris, Reference Caldwell-Harris2015; Pavlenko, Reference Pavlenko2017) would naturally predict such polar opposite effects of regional and foreign languages. Evidence of especially intense emotions with the regional language would strengthen accounts linking language effects to opportunities of emotional experience.
The emotional imbalance between bilinguals’ languages has been shown to affect several aspects of daily life, including language choice in psychotherapy (Dewaele & Costa, Reference Dewaele and Costa2013), intimacy and romance between partners who do not share a native language (Piller, Reference Piller2011), food preferences (Geipel et al., Reference Geipel, Hadjichristidis and Klesse2018) and the effectiveness of advertising (Puntoni et al., Reference Puntoni, De Langhe and Van Osselaer2009). However, the implications of such an emotional imbalance extend to cognitive theories. Decisions concerning risky prospects, monetary rewards and moral judgments were found to vary depending on whether bilinguals made such choices in their native or foreign language (for reviews, see Circi et al., Reference Circi, Gatti, Russo and Vecchi2021; Del Maschio et al., Reference Del Maschio, Crespi, Peressotti, Abutalebi and Sulpizio2022; Stankovic et al., Reference Stankovic, Biedermann and Hamamura2022). An explanation that has received extensive consideration relates such language effects to the weaker emotionality of foreign languages (Costa et al., Reference Costa, Foucart, Hayakawa, Aparici, Apesteguia, Heafner and Keysar2014; Pavlenko, Reference Pavlenko2017). The emotions elicited by the regional language would provide a crucial test for explanations linking language effects to emotionality. The effects of the regional language on choices should, in fact, reflect its emotional strength. Therefore, for example, they should differ from the effects of the foreign languages if the regional language induces stronger emotions than the foreign languages.
The regional language is spoken in contexts that provide unique conditions for expressing and feeling emotions. The family is where emotions are first experienced, learned and regulated (Morris et al., Reference Morris, Silk, Steinberg, Myers and Robinson2007); the bonds created with friends allow one to express emotions more freely (Rubin et al., Reference Rubin, Bukowski, Parker and Bowker2008). The contexts in which the national language is used may shape emotions in a different way. There are many opportunities to experience emotions at school and work, but the norms regulating social interactions that are in place here are likely to restrict emotional range and expressivity. Books and movies describe a variety of emotions – often very intense ones – but these emotions, in contrast to those felt in other contexts of everyday life, lack multisensory richness and are portrayed as another person’s experiences rather than our own. Our study investigates whether the strength of emotions elicited by regional and national languages reflects the fundamental differences between the environments in which the languages are used. Although our participants knew the regional language quite well, how early they learned it in childhood and how extensively they have used it could vary. This is expected with a language whose acquisition and use depend on specific circumstances. For example, many acquire their regional language among family; if parents do not speak it, the neighborhood could offer an alternative learning environment. Similarly, the possibility of speaking it among friends depends on how many of them have learned it. This variability gives us an opportunity to assess the possible effect of age of acquisition (AoA) and frequency of use on the perceived strength of emotions induced by languages used skillfully and habitually.
Context matters not only for language but also for emotions. The contexts in which emotions are learned, expressed and regulated may vary across emotions. This variation is relevant for testing our hypothesis that the emotions felt in each language reflect the emotional experience afforded in the contexts in which the language is used. The hypothesis does not anticipate generalized differences between the national and the regional language; rather, differences should appear with emotions experienced differently across linguistic contexts. Identifying such emotions is crucial for testing the hypothesis. Two plausible candidates, we reasoned, are disgust and mirth (i.e., the feeling of well-being experienced with humor).
Although newborns show an innate response to bitter and sour tastes and irritants, it is only through prolonged learning, between 2 and 12 years of age, that children become sensitive to the variety of stimuli adults find repugnant (Rottman, Reference Rottman2014; Rozin & Haidt, Reference Rozin and Haidt2013). Social transmission is the key in this acquisition, and interaction with parents is especially critical in shaping revulsion responses that are mainly associated with food, nauseous body substances and repugnant animals in the first years of life (DeJesus et al., Reference DeJesus, Gerdin, Venkatesh and Rottman2021; Stevenson et al., Reference Stevenson, Oaten, Case, Repacholi and Wagland2010). Evidence suggesting parental modeling of disgust includes similarities in disgust sensitivity between parents and their offspring (Rozin et al., Reference Rozin, Fallon and Mandell1984) and the negative reaction to spiders demonstrated by daughters of arachnophobic mothers (De Jong et al., Reference De Jong, Andrea and Muris1997). When disgust is first experienced and regulated in an environment where the regional language is extensively used, a greater sensitivity to disgust could arise in this language, a possibility we tested in Experiment 1.
We focused on humor, a main source of mirth. Research on humor has emphasized the many social functions served by humor (La Fave et al., Reference La Fave, Haddad and Maesen2017; Martin & Ford, Reference Martin and Ford2018). For example, it can provide an effective persuasion device (Beard, Reference Beard2005), and since it is perceived as a desirable and valued trait, it can boost social recognition (Bressler & Balshine, Reference Bressler and Balshine2006; Cann & Matson, Reference Cann and Matson2014; Sprecher & Regan, Reference Sprecher and Regan2002). Its functions extend to in-group settings, as people use humor to enhance cohesion and reinforce a sense of group identity (Kashdan et al., Reference Kashdan, Yarbro, McKnight and Nezlek2014; Kurtz & Algoe, Reference Kurtz and Algoe2015; Martineau, Reference Martineau, Goldstein and McGhee1972; Meyer, Reference Meyer2000; Romero & Pescosolido, Reference Romero and Pescosolido2008; Treger et al., Reference Treger, Sprecher and Erber2013). Ridicule, the abrasive side of humor, contributes to social control, reinforces hierarchical social structures within the group and is often used to instill prejudice as well as divisions across groups (Ford et al., Reference Ford, Richardson and Petit2015; Hodson & MacInnis, Reference Hodson and MacInnis2016; Janes & Olson, Reference Janes and Olson2000; Westwood & Johnston, Reference Westwood and Johnston2013). Of relevance here, irony is rated as more humorous when involving close friends than casual acquaintances (Pexman & Zvaigzne, Reference Pexman and Zvaigzne2004). It is among family, within the circle of friends and in the hometown – groups where the regional language is spoken – that the multifaceted social functions of humor are at play. Whether these ties between humor and regional language translate into a greater enjoyment of humor in the regional language was investigated in Experiment 2.
In both experiments, the language in which participants were tested was randomly assigned. To preview the results, participants reported feeling disgust more intensely and enjoying humor more strongly in the regional language than in the national language. These results contrasted with the findings of our previous study (Miozzo et al., Reference Miozzo, Navarrete, Ongis, Mello, Girotto and Peressotti2020), in which emotional phrases like endearments (I missed you!) and insults (I’m sick of you!) elicited emotions of comparable strength in the national and regional language. The lack of stronger emotional responses reported in Miozzo et al. (Reference Miozzo, Navarrete, Ongis, Mello, Girotto and Peressotti2020) is puzzling in light of the greater sensitivity to disgust and humor observed in Experiments 1 and 2. Experiment 3 aimed to identify the roots of the discrepancies between the findings in Experiments 1 and 2 and in Miozzo et al. (Reference Miozzo, Navarrete, Ongis, Mello, Girotto and Peressotti2020). To this end, in Experiment 3, we re-run the original experiment of Miozzo et al. (Reference Miozzo, Navarrete, Ongis, Mello, Girotto and Peressotti2020), improving its design. As explained in detail below (see Experiment 3), we suspected that the comparable strength of the emotional responses observed in Miozzo et al. (Reference Miozzo, Navarrete, Ongis, Mello, Girotto and Peressotti2020) was due to the choice of an inadequate baseline. The new baseline introduced in Experiment 3 proved successful in revealing a stronger responsiveness to emotional phrases in the regional language, so that the results of Experiment 3 aligned with those of Experiments 1 and 2, and altogether show more convincingly the greater strength the regional language has to induce certain emotions.
Participants in Experiments 1–3 lived in Veneto, a northeastern region of Italy in which 70% of residents speak Venetian, the local regional language (Demos, 2023). Venetian is one of the several regional languages spoken in Italy (Maiden, Reference Maiden1995). Italian is the national language of Italy, but the use of regional languages remains robust and widespread in the country – as reported in the latest national census, 41.2% of Italians, aged 18–74 years, roughly equivalent to 10.3 million, speak a regional language habitually (ISTAT, 2014). Even though Italian and Venetian are historically derived from Latin, they are mutually unintelligible (Ferguson, Reference Ferguson2007), thus differing to a degree comparable to that existing between other Neo-Latin languages, such as Italian and French, or Spanish and Portuguese. While Venetian is only oral, Italian is also written, a feature that, together with its nationwide use, confers it a privileged status.
2. Experiment 1: disgust
Disgust is an emotion with distinct behavioral, cognitive and physiological features that are typically displayed with a characteristic facial expression (Levenson, Reference Levenson2003; Olatunji & Sawchuk, Reference Olatunji and Sawchuk2005). Autonomic responses induced by disgust include heart rate deceleration, reduced blood pressure and decreased skin conductance (Stark et al., Reference Stark, Walter, Schienle and Vaitl2005). Ever since Darwin’s (Reference Darwin1872) seminal study of emotions, disgust has been related to distasting food. However, it has long been recognized that a wide range of aversive stimuli that share potential associations with disease, uncleanliness and contamination elicit revulsion responses (Oaten et al., Reference Oaten, Stevenson and Case2009; Olatunji & Sawchuk, Reference Olatunji and Sawchuk2005). Thus, body waste, gore, dismemberment of the human body and sexual acts could also be repugnant. Disgust has been commonly viewed as a distaste response that protects against pathogen infection (Oaten et al., Reference Oaten, Stevenson and Case2009; Rozin et al., Reference Rozin, Haidt, McCauley, Barrett, Lewis and Haviland-Jones2016; Schaller & Duncan, Reference Schaller, Duncan, Forgas, Haselton and von Hippel2007). As a defense against contamination and disease, it would provide an evolutionary advantage (Curtis et al., Reference Curtis, Aunger and Rabie2004; Rottman, Reference Rottman2014; Tybur et al., Reference Tybur, Lieberman, Kurzban and DeScioli2013). Evidence suggesting its evolutionary fitness includes the cross-cultural similarities of its expression (Mesquita & Frijda, Reference Mesquita and Frijda1992), that disease-predictive cues are among the stimuli universally eliciting it (Curtis et al., Reference Curtis, Aunger and Rabie2004; Guernier et al., Reference Guernier, Hochberg and Guegan2004), and that individuals more exposed to pathogens (e.g., for living nearer the equator) tend to be more sensitive to it (Oaten et al., Reference Oaten, Stevenson and Case2009). Foods and body products represent the main disgust elicitors, being most closely related to disgust’s primary function of protecting against pathogens (Oaten et al., Reference Oaten, Stevenson and Case2009; Rozin et al., Reference Rozin, Haidt, McCauley, Barrett, Lewis and Haviland-Jones2016; Tybur et al., Reference Tybur, Lieberman, Kurzban and DeScioli2013). As a mechanism protecting against contamination, disgust represents the natural precursor of revulsion toward stimuli culturally construed as unclean or impure (Olatunji & Sawchuk, Reference Olatunji and Sawchuk2005; Rozin et al., Reference Rozin, Haidt, McCauley, Barrett, Lewis and Haviland-Jones2016; Tybur et al., Reference Tybur, Lieberman, Kurzban and DeScioli2013). The extent of the stimuli eliciting disgust remains a matter of debate, with some researchers proposing that disgust underlies morality or social distancing (Chapman et al., Reference Chapman, Kim, Susskind and Anderson2009; Faulkner et al., Reference Faulkner, Schaller, Park and Duncan2004; Fiske et al., Reference Fiske, Cuddy, Glick and Xu2002; Graham et al., Reference Graham, Haidt, Koleva, Motyl, Iyer, Wojcik and Ditto2013). What causes disgust is also determined by heuristics commonly referred to as laws (Rozin & Nemeroff, Reference Rozin and Nemeroff1990). The law of contagion (“once in contact, always in contact”) refers to transmissibility by proximity. An example is provided by people’s reluctance to drink juice that was previously in contact with a sterile cockroach (Rozin et al., Reference Rozin, Millman and Nemeroff1986). According to the law of similarity, what looks similar has a similar essence. It is because of this law that, for example, people are hesitant to eat a chocolate fudge shaped like dog feces (Rozin et al., Reference Rozin, Millman and Nemeroff1986).
The Disgust Scale (DS; Haidt et al., Reference Haidt, McCauley and Rozin1994) has been extensively used to measure individual differences in disgust sensitivity. Written sentences are used in the DS to induce reactions typically elicited by visual or olfactory stimuli. It has proven to have predictive utility in psychopathology – for example, with hypochondriasis (Davey & Bond, Reference Davey and Bond2006), spider phobia (Tolin et al., Reference Tolin, Lohr, Sawchuk and Lee1997) and blood–injection–injury phobia (Sawchuk et al., Reference Sawchuk, Lohr, Tolin, Lee and Kleinknecht2000) – and to detect experience-based changes in disgust level, such as between medical and psychology students (Pehlivanidis et al., Reference Pehlivanidis, Pehlivanidi, Papanikolaou, Mantas, Bertou, Chalimourdas and Papageorgiou2020), or during the first trimester of pregnancy (Fessler et al., Reference Fessler, Eng and Navarrete2005). We administered the revised version of the DS (DS-R; Olatunji et al., Reference Olatunji, Williams, Tolin, Abramowitz, Sawchuk, Lohr and Elwood2007) in which inadequate items were removed. Confirmatory factor analyses conducted on the DS-R revealed a three-factor solution: core disgust, contamination-based disgust and animal reminder disgust. Example items corresponding to each of these factors are shown in Table 1. Core disgust refers to stimuli that pose a threat of disease, of which rotting food, waste products and small animals are primary elicitors. Contamination-based disgust is related to the risk of contagion and the implicit theories people construe concerning the transmissibility of germs and diseases (Oaten et al., Reference Oaten, Stevenson and Case2009). Animal reminder disgust is a form of disgust stemming from the recognition of our own animality, possibly related to our own mortality (Rozin et al., Reference Rozin, Haidt, McCauley, Barrett, Lewis and Haviland-Jones2016). Accordingly, dead bodies and dismembered body parts could be considered repugnant because they remind us of the animal origins of humans. Children react negatively to elicitors related to core disgust from an early age, possibly modeling their responses on those of their parents (Rottman, Reference Rottman2014; Rozin et al., Reference Rozin, Haidt, McCauley, Barrett, Lewis and Haviland-Jones2016). The aspects of disgust related to contamination and animal reminders appear later in development, probably due to the more sophisticated cognitive mechanisms they require (Blacker & LoBue, Reference Blacker and LoBue2016; Rozin & Haidt, Reference Rozin and Haidt2013). The three-factor structure of DS-R, originally found with relatively homogeneous samples from the United States, was replicated in several other countries, including Italy, where our experiment was conducted (Olatunji et al., Reference Olatunji, Moretz, McKay, Bjorklund, de Jong, Haidt and Schienle2009; van Overveld et al., Reference van Overveld, de Jong, Peters and Schouten2011). These findings confirmed the multidimensionality of disgust proposed in several theories of disgust (Marzillier & Davey, Reference Marzillier and Davey2004; Rozin et al., Reference Rozin, Haidt, McCauley, Barrett, Lewis and Haviland-Jones2016; Simpson et al., Reference Simpson, Carter, Anthony and Overton2006; Stevenson et al., Reference Stevenson, Case, Oaten, Stafford and Saluja2019; Tybur et al., Reference Tybur, Lieberman and Griskevicius2009). Consistent with the multidimensional nature of disgust revealed by DS-R and proposed in several theories, differences between the national and regional languages were examined not only with the entire scale, but also for each subscale reflecting the three-factor solution found in Oaten et al. (Reference Oaten, Stevenson and Case2009).
Examples of items from the Disgust Scale (Revised)

Note: Core Disgust subscale: items a, b, c, and d; Animal Reminder Disgust subscale: items e and f; Contamination-Based Disgust subscale: items g and h.
2.1. Methods
2.1.1. Materials
Regional languages tend to have smaller vocabularies relative to national languages, so the DS-R was first translated from English into Venetian (all items from DS-R are available in the Open Science Framework repository, link: https://osf.io/tzuwp/?view_only=6afecf7a81f942879895cccdf53e7a0e). The DS-R was then translated from Venetian into Italian. To ensure between-translations correspondence, the DS-R was back-translated into Venetian. Participants rated either their agreement (first 13 items) or their disgust (last 12 items). Following the recommendations of Olatunji et al. (Reference Olatunji, Williams, Tolin, Abramowitz, Sawchuk, Lohr and Elwood2007), a 7-point scale was used for both ratings (1 = little agreement/disgust; 7 = complete agreement/disgust). Two symbols (thumbs up and thumbs down) displayed at scale ends indicated maximum agreement and disagreement, respectively. Two emojis, one showing a neutral face and the other showing a face expressing disgust, appeared together with the DS. The use of symbols and emojis allowed us to present the same scale in both languages. Item presentation was randomized for each participant. As in previous studies (Miozzo et al., Reference Miozzo, Navarrete, Ongis, Mello, Girotto and Peressotti2020; Peressotti, Lorenzoni, & Miozzo, Reference Peressotti, Lorenzoni and Miozzo2024; Peressotti, Pianezzola, et al., Reference Peressotti, Pianezzola, Battistutta and Miozzo2024), different speakers recorded the material in Italian and Venetian because Italian–Venetian bilinguals speak Italian with a regional accent. To minimize any idiosyncrasies related to individual speakers, two speakers (a male and a female) recorded the DS-R in Italian and two other speakers (a male and a female) provided the recording in Venetian. The recordings made in both languages for Experiments 1–3 are available in the Open Science Foundation (OSF) repository (link: https://osf.io/tzuwp/?view_only=6afecf7a81f942879895cccdf53e7a0e).
2.1.2. Procedure
Experiment 1 was conducted online using the Qualtrics platform. Participants were instructed to find a quiet place or wear headphones. Experiment 1 required the completion of several tasks, starting with the DS-R. To listen to the items of the DS-R, participants clicked on the play button icon that appeared on the screen. Participants could listen to any sentences again. The language (Italian or Venetian) in which the DS-R was administered was randomly assigned to each participant. The next task was a forced-choice grammaticality test assessing Venetian proficiency (from Miozzo et al., Reference Miozzo, Navarrete, Ongis, Mello, Girotto and Peressotti2020). This test examined grammatical features that differed between Venetian and Italian. To make the test especially challenging for speakers with little experience with Venetian, who probably relied for their responses on their knowledge of Italian, foils represented the correct choice in Italian. The final task (Language Use Questionnaire; Scaltritti et al., Reference Scaltritti, Peressotti and Miozzo2017) was administered in Italian and assessed participants’ acquisition and use of Venetian. Specifically, participants reported whether Venetian was learned before 5 years of age, and the percentage of time in which they spoke Venetian among family, with friends, at work and when interacting with people in their hometown.
2.1.3. Participants
In Experiments 1–3, participants were recruited through social media using a ‘snowball’ procedure. We excluded the responses of 12 participants in Experiment 1 whose accuracy in the forced-choice Venetian grammaticality test was equal to or lower than the chance level (4/8). The remaining participants (n = 111) reported speaking Venetian 48.3% of the time (averaged across family, friends, work and hometown); 72% of them indicated that they learned Venetian before 5 years of age. The participants tested in Italian (n = 50) and Venetian (n = 61) did not differ for gender (χ 2 = 0.06) and age (mean years [standard error]: 47.0 [1.5] vs. 49.5 [1.7]); t = 1.09). Demographics and details of the language use of participants tested in each language are reported in Table 2.
Participants’ demographics and language experience

a Percentage of participants who reported that they learned Venetian before 5 years of age.
b Mean number of correct responses to the eight force-choice questions of the Venetian grammaticality test.
2.2. Data analysis
We used cumulative regression mixed models to analyze the responses in each experiment of the present study. The assumption underlying the analyses was that the observed ordinal variable originated from the categorization of a latent continuous variable (e.g., disgust intensity in Experiment 1). All analyses were performed using R (R version 4.3.3, R Core Team, 2024); datasets and analysis scripts from each experiment can be found in the OSF repository (https://osf.io/tzuwp/?view_only=6afecf7a81f942879895cccdf53e7a0e). To model ordinal responses, we used the brms package (Bürkner, Reference Bürkner2017, Reference Bürkner2018), which allows estimating ordinal models in combination with multilevel structures (Bürkner & Vuorre, Reference Bürkner and Vuorre2019). Models were fitted using the Bayesian Markov Chain Monte Carlo (MCMC) estimation method implemented in the probabilistic programming language STAN through the R package brms (Stan Development Team, 2019). Model estimates were based on four MCMC simulations, each comprising 5,000 replications (2,500 warm-up iterations discarded). To limit the estimate of the regression coefficients, we used Student’s t distribution prior with df = 3, mean = 0 and standard deviation = 1. A model comparison approach was used to identify the best model, starting with the null model that only included participants and items as random intercepts to account for individual-specific variability and item idiosyncrasies, respectively. Predictors and interactions were included subsequently. Categorical predictors were coded using Helmert coding. If adding a predictor did not improve the model’s fit, in the next models, the predictor was no longer included. Convergence was assessed (a) by visual inspection of traces of the posterior predictive check and (b) by examining the R-hat values, adopting a maximum accepted value for satisfactory convergence of 1.05 as suggested by Vehtari et al. (Reference Vehtari, Gelman, Simpson, Carpenter and Bürkner2021). We employed the leave-one-out cross-validation (LOOCV; Vehtari et al., Reference Vehtari, Gelman and Gabry2017) to evaluate model performance and compute model weights (Yao et al., Reference Yao, Vehtari, Simpson and Gelman2018). LOOCV provides a score (leave-one-out information criterion, LOOIC), that can be interpreted similarly to more widely used information criteria for model performance, such as Akaike Information Criterion (Akaike, Reference Akaike, Parzen, Tanabe and Kitagawa1998). Lower LOOIC values and higher weights (w) indicate a more plausible model. The full output of all models is available in the OSF repository. The tables included in the article provide a summary of the models tested in each experiment and of the best-fitting model.
In Experiment 1, in addition to language (Italian vs. Venetian) and subscale (core disgust, contamination-based disgust and animal reminder disgust) – the two variables on which the experiment focused – we also included gender (female vs. male) to control for any gender differences reported in prior studies (higher levels of disgust endorsed by women than men; e.g., see Olatunji et al., Reference Olatunji, Williams, Tolin, Abramowitz, Sawchuk, Lohr and Elwood2007). The parameters were introduced into the models in the following sequence: language (Model 1), gender (Model 2), subscale (Model 3) and the random slope for the effect of subscale (Model 4). For exploratory purposes, we also run Model 5, including the language × subscale interaction. As gender was consistently balanced between the participants tested in the two languages, in none of the experiments was the interaction between gender and language included as a predictor, a choice that allowed us to simplify the model structure. Responses from 12 participants who preferred not to specify a gender were excluded from the analysis. To allow model comparison, they were also excluded from successive analyses. (Note: similar results were obtained in the final model when we included the responses of these 12 participants.)
2.3. Results
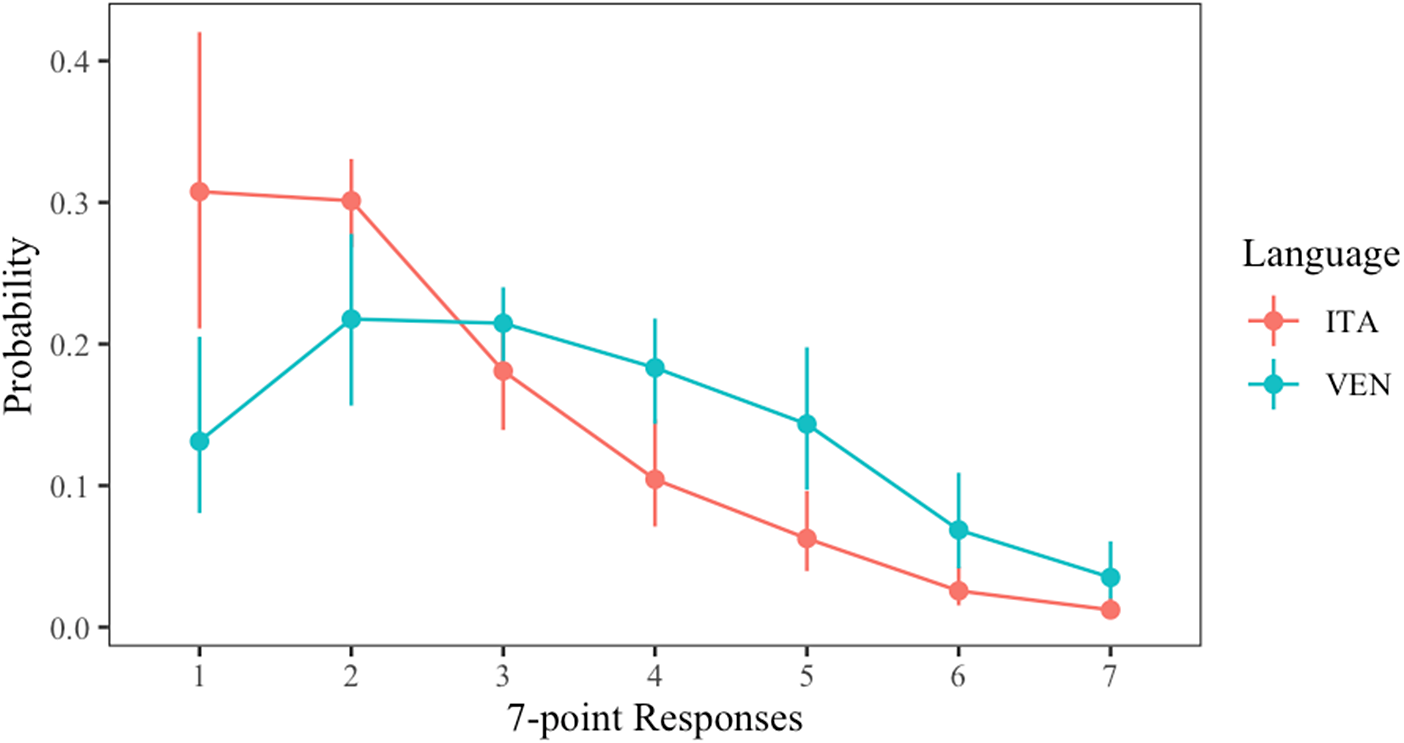
Cronbach’s α estimates for the whole scale was an acceptable .85. Of the three subscales, only core disgust demonstrated acceptable internal consistency estimates (α = .73; contamination-based disgust, α = .61; animal reminder disgust, α = .57). The results of the regression model comparison are shown in Table 4A. The model that best fitted the data was Model 5, which included the fixed effects of language and subscale and the language × subscale interaction. A summary of the output of Model 5 is reported in Table 4B. Parameter posterior means and standard deviations are shown in Table 4B within the “Estimate” and “Est. Error” columns, respectively. The “l-95% CI” and the “u-95% CI” columns provide the lower and the upper bounds of the credible intervals (CrIs), corresponding to the 2.5th and the 97.5th percentiles of the posterior distribution. When this interval does not include 0, one can conclude with at least 95% probability that the participants’ response was modulated by that parameter. The results of Model 5, shown in Table 4B, indicate that language affected participants’ responses, inducing higher disgust ratings in Venetian than Italian. As illustrated in Figure 1, which shows the estimated frequencies of each score of the 7-point scale, higher scores were more frequent in Venetian and lower scores in Italian. The lack of statistical evidence of a language × subscale interaction revealed by the CrIs corresponding to the interaction (see Table 4B) suggests a rather uniform language effect across subscales, and it further shows the pervasiveness of the stronger disgust responses elicited by the regional language.
Frequency (estimated probability) of each score in the 7-point scale of the DS-R for each language and subscale. Bars correspond to the interval between the 2.5th and 97th percentile.

3. Experiment 2: humor
Humor evokes a pleasant emotional response and makes us laugh. Various terms have been used to describe the feeling of well-being experienced with humor, including amusement, hilarity, cheerfulness, exhilaration and merriment (Martin & Ford, Reference Martin and Ford2018). Following Martin (Reference Martin2019), we refer to it as mirth, a term that captures the close relation of this emotion with humor and laughter. Mirth induces a range of physiological changes (Ito & Cacioppo, Reference Ito and Cacioppo2012), many of which are associated with a temporary increase in the activity of the sympathetic nervous system (Behnke et al., Reference Behnke, Kreibig, Kaczmarek, Assink and Gross2022; Foster et al., Reference Foster, Webster and Williamson2002). Laughter is the most immediately recognizable neurophysiological response of mirth. Of the many facial displays associated with laughter and smiles (Frank et al., Reference Frank, Ekman and Friesen1993), the so-called Duchenne smile (Ekman et al., Reference Ekman, Davidson and Friesen1990) is reliably observed when genuine enjoyment and amusement are experienced (Keltner & Bonanno, Reference Keltner and Bonanno1997). In the Duchenne smile, both the cheeks and the corners of the mouth raise, due to contraction of the muscle orbicularis oculi and the zygomatic major, respectively; only the zygomatic major contracts in a regular smile. We turned to humor to find additional evidence that, compared to national languages, regional languages induced stronger emotional responses. As customary in humor research (Martin & Ford, Reference Martin and Ford2018), we experimentally induced mirth by showing cartoons describing hilarious events or situations. We asked Italian–Venetian bilinguals to rate how much the cartoons made them laugh. To the extent that laughter is inherently related to mirth, assessing laughter provided a measure, although indirect, of the emotional response. Crucially, self-reported measures of amusement of the kind we collected were found to correlate with physiological changes induced by humor, including zygomatic major activity (Ekman et al., Reference Ekman, Davidson and Friesen1990), skin conductance responses and heart rate (Fiacconi & Owen, Reference Fiacconi and Owen2015; Kreibig et al., Reference Kreibig, Samson and Gross2013; Ruiz‐Padial et al., Reference Ruiz‐Padial, Moreno‐Padilla and del Paso2023; Vieillard & Pinabiaux, Reference Vieillard and Pinabiaux2019).
Much research on humor has been devoted to determining why a joke is funny. Current proposals view incongruity as an essential aspect of a joke’s humor (Attardo, Reference Attardo1993; Morreall, Reference Morreall1983; Nerhardt, Reference Nerhardt, Chapman and Foot1976; Shultz, Reference Shultz1972; Warren et al., Reference Warren, Barsky and McGraw2021). Jokes are funny not only when they portray odd or unexpected situations, but also if they provide a framework to interpret the situation in an out-of-the-ordinary, playful way. A cartoon our participants found amusing showed a psychoanalyst telling his client, “For what it’s worth, I didn’t like your mother either.” It is unexpected that a psychoanalyst reveals any feelings, but that becomes understandable (and hilarious) if we think of all the negative things the client must have told, in previous sessions, about the mother. Enjoying the joke requires cognitive processes that output an interpretation consistent with the playful framework of the joke. These processes are cognitively demanding (Giora et al., Reference Giora, Drucker, Fein and Mendelson2015; Katz et al., Reference Katz, Blasko and Kazmerski2004; Spotorno & Noveck, Reference Spotorno and Noveck2014). Moreover, jokes often rely on nuanced linguistic knowledge and familiarity with a specific culture (Aarons, Reference Aarons2012; Goatly, Reference Goatly2012; Ritchie, Reference Ritchie2004). Increased cognitive demands and cultural specificity, in part, explain why jokes are less funny when told in a foreign language (Ayçiçeği-Dinn et al., Reference Ayçiçeği-Dinn, Şişman-Bal and Caldwell-Harris2018; Ezrina & Valian, Reference Ezrina and Valian2023). We expect our proficient bilinguals to be perfectly capable of understanding humor in both languages. Any language difference is not likely to reflect humor appreciation, but rather the emotional response to it.
3.1. Methods
3.1.1. Materials
To find cartoons appropriate for our multigenerational group of participants, we searched through La settimana enigmistica, a weekly Italian magazine specialized in crossword puzzles and word games, with an estimated weekly sale of 600–800,000 copies and a wide readership (Il Post, 2016). We selected 23 cartoons. Each cartoon showed a black-and-white drawing with a caption, written in Italian, which transcribed something said by a character shown in the cartoon. A description of the material is provided in the OSF repository. Written captions were removed. Captions were translated into Venetian and then translated back into Italian. A male or a female bilingual speaker recorded the caption, depending on the gender of the character who said the caption in the cartoon in both Italian and Venetian. Both were nonprofessional actors who had been trained to speak Italian without a regional accent. Lower pitch, higher amplitude or slow speech are prosodic cues speakers may use to express irony and sarcasm (Anolli et al., Reference Anolli, Ciceri and Infantino2002; Bryant, Reference Bryant2010; Cheang & Pell, Reference Cheang and Pell2008; Rockwell, Reference Rockwell2000) or that listeners may use to recognize satire or mockery (Bryant & Tree, Reference Bryant and Tree2002; Mauchand et al., Reference Mauchand, Vergis and Pell2020; Woodland & Voyer, Reference Woodland and Voyer2011). We took several measures to minimize the prosodic differences between the Italian and Venetian recordings. First, each speaker (a male and a female) recorded the captions in Italian and Venetian. Second, the speakers were instructed to speak with neutral intonation and at a regular rate. Third, we controlled the length, pitch and amplitude of Italian and Venetian captions. Length was comparable between Italian and Venetian captions (mean (range): 3.00 (1.12–4.34) versus 3.30 (1.46–4.47) sec.; t(44) = .22, p = .22). The pitch (F0) and intensity were measured for each sentence using Praat (Boersma & Weenink, Reference Boersma and Weenink2023). Male and female voices were analyzed separately because of the sex differences that exist in pitch and intensity. As shown in the data summary of Table 3, the pitch varied similarly between languages. All measures of amplitude matched with the female voice; maximal amplitude, however, was higher for Italian sentences with the male voice. Higher amplitude could make cartoons more ironic in Italian. Mirth, however, was felt more strongly in Venetian (see results below), a finding that cannot be explained by the higher amplitude of Italian captions.
Pitch (F0) and amplitude of Italian and Venetian sentences recorded by a female (n = 26) and a male bilingual (n = 37) and presented in Experiment 3; standard deviation in brackets

(A) Cumulative regression models carried out in Experiment 1. For each model, we report its formula, the LOOIC value, the standard error (SE) of the LOOIC and the model’s weight. The best-fitting model (Model 5) is shown in bold and summarized in (B). Language is the only predictor modulating participants’ ratings and it is marked in bold. Language 1 contrasts Italian (−1) vs. Venetian (1); subscale 1 contrasts Animal Reminder Disgust subscale vs. the mean of the other two subscales for; subscale 2 contrasts Contamination-based Disgust vs. Core Disgust subscales

Note: 1 | Part and 1 | Item represent the random intercepts for participants and items, respectively. Subscale | part represents the participants’ random slope for the effect of subscale.
3.1.2 Procedure
Each cartoon appeared in the center of the screen along with a play button icon that participants clicked to listen to the caption. If they wanted, participants could listen to the caption again. Participants rated how much each cartoon made them laugh, using a 7-point scale (1 = not at all; 7 = a lot). Two emoticons were displayed at the end of the rating scale, one showing a neutral face and a laughing face, respectively. The same rating scale was presented in both languages. In all other respects, the procedure was the same as in Experiment 1. The order of cartoon presentation was randomized for each participant.
3.1.3 Participants
A total of 87 participants completed all the tasks in Experiment 2 (cartoon ratings, Venetian grammaticality test and the Language Use Questionnaire). We excluded from analyses the responses of three participants whose accuracy was equal to or lower than 4/8 responses of the Venetian grammaticality test. The remaining participants (n = 84) estimated using Venetian, on average, 25.4% of the time, while among the family, with friends, at work and in their hometown; 58/84 (59%) participants reported an early acquisition of Venetian (before 5 years of age). Participants tested in Italian (n = 46) and Venetian (n = 38) did not differ for gender (χ 2 = 1.71) and age (t = 1.68). A summary of demographic and language use for participants tested in each language is presented in Table 2.
3.2. Data analyses
Two cartoons (4 and 7) were excluded from analyses because the humoristic word play worked in Italian, but not in the Venetian translation.Footnote 1 Data were analyzed using the cumulative regression mixed models described in Experiment 1. In light of results showing gender differences in contexts eliciting laughter and humor style (Crawford, Reference Crawford2003; Martin & Kuiper, Reference Martin and Kuiper1999), gender was included as a predictor. Language (Italian versus Venetian) was included in Model 1 and gender (Female versus Male) was added in Model 2.
3.3. Results
We report the results of the model comparisons of Experiment 2 in Table 5A. The best-fitting model was Model 1, which only included the fixed effect of language, a finding revealing that language modulated laughter ratings. Results of Model 1 are reported in Table 5B. As shown in Figure 2, higher ratings indicating greater laughter occurred more in Venetian; conversely, lower ratings associated with less laughter were more common in Italian. In conclusion, the results of Experiment 2 showed that mirth was experienced with humor more strongly in the regional language.
Frequency (estimated probability) of each score of the 7-point scale used in Experiment 2 to evaluate the emotional response to cartoons. Bars represent the interval between the 2.5th and 97th percentile.

(A) Cumulative regression models carried out in Experiment 2. For each model, we report its formula, the LOOIC value, the standard error (SE) of the LOOIC and the model’s weight. The best-fitting model (Model 1) is shown in bold and summarized in (B). Language affects participants responses, and it is marked in bold. Italian (−1) and Venetian (1) are contrasted

Note: 1 | Part and 1 | Item represent the random intercepts for participants and items, respectively.
4. Experiment 3: emotional phrases
To express their emotions, speakers can rely on a swift and effective linguistic device: the many phrases existing in their language to express specific emotions – from happiness (I’m cloud nine!) to anger (That’s enough!) to surprise (Unbelievable!). Emotional phrases are part of a language’s lexicon and a speaker’s vocabulary, and their widespread use is probably explained by the immediacy and efficacy with which a wide range of emotions can be expressed. In light of the results of Experiments 1 and 2, it is surprising that Miozzo et al. (Reference Miozzo, Navarrete, Ongis, Mello, Girotto and Peressotti2020) did not find a heightened emotion responsiveness for emotional phrases in Venetian. Miozzo et al. (Reference Miozzo, Navarrete, Ongis, Mello, Girotto and Peressotti2020) translated the emotional phrases used in prior studies (Caldwell-Harris et al., Reference Caldwell-Harris, Tong, Lung and Poo2011; Caldwell-Harris & Ayçiçeği-Dinn, Reference Caldwell-Harris and Ayçiçeği-Dinn2009; Harris, Reference Harris2004) to assess the intensity of emotions in native and foreign languages: endearments (I missed you!), insults (I’m sick of you!) and reprimands of the kind parents use to admonish children (Be good!). The rather low and uniform emotion ratings found in Miozzo et al. (Reference Miozzo, Navarrete, Ongis, Mello, Girotto and Peressotti2020) were a cause of concern, as such a flattening could have resulted from an underappreciation of the emotional content of the phrases. The lack of ‘neutral’ sentences with low emotional content possibly contributed to this flattening. By providing a baseline, these sentences would have helped the raters appreciate the emotional content of the emotional phrases, which in turn would increase the scores of these sentences. This hypothesis has indeed been confirmed in a pilot experiment conducted exclusively in Italian, in which emotional phrases were presented together with more neutral sentences (details of this pilot experiment are presented in the Methods below). Emotional phrases induced stronger emotions than in Miozzo et al. (Reference Miozzo, Navarrete, Ongis, Mello, Girotto and Peressotti2020) (mean ratings: 4.55 vs. 3.90). The present experiment has a twofold aim. First, we would like to verify whether presenting emotional phrases together with neutral sentences would reveal a language effect, with heightened emotion responsiveness in Venetian than in Italian; second, we explored if the strength of the experienced emotions varied as a function of whether the regional language was acquired early in childhood and used often. To the extent that AoA and frequency are variables affecting the processing of lexical forms (Baayen, Reference Baayen2001), we examined the possibility that emotions of stronger intensities appeared only when the regional language is learned early and used extensively. To adequately assess the effect of both variables, we tested a large group of Italian–Venetian bilinguals (n = 358). Proficient Venetian speakers like those who participated in our experiment typically acquired Venetian in infancy (Miozzo et al., Reference Miozzo, Navarrete, Ongis, Mello, Girotto and Peressotti2020; Peressotti, Lorenzoni, & Miozzo, Reference Peressotti, Lorenzoni and Miozzo2024; Peressotti, Pianezzola, et al., Reference Peressotti, Pianezzola, Battistutta and Miozzo2024; Scaltritti et al., Reference Scaltritti, Peressotti and Miozzo2017), a uniformity making our group of participants far from ideal for assessing whether language effects varied depending on when Venetian was learned. AoA (before/after the age of 5 years) was examined for the sake of completeness.
4.1. Methods
4.1.1. Materials and procedure
The Italian and Venetian emotional phrases (five endearments, five insults and five reprimands) were from Miozzo et al. (Reference Miozzo, Navarrete, Ongis, Mello, Girotto and Peressotti2020). Except for two endearments, they were translations of English emotional phrases tested in Harris (Reference Harris2004), Caldwell-Harris and Ayçiçeği-Dinn (Reference Caldwell-Harris and Ayçiçeği-Dinn2009) or Caldwell-Harris et al. (Reference Caldwell-Harris, Tong, Lung and Poo2011). To control that the emotional phrases existed in Italian as lexicalized forms, we searched whether their translations were cited in Italian–English online dictionaries and on sites devoted to the learning of Italian as a second language (a detailed description of the procedure is presented in the OSF repository). Citations were found for all phrases. One of the authors (FP) created 40 Italian sentences to be used as low-emotion-intensity sentences. These sentences described everyday situations and were comparable in length (word number) to the emotional phrases. In the pilot experiment conducted in Italian, a group of 34 Italian speakers, none of whom participated in Experiment 3, rated these sentences and the Italian emotional phrases for emotional strength, using a 7-point scale (1 = low emotional arousal; 7 = very strong emotional arousal). We selected 11 sentences with ratings ranging between 1.47 and 1.87 (mean = 1.67), which were consistently lower than the average ratings obtained for endearments (5.06), insults (4.79) and reprimands (3.79). A web search conducted for the low-emotion-intensity sentences did not result in any English translations, a finding contrasting with the citations consistently obtained for the emotional phrases and confirming that the low-emotion-intensity sentences did not correspond to lexicalized forms. For Experiment 3, the low-emotion-intensity sentences were first translated into Venetian and then back-translated into Italian to control for translation equivalence. The Italian sentences tested in Experiment 3 were those obtained from back-translation. Two Italian–Venetian bilinguals (one male and one female) audio-recorded the emotional phrases and the low-emotion-intensity sentences in Italian and Venetian. Both were nonprofessional actors who had been trained to speak Italian without a regional accent. All materials are available in the OSF repository. Participants of Experiment 3 rated the emotional strength of the sentences presented either in Italian or Venetian using a 7-point scale with arrows pointing down or up at each extreme (1 = low emotional arousal; 7 = very strong emotional arousal). The arrows were introduced to present the same scale in both languages. The scale appeared on the screen together with the play button. In all other respects, the procedure was the same as described in Experiments 1 and 2.
4.1.2. Participants
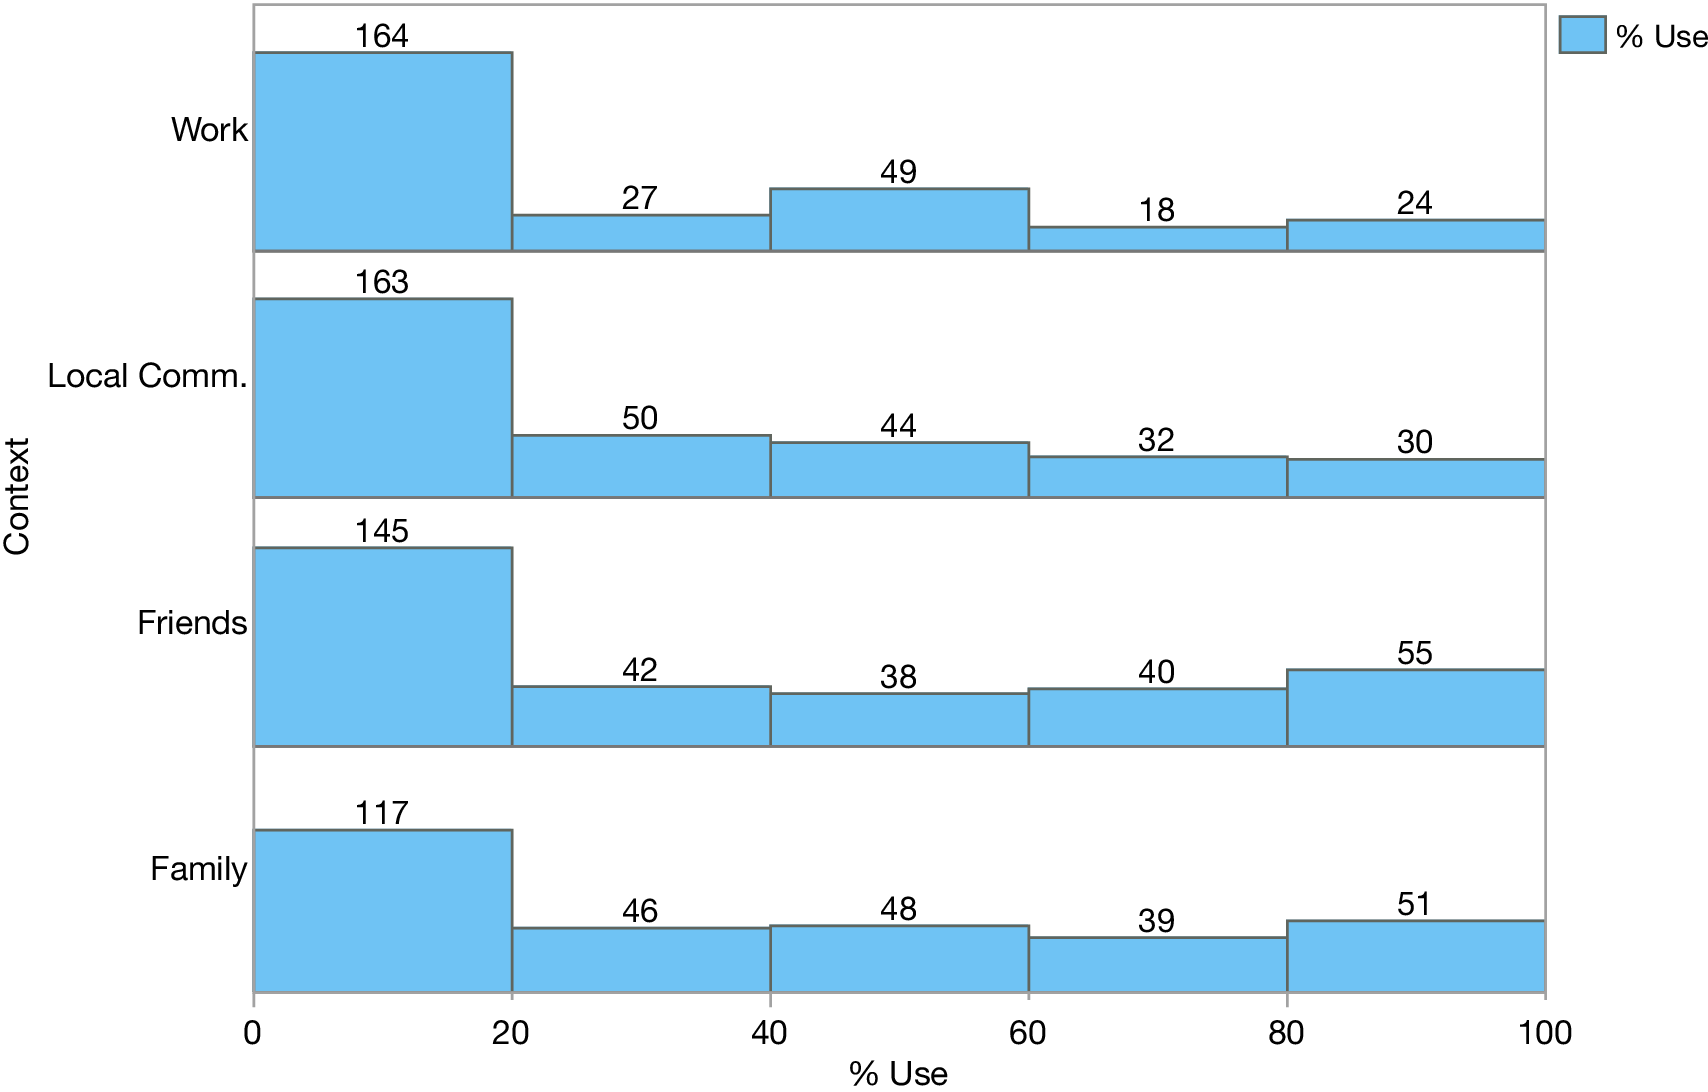
A total of 358 respondents completed all tasks of Experiment 3. We excluded the responses of 18 participants, whose accuracy in the forced-choice Venetian grammaticality test was ≤4/8 and only analyzed the responses of the remaining participants (n = 340). Most of these participants (237; 70.3%) indicated that they learned Venetian before 5 years of age. In line with prior studies (Miozzo et al., Reference Miozzo, Navarrete, Ongis, Mello, Girotto and Peressotti2020; Peressotti, Lorenzoni, & Miozzo, Reference Peressotti, Lorenzoni and Miozzo2024; Peressotti, Pianezzola, et al., Reference Peressotti, Pianezzola, Battistutta and Miozzo2024; Scaltritti et al., Reference Scaltritti, Peressotti and Miozzo2017) and census data (ISTAT, 2014), they reported speaking Venetian especially among family and friends – on average, 44.8% and 39.0% of the time, respectively – compared to when in their hometown (32%) or at work (25%). As shown in Figure 3, the time spent speaking Venetian varied widely in each of these contexts, with some participants reporting that they did not have opportunities to speak Venetian in some contexts, while others indicated that they used it rather extensively. However, the percentages of use were strongly correlated across contexts – with correlation coefficients ranging between 0.65 and 0.81 – suggesting that the participants had rather homogeneous opportunities to speak Venetian in these contexts. The correlations between the percentage of use and the age of the participants that we found for all contexts (rs = .31–.41, ps < .001) replicated the census data that showed a stronger Venetian grounding among older generations (ISTAT, 2014).
Percentage of time in which Venetian is used in different contexts. Numbers refer to the number of participants within an interval.

Demographic and sociolinguistic information regarding the participants tested in Italian (n = 158) and Venetian (n = 182) is reported in Table 2. The two groups did not differ for gender (females: 60% vs. 63%; χ 2 = 0.33) or age (mean years [sd]: 33.1 [14.4] vs. 31.6 [13.1]; t = 0.96). Their experience with Venetian was also comparable in terms of acquisition (participants who learned Venetian before 5 years of age: 71% vs. 70%; χ 2 = 0.05), time spent using Venetian (mean [sd]: 33% [27.8] vs. 37% (31.9); t = 1.23, p = .22) and scores in the Venetian grammaticality test (mean [sd]: 6.81 [1.03] vs. 6.98 [0.99]; t = 1.51, p = .13).
4.2. Data analyses
To test the effect of language, ratings collected in Experiment 3 were analyzed as in Experiments 1 and 2. Following prior studies of emotional sentences that examined gender differences (Caldwell-Harris & Ayçiçeği-Dinn, Reference Caldwell-Harris and Ayçiçeği-Dinn2009; Harris et al., Reference Harris, Ayçíçeğí and Gleason2003), we included gender as a predictor. The predictors were introduced into the models in the following sequence: language (Italian vs. Venetian), gender (female vs. male), sentence (endearments, insults, reprimands and low-emotion-intensity sentences), random slope for sentence and the interaction between language and sentence. To examine the effects of the age at which Venetian was learned and the percentage of time spent using this language, we analyzed only the responses of participants tested in Venetian. We considered whether participants acquired Venetian before or after 5 years of age (AoA). To obtain an overall index of Venetian use (% Venetian Use), we averaged the percentage of Venetian use across the different contexts (work, local community, friends and family). In the null model, we included (a) the random intercepts and (b) the random slope to account for participants’ and items’ specificity and the fixed effects of gender and sentence. We then compared the null model with Model 1 including AoA (before/after 5 years of age) and with Model 2 including % Venetian Use.
4.3. Results
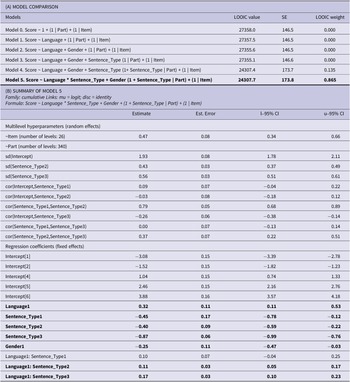
The outcomes of model comparison for models testing the language effect are reported in Table 6A. The model that best fitted the data was Model 5, which included the fixed effects of gender, language, sentence and the language × sentence interaction (a summary of the model is presented in Table 6B). As revealed by Model 5, language, type of sentence and gender modulated participants’ emotional responses. Figure 4, which shows the estimated probabilities for each score of the 7-point scale across conditions, illustrates the effect of the parameters included in Model 5 on individual scores. Ratings were higher in Venetian than Italian, and for female than male participants. Endearments were considered more emotional than insults, and insults more emotional than reprimands. Low-emotion-intensity sentences received the lowest scores. The interaction between language and sentence revealed language effects varying with the type of sentence. As it is shown in the right panel of Figure 4, the language effect was more marked for reprimands and low-emotion-intensity sentences.
Frequency (estimated probability) of each score in the 7-point scale used in Experiment 3. Bars represent the interval between the 2.5th and 97th percentile. Ratings are shown as varying for participant gender (Panel A), type of sentences (Panel B) and language (Panel C).

(A) Cumulative regression models carried out in Experiment 3. For each model, we report its formula, the LOOIC value, the standard error (SE) of the LOOIC, and the model’s weight. The best-fitting model (Model 5) is shown in bold and summarized in (B). Predictors modulating participants’ responses are marked in bold. Language 1 contrasts Italian (−1) vs. Venetian (1); Gender 1 contrasts Female (−1) and Male (1); Sentence_Type1 contrasts endearments and the average of the other three sentence types; Sentence_Type2 contrasts insults and the average of reprimands and low emotional sentences; Sentence_Type3 contrasts reprimands and low emotional sentences.

Note: 1 | Part and 1 | Item represent the random intercepts for participants and items, respectively. Sentence_Type | Part represents the participants’ random slope for the effect of Sentence Type.
The results of the analyses aimed at investigating the effects of AoA and % Venetian Use are reported in Table 7. Only Model 2, which included % Venetian Use, increased the null model’s fit (a summary of this model is presented in Table 7B). As shown in Figure 5, the incidence of higher scores corresponding to stronger emotional responses increased with greater Venetian use. Model 1’s fit, which included the Venetian AoA, did not differ from the null model’s fit. While this pattern suggests that emotional responses were unlikely to vary depending on the age at which Venetian was learned, the over-representation in our sample of speakers who learned Venetian at an early age (70.3%) makes our sample far from ideal to test AoA, demanding instead we interpret the outcome of Model 1 cautiously.
Effect of the percentage of time spent speaking Venetian on the emotion ratings of participants tested in Experiment 3 in Venetian. Estimated probability of each score of the 7-point scale (Y-axis) and the percentage of Venetian use (averaged over contexts; X-axis). Each colored line corresponds to a disctinct score.

(A) Cumulative regression models carried out in Experiment 3 to examine the effects of age of acquisition (AoA) and % use of Venetian on the ratings of participants tested in Venetian. For each model, we report its formula, the LOOIC value, the standard error (SE) of the LOOIC and the model’s weight. Model 2, with % use included, is marked in bold since it performed better than the null model. Model’s 2 results are summarized in (B). The predictors modulating participants’ ratings are marked in bold. Gender1 contrasts Female (−1) and Male (1); Sentence_Type1 contrasts Endearments and the average of the other three sentence types; Sentence_Type2 contrasts Insults and the average of Reprimands and Low Emotional sentences; Sentence_Type3 contrasts Reprimands and Low Emotional sentences.

Note: 1 | Item represents the random intercepts for Items and Sentence_Type | Part represents the participants’ random slope for the effect of Sentence Type.
The inclusion of low-emotion-intensity sentences proved successful in revealing emotional phrases eliciting stronger emotions in Venetian than Italian. The results of Experiment 3 further qualify the conditions in which stronger emotions arise in the regional language. First, the language effect varied with Venetian use, increasing as Venetian was used more extensively. Second, the language effect was larger for reprimands and low-emotion-intensity sentences. Our results confirmed the excepionality of reprimands that, in studies with foreign languages, differed from other emotional phrases for eliciting the strongest language effect (Caldwell-Harris & Ayçiçeği-Dinn, Reference Caldwell-Harris and Ayçiçeği-Dinn2009; Harris, Reference Harris2004; Harris et al., Reference Harris, Ayçíçeğí and Gleason2003). We typically receive reprimands as children (and possibly utter them as parents). It is, perhaps, not a coincidence that our participants, most of whom learned Venetian at an early age, felt reprimands especially intensely in the language in which they probably encountered reprimands more often. Low-emotion-intensity sentences elicited relatively weak emotions, as shown by the comparatively low ratings they received (Figure 4). These low ratings did not prevent a significant language effect from appearing with low-emotion-intensity sentences. Such a finding likely reflected the nature of the low-emotion-intensity sentences selected for Experiment 3. Although the situations described in these sentences are weakly associated with emotions, they refer to everyday events, some of which were probably experienced in the household. These are events that our participants probably talked about more in Venetian, or that they associated with circumstances experienced in Venetian. It was on the basis of this language preference that a language effect could arise even with low-emotion-intensity sentences.
5. General discussion
In three experiments, we found that the regional language induced stronger emotions relative to the national language. Two additional findings strengthen the robustness of this language difference. First, it appeared with multiple emotions: disgust, mirth and various positive and negative emotions evoked by emotional phrases. Second, it was observed even with sentences that induced relatively weak emotions. While prior studies have shown differences in emotional strength between native and foreign languages (e.g., Caldwell-Harris & Ayçiçeği-Dinn, Reference Caldwell-Harris and Ayçiçeği-Dinn2009; Harris et al., Reference Harris, Ayçíçeğí and Gleason2003), our results demonstrate similar differences between languages that are acquired early, and used proficiently and routinely.
The regional language was not the language that our participants spoke more frequently. They used it around half of the time among family and with friends and acquaintances, the contexts where it is permissible. The stronger emotions observed in our experiments for the regional language would not result from its dominance, if by dominant language we refer to the language used more frequently. While our results showed that dominance is not a necessary condition for observing stronger emotions, they nevertheless revealed that time spent using the language is critical. The gain of the regional language, in fact, disappeared when the regional language was not spoken frequently enough; when this occurred, the national language induced emotions of comparable, if not greater, intensity than the regional language. In short, whatever makes the regional language able to induce stronger emotions requires a minimal level of language use.
We anticipated emotions of stronger intensity for the regional language because, as the language is shared with family, friends and acquaintances, it is experienced in contexts critical for the acquisition and regulation of emotions and where emotions can be perceived and expressed more spontaneously and with fewer restrictions. The same expectation holds for heritage languages (Polinsky & Kagan, Reference Polinsky and Kagan2007) that children of immigrants learned among family and can only speak at home since these languages are not shared outside the household. Results confirming this prediction are found in the study conducted by Thoma (Reference Thoma2024) with German residents who acquired German early in childhood, along with a language (Turkish or Russian) they experienced exclusively at home or with friends. When asked to score the intensity of emotions evoked by watching a high-arousal video, these proficient bilinguals reported stronger emotions for the heritage language (Turkish or Russian). They estimated using the heritage language about 50% of the time while among family and with friends, a proportion very similar to that our bilinguals reported for the regional language.
The reduced intensity of emotions found with foreign languages has also been attributed to the context in which these languages are typically acquired and used (Caldwell-Harris, Reference Caldwell-Harris2015; Pavlenko, Reference Pavlenko2017). As formal settings such as school or work do not provide especially rich and intense emotional contexts, foreign languages would not induce particularly strong emotions. Findings with regional and heritage languages nicely complement the results with foreign languages, thus confirming predictions derived from the hypothesis that regional and heritage languages, which are spoken in contexts in which emotions are expressed more spontaneously, would evoke relatively strong emotions. In this respect, it is noteworthy that this hypothesis does not anticipate that foreign languages would only elicit weaker emotions. As foreign languages are increasingly used in emotionally rich contexts, it is likely that they induce emotions of comparable, if not greater strength, than those elicited by native languages, as indeed reported by Harris et al. (Reference Harris, Ayçíçeğí and Gleason2003). Similarly, emotions should not always be stronger with the regional language. There could, in fact, be instances in which the national language is experienced in emotionally rich contexts and could therefore induce relatively strong emotions. This was probably the case with the emotional phrases that, in Experiment 3, elicited stronger emotions in the national language among the participants who used the regional language less often.
Even though emotions reflect variation in the context of use with regional, heritage and foreign languages, it does not imply that these languages would affect emotions in similar ways. Considering how greatly regional and heritage languages differ from foreign languages in terms of AoA, proficiency and frequency of use, it is very possible that other mechanisms, in addition to context, could shape the specific emotion experienced with each of these languages. Researchers, for example, have drawn attention to the effects that a higher cognitive load and less efficient processing of foreign languages could have on emotional appraisal (Thoma & Baum, Reference Thoma and Baum2019). Differences in the methods employed to assess emotions are another plausible source of variation we should consider. Measures of physiological correlates of emotions, such as skin conductance or pupillometry, would not only provide a more comprehensive picture of the effects of language on emotions but could also reveal differences across methodologies, possibly linked to distinct processes of emotion arousal and appraisal. An illustrative example in this respect is provided by Thoma (Reference Thoma2024), who compared emotional responses in heritage and foreign languages and found different effects in both types of languages when measuring pupil diameter and emotion ratings. Our findings are limited to self-reported emotion ratings. Extending the investigation of regional languages beyond emotion ratings would likely enrich our picture of the effects of such languages on emotions.
An explanation as to why ratings of emotion strength vary across languages requires a detailed description of how ratings are formed. Determining the degree of disgust or pleasure experienced in certain situations could be based on the episodic memories that these situations activate (Förster & Liberman, Reference Förster and Liberman2007). However, to some, this situation could also engender a mental image (Zaleskiewicz et al., Reference Zaleskiewicz, Traczyk and Sobkow2023), whose content, vividness and detailedness could influence the ratings. The language in which the situation is presented would likely evoke episodic memories or generate mental images related to the settings in which the language has been experienced (Caldwell-Harris, Reference Caldwell-Harris2015; Pavlenko, Reference Pavlenko2017). If bilinguals speak their languages in settings where emotions are expressed and felt differently, each language will likely evoke episodic memories and mental images that vary in emotional content. Under this explanation, language functions as a cue that triggers certain information. Whether bilinguals’ languages trigger different information would, in part, depend on how tightly compartmentalized their use is. How strongly the information is associated with a language is another variable that likely determines whether a language effect appears. Presently, we cannot estimate the likelihood that languages trigger different information. Judging by the pervasiveness of the language effects, however, it appears to be a rather common event. What we can anticipate is that language effects would correlate with language use; therefore, effects should increase in magnitude as use grows. Such a correlation was indeed found in Experiment 3.
Differences between native and foreign languages have been reported with decisions concerning risky prospects, monetary rewards and moral judgments, as reviewed by Circi et al. (Reference Circi, Gatti, Russo and Vecchi2021), Del Maschio et al. (Reference Del Maschio, Crespi, Peressotti, Abutalebi and Sulpizio2022) and Stankovic et al. (Reference Stankovic, Biedermann and Hamamura2022). These effects have been explained by the weaker emotionality of foreign languages (Costa et al., Reference Costa, Foucart, Hayakawa, Aparici, Apesteguia, Heafner and Keysar2014; Pavlenko, Reference Pavlenko2017). Given that regional and foreign languages induce emotions of different intensities, emotion-based explanations naturally predict that these languages would affect decisions differently. Contrary to this prediction, both languages affected various types of decisions in very similar ways (Miozzo et al., Reference Miozzo, Navarrete, Ongis, Mello, Girotto and Peressotti2020; Peressotti, Lorenzoni, & Miozzo, Reference Peressotti, Lorenzoni and Miozzo2024; Peressotti, Pianezzola, et al., Reference Peressotti, Pianezzola, Battistutta and Miozzo2024). These findings challenge an emotion-based explanation, suggesting instead that common mechanisms underlie the effects of both languages. Miozzo et al. (Reference Miozzo, Navarrete, Ongis, Mello, Girotto and Peressotti2020), and Peressotti, Lorenzoni, and Miozzo (Reference Peressotti, Lorenzoni and Miozzo2024), and Peressotti, Pianezzola, et al. (Reference Peressotti, Pianezzola, Battistutta and Miozzo2024) proposed this kind of explanation to account for the similarities found with moral decisions. Foreign and regional languages favored decisions diverging from those endorsed by common morality. Schools, public institutions, churches and media represent primary sources of learning about common morality; it is unlikely that exposure to common morality occurs here in the regional or foreign languages. As their use limits experiencing common morality, foreign and regional languages would be weakly associated with common morality, which in turn reduces the probability that decisions taken in these languages align with common morality. This is a context-based explanation – the moral decisions taken in foreign and regional languages reflect the contexts in which these languages are used – and much like the explanation we propose for the language effects on emotions.
Among the universal features of human natural language, we should include the capacity that it confers to communicate and regulate emotions. Language has become inherently related to emotions, thanks to a whole gamut of mechanisms making it possible for any speaker to express ideas in ways that are as precise as they are effective. Understanding the language–emotion interplay requires us to define what universal features of language enable such an exquisitely refined communication capacity. Findings with regional and heritage languages, however, appear to reveal that it is not enough to unveil such universal features. The contexts in which languages are spoken also seem to be critical. Confining languages within family, friends and acquaintances results in stronger emotions. An appreciation of what is universal and contextual in language would enhance our understanding of emotions.
Data availability statement
Data supporting the findings of this study are openly available in https://osf.io/tzuwp/?view_only=6afecf7a81f942879895cccdf53e7a0e.
Acknowledgements
The authors would like to express their gratitude to Matilde Massara, Jasmine Farah and Tommaso Fassina for their assistance with data collection. The authors would like to extend their special thanks to Massimiliano Pastore for his essential contributions in recommending the statistical approach and providing invaluable support with the R package and script.
Competing interests
The authors declare none.


 Open access