


Introduction
Glyphosate is a nonselective herbicide widely used in global agricultural production because of its effective herbicidal action, low mammalian toxicity, absence of soil residues, minimal soil activity, and cost-effectiveness (Purba and Sipayung Reference Purba and Sipayung2022). With glyphosate-tolerant crops, the area and intensity of glyphosate applications have been significantly increased (Kumar et al. Reference Kumar, Gambhir, Dass, Tripathi, Singh, Jha, Yadava, Choudhary and Rakshit2020). However, overreliance on glyphosate has led to significant ecological consequences (Purba and Sipayung Reference Purba and Sipayung2022). Due to its overuse, more than 60 weed species, including goosegrass [Eleusine indica (L.) Gaertn.], have been reported to be resistant to glyphosate (Heap Reference Heap2025). Eleusine indica, an aggressive annual weed, is a C4 plant characterized by a robust root system and exceptional environmental adaptability. It can produce more than 40,000 seeds per plant annually (Zhang et al. Reference Zhang, Feng, He, Yang, Chen and Tian2015) and can reduce crop yield by more than 20% in severe infestations (Ma et al. Reference Ma, Wu, Jiang, Ma and Ma2015). Since the first report of glyphosate-resistant (GR) E. indica in Malaysia (Baerson et al. Reference Baerson, Rodriguez, Tran, Feng, Biest and Dill2002), resistant populations have evolved in North America, South America, Asia, and Europe with prolonged mono-use of glyphosate (Heap Reference Heap2025). Glyphosate primarily functions to inhibit the activity of 5-enolpyruvylshikimate-3-phosphate synthase (EPSPS; EC 2.5.1.19) in plants and to disrupt the biosynthesis of aromatic amino acids (Duke Reference Duke2020). Generating target-site mutations in the EPSPS gene is the predominant mechanism to confer glyphosate resistance in E. indica (Chen et al. Reference Chen, Huang, Zhang, Wei, Huang, Chen and Wang2015; Han et al. Reference Han, Vila-Aiub, Jalaludin, Yu and Powles2017; Wang et al. Reference Wang, Tang, Liao, Cao and Zhao2023; Zhang et al. Reference Zhang, Yu, Yu, Guo, Zhang and Tian2021). The most common amino acid substitution in the EPSPS of GR weeds occurs at position 106 (e.g., Pro-106-Thr [P106T], Pro-106-Ser [P106S], Pro-106-Leu [P106L], and Pro-106-Ala [P106A]) (Baerson et al. Reference Baerson, Rodriguez, Tran, Feng, Biest and Dill2002; Kaundun et al. Reference Kaundun, Dale, Zelaya, Dinelli, Marotti, McIndoe and Cairns2011; Ng et al. Reference Ng, Wickneswari, Salmijah, Teng and Ismail2004; Yu et al. Reference Yu, Cairns and Powles2007). Additionally, a high-level GR population with double mutations at positions 102 (Thr-102-Ile [T102I]) and 106 (P106S) was first reported in Malaysia in 2015 (Yu et al. Reference Yu, Jalaludin, Han, Chen, Sammons and Powles2015).
It is crucial to develop fast, precise, and economical diagnostic tools to detect mutations and genotypes (homozygous, heterozygous, and susceptible) in target genes in order to carry out precise control strategies to effectively delay the evolution of resistance in the field. Various molecular detection techniques have been used to identify mutations in target genes that confer herbicide resistance in weeds (Wang et al. Reference Wang, Tang, Liao, Cao and Zhao2023). Traditional methods such as polymerase chain reaction (PCR)-based gene sequencing and (derived) cleaved amplified polymorphic sequence [(d)CAPS] analysis rely on expensive instrumentation, complex reagent systems, prolonged turnaround times, and specialized technical expertise (Boutsalis Reference Boutsalis2001; Kaundun and Windass Reference Kaundun and Windass2006; Pan et al. Reference Pan, Li, Xia, Zhang and Dong2015a), which limits their application in rapid on-site tests, adaptable in the field, particularly in resource-limited laboratory settings. Novel molecular techniques such as loop-mediated isothermal amplification (LAMP) are promising alternatives to overcome these limitations. LAMP allows rapid (<1 h) detection without needing sophisticated equipment or complex operations. The unique primer design and amplification mechanism of LAMP provide high specificity and sensitivity, with the ability to amplify target gene concentrations by up to 109-fold within an hour under isothermal conditions (Notomi et al. Reference Notomi, Okayama, Masubuchi, Yonekawa, Watanabe, Amino and Hase2000; Parida et al. Reference Parida, Sannarangaiah, Dash, Rao and Morita2008). The LAMP technology has gained widespread adoption in biological disciplines (Ahuja and Somvanshi Reference Ahuja and Somvanshi2021; Badolo et al. Reference Badolo, Bando, Traoré, Ko-Ketsu, Guelbeogo, Kanuka, Ranson, Sagnon and Fukumoto2015; Garg et al. Reference Garg, Ahmad and Kar2022; Li et al. Reference Li, Wei, Liu, Tan, Zhang, Wu, Charimbu, Hu, Cheng, Yu and Tao2013; Niessen and Vogel Reference Niessen and Vogel2010; Parida et al. Reference Parida, Posadas, Inoue, Hasebe and Morita2004); however, little research has been conducted on herbicide-resistant weeds. In addition, the current LAMP-based resistance detection systems face two critical challenges. The first is the inability to distinguish between homozygous and heterozygous mutations, which is essential, because heterozygous individuals play a pivotal role in the dissemination of resistance alleles and influence the evolution time and rate of weed resistance spreading. The other is the risk of aerosol contamination during open-tube visualization, which can lead to false-positive results, posing a significant barrier to field implementation. These limitations highlight the ongoing conflict between accuracy and field applicability of resistance mutation detection methods.
We developed a dual-mode LAMP-based detection system to detect three key GR mutations (P106-L, P106S, and T102I) in the EPSPS gene of E. indica to address these challenges. This system combines a closed-tube colorimetric rapid screening model for field applications and a laboratory-based model utilizing a fluorescence quantitative PCR instrument with real-time fluorescence ΔCt threshold analysis. This system uses dual primer sets specifically designed for each mutation site to distinguish between homozygous, heterozygous, and wild-type genotypes, while preventing aerosol contamination through a closed-tube operation. By facilitating accurate and timely detection of resistant genotypes, this system contributes to developing integrated weed management strategies to prolong herbicide efficacy.
Materials and Methods
Plant Material
In this study, seeds of E. indica populations with different EPSPS mutations, previously collected in our laboratory from Guangdong, Guangxi, and Zhejiang provinces, were selected (Chen et al. Reference Chen, Wei, Huang, Cui, Zhang and Li2021, Reference Chen, Li, Cui, Yu and Li2023, Reference Chen, Shan, Li, Chen, Yu, Cui and Li2024). Seeds from each of the four populations were soaked in a 1,000 mg L−1 gibberellin solution for 24 h to break seed dormancy, followed by thorough rinsing with sterile distilled water. The treated seeds were then individually sown into square plastic pots (8 × 8 × 9.5 cm) containing a soil and organic fertilizer mixture (organic content ≥ 15%) in a 3:1 (v/v) ratio (Chen et al. Reference Chen, Wei, Huang, Cui, Zhang and Li2021). The plants were cultivated in a greenhouse (Beijing, China), under controlled conditions with day and night temperatures maintained at 30 C and 20 C (±2 C), respectively, and a photoperiod of 14-h light/10-h dark. Supplemental lighting was provided using light-emitting diodes (LEDs) with three different monochromatic wavelengths at an intensity of 200 μmol·m−2 s−1. Regular watering was performed based on plant growth requirements.
Sequencing for Target Genes
Leaf samples were collected from each of the four E. indica populations (SS, LL, IISS, and WT), and genomic DNA was extracted using a plant DNA extraction kit (Tiangen Biotech, Beijing, China). A pair of primers (EPSPS-F and EPSPS-R) was designed to amplify a 550-bp fragment that included the conserved region of the EPSPS gene. PCR amplification was performed under the following conditions: initial denaturation at 94 C for 4 min; 32 cycles of denaturation at 94 C for 30 s, annealing at 55 C for 30 s, and extension at 72 C for 30 s; followed by a final extension at 72 C for 5 min. The PCR products were analyzed using 1% agarose gel electrophoresis, and the qualified products were sent to Sangon Biotech (Shanghai, China) for sequencing. Sequencing results were analyzed using the SnapGene software (GSL Biotech, Chicago, IL, USA).
LAMP Primer Design and Screening
Primer Design
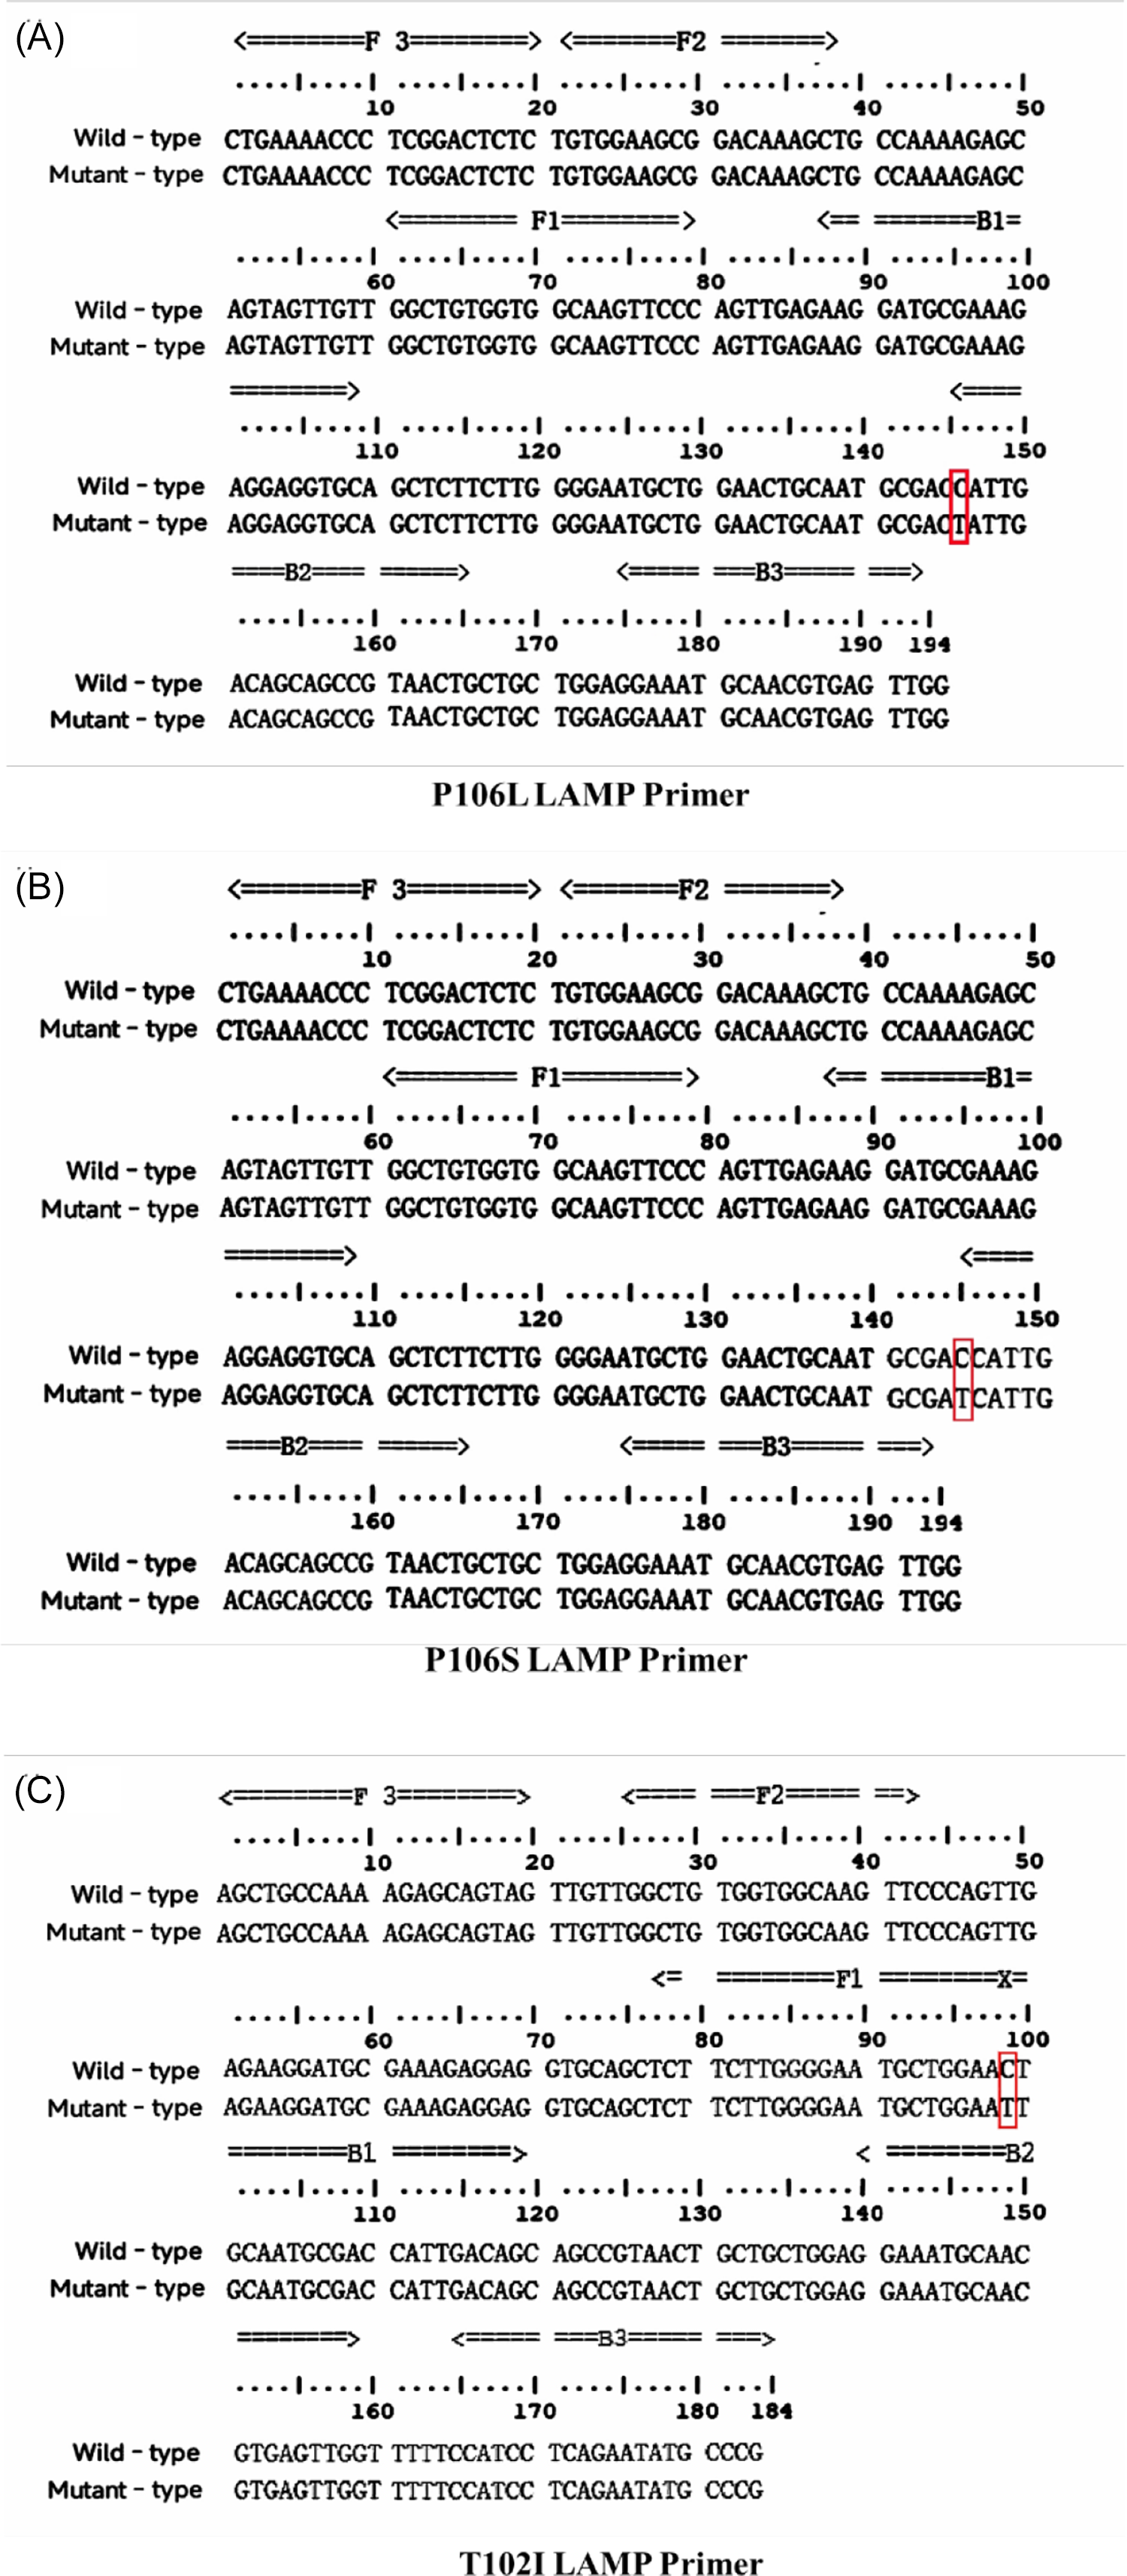
Based on the sequence of the gene encoding the EPSPS CT structural domain (GenBank: AY157642.1), PrimerExplorer V5 software (https://primerexplorer.jp/e/) was used to target three mutation sites in E. indica: P106L, P106S, and T102I. Two LAMP primers sets were designed accordingly. The sensitive primer group was specifically designed to amplify mutation-free samples, whereas the resistant primer group was designed to amplify samples containing mutations. The structures and complementary sequences of the LAMP primers are shown in Figure 1. The outer primers, F3 and B3, were used alongside the forward inner primer (FIP), which consisted of F1C and F2, and the reverse inner primer (BIP), which consisted of B1C and B2. F1C and B1C were complementary to the sequences at loci F1 and B1, respectively (Supplementary Figure S1).
The sequence alignment of the EPSPS gene between resistant and sensitive Eleusine indica populations from Guangdong, Guangxi, and Zhejiang provinces in China, along with the corresponding LAMP primer designs. (A–C) The Pro-106-Leu, Pro-106-Ser, and Thr-102-Ile mutations, respectively. F3 and B3 serve as outer primers, while FIP consists of the F2 and F1c sequences, and BIP consists of the B2 and B1c sequences. The resistant primer sets were designed based on mutant sequences, and the sensitive primer sets were based on wild-type sequences. For the Pro-106-Leu/Ser mutations, the 3′ end of the BIP primer overlaps the mutation site to block the initial amplification, enabling specific detection. For the Thr-102-Ile mutation, the 5′ ends of both FIP and BIP overlap the mutation site, preventing the formation of the dumbbell structure, thereby achieving specific amplification.

Primer Screening
The designed resistance and sensitivity primer sets for the three mutation sites (P106L, P106S, and T102I) in E. indica were tested using two different modes to identify optimal primers. To reduce the difficulty of establishing uniform criteria, the screening strategy involved applying a unified reaction system and identical detection times to all primer sets, with method optimization achieved by selecting the most suitable primers. The specific steps were as follows. DNA samples from homozygous, heterozygous mutation, and mutation-free genotypes were mixed with the LAMP system of the resistant and sensitive primer groups for primer screening using a real-time fluorescence assay. Amplification reactions were performed using an ABI 7500 real-time fluorescent PCR instrument (Thermo Fisher Scientific, USA) with the following reaction program: 1 min at 65 C, 55 cycles, fluorescence signals (FAM channel) were collected every minute at 65 C, and the reaction was terminated with a final hold at 80 C for 2 min. Amplification curves and ΔCt thresholds [ΔCt = Ct(resistant primer) − Ct(sensitive primer)] were recorded to evaluate primer performance. Scatter plots were generated, and 95% confidence interval analysis was performed to visualize the distribution and variability of the amplification signals, allowing assessment of the reliability and consistency of the established classification criteria. Primers selected through real-time fluorescence screening were further validated using colorimetric detection. DNAs of different genotypes were mixed with the LAMP system (containing N-Red staining dye) of both resistant and sensitive primer groups. The system was incubated in a metal water bath at 65 C for 45 min, followed by 80 C for 5 min to terminate the reaction. Color development results were observed to further confirm the primer’s validity. When the results from both assays were consistent and as expected, it was concluded that the primer set demonstrated good specificity and reliability, making it suitable for subsequent resistance gene detection. The selected primers were tested in triplicate to confirm their stability and specificity.
Establishment of a Dual-Mode LAMP Genotyping Method for Detection of P106L, P106S, and T102I Mutations in Eleusine indica
Real-Time Fluorescence Assay Mode
LAMP reactions were conducted using optimal resistant and sensitive primer sets for each target mutation in samples with homozygous, heterozygous, or no mutations. A real-time fluorescence PCR instrument was used to monitor changes in fluorescence signals during the amplification process. The amplification curves and ΔCt threshold values were analyzed to establish the result interpretation criteria for the real-time fluorescence detection mode.
Colorimetric Assay Mode
LAMP reactions were performed using the optimal resistant and sensitive primer sets for each target in samples with homozygous mutations, heterozygous mutations, no mutations, or a no-template control (CK). The reaction products were evaluated by observing the color changes, and the interpretation criteria for the colorimetric detection mode were established based on these observations.
Accuracy of the Dual-Mode LAMP Genotyping Method
In total, 150 samples (sourced from orchards in Guangdong, Guangxi, Zhejiang, and other areas of China and subsequently grown in the greenhouse) of known genotypes were tested using both real-time fluorescence and colorimetric detection modes to assess the accuracy of the dual-mode LAMP genotyping assay. The results were analyzed, and the accuracy of each detection mode was calculated to evaluate its performance.
Sensitivity Comparison of LAMP and Conventional PCR
A pair of primers (EPSPS-F and EPSPS-R) targeting the CT structural domain of the EPSPS gene in E. indica and generating a 550-bp product was designed for conventional PCR amplification to compare the sensitivity of LAMP and conventional PCR. Genomic DNA was extracted from leaf samples using the method described earlier in “Sequencing for Target Genes.” DNA concentration was measured using a UV spectrophotometer, with the initial concentration diluted from 50 ng μl−1 in a 10-fold gradient down to 5 × 10⁻⁶ ng μl−1. The DNA dilutions were used for both LAMP and PCR, with the LAMP reaction and PCR performed as described earlier in “LAMP Primer Design and Screening” and “Sequencing for Target Genes,” respectively. After the reactions, a color change was observed in the LAMP assay, and the LAMP and PCR products were analyzed using 2% agarose gel electrophoresis.
Results and Discussion
Sequencing and Comparison of EPSPS Genes
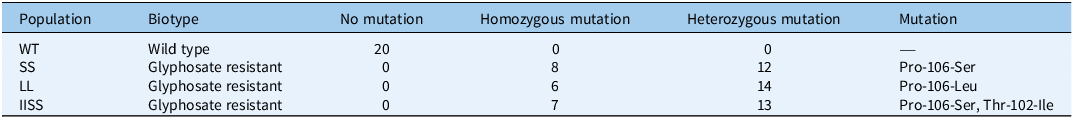
As shown in Table 1, we analyzed 20 randomly selected leaf samples from each population for EPSPS gene mutations. Fragments of the EPSPS CT structural domain were amplified from each population. The LL population exhibited a Leu substitution at the Pro-106 locus (CCA→CTA), the SS population showed a Ser substitution at the Pro-106 locus (CCA→TCA), and the IISS population contained both an Ile substitution at the Thr-102 locus (ACT→ATT) and a Ser substitution at the Pro-106 locus (CCA→TCA) (Supplementary Figure S2). In the SS population, 8 samples were homozygous mutants and 12 were heterozygous. In the LL population, 6 samples were homozygous mutants and 14 were heterozygous. In the IISS population, 7 samples were homozygous mutants and 13 were heterozygous. These results confirmed the presence of three common EPSPS resistance mutations in E. indica, consistent with previous reports of target-site mutations as the predominant mechanism of herbicide resistance in weeds (Heap Reference Heap2025).
Summary of glyphosate resistance and EPSPS mutations in Eleusine indica from Guangdong, Guangxi, and Zhejiang provinces in China.

Establishment of a Dual-Mode LAMP Genotyping Assay for the P106L, P106S, and T102I Mutations in Eleusine indica
LAMP Primer Design
LAMP primers were designed using PrimerExplorer V5 software, targeting highly conserved regions around codons 102 and 106 in the CT structural domain of the EPSPS gene in E. indica. Separate resistant and sensitive primer sets were designed for the three mutations: P106L, P106S, and T102I. The design strategy involved pairing any one of the following primer ends with the mutant base: the 3′ ends of F3/B3, or the 3′ or 5′ end of FIP/BIP primers. Resistant primer sets were designed to match mutant sequences, whereas sensitive primer sets were designed to match wild-type sequences. Given the high sensitivity of the LAMP method, one or two mismatches were introduced before the last base to ensure the specific amplification of the resistant and sensitive primer sets.
Despite the development of primer design software specific for LAMP amplification, directly generating genotyping primers for this study remained challenging. Genetic diversity, allele coexistence, and complex genomic features in some weed species may cause false negatives (Pan et al. Reference Pan, Li, Xia, Zhang and Dong2015a, Reference Pan, Li, Zhang and Dong2015b; Panozzo et al. Reference Panozzo, Farinati, Sattin and Scarabel2023). Thus, LAMP is more suitable for genetically uniform populations or conserved genes, and primer design must be tailored to the genomic features of the species for broader applications.
Real-Time Fluorescence Assay: Primer Screening and Criteria Establishment
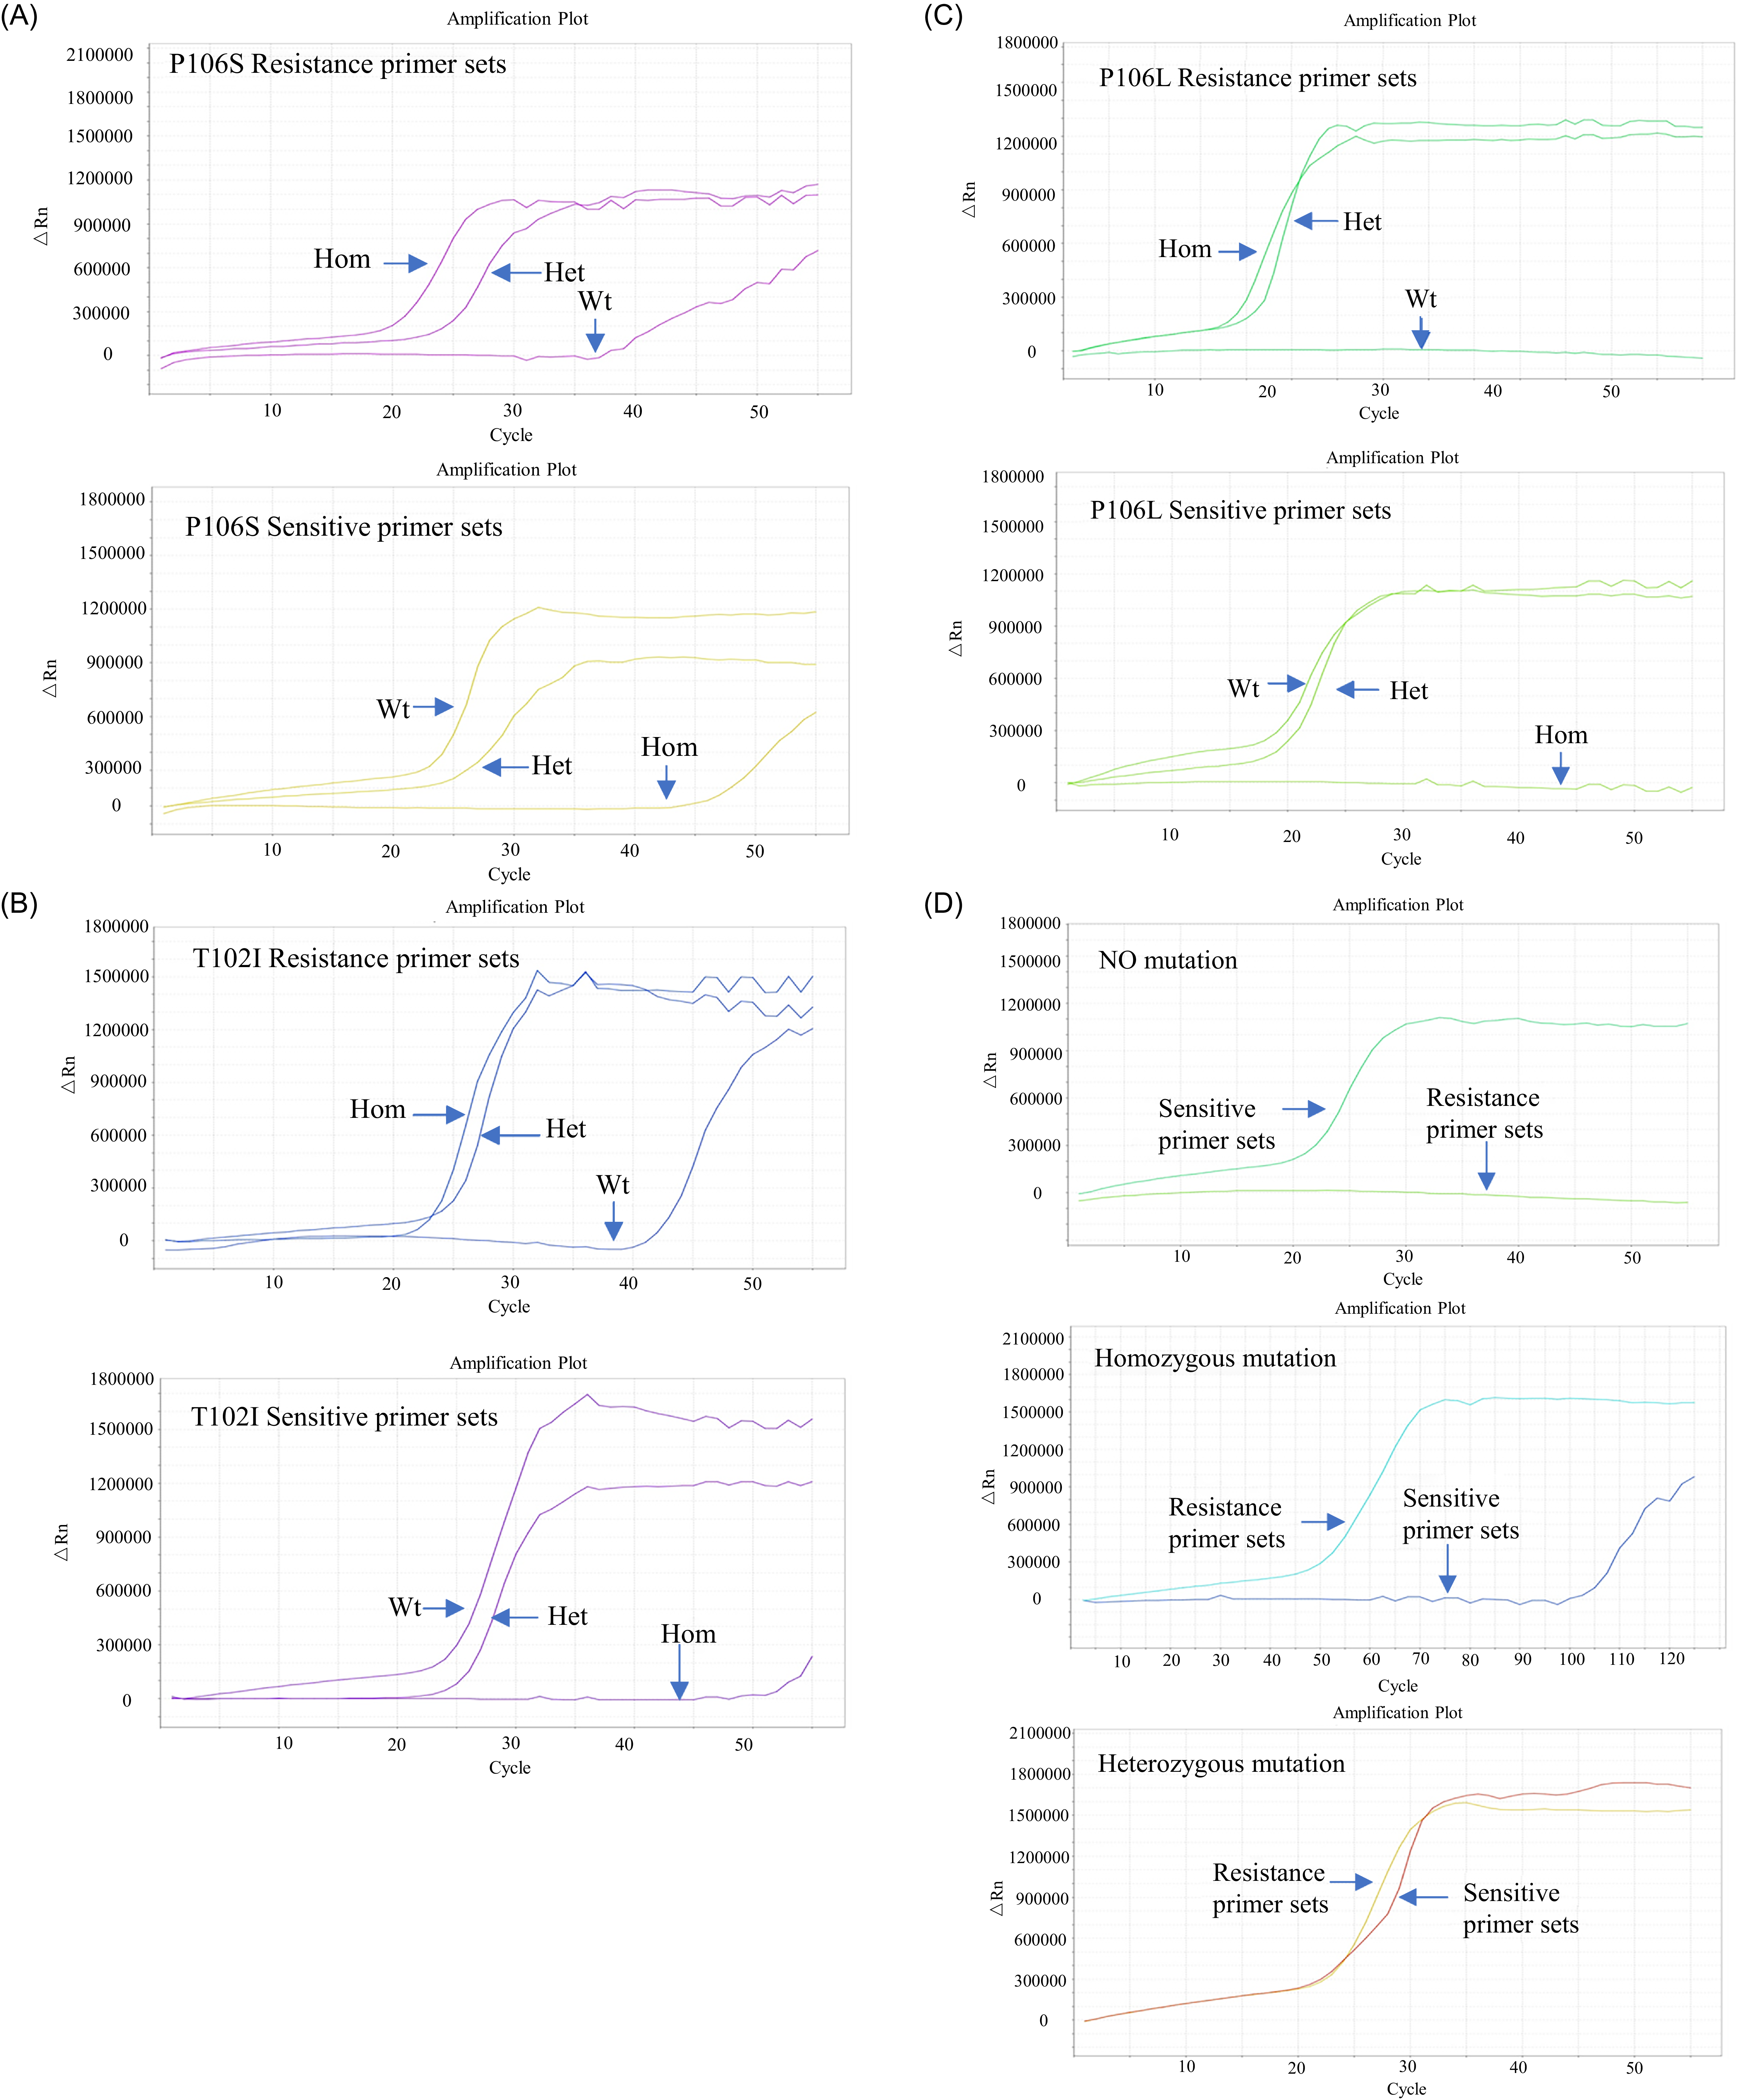
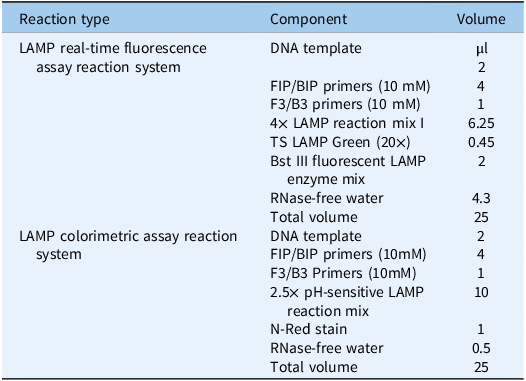
As shown in Figure 2, both homozygous and heterozygous mutant samples were successfully amplified using the LAMP system and the resistant primer group, whereas the mutation-free samples showed no amplification or exhibited a delay of at least 10 cycles. In contrast, mutation-free and heterozygous mutant samples were successfully amplified, whereas homozygous mutant samples showed no amplification or a delay of at least 10 cycles when using the sensitive primer group. These results confirmed the high specificity and performance of the selected primers in distinguishing different genotypes. The reaction system used for the LAMP real-time fluorescence assay is listed in Table 2.
The resistant and sensitive primer sets designed for three mutation sites in the EPSPS gene of glyphosate-resistant Eleusine indica from Guangdong, Guangxi, and Zhejiang provinces in China, screened using real-time fluorescence detection. The figure indicates the amplification patterns for each primer set. (A) Screening results of resistant and sensitive primer sets targeting the Pro-106-Ser mutation; (B) screening results of primer sets targeting the Thr-102-Ile mutation; (C) screening results of primer sets targeting the Pro-106-Leu mutation; and (D) amplification results using resistant primer sets and sensitive primer sets on homozygous mutant, heterozygous mutant, and mutation-free samples via real-time quantitative PCR. The panel illustrates the interpretation criteria established based on the amplification patterns.
LAMP reaction system.

We further validated the selected primers using representative samples to standardize the interpretation of the results. The fluorescence threshold was set to 420,000 to determine Ct values. The following interpretation criteria were established based on Ct values and amplification patterns (Figure 2): homozygous mutation: Ct < 30 in the resistant primer group, Ct ≥ 30 in the sensitive primer group, and ΔCt (Ct sensitive − Ct resistant) ≥ 10; heterozygous mutation: Ct < 30 for both primer groups, and ΔCt between −5 and 5; and no mutation: Ct < 30 in the sensitive primer group, Ct ≥ 30 in the resistant primer group, and ΔCt ≥ 10. The ΔCt thresholds (±5 and ≥10) were determined using sequencing-confirmed standard samples (homozygous, heterozygous, and wild type) tested in three independent replicates. Clear and consistent separation in ΔCt values was observed among the three genotypes. Minor variations in the thresholds do not affect genotype classification, because genotyping is based on the relative amplification patterns between primer sets rather than absolute Ct values. These criteria provide a reliable basis for genotyping using the real-time fluorescence LAMP assay. Unlike previous LAMP-based assays that could only detect the presence of resistance mutations without a homozygous or heterozygous status (Pan et al. Reference Pan, Li, Xia, Zhang and Dong2015a, Reference Pan, Li, Zhang and Dong2015b; Wang et al. Reference Wang, Tang, Liao, Cao and Zhao2023), our system enables precise genotypic differentiation, which is essential for resistance monitoring and management.
Colorimetric Assay: Primer Screening and Criteria Establishment
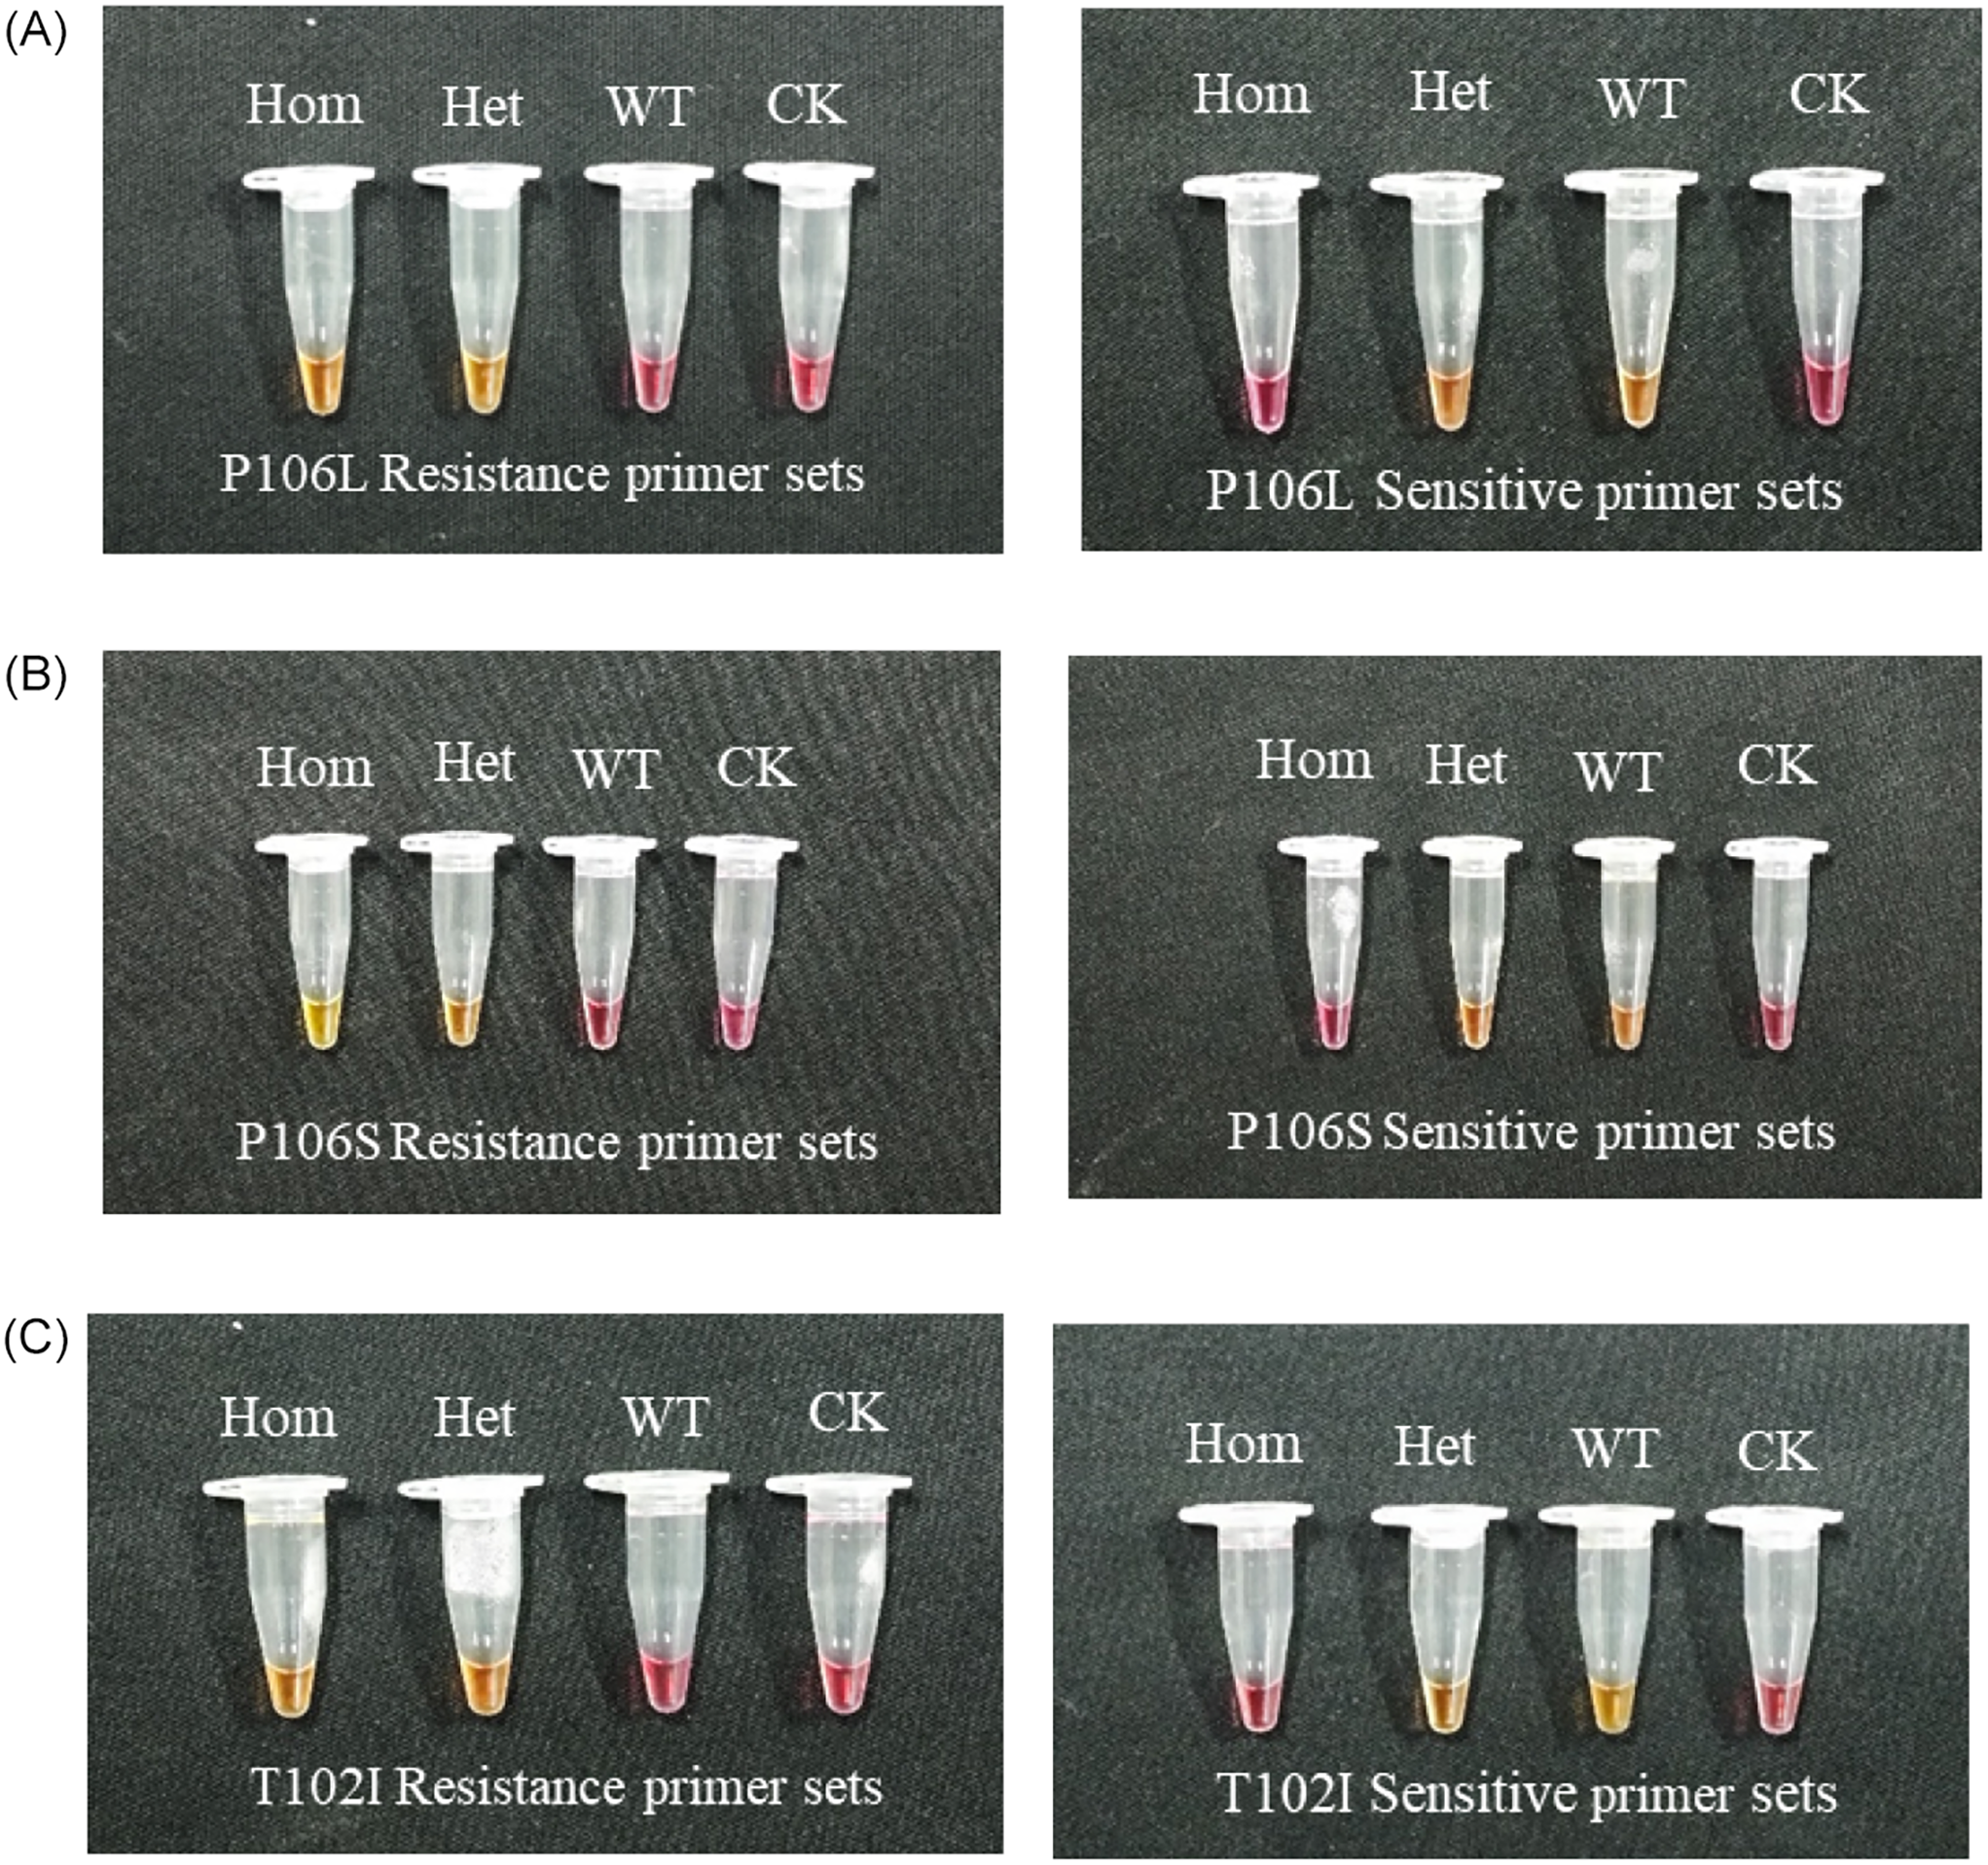
The primers selected for real-time fluorescence detection were validated using colorimetric assays. As shown in Figure 3, the color of the liquid for the homozygous and heterozygous mutation samples changed from pink to yellow in the LAMP system with the resistant primer group, whereas those of the mutation-free and CK samples remained pink. The liquid of the mutation-free and heterozygous samples turned yellow in the system containing the sensitive primer group, whereas those of the homozygous mutant and CK samples remained unchanged. The primers screened using both real-time fluorescence and colorimetric assays are listed in Table 3, and the reaction system for the LAMP colorimetric assay is shown in Table 2.
The screening results of primers: initially selected through fluorescence-based assays, the primers were further validated twice using colorimetric assays, and only those yielding consistent results were retained. (A) Detection using the P106L resistance primer set and the corresponding sensitive primer set. Hom, homozygous Pro→Leu mutation at position 106 of the EPSPS gene in Eleusine indica; Het, heterozygous Pro→Leu mutation; WT, the wild type with no mutation. (B) Detection using the P106S resistance primer set and the sensitive primer set. Hom, homozygous Pro→Ser mutation at position 106; Het, heterozygous Pro→Ser mutation. (C) Detection using the T102I resistance primer set and the sensitive primer set. Hom, homozygous Thr→Ile mutation at position 102 of the EPSPS gene in Eleusine indica; Het, heterozygous Thr→Ile mutation.
Designing specific primers for detecting the Pro-106-Leu/Ser and Thr-102-Ile mutations in the EPSPS gene of Eleusine indica from Guangdong, Guangxi, and Zhejiang provinces in China.
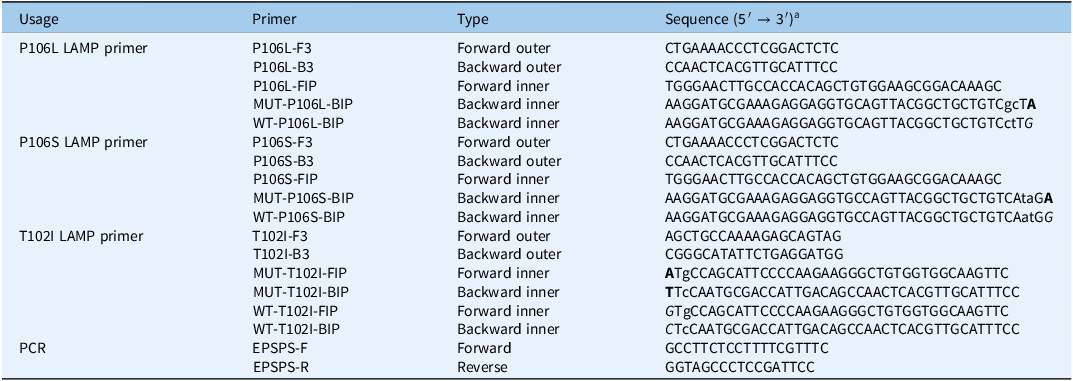
a The bolded bases represent the target sites of the mutated EPSPS gene, while the non-bolded and italicized bases represent the target sites of the wild-type EPSPS gene. The lowercase bases indicate artificially introduced mismatches, designed to enable specific amplification
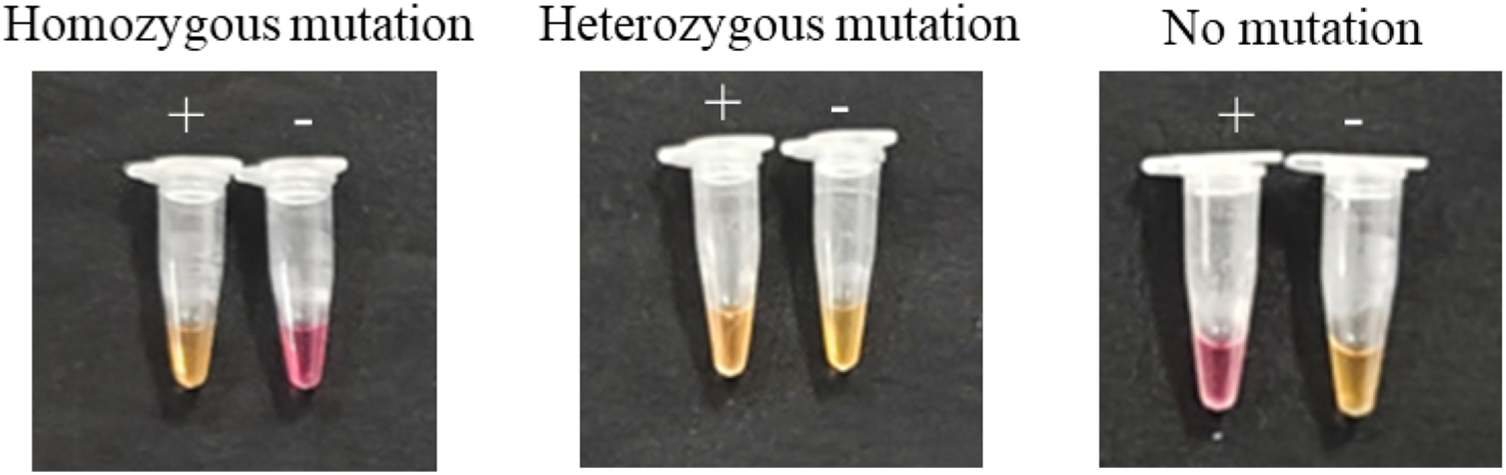
Based on the observed color changes, the interpretation criteria for the colorimetric assay were established as follows (Figure 4): homozygous mutation, yellow in the resistant primer group and pink in the sensitive primer group; heterozygous mutation, yellow in both primer groups; no mutation, pink in the resistant primer group and yellow in the sensitive primer group; and CK, no color change in either group. These criteria ensured the accurate and intuitive identification of mutation types using a colorimetric LAMP assay. In contrast to traditional LAMP techniques that are limited to qualitative detection and require open-tube visualization (Pan et al. Reference Pan, Li, Zhang and Dong2015b; Wang et al. Reference Wang, Tang, Liao, Cao and Zhao2023; Yin et al. Reference Yin, Wang, Liao, Cao and Zhao2024), the closed-tube colorimetric system established here prevents aerosol contamination and enables the distinction between homozygous and heterozygous genotypes.
Colorimetric detection was performed in a water bath using the resistant primer set (+) and the sensitive primer set (−) to amplify homozygous mutant, heterozygous mutant, and mutation-free samples. The figure illustrates the interpretation criteria established based on the amplification results.

Accuracy of Dual-Mode LAMP Genotyping Assays
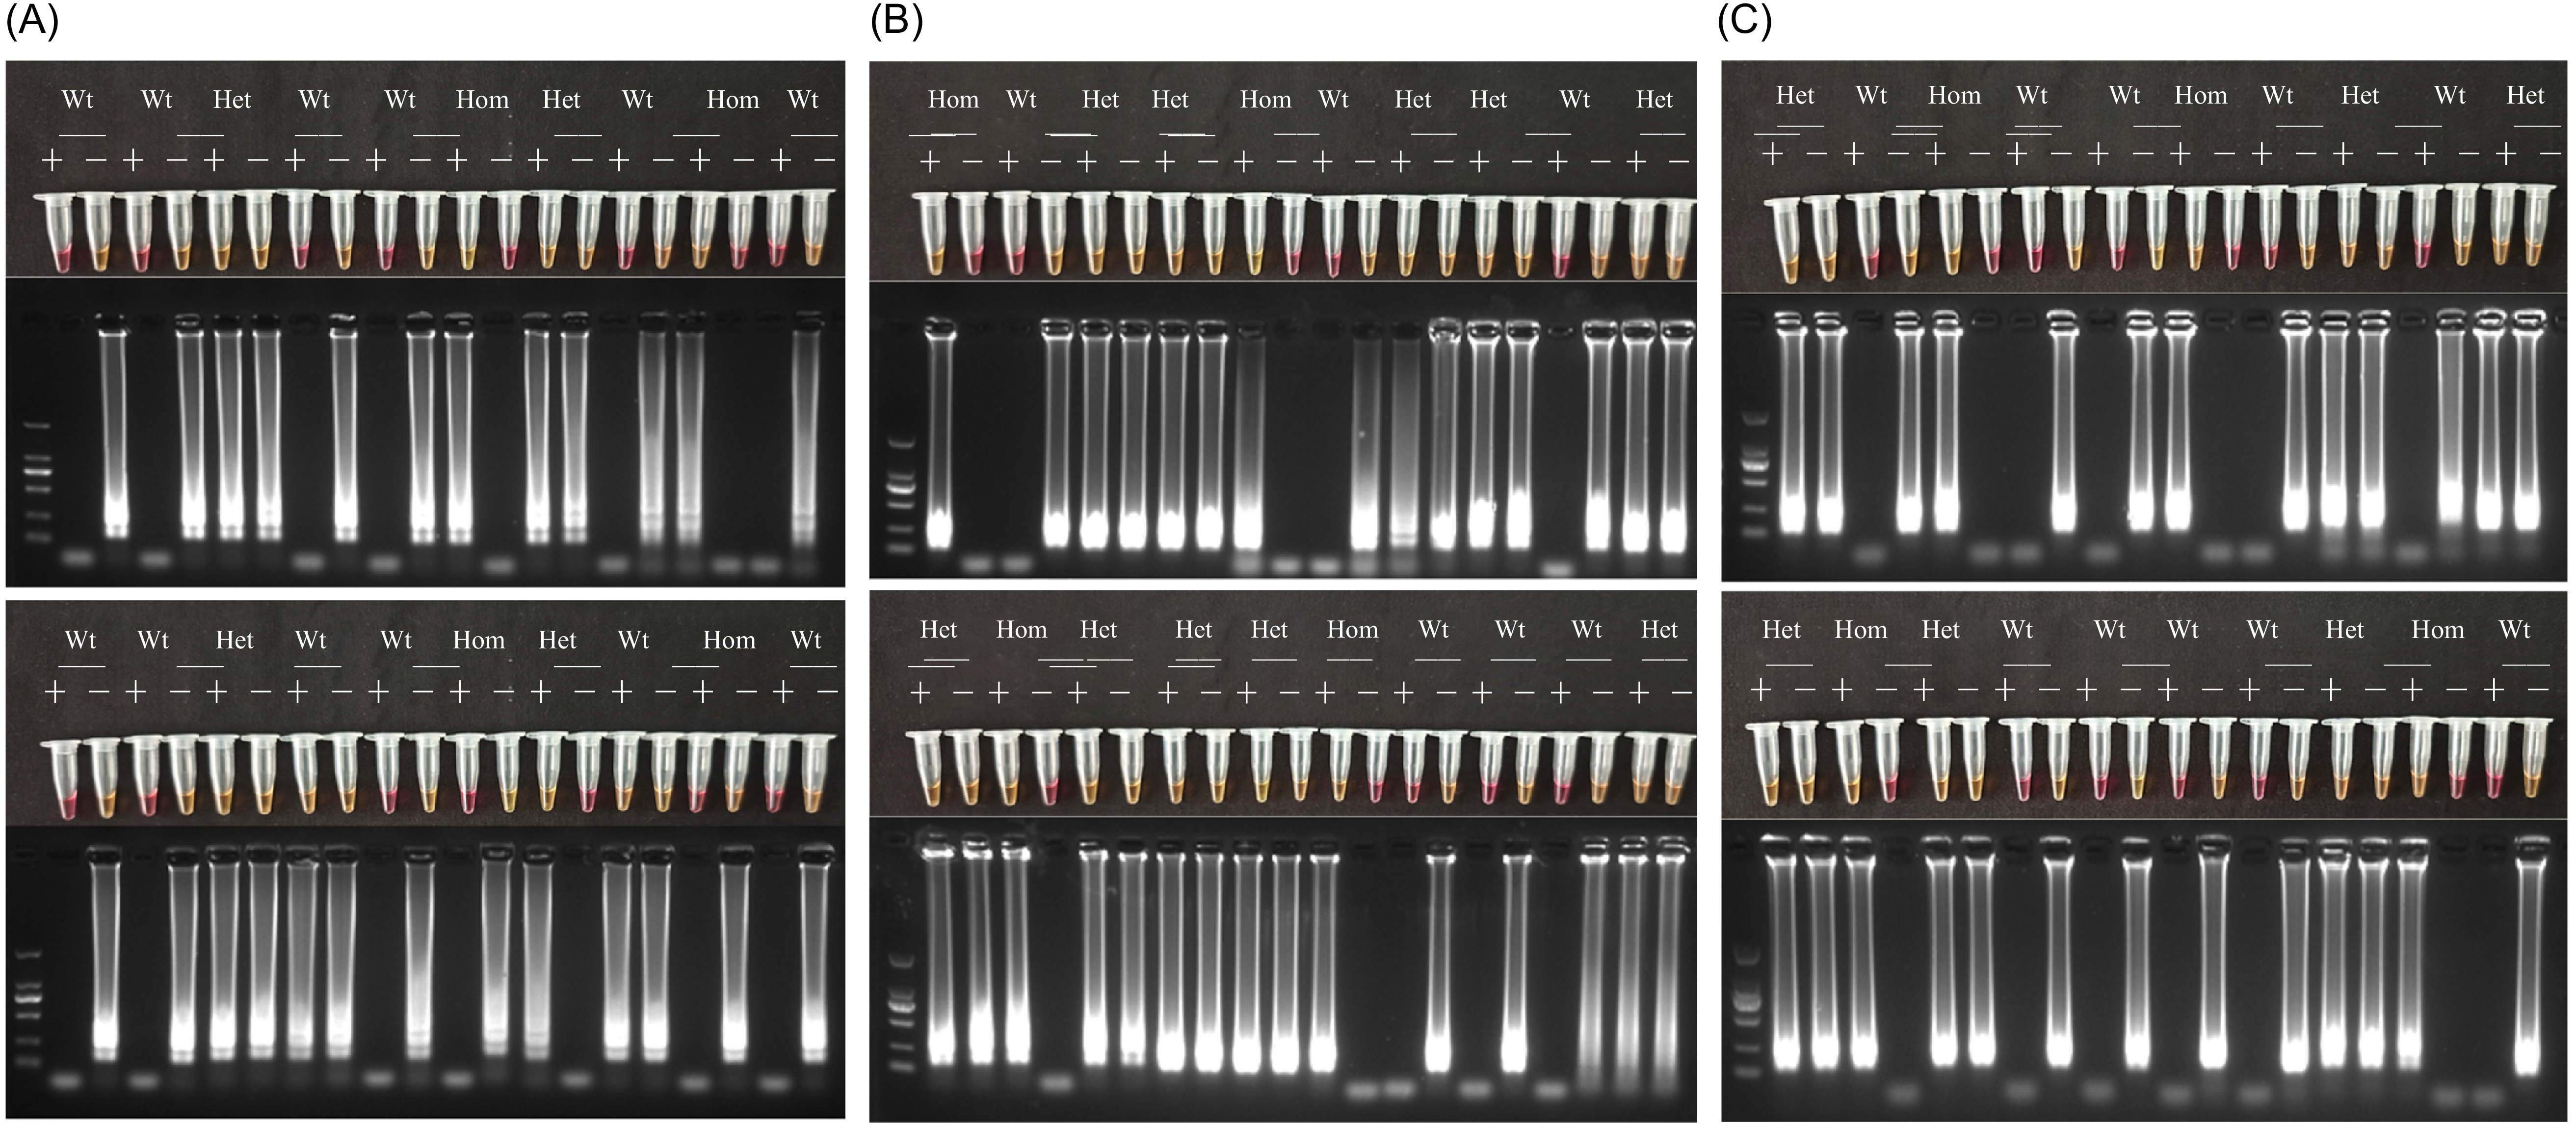
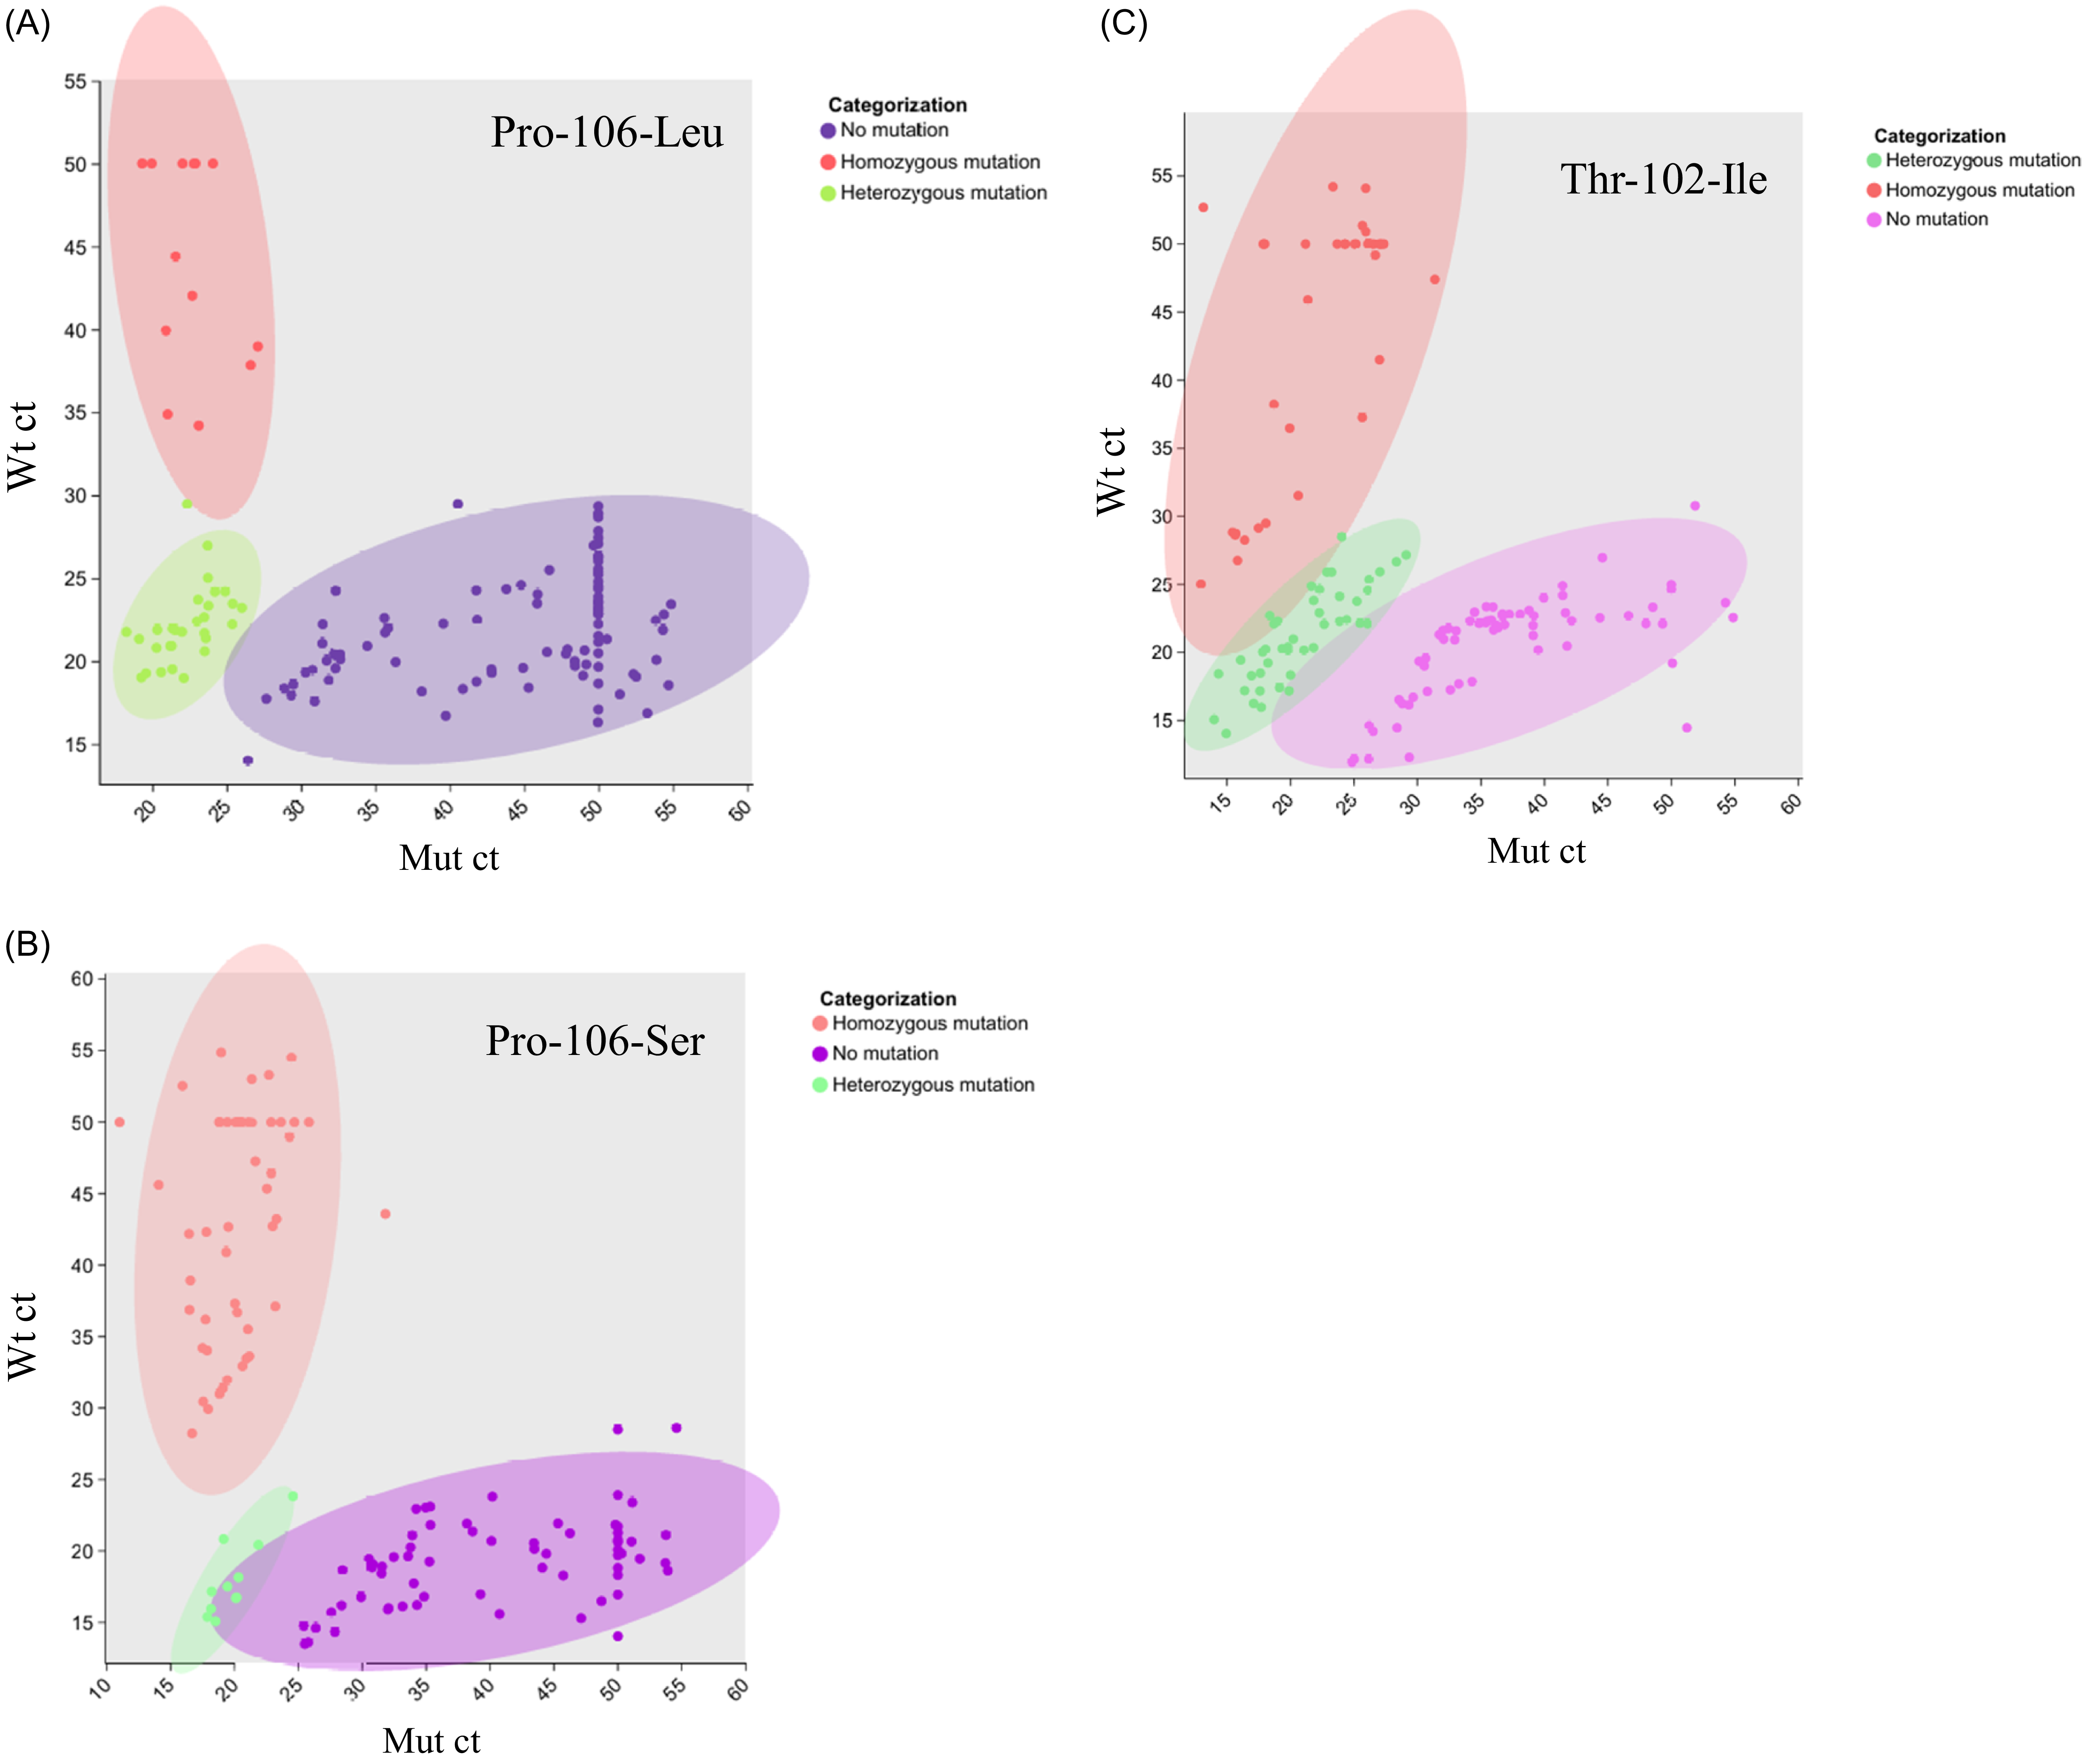
The accuracy of the dual-mode LAMP assay was assessed using 150 samples of known genotypes. Comparison with sequencing results showed that the colorimetric assay achieved an accuracy exceeding 90% (Figure 5), whereas that of the fluorescence assay exceeded 92% (Figure 6). In the colorimetric assay, misclassifications included 7 heterozygotes called as homozygous mutants, 5 heterozygotes called as wild type, 2 wild-type samples called as heterozygotes, and 1 homozygous mutant called as a heterozygote. In the fluorescence assay, 5 heterozygotes were called homozygous mutants, 4 heterozygotes as wild type, and 3 wild-type samples as heterozygotes. Neither method misclassified homozygous mutants as wild type or vice versa. These errors likely resulted from low DNA quality and the presence of inhibitors, which affected amplification efficiency and led to incorrect calls. Furthermore, in the fluorescence assay, plotting the sensitive LAMP set ct against the resistant LAMP set ct values resulted in three clearly separated clusters corresponding to wild-type, heterozygous, and homozygous mutant samples, as shown in Figure 6. The 95% confidence ellipses further highlighted the distinct Ct distribution ranges of each genotype, indicating the reliability of the established classification criteria. While assessing the individual performances of the colorimetric and fluorescence detection methods, we found that a sequential combination of both yielded higher diagnostic reliability. Initial screening via a colorimetric assay was performed, followed by validation of suspected resistant samples using real-time fluorescence detection. When the results of the colorimetric and fluorescence assays were inconsistent, the fluorescence detection outcome was adopted as the final interpretation standard. This combined approach resulted in an overall detection accuracy of 96%, as confirmed using PCR sequencing, and outperformed either method alone. The deviation from 100% accuracy is primarily due to lower DNA quality in some samples and samples with ΔCt values near the threshold separating heterozygous and homozygous genotypes, which can result in minor misclassification in LAMP amplification. The use of 150 samples from diverse regions (Guangdong, Guangxi, and Zhejiang provinces) highlighted the broad applicability of this method in China. This sequential strategy substantially improved diagnostic reliability compared with previous LAMP assays, which could not resolve heterozygous mutations. The colorimetric and fluorescence assays established in this study exhibited high accuracy in detecting all three mutation types, further underscoring their potential for rapid and reliable field application in herbicide-resistance monitoring.
Partial schematic representation of the loop-mediated isothermal amplification (LAMP) genotyping assay evaluated using 150 samples with known genotypes from Guangdong, Guangxi, and Zhejiang provinces in China, as determined using PCR sequencing (indicated at the top: Wt, wild type; Het, heterozygous mutation; Hom, homozygous mutation). A plus (+) indicates amplification with the resistance primer group, while a minus (−) indicates amplification with the sensitive primer group. (A) Detection of the Thr-102-Ile mutation; (B) detection of the Pro-106-Leu mutation; (C) detection of the Pro-106-Ser.

The fluorescence detection–based genotyping plots using 150 Eleusine indica samples from Guangdong, Guangxi, and Zhejiang provinces in China as templates, with the ct value of the sensitive primer group on the y axis (Wt ct) and that of the resistant primer group on the x axis (Mut ct). For non-amplified reactions, the cycle number was set to 50 by default. (A) The detection results for the Pro-106-Leu mutation; (B) the results for the Pro-106-Ser mutation; and (C) the results for the Thr-102-Ile mutation; each using both resistant and sensitive primer sets. The plots include 95% confidence ellipses for each genotype group, highlighting the clear separation between homozygous, heterozygous, and wild-type samples.

Notably, LAMP does not require expensive equipment or specialized skills, making it accessible in resource-limited settings (Pan et al. Reference Pan, Li, Xia, Zhang and Dong2015a). Furthermore, Wang et al. (Reference Wang, Tang, Liao, Cao and Zhao2023) used an equipment-free nucleic acid extraction strip method to extract DNA from plant samples within minutes, enabling its integration into the LAMP reaction (Zou et al. Reference Zou, Mason, Wang, Wee, Turni, Blackall, Trau and Botella2017). This combination further enhances the field deployment potential of the technology, allowing complete field analysis within an hour. Compared with traditional resistance detection methods, such as sequencing and dCAPS based on PCR technology, this method significantly reduced the detection time while maintaining specificity. Typically, dCAPS workflows require 4 to 5 h to complete PCR, electrophoresis, and restriction digestion steps, with an estimated cost of US$2 to US$3 per sample, whereas our LAMP assay can be finished within 1 h at a cost of approximately US$0.70 per sample. It should be noted that these estimates of time and cost are based on laboratory experience and practical implementation rather than from rigorous parallel comparative experiments. Overall, this highlights the practical advantages of our method in terms of both speed and cost.
Comparison of the Sensitivity of LAMP and PCR
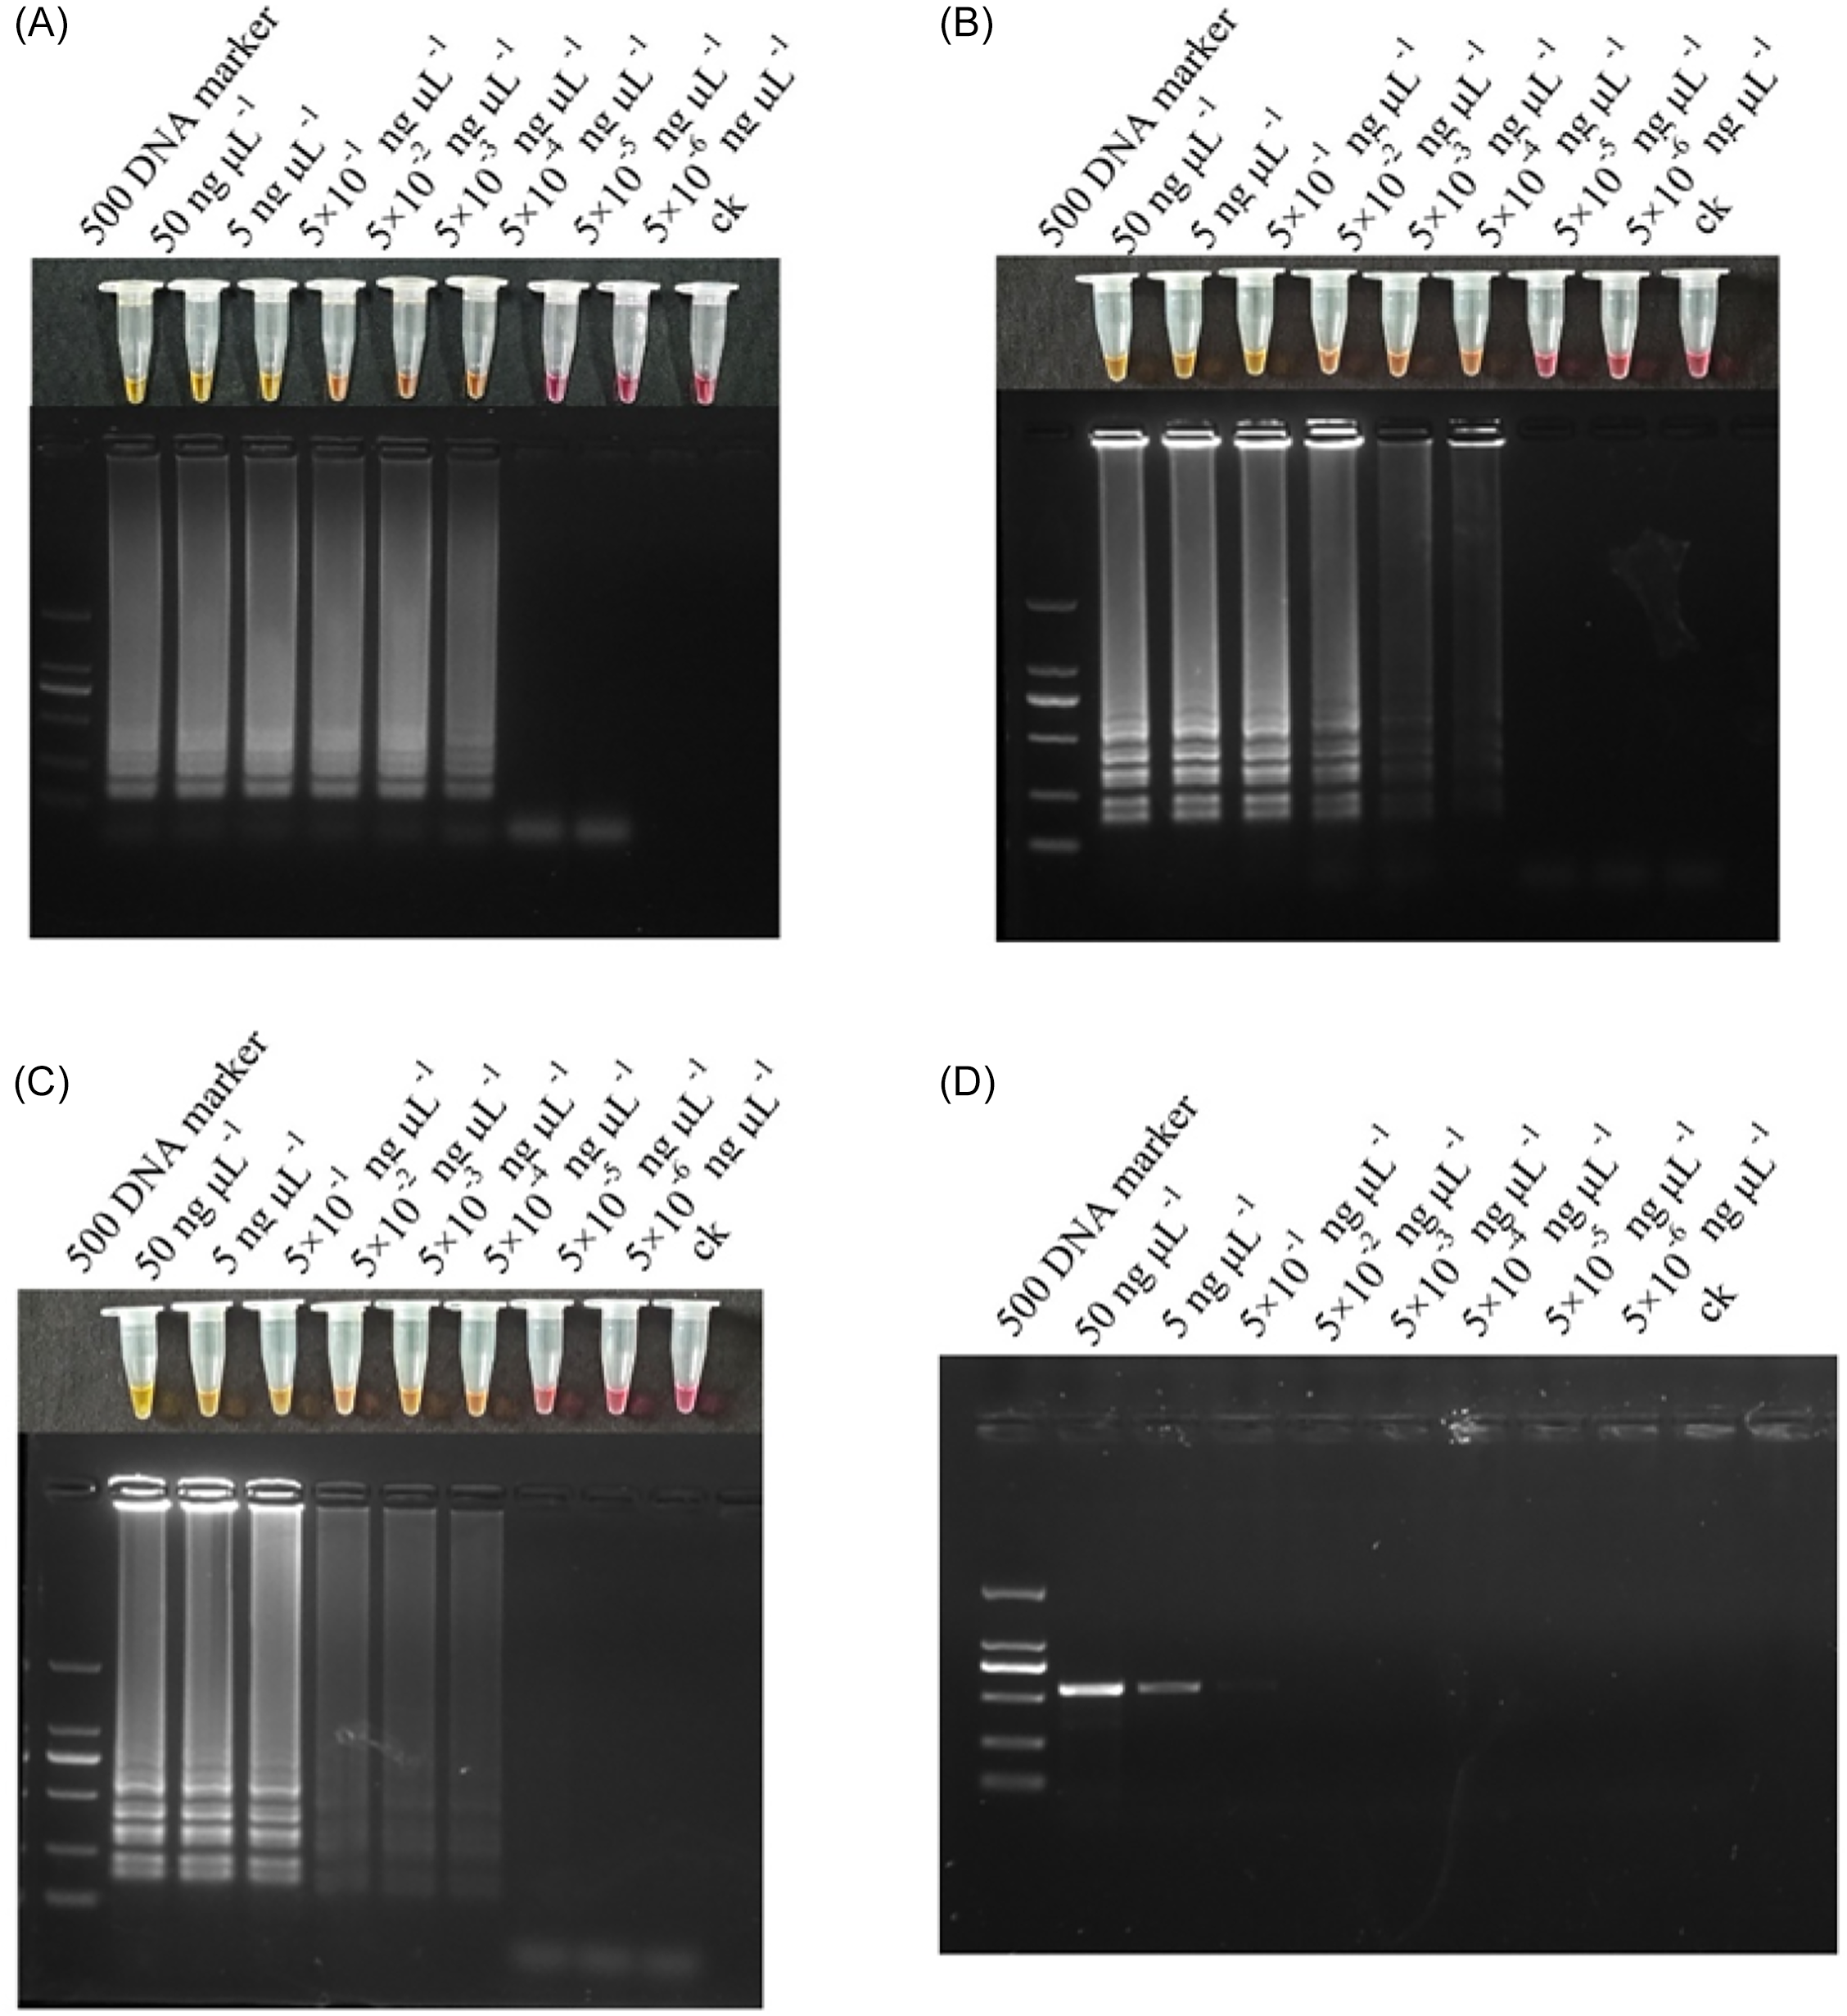
DNA extracted from E. indica populations was diluted 10-fold and used as a template for both LAMP and PCR. The sensitivities of the two methods were compared by analyzing the detection limits. In the visualization results of the LAMP reaction (Figure 7A–C; Supplementary Figure S3A–C), the color of the LAMP reaction changed from pink to yellow across the first six concentration gradients, indicating a clear color change. Subsequent agarose gel electrophoresis of both the LAMP and PCR products revealed that the LAMP product exhibited stepped bands in the concentration range from 50 to 5 × 10⁻⁴ ng μl−1, whereas the PCR product showed a single band in the 50 to 5 × 10⁻¹ ng μl−1 concentration range (Figure 7D). These results indicated that the LAMP method is more sensitive than conventional PCR and is capable of detecting lower DNA concentrations, with a detection sensitivity approximately 1,000-fold higher than that of PCR, validating its reliability for detecting low-abundance samples.
Sensitivity comparison between loop-mediated isothermal amplification (LAMP) and conventional PCR for detecting mutations in the EPSPS gene of Eleusine indica. (A–C) The LAMP visualization results and corresponding agarose gel electrophoresis of LAMP products using sample DNA concentrations ranging from 50 ng µl−1 to 5 × 10⁻⁶ ng µl−1. (A) LAMP detection using the Pro-106-Leu resistance primer set; (B) LAMP detection using the Pro-106-Ser resistance primer set; and (C) LAMP detection using the Thr-102-Ile resistance primer set. (D) Conventional PCR was performed using sample DNA across the same concentration range, and the amplification products were analyzed by agarose gel electrophoresis.

The dual-mode design established in this study is highly adaptable to various application scenarios. First, the colorimetric detection method is ideal for rapid on-site assessments of E. indica resistance in specific areas, helping agricultural workers identify high-risk zones and adjust control measures accordingly. Second, fluorescence monitoring and synergistic modes provide high-accuracy genotyping suitable for research and high-precision applications, such as resistance evolution studies or early detection close to genetically modified GR crop fields, enabling timely interventions. It should be noted that the current detection system primarily targets mutations in the EPSPS gene and cannot identify GR E. indica populations arising from non–target site mechanisms, such as enhanced metabolism or reduced translocation. Additionally, the validation of this method was based on known EPSPS target-site mutations in the selected populations, and it may not detect EPSPS variants that are uncharacterized or occur at low frequency in the population. Subsequent work could consider integrating this system with rapid phenotypic analyses, such as dose–response screening or assays of metabolism-related enzyme activities, to achieve more comprehensive and reliable detection of resistant populations. In the future, integrating microfluidic chip technology could enable fully automated detection and enhance field applicability (Li et al. Reference Li, Xu, Wang and Jiang2023). CRISPR/LAMP offers a promising approach for improving the sensitivity and specificity of single-nucleotide polymorphism detection (Li et al. Reference Li, Xu, Wang and Jiang2023; Sen et al. Reference Sen, Masetty, Weerakoon, Morris, Yadav, Apewokin, Trannguyen, Broom and Priye2024; Zhang et al. Reference Zhang, Luo and Lin2024).
Overall, we successfully developed a dual-mode LAMP genotyping technique using a double-primer set to detect P106L, P106S, and T102I mutations in GR E. indica (Fig. Graphical Abstract Image). This technique overcomes the key limitations of the traditional LAMP methods, particularly in distinguishing heterozygous mutation. This cost-effective and efficient tool has significant advantages for monitoring glyphosate resistance.
Supplementary material
To view supplementary material for this article, please visit https://doi.org/10.1017/wsc.2026.10097
Acknowledgments
We thank Zhiling Li for collecting and screening the herbicide-resistant populations used in this study during the early stages of the experiments.
Funding statement
This work was supported by the Key Project in Soybean Bio Breeding and Commercialization (2023DXZD0001), the China Agriculture Research System (CARS-25), and the Shanghai Agriculture Applied Technology Development Program, China (grant no. 2024-02-08-00-12-F00021).
Competing interests
The authors declare no conflicts of interest.


 Open access