


INTRODUCTION
Covering an area of 12 363 km2 from 48.5°S to 51.5°S (Arendt and others, Reference Arendt2015), the Southern Patagonia Icefield (SPI) forms the largest temperate ice mass in the southern hemisphere. Recent monitoring efforts reveal that the majority of the SPI's outlet glaciers have undergone significant frontal retreat and thinning over the past century (Rignot and others, Reference Rignot, Rivera and Casassa2003; Sakakibara and Sugiyama, Reference Sakakibara and Sugiyama2014). This trend of SPI mass loss is likely partly driven by long-term climatic changes. Near-surface air temperature observations made in the SPI region, for example, reveal warming of between 0.4 and 2°C since the beginning of the last century (Rosenblüth and others, Reference Rosenblüth, Casassa and Fuenzalida1995; Carrasco and others, Reference Carrasco, Cassasa, Rivera, Casassa, Sepúlveda and Sinclair2002; Villalba and others, Reference Villalba2003). In comparison, precipitation observations in the Patagonia region have shown no significant trends over the past century, despite large interannual and interdecadal variations (Rosenblüth and others, Reference Rosenblüth, Casassa and Fuenzalida1995; Carrasco and others, Reference Carrasco, Cassasa, Rivera, Casassa, Sepúlveda and Sinclair2002; Aravena and Luckman, Reference Aravena and Luckman2009). However, a study by Rasmussen and others (Reference Rasmussen, Conway and Raymond2007) has shown, through a reanalysis of SPI gridded NCEP/NCAR model data that air temperature increases from 1960 to 1999 at 850 hPA may have influenced the fraction of precipitation falling as snow, reducing ice mass accumulation.
Interestingly, in contrast with the general trend for the SPI, Glaciar Pio XI (48.26°S, 73.68°W; 1234 km2 (Arendt and others, Reference Arendt2015)), the largest outlet glacier of the SPI, has experienced a large cumulative frontal advance from 1945 to present (Fig. 1). To date, a conclusive explanation for the behaviour of Glaciar Pio XI remains to be found. Citing the large frontal fluctuations and the periodic occurrence of distinctive medial moraine folding, Rivera and others (Reference Rivera, Aravena and Casassa1997), for example, suggest the Glacier Pio XI is a surge-type glacier. Using a range of geospatial datasets, this paper presents a synoptic analysis of frontal fluctuations (1998–2014), ice velocities (1986–2014) and ice surface elevations (1975–2007) for Glaciar Pio XI, with the aim of better characterising and understanding the cumulative ice advances experienced over recent decades. In addition to these analyses, supraglacial moraine maps are also presented for selected dates between 1945 and 2014. In combination with satellite-derived ice velocity estimates, this moraine dataset allows for a unique assessment of the spatial distribution and magnitude of ice flows since 1945. Multi-annual ice velocity changes have now been described for the entire SPI by Sakakibara and Sugiyama (Reference Sakakibara and Sugiyama2014) (1984–2011) and Mouginot and Rignot (Reference Mouginot and Rignot2015) (1984–2014). Through the combination of different geospatial datasets, this study offers a more detailed assessment of Glaciar Pio XI behaviour over the past 70 a and a re-evaluation of its surge-type classification.
Location of Glaciar Pio XI, SPI, Chile. The outlines for Glaciar Pio XI were delineated manually from a Landsat Operational Land Mapper scene acquired in March 2014 (background image). Other glacier outlines are taken from Davies and Glasser (Reference Davies and Glasser2012).

Frontal fluctuations for Glaciar Pio XI have been described by Lliboutry (Reference Lliboutry1956), Warren and others (Reference Warren, Rivera and Post1997) and Sakakibara and Sugiyama (Reference Sakakibara and Sugiyama2014), among others. To summarise, between 1830 and 1928 the single snout of Pio XI advanced across the Greve Valley (where the northern and southern termini are located today) resulting in the formation of Lago Greve (Greve Lake) (Agostini, Reference Agostini1945). Following this advance, the glacier experienced a prolonged period of retreat up to 1945 (3–5 km), opening the Greve valley once more (Lliboutry, Reference Lliboutry1956). A second period of advance subsequently occurred between 1945 and 1962 leading to the reformation of Greve Lake and the splitting of frontal margins into the northern (calving into the freshwater Greve Lake) and southern termini (calving into the tidewater Eyre Fjord) (Rivera, Reference Rivera1992). For the northern terminus, this advance continued un-abated into the mid 1990s, increasing in magnitude from ~1993. The southern terminus also continued to advance up until 1981, reaching what then represented a Neoglacial maximum (Warren and others, Reference Warren, Rivera and Post1997). After reaching this maximum, the southern terminus went through a period of fluctuation, experiencing a large retreat up to 1989, before advancing in the early 1990s (reaching a new maximum in 1993) and then retreating once again in the mid- to late-1990s. Both the southern and northern termini began a general advancing phase once more between 2000 and 2006, respectively (Sakakibara and Sugiyama, Reference Sakakibara and Sugiyama2014). Rivera and others (Reference Rivera, Aravena and Casassa1997) attribute this frontal behaviour to the following glacier surge triggers: (1) enhanced subglacial water pressure – modulated by internal ice mechanisms, fjord/proglacial lake depth, and meltwater input, among others (e.g. Sugiyama and others, Reference Sugiyama2011); (2) fluctuations in geothermal activity; (3) enhanced precipitation accumulation – Glaciar Pio XI has an estimated accumulation area ratio of ~0.8 (Rivera and Casassa, Reference Rivera and Casassa1999; De Angelis, Reference De Angelis2014); and (4) proglacial sedimentation. However, in the absence of further investigation, these factors, including others, are difficult to assess.
In comparison with Glaciar Pio XI, other glaciers of the SPI have undergone periods of stability and rapid retreat that are likely to be decoupled from the regional climate signal. Importantly, all but two of the SPI's 48 outlet glaciers are classified as either tidewater or freshwater calving (Aniya and others, Reference Aniya, Sato, Naruse, Skvarca and Casassa1996). Ice calving along frontal margins often represents a dominant ablation mechanism, being controlled by complex interactions between ice dynamics, ice thickness, fjord/freshwater lake water depth, ice front buoyancy and valley topography (Benn and others, Reference Benn, Warren and Mottram2007; Rivera and others, Reference Rivera, Koppes, Bravo and Aravena2012a, Reference Rivera, Corripio, Bravo and Cisternasb). Glaciar O'Higgins (48.98°S, 73.30°W), for example, experienced rapid frontal retreat between the 1940s and 1980s (~14 km) (Casassa and others, Reference Casassa, Brecher, Rivera and Aniya1997), which slowed significantly during the following decade (Aniya, Reference Aniya1999). The nearby Glaciar Jorge Montt (48.43°S, 73.54°W), however, began to retreat rapidly in the 1990s, a process that has continued to present (retreating >10 km) (Rivera and others, Reference Rivera, Koppes, Bravo and Aravena2012a). Such behaviour can be attributed to what is known as the tidewater calving cycle (Post and others, Reference Post, O'Neel, Motyka and Streveler2011), where the retreat of tidewater/freshwater calving glaciers is enhanced when the ice thins and detaches from local shallow pinning points and retreats into deep-water basins. In this scenario, buoyancy increases and, hence, rapid iceberg production and retreat take place until a new shallow pinning point is reached. For the SPI, retreat/calving phases have in some cases been accompanied by significant ice velocity increases, which in turn enhance frontal thinning and ice mass throughput (Rivera and Casassa, Reference Rivera and Casassa2004; Sakakibara and Sugiyama, Reference Sakakibara and Sugiyama2014; Mouginot and Rignot, Reference Mouginot and Rignot2015). Glaciar Pio XI differs from the above mentioned glaciers in that it has undergone a long-term frontal advance which, observations suggest, has been partly (1975–95) accompanied by ice thickening at lower regions (Rivera and Casassa, Reference Rivera and Casassa1999).
DATA AND METHODS
Multitemporal ice velocity, supraglacial moraine, frontal fluctuation and surface elevation datasets were obtained using optical satellite imagery and airborne laser altimetry survey data listed in Table 1. In addition, the following datasets were made available from Rivera (Reference Rivera1992), Rivera and others (Reference Rivera, Aravena and Casassa1997) and Rivera and Casassa (Reference Rivera and Casassa1999): (1) ice margin and surface moraine delineations derived from USArmy Air Force Trimetrogon aerial photography (1945), Chilean Aerophotogrametric Service aerial photography (1981) and terrestrial photography (1992, 1993); (2) a DEM representing the surface of Glaciar Pio XI in 1975 derived from a Instituto Geográfico Militar (IGM) of Chile cartographic map at scale of 1 : 50 000.
Spatial datasets used to map frontal fluctuations and supraglacial moraines and estimate ice velocities
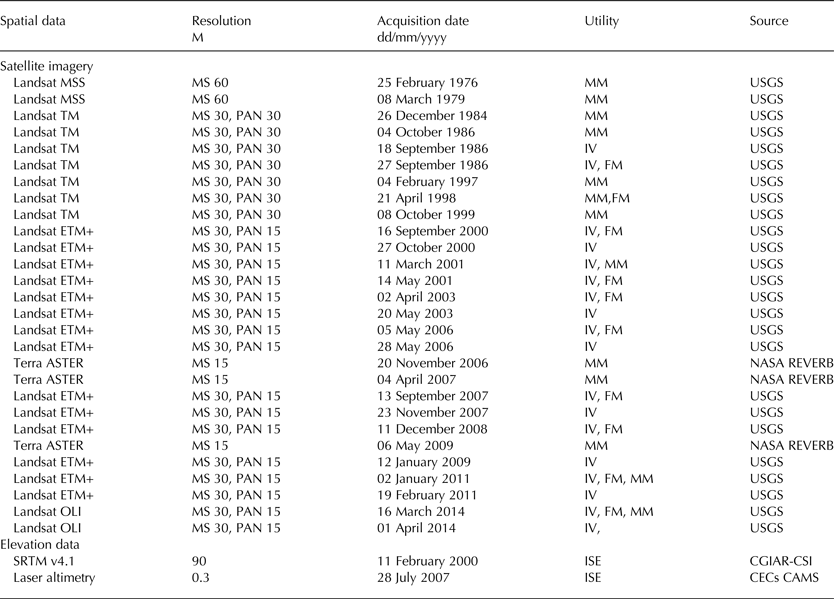
MS, multispectral; PAN, panchromatic; MM, moraine mapping; IV, ice velocity; FM, frontal margins; ISE, ice-surface elevation.
Where possible the Terra ASTER and Landsat Multispectral Scanner (MSS), Thematic Mapper (TM), Enhanced Thematic Mapper (ETM+) and Operational Land Mapper (OLI) imagery selected were acquired during the Patagonian Ablation season (December–March) when snow cover was limited. However, due to the unavailability of snow/cloud free imagery and gaps in the Landsat archive this objective in some cases was not possible. Unless stated otherwise, all data processing procedures and analyses were performed using GIS tools available within the ArcGIS software package.
Mapping frontal fluctuations and moraine patterns
The frontal margins of the northern and southern termini of Glaciar Pio XI were manually delineated from a total of 10 multispectral Landsat ETM+ and OLI satellite images acquired between 1998 and 2014. Frontal fluctuations between each observation date were subsequently averaged along 24 and 27 flow lines running parallel to the flow direction of the northern and southern termini, respectively. To calculate length change error the method proposed by Williams and others (Reference Williams, Hall, Sigurdsson and Chien1997) and Hall and others (Reference Hall, Bayr, Schöner, Bindschadler and Chien2003) was utilised. For each observation pair, possible error was calculated in the linear direction (d) using the formula:
 $$d = \; \sqrt {r_1^2 + r_2^2} + {\rm RMSE}$$
where r 1 represents the spatial resolution (pixel cell width) of the first image, r 2 the spatial resolution of the second image and RMSE the co-registration error. Here, the multispectral spatial resolution of the Landsat TM, ETM+ and OLI imagery used was 30 m and, although image co-registration was not performed, visual inspection revealed mis-alignments of up to half a pixel (15 m). The resulting linear error attributed to the length change measurements equates to ±42 m.
In addition to those made available by Rivera (Reference Rivera1992) and Rivera and others (Reference Rivera, Aravena and Casassa1997) (for 1945, 1992, 1993 and 1981), ice surface moraines were manually mapped for selected dates between 1976 and 2014 using Terra ASTER and Landsat MSS, TM, ETM+ and OLI imagery. This process was often hindered by the varying extent of snow/cloud cover present within the imagery selected. Therefore, in an attempt to standardise the moraine maps, only the most prominent/visible moraine features were delineated.
Estimating ice velocities
In order to estimate glacier flow velocity and direction automatically from repeated Landsat imagery the Correlation Image Analysis Software (CIAS) was used (Kääb and Vollmer, Reference Kääb and Vollmer2000). CIAS measures horizontal displacements of corresponding pixel clusters/surface features identified within overlapping image pairs through Normalized Cross-Correlation (this process being described by Heid and Kääb, Reference Heid and Kääb2012a). In total, ice displacements and their direction were obtained from 18 Landsat image pairs with a temporal separation ranging from 9 to 71 d (Table 1). To maximise surface feature identification, the higher resolution panchromatic band was utilised for Landsat ETM+ and OLI image pairs.
Once generated, erroneous ice-surface displacements were removed using (1) velocity amplitude and flow direction filters, (2) CIAS-derived point correlation coefficients (deleting points <0.6) and (3) manual editing. Additionally, displacements obtained from post-SLC failure Landsat ETM+ image pairs were filtered using null value strip masks. To calculate ice flow direction changes, flow direction raster grids (100 m resolution) generated for each observation pair (containing geographic angles ranging from 0° to 360°) were subtracted.
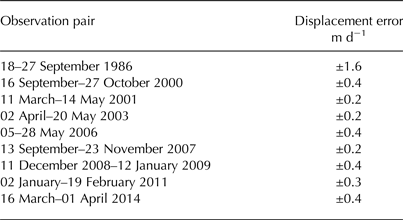
Without the availability of field data for validation, ice velocity errors associated with cross-correlation failures and image mis-matches were quantified from the RMS horizontal displacement of stable non-glacier locations. Subsequently, ice velocity errors were found to range from ±0.2 to ±1.6 m d−1 (Table 2), being influenced mainly by image resolution. When ice velocities from differing observation pairs are compared, uncertainty is quantified through error propagation. In this case, the largest uncertainties can be attributed to comparisons of ice velocities estimated from 1986 (Landsat TM) and 2000 (Landsat ETM+), equating to ±1.6 m d−1.
Displacement errors of stable non-glacier locations
Ice-surface elevation change, 1975–2007
Ice surface elevation changes were analysed through the comparison of three DEMs representing the years 1975, 2000 and 2007. The 1975 DEM was generated from a 50 m contour interval IGM cartographic map, at 1 : 50 000 scale, derived from aerial photography. After digitisation and interpolation of contours, the original resolution of the 1975 DEM was 200 m. Considered as class 1 for accuracy, in terms of the American Society for Photogrammetry and Remote Sensing (Falkner, Reference Falkner1995), vertical error for the 1975 DEM is estimated to be ±17 m.
The 2000 DEM is extracted from the Shuttle Radar Topography Mission (SRTM) v.3 global elevation dataset. This dataset is available at 90 m resolution with vertical errors estimated to be ±7 m (Hensley and others, Reference Hensley, Rosen and Gurrola2000; Rignot and others, Reference Rignot, Rivera and Casassa2003). The 2007 DEM was generated from airborne laser altimetry survey data acquired over the lower reaches of Glacier Pio XI by the CECs Airborne Mapping System (CAMS) at a resolution of 0.3 m. Vertical accuracy of the Patagonian CAMS data are estimated as ±1 m. For comparison purposes, the 1975 and 2007 DEMs were resampled to match the pixel resolution of the 2000 SRTM DEM (90 m). The combined vertical error of each DEM comparison, through propagation, equates to ±18 m (±0.7 m a−1) between 1975 and 2000 and ±7 m (±1 m a−1) between 2000 and 2007.
RESULTS
Frontal fluctuations, 1998–2014
The frontal fluctuations of Glaciar Pio XI between 1998 and 2000 are shown in Figure 2. Between April 1998 and September 2000 both the northern and southern termini experienced relatively large retreats of 328 and 589 m, respectively. After this period of retreat, the southern terminus underwent an almost continuous advance up to April 2014. Overall, the southern terminus experienced a cumulative advance of 593 m relative to the April 1998 frontal position. In comparison, the northern terminus continued retreating between April 1998 and May 2005 (−677 m) before switching to an advancing phase up to April 2014 (784 m). Consequently, the northern terminus experienced a cumulative advance of 107 m relative to the April 1998 frontal position.
Frontal fluctuations of the northern (NT) and southern (ST) termini of Glaciar Pio XI between 21 April 1998 and 16 March 2014.

The cumulative advance of both the northern and southern termini between 1998 and 2014 was such that the majority of the 2014 frontal margins exceeded the maximum positions attained in 1993. In regards to the southern terminus, for which organic basal material has been previously dated (see Warren and others, Reference Warren, Rivera and Post1997), it is thus likely that a large portion of the frontal margin in 2014 reached what represents a new Neoglacial maximum.
Glaciar Pio XI surface elevation changes, 1975–2007
A length profile of the central flow line running from ~960 m a.s.l. to the frontal margin of the southern terminus reveals an average surface thickening of 1 m a−1 between 1975 and 2000 with a maximum value of 2 m a−1 occurring in the central regions of the southern terminus (Fig. 3a). The 2007 LiDAR survey of both the northern and southern termini reveals an accelerated rate of surface thickening between 2000 and 2007, which along the length profile (where points correspond to measurements made from 2000) equates to an average of 6.7 m a−1. This surface thickening, however, is spatially variable.
Ice surface elevation information extracted from cartographic map data (1975), SRTM data (2000) and LiDAR survey data (2007) across two profiles of Glaciar Pio XI. Profile location, corresponding reference arrows and start/end points are indicated within the subsets provided.

Figure 3b shows elevation information for a cross-profile running along the central flow line of both the northern and southern terminus revealing the distribution of changes across this region. Between 1975 and 2000, surface thickening is largest at the northern terminus averaging 1.4 m a−1 in comparison with 1.2 m a−1 for the southern terminus. From 2000 to 2007, both termini again experience surface thickening, this being more prominent for the southern terminus. For the southern terminus, ice thickening shows a maximum of 17.6 m a−1 at the location occupied by the ice front in 2000. Additionally, clear surface bulges are identified at points ~1.7 km (+11.9 m a−1) and 8.5 km (+5.0 m a−1) upstream of the southern terminus as of 2007. This extensive thickening of the Southern terminus has also been qualitatively observed in daily time lapse photography acquired from a fixed-camera position located on western margin of the terminus between 1 May and 17 September 2009 (camera installed and operated by CECs).
Ice velocity (1986–2014) and supraglacial moraine (1945–2014) changes for Glaciar Pio XI
Ice displacement data estimated from Landsat TM, ETM+ and OLI imagery indicates the existence of two phases of ice flow velocities at Glaciar Pio XI, occurring between 1986–2000 and 2000–14 (Figs 4, 6). During the first phase (1986–2000), ice flow is shown to undergo a widespread acceleration (Fig. 4) with velocities measured along the central flow line increasing by an average of 1.9 m d−1. However, the interpretation of this first phase is limited by the lack of observations between 1986 and 2000. For the following 14 a period, which represents the second phase, ice velocities, particularly for the Southern terminus, are shown to generally decrease, interphased by a period of relative increases in 2006 and 2007. Measurements along a cross profile of the southern terminus, for example, reveals an average speed change of −3.9 m a−1 between 2000 and 2014.
Feature tracking derived ice velocity profiles obtained from Landsat TM, ETM+ and OLI satellite imagery acquired between 1986 and 2014. Profile location, corresponding references arrows and start/end points are indicated within the subsets provided.

Interestingly, the two temporal phases in ice flow identified for Glaciar Pio XI are also accompanied by distinct changes in both spatial and directional ice flow characteristics. These changes are evident when comparing flow field estimations made for 1986, 2000 and 2014 (Figs 5, 6). Beginning in 1986, ice speed along the central trunk is shown to increase towards a topographic narrowing point before reaching a maximum (~14.5 m d−1) at the frontal margins of the southern terminus. The southern terminus in 1986 represents the primary ice flow path, while the northern terminus represents the secondary flow path. In comparison, flow paths estimated for 2000 show similar characteristics, with the Southern terminus continuing to be the primary flow path. However, in contrast to the increasing speeds exhibited over the majority of the ice area sampled, speeds at the northern terminus are shown to decrease significantly by 2000. Central flow line measurements for the northern terminus, for example, reveal a maximum ice speed change of −5.8 m d−1 between 1986 and 2000 (Fig. 4). This deceleration, occurring across the entire northern terminus, is accompanied by a flow direction shift along the NW-SW flowing southern terminus and NNW flowing northern terminus divide. Here, the fast flowing NW-SW southern flow path is shown to expand in a northwards direction (Fig. 5) encompassing an ice area that in 1986 flowed towards the northern terminus.
Ice velocity fields (a, b) and the spatial distribution of velocity (c) and ice flow direction changes (d) between 1986 and 2000.

Ice velocity fields (a, b) and the spatial distribution of velocity (c) and ice flow direction changes (d) between 2000 and 2014.

In 2014, the primary flow path, as of 2000, is shown to alter considerably. In addition to experiencing a large deceleration in the central portions of the southern terminus, maximum flows are shown to shift upstream towards the northern/southern terminus divergence point, with relatively high velocities in the central flow path of the main glacier trunk. This progressive upstream shift of maximum ice velocities is shown in Figure 7. Furthermore, in contrast to the southern terminus, the northern terminus is shown to accelerate between 2000 and 2014. As a result, during slow ice flow conditions in 2014 the primary calving outlet has switched to the northern terminus with ice velocities for the southern terminus being <1 m d−1. Consequently, the aforementioned changes in flow direction at the NW-SW/NNW flow divide have been reversed (Fig. 6). Additionally, as a result of the relatively slower flows of the southern terminus in 2014, ice close to the sides of the southern ice trunk no longer flows in a direction parallel to the central flow line (south-westerly), instead flowing outwards towards the margins.
Ice velocity distributions for Glaciar Pio XI, estimated between 1986 and 2014. Gaps present for the 2006, 2007, 2008/09 and 2011 velocity datasets indicate null value strips within Landsat ETM+ imagery post SLC failure.

Supraglacial moraine maps representing dates between 1945 and 2014 are presented in Figure 8. Multitemporal maps of ice surface moraine movements can give some indication of ice flow behaviour during a given epoch. The existence of tightly folded moraines along the western margin of Glaciar Pio XI during 1976 and 1979, for example, indicate possible annual/interannual ice flow pulses. Manual tracking of these folded moraines on the southern terminus suggests slow ice flow conditions of 1.3 m d−1, which compares with satellite-derived velocities of ~5 and ~10 m d−1 for the same area of ice in 1986 and 2000, respectively. The presence of a more arcuate moraine fold in 1981 may indicate the beginning of an ice flow surge, leading to ice flow conditions similar to that estimated in 1986. Arcuate folds are also visible in 1992 and 1993 close to the terminus of the southern terminus. However, movement of the arcuate folds identified between 1992 and 1993 suggests slow flow conditions of 1.4 m d−1, which compare with satellite-derived velocities of ~8 and >13 m d−1 for the same area of ice in 1986 and 2000, respectively.
Supraglacial moraine maps representing selected years between 1945 and 2014 underlain by satellite-derived ice velocities. Gaps present for the 2006, 2007, 2008/09 and 2011 velocity datasets indicate null value strips within Landsat ETM+ imagery post SLC failure.

A large moraine fold visible on the southern terminus in 1997 marks a second ice flow surge, with manual tracking of this feature up to 1998 indicating ice flows of 5.3 m d−1. This flow estimate between 1997 and 1998 compares with ice velocities of ~9–15 m d−1 measured for the same ice area in 2000 (which may have been the peak of the second surge). In 2011 and 2014, the central moraines visible on the southern terminus are shown to be transported towards the western ice margins as ice flow reduces to a minimum. Notably, the ice moraines visible in 2014 also indicate possible ice buttressing in the central portions of the southern terminus. Additionally, the formation of a new moraine fold in 2014 (a feature not visible between 2000 and 2009) is likely the result of the influence of the upstream shift in maximum velocities and the accelerated ice flow of the northern terminus.
DISCUSSION
Glaciar Pio XI has previously been classified as a surge-type glacier by Rivera and others (Reference Rivera, Aravena and Casassa1997). Importantly, the temporal and spatial extent of the ice elevation, surface velocity and supraglacial moraine datasets presented allows for a more extensive evaluation of this classification. Drawing from earlier studies on surging glaciers, Sevestre and Benn (Reference Sevestre and Benn2015) define three main criteria for the identification of a surge-type glacier: (1) periodical cycles in ice flow velocities characterised by surging phases, when velocities can be at least an order of magnitude higher than normal, and passive or quiescent phases, when velocities are abnormally slow; (2) ice terminus advance, which is out of synchrony with the behaviour of neighbouring glaciers; and (3) the presence of morphological features such as looped moraines and heavy crevassing on the glacier surface.
Analysis of the various datasets presented suggests that Glaciar Pio XI meets all three of the above criteria, therefore confirming its status as the only reported surge-type glacier of the SPI. Most notably, the ice velocity and supraglacial moraine time series identify a surge event between 1997 and 2000 followed by a prolonged period of considerably slower ice-surface velocities. These observations suggest surge and quiescent phases of ~3 years and 14+ years, respectively. The 1997 to 2000 surge event was preceded by another possible surge event ~1981, marked by a distinctive looped moraine. Additionally, by 2014, the frontal margins of the southern terminus had advanced to what is likely a neoglacial maximum, which is in contrast to nearby glaciers of the SPI, which have generally retreated during recent decades (Sakakibara and Sugiyama, Reference Sakakibara and Sugiyama2014).
With this paper offering further observation and characterisation of Glaciar Pio XI's surge-type behaviour, a greater insight can be gained into what processes are driving this anomalous behaviour. On a global perspective, elements of Glaciar Pio XI's behaviour deviate from what has been observed for other surge-type glaciers. The Maxent distribution model employed by Sevestre and Benn (Reference Sevestre and Benn2015) to predict the location of surge-type glaciers with the use of climatic and glacier geometry variables, for example, suggests that Glaciar Pio XI is located in a glacierised area that only has ~38% probability of harbouring surge-type glaciers. However, in respect to the SPI, Glaciar Pio XI does exhibit characteristics conducive to glacier surging. Glaciar Pio XI is the largest glacier of the SPI, for example, flowing from a wide accumulation area into a narrow outlet. Such geometric characteristics have been shown to differentiate surge-type and normal glaciers in other parts of the world (Jiskoot and others, Reference Jiskoot, Murray and Boyle2000; Hewitt, Reference Hewitt2007; Sevestre and Benn, Reference Sevestre and Benn2015).
One factor, which may separate Glaciar Pio XI from other observed surge-type glaciers is its ice calving behaviour, particularly at the tidewater calving southern terminus (Warren and Rivera, Reference Warren and Rivera1994). Glacier surges observed in Svalbard (Schytt, Reference Schytt1969; Mansell and others, Reference Mansell, Luckman and Murray2012), the Canadian High Artic (Copland and others, Reference Copland, Sharp and Dowdeswell2003), the Karakorum (Hewitt, Reference Hewitt2007) and Iceland (Larsen and others, Reference Larsen, Geirsdóttir and Miller2015) have been accompanied by terminus advances followed by periods of stagnation or retreat during quiescent phases. In contrast, comparisons of the moraine and ice surface velocity datasets presented here with available frontal fluctuation records for the southern terminus (Rivera and others, Reference Rivera, Aravena and Casassa1997; Sakakibara and Sugiyama, Reference Sakakibara and Sugiyama2014) reveal that, generally, periods of frontal advance are characterised by slow ice flow conditions (e.g. 1976–1981; ~1990–93; 2001–14) while the observed ice flow surges are characterised by large frontal retreats during which ice calving is likely enhanced. Although not temporally exhaustive, visual analysis of each aerial and satellite image utilised (Table 1) revealed that icebergs attributed to the southern terminus were only visible on the surface of Eyre Fjord in 1999, 2000 and 2001 (in September 2000 being clearly visible >30 km from their source), corresponding to the observed period of surging.
The synchrony of ice flow surging and frontal retreat at the southern terminus of Glaciar Pio XI draws similarities with the behaviour of other glaciers of the SPI, which are influenced by individual tidewater calving cycles, for example Glaciar Jorge Montt (Rivera and others, Reference Rivera, Koppes, Bravo and Aravena2012a), suggesting that ice flow acceleration is initiated when the glacier retreats into deepened basal topography with increased water depths. Glacier surging that is initiated at the terminus and then propagates up-glacier has also been observed for other tidewater calving glaciers in Svalbard, Greenland and Iceland (Björnsson and others, Reference Björnsson2003; Murray and others, Reference Murray, Strozzi, Luckman, Jiskoot and Christakos2003; Pritchard and others, Reference Pritchard, Murray, Luckman, Strozzi and Barr2005). Although the initiation of glacier retreat/ice calving at the southern terminus seems likely to be an important variable in regards to Glaciar Pio XI's surging behaviour, what factors trigger this initiation remain uncertain. It is widely agreed that glacier surges occur in response to internally driven oscillations in basal conditions (Sevestre and Benn, Reference Sevestre and Benn2015). For temperate glaciers, theory suggests that surging is triggered when subglacial drainage systems switch from efficient tunnel networks to inefficient linked-cavity networks, the latter increasing basal water pressure and promoting flow by sliding (Kamb and others, Reference Kamb1985; Björnsson, Reference Björnsson1998). As a consequence of this hydrological switching, it is possible that changes in the output of meltwater and sediment at the southern terminus regions may influence ice calving by altering effective water depth, as suggested by Warren and Rivera (Reference Warren and Rivera1994). However, further detailed investigations are needed in order to test this hypothesis.
Considering the cumulative advance and thickening of Glaciar Pio XI between 1945 and 2014, positive mass-balance conditions may represent another factor influencing its behaviour. This notion is supported by a recent study performed by Schaefer and others (Reference Schaefer, Machguth, Falvey, Casassa and Rignot2015) in which mass-balance simulations, forced by NCEP-NCAR reanalysis climate data, identify Glaciar Pio XI as having a positive cumulative mass balance between 1975 and 2013/14. However, this mass balance projection was primarily driven by a simulated increasing trend in precipitation for which large uncertainties likely exist due to the sparsity of in-situ observations in Patagonia and large spatial variabilities in precipitation patterns. Alternatively or concurrently, the observed thickening may have been induced dynamically. Glacier surges, for example, are often accompanied by sudden thickening of ablation zones as excess mass stored in accumulation zones during quiescent phases is transferred down-glacier (Meier and Post, Reference Meier and Post1969; Nuth and others, Reference Nuth, Moholdt, Hagen and Kääb2010; Bevington and Copland, Reference Bevington and Copland2012). In the case of Glaciar Pio XI, the enhanced calving at the southern terminus during surge phases may have enhanced thickening at the lower reaches by creating increased longitudinal stretching. The thickening observed here between 2000 and 2007 may therefore represent the delayed arrival of dynamically acquired mass. The observed deceleration of ice flows during this period of thickening, and up to 2014, is not unusual for surging glaciers switching into quiescent phases (Meier and Post, Reference Meier and Post1969). During surge phases, for example, ice flow is often greater than the balance velocity (movement being dominated by basal sliding) while during quiescent phases the opposite is true allowing mass to build up in accumulation zones.
Differentiating between the mass balance and surge dynamic components of Glaciar Pio XI's behaviour remains difficult and is beyond the scope of the datasets presented. Here, the understanding of these two variables is limited by the lack of elevation data further up-glacier in the accumulation zones. Observations of ice thinning in these upper regions between 1975 and 2007, for example, would, further confirm the influence of dynamically acquired thickening in lower regions. Furthermore, it is important to note that the ice thickening observed between 1975 and 2000 is subject to large uncertainties related to the use of an IGM cartographic map and may not be indicative of mass-balance or ice-dynamic changes.
CONCLUSION
In an attempt to better understand the behaviour of the advancing Glaciar Pio XI, frontal positions, ice-surface elevations, ice velocities and supraglacial moraine maps, derived from various geospatial datasets, are presented over time periods ranging from 1945 to 2014. Frontal position measurements, made between 1998 and 2014, revealed that the northern and southern termini retreated until 2005 and 2000, respectively, before experiencing an almost continuous advance. By 2014, the northern and southern termini had advanced 107 and 593 m, respectively, with reference to their 1998 positions. In regards to the southern terminus, it is likely that a large portion of the frontal margin in 2014 reached what represents a Neoglacial maximum. In addition to the advances reported here and by others for earlier periods, Glacier Pio XI thickened along a central flow line by an average of 1 m a−1 between 1975 and 2000, and by an additional 6.7 m a−1 for the southern terminus between 2000 and 2007.
Together with the observed advances and ice thickening, the multitemporal supraglacial moraine maps and satellite-derived ice velocities presented reveal distinct changes in the ice dynamics of Glaciar Pio XI. Ice velocity measurements show that ice flows accelerated between 1986 and 2000 reaching peaks of >15 m d−1 for the southern terminus, interphased by a period of slow ice flow in the early 1990s. Between 2000 and 2014, the glacier experienced a general deceleration, reducing by an average of 3.9 m d−1 along the central flow line of the southern terminus and main glacier trunk. The northern terminus, however, is the exception to this trend with ice velocities undergoing opposite changes during these two periods. Not only experiencing changes in ice velocity magnitude, the spatial characteristics of Glaciar Pio XI's ice flow are also shown to alter during this 28 a period. Most notably, the primary flow path is switched from the southern terminus in 1986 and 2000 to the northern terminus in 2014, while maximum ice flows by 2014 are shifted upstream to areas covered by the main glacier trunk. Such ice-dynamic changes are likely to influence the behaviour of Glaciar Pio XI in the future.
Extending the assessment of ice flows back to 1945, the supraglacial moraine maps presented highlight ice flow surge events ~1981 and again between 1997 and 2000. Together with the ice velocity presented, these observations help further identify Glaciar Pio XI as a surge-type glacier. Both the surge events observed occurred during periods of large frontal retreat during which ice calving was likely enhanced. In comparison, periods of observed frontal advance are characterised by slow ice flow conditions. Overall, the observed changes suggest that the transport of mass down-glacier and the fluctuations of Glaciar Pio XI's frontal positions are influenced by a complex interaction between ice dynamics, ice calving and mass-balance components (among others). Further monitoring of these components, together with long-term acquisition of local climate data, is thus essential for the understanding of future behaviour.
ACKNOWLEDGEMENTS
This work was performed at Centro de Estudios Científicos (CECs), Valdivia which is funded by the Chilean Government through the Centers of Excellence Base Financing Program of Comisión Nacional de Investigación y Tecnológica de Chile (CONICYT). The authors gratefully acknowledge the U.S. Army Air Force (aerial photography), Chilean Aerophotogametric Service and Instituto Geográfico Militar (aerial photography and cartographic map), USGS (Landsat imagery) and NASA LP DAAC (ASTER imagery) for data access. The time-lapse photography used as a reference for the ice surface elevation change analysis was acquired from a fixed camera station installed by Camilo Rada (CECs) in 2009. We would also like to thank Jens Wendt for processing the LiDAR survey data.


 Open access

