

Metabolic syndrome (MetS) is associated with the development of CVD( Reference Kaur 1 ). MetS involves at least three of the five following metabolic alterations: elevated waist circumference, high serum TAG, low HDL cholesterol, elevated fasting plasma glucose and elevated blood pressure( Reference O’Neill and O’Driscoll 2 ). With its prevalence increasing exponentially in recent decades, MetS has been regarded as an important public health issue in the 21st century, affecting about 25 % of the population in developed countries in parallel with obesity and diabetes( Reference Athyros, Ganotakis and Elisaf 3 ). Recently, increasing evidence has shown that alcohol consumption( Reference Sun, Ren and Liu 4 ), soft drink intake( Reference Narain, Kwok and Mamas 5 ) and coffee and tea consumption( Reference Marventano, Salomone and Godos 6 ) are closely associated with MetS. Therefore, dietary factors are considered to play an important role in MetS( Reference Lutsey, Steffen and Stevens 7 ).
As important sources for a wide range of beneficial nutrients and non-nutrient substances, fruits and vegetables are rich in fibre, vitamins (particularly A, B and C), minerals (Se and K), antioxidants (carotenoids and tocopherols) and phytochemicals (flavonoids, glucosinolates and isothiocyanates)( Reference Duthie, Duthie and Russell 8 ). A survey report, which was based on a sample extracted from fifty-two low- and middle-income countries, showed that 77·6 % of men and 78·4 % of women had daily fruit and vegetable intake lower than 400 g (the minimum intake recommended by the WHO)( Reference Hall, Moore and Harper 9 ). Low intake of fruits and vegetables is deemed a risk factor for many health problems, such as cancer, CVD, stroke and all-cause mortality( Reference Aune, Giovannucci and Boffetta 10 ). The consumption of vegetables and fruits should also be considered with regard to MetS. Vitamin C and fibre, which are two of the primary constituents in vegetables and fruits, are believed conducive to the control of MetS( Reference Kim and Choi 11 – Reference Hosseinpour Niazi, Mirmiran and Sohrab 14 ). In addition, antioxidants and anti-inflammatory components from fruits and vegetables are also considered to be beneficial for MetS( Reference Qiao 15 ). Therefore, it is natural to speculate that vegetable and/or fruit consumption is inversely associated with MetS. To our best knowledge, the effect of vegetable and/or fruit intake on MetS has been investigated by numerous epidemiological studies( Reference Lutsey, Steffen and Stevens 7 , Reference Hong and Kim 16 – Reference Chen, Hsiao and Chiu 40 ), but conclusions are still controversial. In view of this, the present meta-analysis of observational studies aimed to further examine the associations of vegetable and/or fruit consumption with MetS. It was hypothesized that vegetable and/or fruit consumption would be inversely associated with MetS.
Materials and methods
Search strategy
The current meta-analysis was conducted according to the Preferred Reporting Items for Systematic Review and Meta-Analyses (PRISMA) guidelines( Reference Liberati, Altman and Tetzlaff 41 ). The electronic databases of PubMed, Web of Science and EMBASE were searched up to September 2017, using a series of logic combinations of keywords and in-text words that are related to MetS (‘metabolic syndrome’, ‘metabolism syndrome’), vegetables and fruits (‘vegetable’, ‘vegetables’, ‘fruit’, ‘fruits’). No language restrictions were set in the search strategy. We first screened the title and abstract of all the articles to identify eligible studies and then read the full article to include eligible studies. Moreover, the reference lists from retrieved articles were reviewed to identify additional studies. The corresponding author of the potential relevant study was contacted if the full text was not available.
Study selection
The title, abstract and full text of all retrieved studies were reviewed by two researchers (Y.Z. and D.Z.Z.) independently. Disagreements were resolved by discussion and mutual consultation. The included studies were required to meet the following criteria: (i) observational studies in the general population; (ii) the exposure of interest was vegetable and/or fruit consumption; (iii) the study outcome included MetS; and (iv) hazard ratio (HR), relative risk (RR) or odds ratio (OR) and 95 % CI were reported. The exclusion criteria were as follows: (i) duplicated or irrelevant articles; (ii) reviews, letters or case reports; (iii) randomized controlled trials; and (iv) non-human studies.
Data extraction
Data extraction was conducted by two independent reviewers (Y.Z. and D.Z.Z.) and disagreements were resolved by consensus. The following information was collected: first author, year of publication, location, age and gender of the study population, sample size, study design, adjustments, exposure, exposure assessment and diagnostic criteria of MetS. The corresponding effect estimates adjusted for the maximum number of confounding variables with corresponding 95 % CI for the highest v. lowest level were extracted. For the studies that did not report direct effect estimates, we calculated pooled effect estimates using the natural logarithm of the RR and 95 % CI.
Quality assessment
Quality assessment was conducted according to the Newcastle–Ottawa criteria for non-randomized studies( Reference Wells, Shea and O’Connell 42 ), which are based on three broad perspectives: (i) the selection process of study cohorts, (ii) the comparability among different cohorts and (iii) the identification of either the exposure or outcome of study cohorts. Disagreements with respect to the methodological quality were resolved by discussion and mutual consultation.
Statistical analyses
The RR was considered as the common measure of the associations of vegetable and fruit consumption with MetS, and OR and HR were directly converted into RR. The homogeneity of effect size across trials was tested by Q statistics (P<0·05 was considered heterogeneous). The I 2 statistic, which measures the percentage of the total variation across studies due to heterogeneity, was also examined (I 2>50 % was considered heterogeneity). If significant heterogeneity was observed among studies, the random-effects model was used; otherwise, the fixed-effects model was acceptable. Begg’s tests were performed to assess the publication bias( Reference Begg and Mazumdar 43 ). Meta-regression was performed to explore the potentially important covariates that might exert substantial impacts on between-study heterogeneity( Reference Higgins and Thompson 44 ). Subgroup analyses were performed by gender, study design, geographical region, age of the population, diagnostic criteria of MetS, sample size and type of vegetable (only for vegetables). In addition, a sensitivity analysis was also conducted to determine whether an individual study affected the pooled result. All statistical analyses were performed using the statistical software package STATA version 11.0. A P value ≤0·05 was accepted as statistically significant, unless otherwise specified.
Results
Study identification and selection
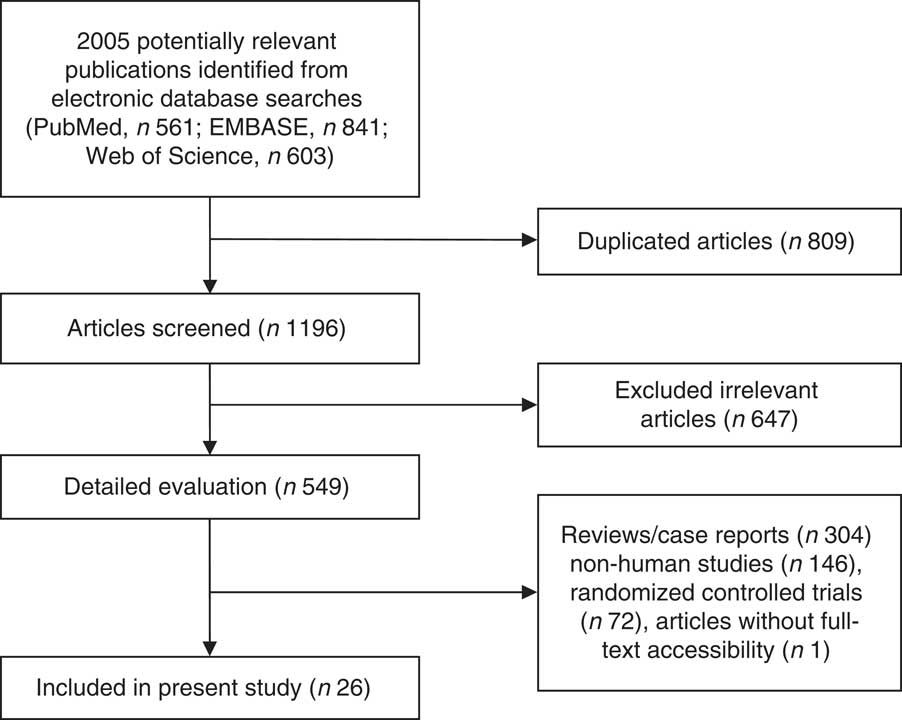
Figure 1 presents the detailed flow diagram of articles included in the present meta-analysis. A total of 2005 potentially relevant articles (PubMed, n 561; EMBASE, n 841; Web of Science, n 603) were retrieved during the initial literature search. After eliminating 809 duplicated articles, 1169 articles were screened by title and abstract, leading to initial exclusion of 647 irrelevant studies. Then, 304 reviews, case reports or letters, 146 non-human studies, seventy-two randomized control trials studies and one articles without full-text accessibility were removed. Eventually, a total of twenty-six observational studies were selected for the current meta-analysis( Reference Lutsey, Steffen and Stevens 7 , Reference Hong and Kim 16 – Reference Chen, Hsiao and Chiu 40 ).
Flowchart for the identification of studies included in the present meta-analysis on associations of vegetable and/or fruit consumption with metabolic syndrome
Study characteristics
Table 1 shows the main characteristics of the included studies. These studies were published between 2007 and 2017, and include twenty cross-sectional, one case–control and five cohort studies. Four of the included studies were performed in European countries (Finland( Reference Kouki, Schwab and Hassinen 25 , Reference Jaaskelainen, Magnussen and Pahkala 37 ), Poland( Reference Kwasniewska, Kaleta and Dziankowska-Zaborszczyk 26 ) and Portugal( Reference Castanho, Marsola and McLellan 21 )), fourteen studies were conducted in Asian countries (Korea( Reference Hong and Kim 16 , Reference Kim, Kwak and Kim 17 , Reference Baik, Lee and Jun 20 , Reference Jung, Han and Song 24 , Reference Shin, Lim and Sung 27 , Reference Park, Ham and Lee 30 , Reference Cho, Kwon and Park 38 ), India( Reference Prasad, Kabir and Dash 22 ), Taiwan( Reference Lin, Chang and Tseng 32 , Reference Chen, Hsiao and Chiu 40 ), Iran( Reference Esmaillzadeh, Kimiagar and Mehrabi 34 , Reference Kelishadi, Gouya and Adeli 39 ), Japan( Reference Masaki 33 ) and China( Reference Wu, Yu and Zhao 29 )), four studies were conducted in the USA( Reference Lutsey, Steffen and Stevens 7 , Reference Fletcher, McNaughton and Lacy 19 , Reference Pan and Pratt 28 , Reference Boucher, Sidebottom and Sillah 31 ) and the other four studies were from Chile( Reference Dussaillant, Echeverría and Villarroel 35 ), Suriname( Reference Krishnadath, Toelsie and Hofman 18 ) and Brazil( Reference de Oliveira, McLellan and Vaz de Arruda Silveira 23 , Reference Neia Martini, Borges and Guedes 36 ). Twenty-three articles included both male and female participants( Reference Lutsey, Steffen and Stevens 7 , Reference Kim, Kwak and Kim 17 – Reference Kwasniewska, Kaleta and Dziankowska-Zaborszczyk 26 , Reference Pan and Pratt 28 – Reference Masaki 33 , Reference Dussaillant, Echeverría and Villarroel 35 – Reference Chen, Hsiao and Chiu 40 ), with three articles including only female or male participants( Reference Hong and Kim 16 , Reference Shin, Lim and Sung 27 , Reference Esmaillzadeh, Kimiagar and Mehrabi 34 ). The sample size ranged from 305 to 27656 for a total number of 115727. The criteria for MetS were those of the National Cholesterol Education Program Adult Treatment Panel III in eighteen articles( Reference Hong and Kim 16 – Reference Krishnadath, Toelsie and Hofman 18 , Reference Castanho, Marsola and McLellan 21 – Reference Kouki, Schwab and Hassinen 25 , Reference Shin, Lim and Sung 27 , Reference Pan and Pratt 28 , Reference Park, Ham and Lee 30 , Reference Lin, Chang and Tseng 32 , Reference Esmaillzadeh, Kimiagar and Mehrabi 34 – Reference Neia Martini, Borges and Guedes 36 , Reference Cho, Kwon and Park 38 – Reference Chen, Hsiao and Chiu 40 ), the International Diabetes Federation in three( Reference Fletcher, McNaughton and Lacy 19 , Reference Baik, Lee and Jun 20 , Reference Masaki 33 ) and the American Heart Association in two studies( Reference Lutsey, Steffen and Stevens 7 , Reference Kwasniewska, Kaleta and Dziankowska-Zaborszczyk 26 ). Moreover, the criteria proposed by Alberti et al. were used in two studies( Reference Wu, Yu and Zhao 29 , Reference Jaaskelainen, Magnussen and Pahkala 37 ). Finally, sixteen( Reference Hong and Kim 16 , Reference Kim, Kwak and Kim 17 , Reference Baik, Lee and Jun 20 , Reference Castanho, Marsola and McLellan 21 , Reference de Oliveira, McLellan and Vaz de Arruda Silveira 23 – Reference Kouki, Schwab and Hassinen 25 , Reference Shin, Lim and Sung 27 , Reference Park, Ham and Lee 30 , Reference Lin, Chang and Tseng 32 , Reference Esmaillzadeh, Kimiagar and Mehrabi 34 , Reference Dussaillant, Echeverría and Villarroel 35 , Reference Jaaskelainen, Magnussen and Pahkala 37 – Reference Chen, Hsiao and Chiu 40 ), sixteen( Reference Hong and Kim 16 , Reference Kim, Kwak and Kim 17 , Reference Baik, Lee and Jun 20 – Reference Jung, Han and Song 24 , Reference Shin, Lim and Sung 27 – Reference Park, Ham and Lee 30 , Reference Masaki 33 , Reference Esmaillzadeh, Kimiagar and Mehrabi 34 , Reference Dussaillant, Echeverría and Villarroel 35 , Reference Jaaskelainen, Magnussen and Pahkala 37 , Reference Kelishadi, Gouya and Adeli 39 ) and eight articles( Reference Lutsey, Steffen and Stevens 7 , Reference Hong and Kim 16 , Reference Krishnadath, Toelsie and Hofman 18 , Reference Fletcher, McNaughton and Lacy 19 , Reference Kwasniewska, Kaleta and Dziankowska-Zaborszczyk 26 , Reference Boucher, Sidebottom and Sillah 31 , Reference Neia Martini, Borges and Guedes 36 , Reference Kelishadi, Gouya and Adeli 39 ) were related to the associations of vegetable, fruit, and vegetable and fruit consumption with MetS, respectively.
Characteristics of the individual studies included in the present meta-analysis on associations of vegetable and/or fruit consumption with metabolic syndrome (MetS)
NOS, Newcastle–Ottawa scale; NA, not applicable; MET, metabolic equivalent of task; ALT, alanine aminotransferase; AST, aspartate aminotransferase; NCEP ATP III, National Cholesterol Education Program–Adult Treatment Panel III; AHA, American Heart Association; IDF, International Diabetes Federation.
Association between vegetable consumption and metabolic syndrome
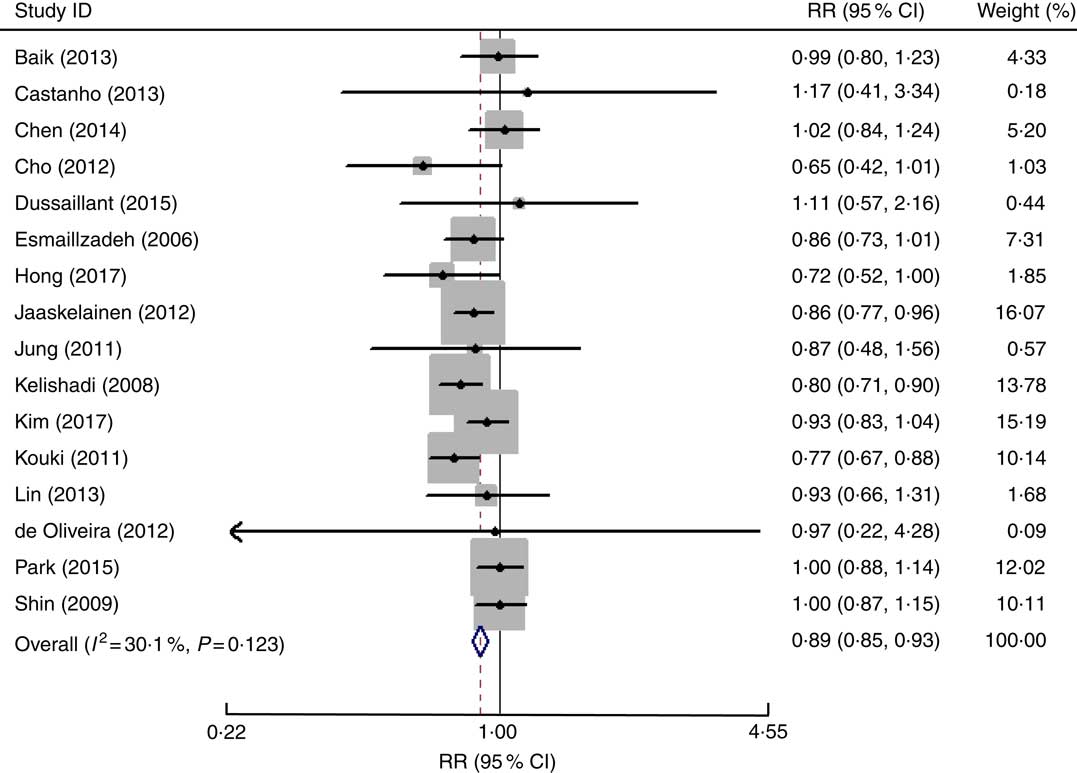
The overall multivariable-adjusted RR evidenced a negative association between vegetable consumption and MetS (RR=0·89, 95 % CI 0·85, 0·93; P<0·001; Fig. 2). No substantial level of heterogeneity was observed among studies (P=0·123, I 2=30·1 %). No evidence of publication bias was observed among the included studies according to the Begg rank-correlation test (P=0·964). The results of subgroup analysis for vegetable consumption are shown in Table 2. No significant relationship between green vegetable consumption and MetS was found according to the overall multivariable-adjusted RR (RR=1·10, 95 % CI 0·98, 1·24; P=0·12). No substantial level of heterogeneity was observed among studies (P=0·47, I 2=0 %). No evidence of publication bias was observed among the included studies according to the Begg rank-correlation test (P=1·000).
Forest plot of the overall multivariable-adjusted relative risk (RR) of metabolic syndrome for the highest v. the lowest category of vegetable consumption. The study-specific RR and 95 % CI are represented by the black diamond and the horizontal line, respectively; the area of the grey square is proportional to the specific-study weight to the overall meta-analysis. The centre of the open diamond and the vertical dashed line represent the pooled RR and the width of the open diamond represents the pooled 95 % CI
Subgroup analyses of vegetable consumption and metabolic syndrome (MetS)
RR, relative risk; NCEP ATP III, National Cholesterol Education Program–Adult Treatment Panel III; IDF, International Diabetes Federation.
Association between fruit consumption and metabolic syndrome
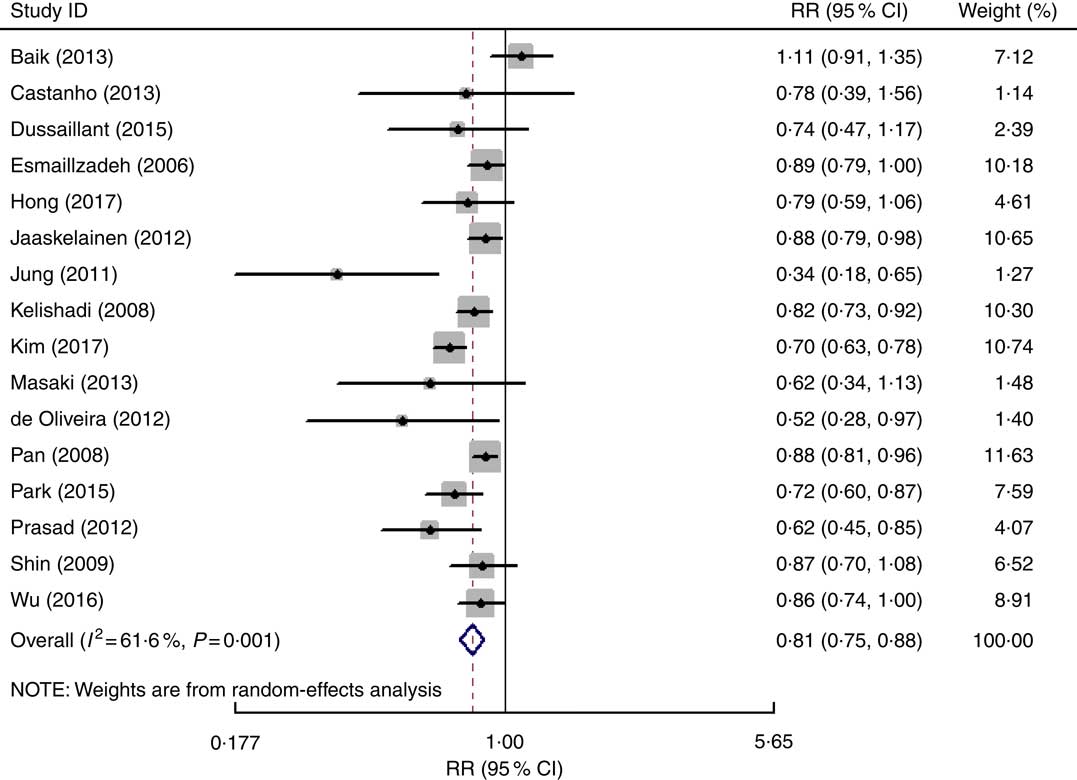
The overall multivariable-adjusted RR showed that fruit consumption was negatively associated with MetS (RR=0·81, 95 % CI 0·75, 0·88; P<0·001; Fig. 3). A substantial level of heterogeneity was observed among studies (P=0·001, I 2=61·6 %). No evidence of publication bias was observed among the included studies according to the Begg rank-correlation test (P=0·079). The results of subgroup analysis for fruit consumption are shown in Table 3.
Forest plot of the overall multivariable-adjusted relative risk (RR) of metabolic syndrome for the highest v. the lowest category of fruit consumption. The study-specific RR and 95 % CI are represented by the black diamond and the horizontal line, respectively; the area of the grey square is proportional to the specific-study weight to the overall meta-analysis. The centre of the open diamond and the vertical dashed line represent the pooled RR and the width of the open diamond represents the pooled 95 % CI
Subgroup analyses of fruit consumption and metabolic syndrome (MetS)
RR, relative risk; NCEP ATP III, National Cholesterol Education Program–Adult Treatment Panel III; IDF, International Diabetes Federation.
Association of vegetable and fruit consumption with metabolic syndrome
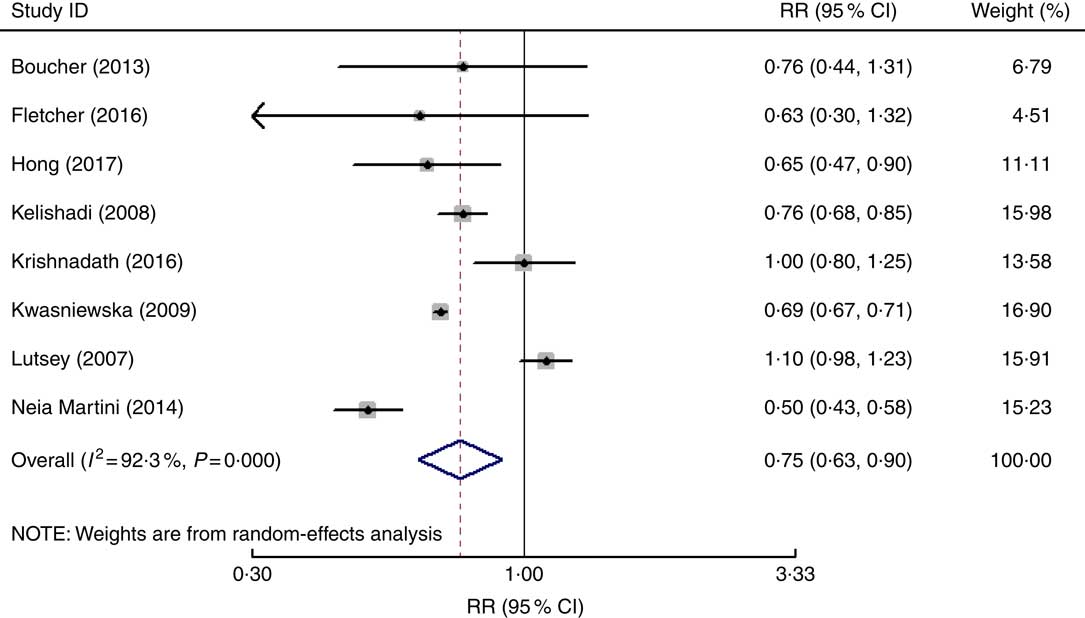
The overall multivariable-adjusted RR showed that vegetable and fruit consumption was negatively associated with MetS (RR=0·75, 95 % CI 0·63, 0·90; P=0·002; Fig. 4). A substantial level of heterogeneity was observed among studies (P<0·001, I 2=92·3 %). No evidence of publication bias was observed among the included studies according to the Begg rank-correlation test (P=0·127). The results of subgroup analysis for vegetable and fruit consumption are shown in Table 4.
Forest plot of the overall multivariable-adjusted relative risk (RR) of metabolic syndrome for the highest v. the lowest category of vegetable and fruit consumption. The study-specific RR and 95 % CI are represented by the black diamond and the horizontal line, respectively; the area of the grey square is proportional to the specific-study weight to the overall meta-analysis. The centre of the open diamond and the vertical dashed line represent the pooled RR and the width of the open diamond represents the pooled 95 % CI
Subgroup analyses of vegetable and fruit consumption and metabolic syndrome (MetS)
RR, relative risk; NCEP ATP III, National Cholesterol Education Program–Adult Treatment Panel III; IDF, International Diabetes Federation; AHA, American Heart Association.
Sensitivity analysis
The results of the sensitivity analysis showed only minimal changes in magnitude of the pooled RR and heterogeneity when any one study was excluded from the meta-analysis, indicating that no individual study had excessive influence on these robust aggregated results (data not shown).
Meta-regression
Low (P=0·123; I 2=30·1 %), moderate (P<0·001; I 2=61·6 %) and high (P<0·001; I 2=92 %) heterogeneity was demonstrated for the associations of vegetable, fruit, and vegetable and fruit consumption with MetS, respectively. To explore the sources of heterogeneity, univariate meta-regression with covariates was performed. For vegetable consumption, the results showed the following: publication year (P=0·289), sample size (P=0·045), gender (P=0·515), age of the population (P=0·195), geographical region (P=0·316), study design (P=0·809), diagnostic criteria of MetS (P=0·872). Only sample size (P=0·045) seemed to contribute to the heterogeneity in this analysis. With regard to fruit consumption, the results showed the following: publication year (P=0·269), sample size (P=0·581), gender (P=0·695), age of the population (P=0·377), geographical region (P=0·871), study design (P=0·068), diagnostic criteria of MetS (P=0·192). None of these covariates was found to contribute to the moderate heterogeneity. In addition, concerning fruit and vegetable consumption, the results showed the following: publication year (P=0·419), sample size (P=0·05), gender (P=0·046), age of the population (P=0·870), geographical region (P=0·857), study design (P=0·152), diagnostic criteria of MetS (P=0·698). Gender (P=0·046) and sample size (P=0·05) seemed to contribute to the high heterogeneity in this analysis.
Discussion
In the present meta-analysis, a total of twenty-six observational studies were included for examination. The pooled analysis showed that vegetable and/or fruit consumption were negatively associated with MetS. However, the consumption of green vegetables might not be associated with MetS.
The underlying mechanism behind the negative associations of vegetable and/or fruit consumption with MetS may be explained as follows. First, as an established biomarker for vegetable and fruit consumption, vitamin C was found to be associated with a lower risk of MetS( Reference Kim and Choi 11 ). Second, fibre, another important substance in vegetables and fruits, was proved to be inversely associated with MetS( Reference Hosseinpour-Niazi, Mirmiran and Sohrab 12 – Reference Hosseinpour Niazi, Mirmiran and Sohrab 14 ). Third, the fat content in vegetables was also reported to be associated with a lower risk of MetS( Reference Um, Oh and Lee 45 ). Finally, as fruits and vegetables are good sources of antioxidants and anti-inflammatory agents, their intake may be beneficial for MetS patients( Reference Qiao 15 , Reference Shin, Kim and Kang 46 ). On the other hand, the Mediterranean diet and the Dietary Approaches to Stop Hypertension (DASH) diet, which are rich in vegetable and fruit consumption, were reported to be negatively associated with either risk or prevalence of MetS( Reference Steffen, Van Horn and Daviglus 47 – Reference Saneei, Fallahi and Barak 52 ). These findings are strongly consistent with the results of the present study. Therefore, it is speculated that vegetable and fruit consumption may exert a positive effect on MetS.
Recently, an earlier meta-analysis including eight randomized controlled trials explored the influence of fruits and vegetables on MetS( Reference Shin, Kim and Kang 46 ). Interestingly, it reported that fruit and vegetable intake was associated only with a reduction in diastolic blood pressure, but not in waist circumference, systolic blood pressure, fasting glucose, HDL cholesterol and TAG levels in MetS patients. However, that meta-analysis only investigated the effect of fruit and vegetable interventions on the components of MetS, with no trial reporting changes in the prevalence of MetS. Therefore, further randomized controlled trials that aim at MetS directly are still needed.
Generally, radish leaf, spinach, cucumber and pepper are regarded as ‘green vegetables’, and cabbage, radish, sprout, carrot, pumpkin and tomato are regarded as ‘white vegetables’( Reference Park, Ham and Lee 30 ). Luo et al. found that the consumption of white vegetables was inversely associated with the risk of colorectal cancer, while green vegetable intake was not( Reference Luo, Fang and Lu 53 ). Therefore, it is speculated that the biological effect of vegetables may vary with variety. This was also the subject that the present study intended to address. However, due to the limited number of included studies (only three), subgroup analysis was only conducted for green vegetables in the present meta-analysis. Surprisingly, the results showed that green vegetable consumption was not associated with MetS. With respect to this obvious difference between the results for vegetables as a whole and for green vegetables, several speculations were raised as follows. First of all, the reliability of the results might be weakened since only three studies related to green vegetables were included for subgroup analysis. Second, white vegetables might have a significant contribution to the anti-MetS effect of vegetables as a whole. Furthermore, the components in green vegetables are complicated, and some neglected substances might work against the effect of vitamin C or fibre. Although some inconsistency in results with regard to gender, study design, diagnostic criteria of MetS and geographical region was found in subgroup analysis (Tables 2–4), it might be due to the high heterogeneity or limited number of included studies. As a consequence, more well-designed studies with detailed specification of vegetable varieties are needed.
The strengths of the present meta-analysis are mainly reflected in the following aspects. First, it is the first meta-analysis of observational studies aiming at the associations of vegetable and/or fruit consumption with MetS based on the most comprehensive literature search to date. Second, the included studies were analysed based on adjusted results and large samples. Third, the present study can serve as a reference and indication for further research (specify the variety of vegetable). Limitations of the present study should also be acknowledged. First, the substantial level of heterogeneity might have distorted the results. Second, due to the limitation of relevant literature, only a limited number of observational studies qualified for the current meta-analysis. Third, the classification of exposure may also vary greatly among individuals. Fourth, the diagnostic criteria of MetS and the selection of adjusted factors were not uniform. Fifth, since only a few studies specified the varieties of vegetable, some issues could not be addressed. Finally, due to the limitation of insufficient data at present, a dose–response analysis could not be performed in the current meta-analysis. These limitations might weaken the significance of the present study.
Conclusions
The existing evidence suggests that vegetable and/or fruit consumption are negatively associated with MetS. However, due to the limited number of included studies, the consumption of green vegetables might not be associated with MetS. More well-designed prospective cohort studies that specify vegetable varieties are needed to elaborate the concerned issues further.
Acknowledgements
Financial support: This work was supported by the China Scholarship Council (student ID: 201706370196) and the Fundamental Research Funds for the Central Universities of Central South University (2017zzts233). The funders had no role in the design, analysis or writing of this article. Conflict of interest: The authors declare that there are no conflicts of interest. Authorship: Y.Z. conceived the idea, performed the statistical analysis and drafted this meta-analysis. Y.Z. and D.Z.Z. selected and retrieved relevant papers. D.Z.Z. assessed each study. D.Z.Z. was the guarantor of the overall content. All authors revised and approved the final manuscript. Ethics of human subject participation: Not applicable.


