


1. Introduction
The ability to control turbulence using active strategies would allow for improving the performance of numerous categories of engineering systems. For example, one could aim to suppress turbulence to achieve a reduction in drag, acoustic noise and vibration, target flow separation to enhance lift, or even amplify turbulence to improve mixing or heat transfer. With such broad possibilities for system improvement, it is no surprise when researchers state that ‘modern turbulence control has applications of epic proportion’ (Brunton & Noack Reference Brunton and Noack2015). Unfortunately, the lack of suitable sensing and actuation strategies paired with the high dimensionality and nonlinearity of turbulent flows make turbulence control in physical systems a massive undertaking which has seen limited progress. In the present work, we seek to increment this progress by considering a previously overlooked actuation strategy for manipulating wall-bounded turbulence. More specifically, we evaluate whether the use of active surface deformations applied locally in the wall-normal direction are appropriate for targeting the largest coherent motions within wall-bounded turbulence.
The discovery of very-large-scale motions (VLSMs) (Kim & Adrian Reference Kim and Adrian1999) within wall-bounded turbulence opened a new avenue for developing control strategies that appears to have great potential for two primary reasons. First, VLSMs have lengths extending from roughly three times the outer length scale  $\delta$ (boundary layer thickness, channel half-height or pipe radius) (Balakumar & Adrian Reference Balakumar and Adrian2007) to more than $20\delta$ (Hutchins & Marusic Reference Hutchins and Marusic2007a), and they have widths and heights of approximately $0.5\delta$ (Dennis & Nickels Reference Dennis and Nickels2011). These characteristics make them the largest coherent motions within wall-bounded flows, and this greatly relaxes the size and frequency requirements when designing an actuator for targeting these motions. Second, VLSMs have been shown to be critical to the dynamics of wall-bounded flows, especially at high Reynolds numbers (Smits, McKeon & Marusic Reference Smits, McKeon and Marusic2011). They carry large amounts of kinetic energy and Reynolds shear stress (Balakumar & Adrian Reference Balakumar and Adrian2007; Lee & Sung Reference Lee and Sung2011), modulate the amplitude and frequency of near-wall motions (Hutchins & Marusic Reference Hutchins and Marusic2007b; Mathis, Hutchins & Marusic Reference Mathis, Hutchins and Marusic2009; Ganapathisubramani et al. Reference Ganapathisubramani, Hutchins, Monty, Chung and Marusic2012), and are responsible for extreme wall-shear events (Hutchins et al. Reference Hutchins, Monty, Ganapathisubramani, Ng and Marusic2011; Pan & Kwon Reference Pan and Kwon2018). As a result, it is likely that manipulating the VLSMs with a targeted control scheme could lead to a reduction of turbulence and therefore also a reduction of drag, acoustic noise and vibration in high-Reynolds-number systems.
Only a few studies to date have sought to target VLSMs with an active control strategy. This is partly because they are a relatively new discovery within the wall-bounded turbulence community, but also because they are a high-Reynolds-number phenomenon and therefore are more difficult to accurately quantify within experiments and simulations. The first explicit attempt at targeting VLSMs with active control appears to be the experiments of Abbassi et al. (Reference Abbassi, Baars, Hutchins and Marusic2017). The VLSMs within a boundary layer were identified in real time using their wall-shear footprints, and wall-normal jets were actuated to either oppose or reinforce the wall-normal components of the high- and low-speed VLSMs, respectively. The strategy allowed for both decreasing and increasing the streamwise turbulence intensity associated with the VLSMs and could produce a drag reduction of a few percent. A different approach was demonstrated by the experiments of Marusic et al. (Reference Marusic, Chandran, Rouhi, Fu, Wine, Holloway, Chung and Smits2021), who used spanwise surface motion to target the VLSMs within a boundary layer. This type of actuation has proved effective for drag reduction when used to target the near-wall motions, but its efficacy and practicality diminish with increasing Reynolds number (Ricco, Skote & Leschziner Reference Ricco, Skote and Leschziner2021). Marusic et al. (Reference Marusic, Chandran, Rouhi, Fu, Wine, Holloway, Chung and Smits2021) showed that it remains a viable drag reduction strategy at high Reynolds numbers if the parameters of the surface motion are set to target the VLSMs instead of the near-wall motions. In contrast to these experimental studies, Oehler & Illingworth (Reference Oehler and Illingworth2021) applied linear control to target VLSMs in a channel flow simulated using the linearized Navier–Stokes equations. Their work suggests that actuator and sensor arrays each in a single plane (i.e. realistic hardware arrangements) are sufficient for targeting the VLSMs using linear control schemes. This result is promising because it indicates that the VLSMs might be amenable to the tools of modern control theory, although we must keep in mind that a linearized set of governing equations was employed in their investigation. Finally, Jacobi & McKeon (Reference Jacobi and McKeon2017) used dynamic roughness to generate synthetic VLSMs for the purpose of exploring the phase relationships between the very-large and small scales. While they did not implement a targeted control scheme, it is possible that such synthetic VLSMs could be used to target the naturally occurring VLSMs or even offset their influence on the flow.
The work described above reveals that targeting VLSMs has potential for flow control purposes, but there is still much work to be done on the topic. As mentioned in the first paragraph, the present investigation seeks to evaluate whether a previously overlooked actuation strategy is a good option for this control goal. Instead of jets (Abbassi et al. Reference Abbassi, Baars, Hutchins and Marusic2017), spanwise surface motion (Marusic et al. Reference Marusic, Chandran, Rouhi, Fu, Wine, Holloway, Chung and Smits2021), body forces (Oehler & Illingworth Reference Oehler and Illingworth2021) or dynamic roughness (Jacobi & McKeon Reference Jacobi and McKeon2017), we would like to investigate whether it is feasible to target VLSMs using local surface deformations applied actively in the wall-normal direction. This actuation strategy was primarily motivated by the results of two previous studies, both of which suggest that the strategy may be viable. First, the earlier work of Carlson & Lumley (Reference Carlson and Lumley1996) showed that one type of wall-normal surface deformation, a ‘Gaussian bump’, could be used to target streaky structures in wall-bounded flows. They found that raising the Gaussian deformation below a high-speed streak pushes the high-speed fluid away from the wall which, in turn, allows the adjacent low-speed region to expand, resulting in a lower shear stress at the wall. Conversely, raising the deformation below a low-speed streak resulted in the expansion of the adjacent high-speed region and an increase in shear stress at the wall. These results reveal a possible mechanism for targeting streaky structures such as VLSMs using active surface deformations. The second motivating study is that of Luhar, Sharma & McKeon (Reference Luhar, Sharma and McKeon2015), who used a resolvent analysis to evaluate the potential of pressure-driven compliant surfaces for controlling wall-bounded turbulence. They found that these passive surfaces can be optimized to effectively suppress modes resembling VLSMs, but that such a surface also produces effects elsewhere in spectral space that are detrimental to the control goal. A passive compliant surface may therefore not be the best option for targeting VLSMs. However, their investigation suggests that a surface that relies on deliberate actuation to produce local wall-normal deformations may be capable of targeting VLSMs without being accompanied by detrimental side effects.
The use of wall-normal surface deformations for flow control has received little attention when compared with more popular options such as fluidic actuation (Gutmark & Grinstein Reference Gutmark and Grinstein1999; Glezer & Amitay Reference Glezer and Amitay2002; Cattafesta & Sheplak Reference Cattafesta and Sheplak2011; Raghu Reference Raghu2013) and plasma actuation (Corke, Enloe & Wilkinson Reference Corke, Enloe and Wilkinson2010; Cattafesta & Sheplak Reference Cattafesta and Sheplak2011; Wang et al. Reference Wang, Choi, Feng, Jukes and Whalley2013; Kriegseis, Simon & Grundmann Reference Kriegseis, Simon and Grundmann2016). The available literature on the topic is quite sparse as a result. A collection of numerical studies have considered controlling wall-bounded turbulence using wall-normal surface deformations that react to local variables. The investigations of Endo, Kasagi & Suzuki (Reference Endo, Kasagi and Suzuki2000) and Kang & Choi (Reference Kang and Choi2000) considered control schemes that allowed for each element of the surface to deform independently. Both investigations achieved drag reduction, but the resulting surface deformations were highly complex and therefore impractical for application in physical systems. This is why Endo et al. (Reference Endo, Kasagi and Suzuki2000) extended their analysis to consider a more realistic array of active surface deformations that were elongated in the streamwise direction and responded to information from upstream shear sensors. This strategy was designed to act on the near-wall streaks and vortices and could achieve a net positive energy saving. Pamiès et al. (Reference Pamiès, Garnier, Merlen and Sagaut2011) also considered an array of active surface deformations that were somewhat elongated in the streamwise direction. The deformations were actuated according to opposition control such that the surface velocity was used to oppose the wall-normal velocity above. However, this strategy was not as successful at producing drag reduction, suggesting that the details of such a strategy are important to its success. Similarly, Zhang et al. (Reference Zhang, Huang, Xu and Cui2016) and Ge, Fang & Liu (Reference Ge, Fang and Liu2017) considered control strategies involving active surface deformations with pimple and dimple geometries that reacted to local variables. Some weaker drag reduction was reported, but overall these strategies appear to be less effective than that of Endo et al. (Reference Endo, Kasagi and Suzuki2000).
The reactive nature of the control strategies discussed above make it difficult to systematically study the effects of actuation as a function of actuator inputs such as the frequency (velocity), amplitude and geometry of the deformations. The effects of these parameters are more appropriately studied using periodic surface deformations applied locally using simple geometries. The available studies of simpler surface deformations have shown that circular and rectangular deformations can be used to generate high- and low-speed streamwise velocity fluctuations as well as streamwise vortices in both laminar (LBLs) and turbulent boundary layers (TBLs) (Breuer, Haritonidis & Landahl Reference Breuer, Haritonidis and Landahl1989; Hofmann & Herbert Reference Hofmann and Herbert1997; Kim et al. Reference Kim, Jeon, Park and Choi2003; Dearing, Lambert & Morrison Reference Dearing, Lambert and Morrison2007; Goldin et al. Reference Goldin, King, Pätzold, Nitsche, Haller and Woias2013; Amitay, Tuna & Dell'Orso Reference Amitay, Tuna and Dell'Orso2016). These results suggest that simple surface deformations could potentially be used to target the coherent structures present within wall-bounded flows. For example, both Goldin et al. (Reference Goldin, King, Pätzold, Nitsche, Haller and Woias2013) and Amitay et al. (Reference Amitay, Tuna and Dell'Orso2016) employed active surface deformations for the targeted suppression of Tollmien–Schlichting waves within LBLs. However, each of the above studies was relatively brief and together they leave many open questions regarding how the frequency, amplitude and geometry of a local surface deformation affect the motions that are produced and the roles that the boundary layer properties play.
More recently, Gibeau & Ghaemi (Reference Gibeau and Ghaemi2022) investigated how circular surface deformations applied sinusoidally over a range of amplitudes and frequencies affect an LBL at a Reynolds number (computed using the displacement thickness) of 340. They found that some actuation frequencies produced what the authors referred to as type-1 modes, which consist of streamwise velocity fluctuations with single extrema concentrated along the centreline of the actuator. Other frequencies produced type-2 modes, which consist of patterns featuring double extrema displaced in the spanwise directions from the actuator centreline. Interestingly, several transitions between types 1 and 2 occur as the actuation frequency is increased. Their work also showed that increasing the actuation amplitude acted primarily to increase the intensity of the motions produced by the active surface. A key conclusion from the work of Gibeau & Ghaemi (Reference Gibeau and Ghaemi2022) was that the lower actuation frequencies appeared to be more well suited for flow control. Here, ‘lower’ refers to  $St\leq 0.2$, where $St=f_{a}D/U_\infty$ is the Strouhal number computed using the actuation frequency, actuator diameter and free stream velocity. The authors reached this conclusion because actuation at $St\leq 0.2$ produced streamwise velocity fluctuations that were stronger and more stable.
The above conclusion is promising for the present investigation because the VLSMs occupy the lowest frequencies of the turbulence spectrum. However, it is not clear how well the results of Gibeau & Ghaemi (Reference Gibeau and Ghaemi2022) obtained using an LBL will translate to a TBL at a much higher Reynolds number. The primary objective of the present investigation is therefore to evaluate the impact of active surface deformations applied locally beneath a TBL at a sufficient Reynolds number to determine whether this particular actuation strategy remains viable for targeting the VLSMs in future experiments. We employ the same ‘active surface’ used by Gibeau & Ghaemi (Reference Gibeau and Ghaemi2022). This actuator was originally designed to have the dimensions and frequency response necessary to target the VLSMs that are present in the TBL at a friction Reynolds number  $Re_\tau =2600$ that was previously studied by the same authors (Gibeau & Ghaemi Reference Gibeau and Ghaemi2021). We reproduce this TBL and operate the active surface to generate sinusoidal surface deformations at frequencies of $St\leq 0.2$, which also covers the range of frequencies occupied by the VLSMs. High-speed particle image velocimetry (PIV) is used to capture the velocity field, and a phase averaging technique allows for extracting the periodic motions produced by the active surface. We then focus on the characteristics of these periodic motions and the impact that they have on the surrounding turbulence, with the latter being accomplished using a triple decomposition.
2. Experimental set-up
The experiments were conducted within the two-story, closed-loop wind tunnel facility at the University of Alberta. The main test section has dimensions of  $2.4\,{\rm m}\times 1.2\,{\rm m}\times 11\,{\rm m}$ ( $W{\times }H{\times }L$) and can achieve free stream velocities of up to 35 m s $^{-1}$. The free stream turbulence intensity is less than 0.5 % for velocities greater than 5 m s $^{-1}$ (Gibeau & Ghaemi Reference Gibeau and Ghaemi2020) and the mean velocity remains uniform within $\sim$1 % across the span (Johnson & Kostiuk Reference Johnson and Kostiuk2000; Gibeau, Gingras & Ghaemi Reference Gibeau, Gingras and Ghaemi2020). The TBL that develops along the flat bottom wall of the test section at a free stream velocity of 11.8 m s $^{-1}$ was actuated using the active surface while high-speed PIV was used to measure the downstream flow. The actuation system was installed flush to the bottom wall of the test section such that the active surface was located 7.6 m downstream from a boundary layer tripping device. All gaps in the test section wall between the tripping device and active surface were filled to ensure a smooth surface for the development of the boundary layer. A Cartesian coordinate system originating at the centre of the undeformed active surface is used for the following analyses, where $x$,
$x$,  $y$ and $z$ refer to the streamwise, wall-normal and spanwise directions, respectively. The associated velocity components are $U$,
$U$,  $V$ and $W$ with fluctuating components $u$,
$u$,  $v$ and $w$. The height of the active surface deformation in the wall-normal direction is denoted as $h$.
$h$.
2.1. Active surface design
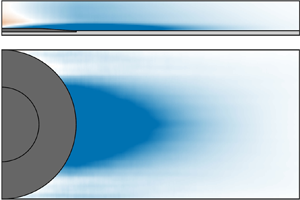
The active surface employed here is the same one used by Gibeau & Ghaemi (Reference Gibeau and Ghaemi2022) and is shown schematically in figure 1(a). The device is circular and was designed as an insert that can be fastened flush to various boundary layer surfaces. The part of the active surface that is exposed to the flow is a smooth silicone rubber disk (1.52 mm thickness, 50A Shore hardness) that can be deformed in the wall-normal direction using a linear actuator. The portion of the disk that is free to deform has a diameter of  $D=100$ mm, while the portion of the disk beyond this diameter has been adhered to the body of the insert. The rubber disk is driven from below by a smaller rigid disk with a diameter of $D/2$; this smaller diameter sets the area of the surface deformation that experiences the maximum displacement and was selected to match the width of the VLSMs within the present TBL. The small rigid disk is attached to the silicone rubber disk using an adhesive and to the linear actuator using threads. The position of the linear actuator is set using levelling posts to ensure the active surface remains undeformed when the actuator displacement is set to its neutral position. Shims were used to ensure the active surface insert is flush with the wind tunnel floor, and polymer clay was used to fill in the gaps around the insert to achieve a smooth surface for the TBL. The origin of the coordinate system is shown relative to the active surface in figure 1(a).
(a) Cross-sectional schematic of the active surface assembly and (b) measured profiles of the deformed surface at displacements of  $h={\pm }0.5$ mm, ${\pm }1.0$ mm, ${\pm }1.5$ mm, ${\pm }2.0$ mm and ${\pm }2.5$ mm. In panel (b), the dotted lines are the same profiles flipped about $x=0$ to highlight the symmetry of the deformations. The vertical axis has also been stretched by a factor of four to better show the profiles.

A linear voice coil actuator (BEI Kimco LAS16-23-000A-P01-4E) with a built-in position sensor was used to actuate the rubber disk. According to the manufacturer data sheet, the actuator is capable of operating at frequencies up to 117 Hz (sinusoidal) and displacements up to  $\pm$3.04 mm, which are large enough to penetrate into the logarithmic layer of the present TBL. The actuator was powered using an external supply and was controlled using a servo drive programmed through Ingenia MotionLab software. Simulink Real-Time was used to interface with the servo drive via a Speedgoat target machine equipped with a 16 bit input/output module (model IO135), which allowed for reading the current position of the actuator and setting the desired position. The gains of the servo drive control loop were tuned manually to optimize tracking of the actuator input signal. The measured position of the actuator was typically within a few percent of the desired value during periodic actuation.
The geometry of the active surface deformation has been measured with the same camera model used for PIV (see § 2.2) by imaging the surface deformations from the side. Since the deformations are axisymmetric, measurements in a plane bisecting the active surface are sufficient for characterizing the shape of the whole deformed surface. A thin silver line was drawn through the centre of the active surface and was imaged for static surface deformations ranging from  $h={\pm }0.5$ mm to ${\pm }2.5$ mm. This line remained visible for downward deformations because of the large aperture of the lens. An edge detection method was then used to extract the surface profiles which are presented in figure 1(b). These profiles show good symmetry across the $x=0$ plane and reveal slight differences between upward ( $h>0$) and downward ( $h<0$) deformations.
2.2. Particle image velocimetry
Three high-speed PIV experiments were used to measure the flow downstream from the active surface as is shown schematically in figure 2. The same laser (Photonics Industries DM20-527-DH) and camera(s) (Phantom v611) were used for all experiments. The high-speed laser features two separate cavities, each capable of 20 mJ per pulse at 1 kHz. The high-speed camera features a  $1280\times 800$ pixel complementary metal-oxide semiconductor sensor with a $20\,\mathrm {\mu }{\rm m}\times 20\,\mathrm {\mu }{\rm m}$ pixel size and 12 bit resolution. A fog generator was used to seed the wind tunnel with ${\sim }1\,\mathrm {\mu }{\rm m}$ particles for each experiment, and DaVis 8.4 software (LaVision GmbH) was used to process the resulting PIV images. The same Simulink Real-Time system used to operate the active surface was also used to record the trigger signals of the PIV system during all experiments. This allowed for synchronizing the active surface displacement signal with the PIV measurements.
Schematic of the experimental setup showing the active surface and fields of view used for PIV. Planar PIV was conducted within FOV1 and FOV2; stereoscopic PIV was conducted within FOV3.

The fields of view denoted as FOV1 and FOV2 in figure 2 were used to capture the velocity field in the streamwise–wall-normal ( $x$–
$x$– $y$) plane along the centreline of the active surface ( $z=0$) using planar PIV. The high-speed cameras have limited onboard memory, and so these fields of view were cropped to be tall and narrow to capture longer sequences of images for the purpose of statistical convergence. This allowed for extracting high-speed measurements across the entire boundary layer thickness at locations of $x/D=0.7$ and 1.4. A 200 mm lens with an aperture setting of $f/5.6$ was used for imaging, resulting in field of view dimensions of ( ${\Delta }x,{\Delta }y)=13\,{\rm mm}\times 114\,{\rm mm}$ ( $0.14\delta \times 1.2\delta$), a resolution of $93.4\,\mathrm {\mu }{\rm m}\,{\rm pixel}^{-1}$ ( $2.5\lambda \,{\rm pixel}^{-1}$, where $\lambda$ is the viscous length scale) and a particle image diameter of $\sim$0.4 pixels. Since the particle image diameter is less than 1, the images were slightly defocused to avoid peak locking. Illumination for the measurements was provided by a 1 mm-thick ( $27\lambda$) laser sheet formed by a series of spherical and cylindrical lenses. Sets of 15 000 image pairs ( ${\Delta }t=120\,\mathrm {\mu }$s) were recorded at 1 kHz ( $8.0U_\infty /\delta$, $0.08U_\tau /\lambda$, where $U_\tau$ is the friction velocity) within both fields of view (asynchronously). Four sets were recorded when capturing the base flow (no actuation), resulting in 60 000 measurement instances over a total sampling time of 60 s ( $7.5\times 10^3\delta /U_\infty$). Twelve sets were recorded for each actuation case to improve the convergence of the phase-averaged statistics, resulting in 180 000 measurement instances over a total sampling time of 180 s ( $2.25\times 10^4\delta /U_\infty$). All images were preprocessed by subtracting the minimum of the respective ensemble to reduce background noise followed by dividing the images by the background-subtracted ensemble average to normalize the intensity counts. A multi-pass cross-correlation algorithm was used to compute the vector fields from the PIV images, beginning with a $128\times 128$ pixel interrogation window. The final pass employed $32\times 32$ pixel Gaussian-weighted interrogation windows with 75 % overlap, resulting in a grid resolution of 0.75 mm vector $^{-1}$.
The stereoscopic field of view denoted as FOV3 in figure 2 was used to capture the velocity field in the spanwise–wall-normal ( $z$–
$z$– $y$) plane at $x/D=0.7$. Two cameras featuring Scheimpflug mounts and 200 mm lenses with aperture settings of $f/16$ were placed at $45^\circ$ to the imaging plane and were arranged in a forward-scattering orientation with respect to the 2 mm-thick ( $54\lambda$) laser sheet used to illuminate the field of view. FOV3 captured an area of $({\Delta }z,{\Delta }y)=120\,{\rm mm}\times 31\,{\rm mm}$ ( $1.3\delta \times 0.33\delta$) and had an effective resolution of 70.5 $\mathrm {\mu }$m pixel $^{-1}$ ( $1.9\lambda$ pixel $^{-1}$), resulting in a particle image diameter of $\sim$1.3 pixels. The calibration processes included a three-dimensional target calibration followed by a self-calibration using a set of particle images (Wieneke Reference Wieneke2005). Sets of 4000 image pairs ( ${\Delta }t=60\,\mathrm {\mu }$s) were collected at a frequency of 250 Hz ( $2.0U_\infty /\delta$, $0.02U_\tau /\lambda$). Four sets were recorded for the base flow, resulting in 16 000 measurement instances over 64 s ( $8.0\times 10^3\delta /U_\infty$). Eight sets were recorded for each actuation case to improve the convergence of the phase averages, resulting in 32 000 measurement instances over 128 s ( $16.0\times 10^3\delta /U_\infty$). The same preprocessing steps that were applied to the planar PIV images were also applied to the stereoscopic PIV images. A multi-pass stereoscopic cross-correlation algorithm was then used to compute the vector fields, beginning with a $128\times 128$ pixel interrogation window. The final pass employed $48\times 48$ pixel Gaussian-weighted interrogation windows with 75 % overlap, resulting in a grid resolution of 0.85 mm vector $^{-1}$.
2.3. Base flow
Here we present the statistical characteristics of the TBL used to investigate the active surface. This is to place the present TBL in the context of the existing literature, to provide the various parameters used for data normalization and to confirm that we have reproduced the same TBL for which the active surface was designed, i.e. that of Gibeau & Ghaemi (Reference Gibeau and Ghaemi2021). The basic fluid properties and boundary layer parameters computed from FOV1 at  $x/D=0.7$ are presented in table 1. The friction Reynolds number ( $Re_\tau$), free stream velocity ( $U_\infty$), boundary layer thickness ( $\delta$) and viscous length scale ( $\lambda$) are all within 1 % of what was presented by Gibeau & Ghaemi (Reference Gibeau and Ghaemi2021), confirming that the basic boundary layer parameters are in good agreement with those of the target TBL.
Fluid properties and boundary layer parameters at  $x/D=0.7$. The viscous length scale was determined using the Clauser method with $\kappa = 0.41$ and $B = 5.0$. The boundary layer thickness is defined here as the wall-normal location at which $\langle U \rangle = 0.995U_\infty$, where $\langle \cdots \rangle$ denotes an ensemble average.

The mean velocity and Reynolds stresses computed from each field of view and compared with the data of Gibeau & Ghaemi (Reference Gibeau and Ghaemi2021) are presented in figure 3, where the use of  $\langle \cdots \rangle$ denotes an ensemble average. The mean velocity profiles in figure 3(a) agree well with one another with the exception of the points nearest to the wall from FOV3. The small deviations observed can likely be attributed to reflections at the wall within the PIV images and the uncertainties associated with the stereoscopic calibration process. The logarithmic law of the wall with $\kappa =0.41$ and $B=5.0$ is also shown in the figure, which confirms the expected behaviour of the profile and indicates that the logarithmic region extends to roughly $y/\lambda =400$ in the wall-normal direction. The Reynolds stresses presented in figure 3(b) reveal a similar story: excellent agreement between the data from FOV1, FOV2 and Gibeau & Ghaemi (Reference Gibeau and Ghaemi2021), and some deviations observed for the data from FOV3 (note the interrogation window sizes of roughly 81 $\lambda$ and 92 $\lambda$, respectively, for FOV1/FOV2 and FOV3). These deviations are mostly observed for $\langle u^2 \rangle$, which makes sense considering that the streamwise component of the stereoscopic measurements is the out-of-plane component and therefore contains the largest measurement uncertainty. However, the data from FOV3 are used qualitatively in the present work and therefore these small statistical discrepancies do not pose an issue for our investigation. Overall, figure 3 reveals that the mean velocity and Reynolds stresses of the present TBL agree well with those of Gibeau & Ghaemi (Reference Gibeau and Ghaemi2021).
(a) Mean velocity profiles and (b) Reynolds stresses from all three PIV fields of view and comparison with the data of Gibeau & Ghaemi (Reference Gibeau and Ghaemi2021). The uncertainties of these quantities are estimated in the Appendix.

Finally, figure 4 shows the pre-multiplied spectra of  $u$ computed at $x/D=0.7$, where $\varPhi _u$ is the power spectral density of $u$,
$u$,  $k_x=2{{\rm \pi} }f/\langle U \rangle$ is the streamwise wavenumber and $\varLambda _x=\langle U \rangle /f$ is the streamwise wavelength. The blue lines in the figure represent the actuation frequencies which will be discussed in § 2.4. The pre-multiplied spectra are shown here to highlight the expected behaviour of the TBL that has been documented in a previous work at the same Reynolds number (Hutchins & Marusic Reference Hutchins and Marusic2007a): a high-energy ‘inner site’ near the wall at $y/\lambda \approx 15$ (not entirely captured by the present measurements) and $\varLambda _x/\lambda \approx 1000$ ( $\varLambda _x/\delta \approx 0.4$) as well as a high-energy ‘outer site’ in the logarithmic region near $\varLambda _x/\delta \approx 6$ (marked using the white oval in figure 4). The inner site is attributable to the near-wall cycle that produces the large peak in $\langle u^2 \rangle$, while the outer site is attributable to the VLSMs. The presence of the outer site in figure 4 therefore confirms that VLSMs occupy the present TBL.
Pre-multiplied spectra of the streamwise velocity fluctuation computed using the data from FOV1 ( $x/D=0.7$). The streamwise wavenumbers and wavelengths of $u$ were computed as $k_x=2{{\rm \pi} }f/\langle U \rangle$ and $\varLambda _x=\langle U \rangle /f$, respectively. The blue lines represent the four actuation frequencies of $St=0.05$, 0.10, 0.15 and 0.20 considered in the present investigation, where $St=f_{a}D/U_\infty$ and $f_{a}$ is the actuation frequency. The wavelength ranges of the LSMs (1– $3\delta$) and the VLSMs ( $>3\delta$) are also shown, as is the approximate location of the outer site (white oval).

2.4. Actuation cases
We consider periodic operation of the active surface to determine how actuation affects the present TBL as a function of frequency. The active surface was operated using the signal
 \begin{equation} h_r(t) = A\sin(2{\rm \pi}f_{a}t), \end{equation}
where  $A$ is the actuation amplitude, $f_{a}$ is the actuation frequency, $t$ is time and $h_r$ is the reference signal in millimetres to be tracked by the actuator. We consider a constant actuation amplitude of $A=2.7$ mm ( $=73\lambda$, $0.03\delta$) and four actuation frequencies of $f_{a}=6$, 12, 18 and 24 Hz, which correspond to Strouhal numbers of $St=f_{a}D/U_\infty =0.05$, 0.10, 0.15 and 0.20, therefore covering the range of normalized frequencies deemed suitable for flow control by Gibeau & Ghaemi (Reference Gibeau and Ghaemi2022). These four $St$ are laid over the pre-multiplied spectra in figure 4, revealing that $St=0.10$ coincides with the centre of the outer site associated with the VLSMs. Moreover, Gibeau & Ghaemi (Reference Gibeau and Ghaemi2021) showed that the VLSMs exist at frequencies up to roughly 18 Hz in the present TBL, which coincides with actuation at $St=0.15$. We can therefore say that $St=0.05$ and 0.10 represent actuation within the frequency range of the VLSMs, $St=0.20$ represents actuation within the range of the large-scale motions (LSMs) which are 1– $3\delta$ in length, and $St=0.15$ represents actuation at the transition between LSMs and VLSMs.
2.5. Phase averaging and triple decomposition
A phase averaging technique has been used to extract the average motions produced by the active surface and to determine how the Reynolds stresses vary across the actuation cycles. The phase of the active surface  $\phi$ was computed from the measurements of $h$ using a Hilbert transform as
 \begin{equation} \phi = \angle({-}i\mathcal{H}(h)) + {\rm \pi}, \end{equation}
where  $\mathcal {H}(h)$ denotes the Hilbert transform of the active surface displacement. The manipulations with $i$ and ${\rm \pi}$ were used to shift the phase such that one full cycle extends from $\phi =0$ to $2{\rm \pi}$ with $\phi =0$ representing the active surface at $h=0$ with a velocity in the positive wall-normal direction. The velocity measurements were averaged using two different protocols depending on for what the result would be used. When computing phase averages for a quantitative analysis, the velocity fields were averaged using phase bins with widths of $0.1{\rm \pi}$ and 80 % overlap, resulting in 100 bins with 9000 measurement instances per bin for FOV1 and FOV2. When computing phase averages for a qualitative analysis, the velocity fields were averaged using phase bins with widths of $0.4{\rm \pi}$ and 99.5 % overlap, resulting in 1000 bins with 36 000 measurement instances per bin for FOV1/FOV2 and 6400 measurement instances per bin for FOV3. The latter protocol produced smoother results for visualizations. However, the wider bins reduce the peak values of the phase averages which is why a different phase averaging protocol was used for quantitative analyses.
Following computation of the phase averages, a triple decomposition (Hussain & Reynolds Reference Hussain and Reynolds1970) was conducted as
 \begin{equation} U_i = \langle U_i \rangle + \langle u_i \rangle_\phi + u'_i, \end{equation}
where the subscript  $i$ (
$i$ ( $=1$, 2, 3) denotes the three components of the Cartesian coordinate system, $\langle U_i \rangle$ is the mean velocity, $\langle u_i \rangle _\phi$ is the phase-averaged velocity fluctuation due to active surface deformation and $u'_i$ is what remains of the turbulent fluctuations. This decomposition allows for studying the motions produced by actuation using $\langle u_i \rangle _\phi$ and studying the impact that these motions have on the surrounding turbulence using $u'_i$. The latter component was computed as $u'_i(t) = u_i(t) - \langle u_i \rangle _\phi (t)$, where $\langle u_i \rangle _\phi (t)$ was interpolated from $\langle u_i \rangle _\phi$ using $\phi (t)$.
3. Periodic motions produced by actuation
This section focuses on characterizing the periodic motions produced by the active surface. We consider the spatial structure, advection velocity and strength of the motions, and we investigate normalizing the results to compare between the present TBL and the LBL of Gibeau & Ghaemi (Reference Gibeau and Ghaemi2022). We then use what we have learned to create visualizations that show what the motions produced by the active surface are likely to look like in three-dimensional space. Note that the active surface diameter  $D$ is used as a length scale for normalization of the spatial domain. This is done to retain the length scale used by the present definition of the Strouhal number and to show our results relative to the dimensions of the active surface. However, $D$ is only 6 % larger than $\delta$ in the present TBL, and so $D$ can be thought of as a proxy for $\delta$ when interpreting the normalized results.
3.1. Phase averages
We begin by considering the raw phase averages since they form the core of the analyses performed in this section. Phase averages of the fluctuating streamwise velocity ( $\langle u \rangle _\phi$) in the $\phi$– $y$ plane computed using the data from FOV1 and FOV2 are presented in figure 5. The left (figure 5a–d) and right (figure 5e–h) columns in the figure contain the phase averages at $x/D=0.7$ and 1.4, respectively, for all actuation frequencies. The phase axis (or time axis) has been flipped in all cases to display the motions as if they were moving from left to right to facilitate visualization in a manner similar to that of Taylor's hypothesis. The solid and dashed lines are outlines of the high- and low-speed motions, respectively, while the dotted lines show the constant amplitude of the active surface deformations.
Phase averages of the streamwise velocity component ( $\langle u \rangle _\phi$) in the $\phi$– $y$ plane for all actuation frequencies computed using (a–d) the data from FOV1 at $x/D=0.7$ and (e–h) the data from FOV2 at $x/D=1.4$. The phase axis has been flipped to display the motions as if they were moving from left to right. The solid and dashed lines represent positive and negative values of (a–d) $\langle u \rangle _\phi /U_\infty =\pm 0.02$ and (e–h) $\langle u \rangle _\phi /U_\infty =\pm 0.005$. The dotted lines show the constant amplitude of the active surface deformations. The uncertainty of these phase averages is estimated in the Appendix. (a,e) $St = 0.05$, (b,f) $St = 0.10$, (c,g) $St = 0.15$, (d,h) $St = 0.20$.

The phase averages in the  $\phi$– $y$ plane at $x/D=0.7$ (figure 5a–d) are shown with the overlaid outlines representing $\langle u \rangle _\phi /U_\infty =\pm 0.02$, which is roughly 40 % of the peak strength. The strongest fluctuations are contained within these outlines, but some weaker influence on the boundary layer can be seen to extend well beyond the end of the logarithmic layer ( $y/\lambda \approx 400$). In all cases, the phase averages reveal high- and low-speed structures, with the latter occurring mostly within the first half of the phase cycle ( $0<\phi <{\rm \pi}$). FOV1 is located just downstream from the edge of the active surface, and the phase cycle begins with an upward motion. It therefore appears that the low-speed motions form from upward surface deformations and the high-speed motions form from downward surface deformations. This is consistent with the results of past investigations (Kim et al. Reference Kim, Jeon, Park and Choi2003; Gibeau & Ghaemi Reference Gibeau and Ghaemi2022). It is also evident that the magnitudes of the high- and low-speed motions are similar to one another, and that these magnitudes do not change much as $St$ is increased. Instead, we see a change in the shape of the motions that are produced. At $St=0.05$ and 0.10 (figure 5a,b), the motions are relatively flat (i.e. they have negligible inclination) and extend to $y/D\approx 0.05$ ( $y/\lambda \approx 150$) in the wall-normal direction according to the solid and dashed outlines, which is roughly twice that of the surface deformation amplitude (dotted line). When the actuation frequency is increased to $St=0.15$ (figure 5c), the motions begin to lift up at their fronts to form an inclined structure, with the low-speed motion lifting up more than the high-speed motion. This occurs to an even larger extent for $St=0.20$ (figure 5d), which produces a low-speed motion that extends to $y/D\approx 0.09$ ( $y/\lambda \approx 250$) according to the dashed outline in figure 5(d). It is worth noting that the flat motions are produced at $St=0.05$ and 0.10, which correspond to frequencies associated with the VLSMs in the present TBL as was discussed in § 2.4. Similarly, the most inclined motion is produced at $St=0.20$, which corresponds to the frequency range of the LSMs.
The phase averages in the  $\phi$– $y$ plane at $x/D=1.4$ (figure 5e–h) represent the same motions discussed above after they have advected $0.7D$ downstream; this advection produces a phase shift between the motions at $x/D=0.7$ and 1.4 which is visible in the figure. The motions at $x/D=1.4$ are now roughly five times weaker than they were at $x/D=0.7$ and are therefore shown with the overlaid outlines at $\langle u \rangle _\phi /U_\infty =\pm 0.005$. This allows for a fairer comparison of the shapes of the phase averages between $x/D=0.7$ and 1.4 as represented by these outlines. In addition to becoming weaker, the motions produced at $St=0.05$ (figure 5e) have lifted away from the wall and increased in height to reach $y/D\approx 0.09$ ( $y/\lambda \approx 250$). The high-speed motion (solid outline) remains relatively flat while the low-speed motion (dashed outline) appears to now have some inclination. Similar changes are observed for the motions produced at $St=0.10$ (figure 5f), but with the low-speed motion appearing as a thinner wall-attached structure. At $St=0.15$ and 0.20 (figure 5g,h), the stronger inclination is once again evident for both the high- and low-speed motions. The motions produced at $St=0.20$ in particular are quite organized, inclined and relatively large, extending up to the end of the logarithmic region at $y/D\approx 0.14$ ( $y/\lambda \approx 390$). Overall, the motions produced by the active surface appear to reduce in strength and diffuse away from the wall as they advect downstream.
The same phase averages at  $x/D=0.7$ from figure 5(a–d) have been computed at $y/D=0.02$ in the $\phi$– $z$ plane using the data from FOV3 and are shown in figure 6 to reveal how the motions produced by the active surface vary in the spanwise direction. The phase axis has once again been flipped to show the motions as if they were advecting from left to right, and the dotted lines represent the inner diameter of the active surface (see figure 1) to show the region that experiences the maximum surface deformation. The regions of maximum fluctuation and the interfaces between high- and low-speed motions along $z=0$ in figure 6 occur at the same phase when compared with figure 5(a–d), confirming that the phase averages computed from FOV1 and FOV3 are in good agreement with one another. All four phase averages in the $\phi$– $z$ plane show that the maximum velocity fluctuations are concentrated along $z=0$. This indicates that the active surface is producing type-1 modes for $St\leq 0.2$, which is what was observed within the LBL of Gibeau & Ghaemi (Reference Gibeau and Ghaemi2022) at the same $St$. We also see that the strongest of the streamwise velocity fluctuations are bounded by the dotted lines ( $z/D=\pm 0.25$), which makes sense because this region experiences the largest surface deformations. These dotted lines represent a width that is roughly equal to the maximum width of the VLSMs. The strongest regions of the high- and low-speed motions therefore cover widths that are similar to those of the VLSMs. Finally, we note that the patterns in the $\phi$– $z$ plane observed for $St=0.05$, 0.10 and 0.15 (figure 6a–c) are quite similar. For these three $St$, we see that the interface between the high- and low-speed motions that is closest to $\phi =0$ is curved, while the interface that is closer to $\phi ={\rm \pi}$ is relatively straight. The opposite is true for $St=0.20$ (figure 6d) as we can see that the interface closest to $\phi =0$ is straight, while the interface that is closer to $\phi ={\rm \pi}$ is curved.
Phase averages of the streamwise velocity component ( $\langle u \rangle _\phi$) in the $\phi$– $z$ plane at $x/D=0.7$ and $y/D=0.02$ computed using the data from FOV3 for (a) $St=0.05$, (b) $St=0.10$, (c) $St=0.15$ and (d) $St=0.20$. The phase axis has been flipped to display the motions as if they were moving from left to right. The dotted lines represent the inner diameter of the active surface, i.e. the region that experiences the maximum surface deformation. The uncertainty of these phase averages is estimated in the Appendix.

The above discussion has considered only the phase averages of the streamwise velocity for two reasons. First, the present investigation focuses on targeting the VLSMs which are a phenomenon characterized primarily as long, meandering regions of streamwise velocity fluctuation. It therefore makes sense to focus on producing streamwise velocity fluctuations that can be used to oppose the VLSMs. Second, we have found that  $\langle v \rangle _\phi$ is an order of magnitude weaker than $\langle u \rangle _\phi$ for all cases. This was also noted to be true in the LBL studied by Gibeau & Ghaemi (Reference Gibeau and Ghaemi2022).
3.2. Structure and strength
We now work to further our understanding of the structure and strength of the motions produced by the active surface. We begin by considering two important structural characteristics: the advection velocity  $U_c$ and streamwise wavelength $\lambda _x$, which are related through the actuation frequency as
 \begin{equation} U_c=f_{a}\lambda_x. \end{equation}
The actuation frequencies are known, and so we only need to know one of these parameters to have access to the other. Following a procedure similar to that of Hussain & Reynolds (Reference Hussain and Reynolds1970), the advection velocity of the motions produced at each actuation frequency has been estimated as
 \begin{equation} U_c = \omega_{a}\frac{{\Delta}x}{{\Delta}\phi}, \end{equation}
where  $\omega _{a}=2{\rm \pi} {f_{a}}$ is the angular actuation frequency, while $\Delta {x}$ and $\Delta {\phi }$ are the streamwise distance and phase shift, respectively, between $x/D=0.7$ and 1.4. We have estimated $\Delta {\phi }$ by cross-correlating $\langle u \rangle _\phi$ obtained at $x/D=0.7$ and 1.4. These cross-correlations were computed using only the portion of the phase averages up to $y/D=0.08$ to isolate the region that contains the dominant structures produced by the active surface (Gibeau & Ghaemi (Reference Gibeau and Ghaemi2022) considered up to $y/D=0.10$). Note that such cross-correlations are unable to identify whether there are multiple wavelengths between $x/D=0.7$ and 1.4. However, adding $2{\rm \pi}$ to the denominator of (3.2) produces values of $U_c$ that are roughly one order of magnitude smaller than the local mean velocity. It therefore seems unlikely that there are multiple wavelengths present between $x/D=0.7$ and 1.4.
The advection velocities estimated in the present work are plotted in figure 7(a). The results from the LBL of Gibeau & Ghaemi (Reference Gibeau and Ghaemi2022) at varying actuation amplitudes are also shown, revealing that their advection velocities follow a single curve with the exception of a few points at  $St=0.4$ and 0.5 which seem to be affected by the emergence of the type-2 modes. This collapse of the data is observed despite the fourfold increase in actuation amplitude considered in their study. Figure 7(a) indicates that the motions produced by the active surface in the present TBL advect at velocities of approximately $U_c/U_\infty =0.5$ to 0.6, which is slightly slower than the mean velocity of $0.64U_\infty$ across the portion of the TBL that was cross-correlated to obtain $\Delta {\phi }$. These velocities are higher than those found in the LBL ( $U_c/U_\infty =0.2$ to 0.3 at the same $St$) but are not as high as those associated with the VLSMs, which are estimated to advect at velocities closer to 0.8 $U_\infty$ in the present TBL (Gibeau & Ghaemi Reference Gibeau and Ghaemi2021). Note that this faster advection could be due to the VLSMs extending farther from the wall where they experience a higher mean velocity.
Advection velocities ( $U_c$) of the motions produced by the active surface normalized by (a) the free stream velocity and (b) the free stream velocity and shape factor. Comparison is made between the motions produced in the present TBL and those produced in the LBL of Gibeau & Ghaemi (Reference Gibeau and Ghaemi2022).

It is reasonable to assume that the free stream velocity is an important parameter for determining the advection velocity because the free stream velocity is the primary source of momentum. Similarly, the shape of the mean velocity profile should be an important contributor to the advection velocity as there is far more momentum close to the wall in the present TBL compared with its laminar counterpart. Indeed, normalization with  $U_\infty$ alone does not collapse the present results with those of Gibeau & Ghaemi (Reference Gibeau and Ghaemi2022), as is clearly shown in figure 7(a). We therefore consider the shape factor $H=\delta ^*/\theta$, which is a measure of this near-wall momentum. The advection velocities normalized by both $H$ and $U_\infty$ are shown in figure 7(b). It is evident in the figure that the present results and those of Gibeau & Ghaemi (Reference Gibeau and Ghaemi2022) collapse on the same power-law curve under this normalization, confirming that the shape of the boundary layer profile is part of what determines the advection velocity of the motions produced by the active surface. Note that the shape factor was extracted at $x/D=0$ when considering the LBL data of Gibeau & Ghaemi (Reference Gibeau and Ghaemi2022).
The wavelengths of the motions produced by the active surface have been computed using (3.1) and are shown normalized by the actuator diameter in figure 8(a) along with the results of Gibeau & Ghaemi (Reference Gibeau and Ghaemi2022). These wavelengths aid in determining how long the motions would be if they persisted downstream. Figure 8(a) shows a significant increase in the wavelength of the motions produced in the present TBL as  $St$ is reduced. More specifically, we see $\lambda _x/D$ increase from roughly 3 to 12 as $St$ is reduced from 0.2 to 0.05. The VLSMs are considered to be motions, either high- or low-speed, that are $3\delta$ or more in length (Balakumar & Adrian Reference Balakumar and Adrian2007). Since the active surface produces high- and low-speed motions in series, the smallest wavelength that occurs at the scale of the VLSMs is $6\delta$. This cutoff is highlighted in figure 8(a), revealing that the active surface only produces motions at the scale of the VLSMs at the lowest actuation frequency of $St=0.05$ in the present TBL, although the wavelength produced at $St=0.10$ is nearly at the cutoff.
Wavelengths ( $\lambda _x$) of the motions produced by the active surface normalized by (a) the actuator diameter and (b) the actuator diameter and shape factor. Comparison is made between the motions produced in the present TBL and those produced in the LBL of Gibeau & Ghaemi (Reference Gibeau and Ghaemi2022).

Figure 8(a) shows that the wavelengths produced in the LBL of Gibeau & Ghaemi (Reference Gibeau and Ghaemi2022) are shorter than those produced here for a given  $St$. This is a result of the different advection velocities shown in figure 7(a), which were shown to agree once the shape factor of the boundary layer profile was employed in the normalization of figure 7(b). It then follows that the shape factor should also be used in the normalization of wavelength. Indeed, figure 8(b) shows that the wavelengths normalized using both $D$ and $H$ collapse along a single power-law curve. Together, figures 7(b) and 8(b) indicate that the advection velocity and wavelength of the motions produced by the active surface are functions of $U_\infty$, $f_{a}$, $D$ and $H$.
$H$.
We now consider the strength of the high- and low-speed motions which we define as  $S_+=\max (\langle u \rangle _\phi )$ and $S_-=-\min (\langle u \rangle _\phi )$, respectively, along $z=0$. We only have access to the strength values at two streamwise locations, and so we cannot fully characterize the decay in strength as a function of streamwise distance. We have therefore modelled the spatial decay as exponential following Hussain & Reynolds (Reference Hussain and Reynolds1970), who also considered the periodic forcing of a turbulent wall-bounded flow. The resulting curves have been extrapolated over $0.5\leq {x/D}\leq 3.0$ and are plotted in figure 9(a,b) along with the values extracted from the phase averages.
Strength of the (a) high- and (b) low-speed motions produced by the active surface as a function of streamwise distance. The markers represent the values extracted from  $\langle u \rangle _\phi$. The solid lines represent a fit to the extracted data assuming exponential spatial decay. (c) The peak strength of the motions produced by the active surface compared with the LBL results of Gibeau & Ghaemi (Reference Gibeau and Ghaemi2022).

The extrapolated exponential fits allow us to estimate the peak strength of the motions at the edge of the active surface ( $x/D=0.5$), which can easily be read using the dashed lines in figure 9(a,b). The uncertainty associated with the peak strength values is roughly 0.007 $U_\infty$; this value was obtained by considering the maximum variation of the exponential fits at $x/D=0.5$ when accounting for the uncertainty values estimated in the Appendix. We estimate that the high-speed motions (figure 9a) produced at $St=0.05$, 0.10 and 0.15 reach a peak strength of roughly $0.07U_\infty$, while the high-speed motion produced at $St=0.20$ only reaches $0.05U_\infty$. However, the high-speed motion produced at $St=0.20$ appears to decay more slowly, resulting in a higher strength than the other three actuation frequencies for $x/D>1$. Despite this, it seems that the strength of all high-speed motions decays to less than 1 % of $U_\infty$ before reaching $x/D=2$. The peak strengths of the low-speed motions (figure 9b) are estimated to be larger than those of the high-speed motions, reaching $0.08U_\infty$ for $St=0.05$ and 0.10, $0.075U_\infty$ for $St=0.15$, and $0.07U_\infty$ for $St=0.20$. Despite the stronger motions, we still estimate a reduction to less than 1 % of $U_\infty$ before reaching $x/D=2$. Moreover, just like the high-speed motions, the low-speed motion produced at $St=0.20$ appears to decay more slowly than those produced at the other three actuation frequencies.
The motions produced by active surface deformations in the present TBL are much weaker in terms of  $U_\infty$ and decay more quickly with downstream distance when compared with the LBL results of Gibeau & Ghaemi (Reference Gibeau and Ghaemi2022) at the same $St$. Gibeau & Ghaemi (Reference Gibeau and Ghaemi2022) found that the strength of the motions produced by the active surface depends primarily on the amplitude of the surface deformation. The amplitude considered here is larger than all amplitudes considered in their investigation, but their LBL is quite different than the present TBL in terms of thickness, velocity gradients, etc. We have therefore formulated a new normalization for the strength values by considering that they depend on both the active surface and the boundary layer. We assume that the parameters relevant to the operation of the active surface are $D$,
$D$,  $f_{a}$ and $A$, while the parameters relevant to the boundary layer are $U_\infty$, $H$ and $\nu$. The inclusion of the shape factor, despite it being dimensionless, was inspired by the normalization of the advection velocity and wavelength used in figures 7 and 8. Various combinations of these parameters were considered and tested in a trial-and-error manner. Only one normalization was found to collapse the data onto a single curve. The resulting normalization is presented in figure 9(c) along with the results from Gibeau & Ghaemi (Reference Gibeau and Ghaemi2022) for $St\leq 0.2$, where $S_{max}$ is the estimated peak strength produced by the active surface ( $=\max (|\langle u \rangle _\phi |)$ at $x/D = 0.5$). It is clear in the figure that the peak strength values collapse along the same power-law curve over this low- $St$ range. This suggests that the strength of the motions produced by the active surface at $St\leq 0.2$ depends on far more parameters in comparison to the advection velocity and wavelength.
3.3. Visualization of the induced motions
The phase averages used throughout the previous sections capture the motions produced by the active surface in the wall-normal, spanwise and phase dimensions. However, it is difficult to know what the motions produced by the active surface look like in three-dimensional space when only considering the raw phase averages because the phase axis represents a different time scale at each actuation frequency. We have therefore constructed a model for visualizing what the average motions are likely to look like in three dimensions. The model employs Taylor's hypothesis to extend the phase averages  $\langle u \rangle _\phi =f(\phi,y,z)$ in the streamwise direction. The exponential curves of figure 9(b) are then applied to account for the spatial decay in strength. These strength curves have been applied as shown in figure 9(b) including the constant portion marked by the dashed lines. That is, the exponential was applied for $x/D>0.5$ such that the magnitude of the phase averages at the measurement location is unchanged while a constant multiplier was used for the region $x/D\leq 0.5$. The model $\langle u \rangle ^{m}_\phi$ was formed using the phase averages measured at $x/D=0.7$ (FOV1 and FOV3) and is expressed for $x/D\geq 0$ as
 \begin{equation} \langle u \rangle^{m}_\phi(\phi,x,y,z) = \begin{cases} e^{b(0.5D-x_1)}\langle u \rangle_\phi(\phi',y,z), & 0\leq{x/D}\leq0.5, \\ e^{b(x-x_1)}\langle u \rangle_\phi(\phi',y,z), & 0.5< x/D, \\ \end{cases} \end{equation}
 \begin{equation} \phi'(\phi,x)=\phi+\frac{\omega_{a}}{U_c}(x_1-x), \end{equation}
where  $b<0$ captures the exponential decay according to the curves of figure 9(b), $x_1$ is the measurement location, and $\phi '$ is the phase modified to account for both $\phi$ and $x$ in the application of Taylor's hypothesis. Equation (3.3) perfectly represents the phase-averaged motions at the measurement location $x_1$ but loses accuracy as we move farther from this streamwise location. Nevertheless, it provides an estimate of what the motions produced by the active surface look like in the three spatial dimensions of the present TBL.
The models for all  $St$ are shown in the streamwise–wall-normal plane at $z=0$ in figure 10, where the dashed lines mark the measurement location of the phase averages (FOV1). The phase of the active surface in the figure is $\phi =4{\rm \pi} /5$, which corresponds to the surface having a downward velocity just after having reached its peak deformation. This phase was selected to highlight the low-speed motions formed by an upward motion of the active surface. Increasing the phase by ${\rm \pi}$ shows very similar high-speed motions formed by a downward motion of the surface. The model for $St=0.05$ in figure 10(a) shows the long wavelength associated with the lowest actuation frequency as the low-speed motion can be seen to extend to the end of the displayed field of view. The shrinking of these wavelengths with increasing actuation frequency is clear throughout figure 10(b–d), with the latter even showing the adjacent high-speed motion downstream. It is interesting to note that the low-speed motions appear quite similar for all $St$ considered within the region $x/D\leq 1.0$.
The model  $\langle u \rangle ^{m}_\phi$ shown at $z=0$ and $\phi =4{\rm \pi} /5$ for actuation frequencies of (a) $St=0.05$, (b) $St=0.10$, (c) $St=0.15$ and (d) $St=0.20$. The dashed lines show the measurement location used to form the models (FOV1). The position of the active surface is displayed accurately.

Figure 11 shows the models for all  $St$ in the streamwise–spanwise plane at $y/D=0.02$ and $\phi =4{\rm \pi} /5$, which is the same phase shown in figure 10. Once again, the dashed lines mark the measurement location of the phase averages (FOV3). Just as before, the large change in wavelength with $St$ is clear. However, in contrast to the streamwise–wall-normal plane, visualizing the motions in the streamwise–spanwise plane highlights the spanwise extent of the region that is most affected by the active surface. More specifically, we see a semi-elliptical region roughly occupying $0.5\leq {x/D}\leq 1.0$ and $-0.25\leq {z/D}\leq 0.25$, where the motions produced by the active surface are strongest. This region is slightly shorter for $St=0.2$ (figure 11d), but is approximately invariant for $St\leq 0.15$ (figure 11a–c). These results indicate that the active surface can produce high- and low-speed motions within this region over the range of frequencies associated with the VLSMs.
The model  $\langle u \rangle ^{m}_\phi$ shown at $y/D=0.02$ and $\phi =4{\rm \pi} /5$ for actuation frequencies of (a) $St=0.05$, (b) $St=0.10$, (c) $St=0.15$ and (d) $St=0.20$. The dashed lines show the measurement location used to form the models (FOV3).

4. Manipulation of turbulence
The previous section focused on characterizing the periodic motions produced by the active surface. We will now investigate how these motions affect the mean flow and the surrounding turbulence. The latter will be accomplished by considering the Reynolds stresses using the quantity  $u'_i=u_i-\langle u_i \rangle _\phi$ introduced in § 2.5.
4.1. Mean velocity and Reynolds stresses
The mean velocity profiles at  $x/D=0.7$ and 1.4 for all $St$ are shown in figure 12(a,b). The profiles for the actuated cases at $x/D=0.7$ (figure 12a) show almost no difference compared to the base flow. The only exception is closer to the wall ( $y/\lambda \lesssim 200$), where a slight deficit of the order of 2 % is observed for all actuated cases (the uncertainty of this mean is estimated to be 0.2 %; see the Appendix). This appears to be because the low-speed motions produced by the active surface are stronger than the high-speed motions (see figure 9) and so the average effect is a slight deficit. Indeed, the phase averages of figure 5 show that the strongest motions occupy the same wall-normal extent as the affected region of the mean profiles. Conversely, we see no differences between the actuated cases and base flow at $x/D=1.4$ (figure 12b). This is likely because of the large decay in the strength of the high- and low-speed motions by this downstream location. Overall, it appears that sinusoidal operation of the active surface does not significantly affect the mean velocity profile in the present TBL. This is in contrast to oscillatory actuation with dynamic roughness (Jacobi & McKeon Reference Jacobi and McKeon2011; Gildersleeve, Tuna & Amitay Reference Gildersleeve, Tuna and Amitay2017) and piezoelectric cantilevers (Jeon & Blackwelder Reference Jeon and Blackwelder2000; Bai et al. Reference Bai, Zhou, Zhang, Xu, Wang and Antonia2014; Tang et al. Reference Tang, Jiang, Zheng and Wu2019) which produce stronger effects on the mean flow.
Mean velocity profiles and Reynolds stresses computed using both  $u_i$ and $u'_i$ at all $St$ compared to the base flow at (a,c) $x/D=0.7$ and (b,d) $x/D=1.4$. The overlaid logarithmic law in panel (a,b) is the same as in figure 3(a). The uncertainties of these quantities are estimated in the Appendix.

The Reynolds stresses computed using both  $u_i$ and $u'_i$ at $x/D=0.7$ and 1.4 for all $St$ are presented in figure 12(c,d). At $x/D=0.7$ (figure 12c), there is a roughly 15 % increase in $\langle u^2 \rangle$ over $y/\lambda \lesssim 200$, which is the same region where differences in the mean profiles are visible (figure 12a); this increase is several times larger than the uncertainty associated with these quantities (2.4 % to 3.4 %, see the Appendix). No differences are observed in $\langle v^2 \rangle$, confirming that the wall-normal velocity fluctuations produced by the active surface are negligible. There are also no differences in $\langle uv \rangle$ despite the clear increase in streamwise velocity fluctuations associated with the active surface deformations. When considering $\langle u'_iu'_j \rangle$, which capture the structure of the turbulence less the average actuated motions, it is clear that all three components show no clear differences when compared to the base flow (note that the uncertainties of these quantities are of the order of a few percent; see the Appendix). Similarly, at $x/D=1.4$ (figure 12d), both $\langle u_iu_j \rangle$ and $\langle u'_iu'_j \rangle$ show no differences to the base flow. The lack of a change in $\langle u^2 \rangle$ at $x/D=1.4$ is again likely a result of the decay in strength of the motions produced by the active surface.
In total, it appears that  $\langle u'_iu'_j \rangle$ are unaffected by the active surface. However, we will show in the next section that this is only true on average, as there is actually a strong phase-dependent modulation of the turbulence statistics resulting from the motions produced by the active surface.
4.2. Phase-averaged Reynolds stresses
Computing  $\langle u'_iu'_j \rangle$ using actuation phase bins reveals a phase-dependent modulation of the turbulence statistics. This modulation has therefore been investigated using phase averaging applied in the same way as for $\langle u_i \rangle _\phi$ (see § 2.5). We define the phase-averaged Reynolds stresses as $\langle u'_iu'_j \rangle _\phi$ (uncertainties estimated in the Appendix) and we facilitate their visualization using the difference
 \begin{equation} \Delta\langle u'_iu'_j \rangle_\phi = \langle u'_iu'_j \rangle_\phi - \langle u'_iu'_j \rangle, \end{equation}
which shows the extent to which the Reynolds stresses are amplified or suppressed as a function of  $\phi$. More precisely, (4.1) is the difference between the phase-averaged and time-averaged Reynolds stress curves, and it represents the change in the Reynolds stresses as a function of phase with respect to the time-averaged Reynolds stresses. The resulting $\Delta \langle u'_iu'_j \rangle _\phi$ computed in the $\phi$– $y$ plane using the data from FOV1 and FOV2 are shown in figures 13–15. The left (panels a–d) and right (panels e–h) columns in each figure show the results at $x/D=0.7$ and 1.4, respectively. The solid and dashed outlines show the locations of the high- and low-speed motions, respectively, from figure 5. The phase axis has been flipped to display the motions as if they were moving from left to right.
Modulation of the phase-averaged streamwise Reynolds stress ( $\Delta \langle u'^2 \rangle _\phi$) in the $\phi$– $y$ plane for all actuation frequencies computed using (a–d) the data from FOV1 at $x/D=0.7$ and (e–h) the data from FOV2 at $x/D=1.4$. The solid and dashed outlines show the high- and low-speed motions, respectively, from figure 5. The phase axis has been flipped to display the motions as if they were moving from left to right. (a,e) $St = 0.05$, (b,f) $St = 0.10$, (c,g) $St = 0.15$, (d,h) $St = 0.20$.

Modulation of the phase-averaged wall-normal Reynolds stress ( $\Delta \langle v'^2 \rangle _\phi$) in the $\phi$– $y$ plane for all actuation frequencies computed using (a–d) the data from FOV1 at $x/D=0.7$ and (e–h) the data from FOV2 at $x/D=1.4$. The solid and dashed outlines show the high- and low-speed motions, respectively, from figure 5. The phase axis has been flipped to display the motions as if they were moving from left to right. (a,e) $St = 0.05$, (b,f) $St = 0.10$, (c,g) $St = 0.15$, (d,h) $St = 0.20$.

Modulation of the phase-averaged Reynolds shear stress ( $-\Delta \langle u'v' \rangle _\phi$) in the $\phi$– $y$ plane for all actuation frequencies computed using (a–d) the data from FOV1 at $x/D=0.7$ and (e–h) the data from FOV2 at $x/D=1.4$. The solid and dashed outlines show the high- and low-speed motions, respectively, from figure 5. The phase axis has been flipped to display the motions as if they were moving from left to right. (a,e) $St = 0.05$, (b,f) $St = 0.10$, (c,g) $St = 0.15$, (d,h) $St = 0.20$.

The streamwise component  $\Delta \langle u'^2 \rangle _\phi$ is shown in figure 13. A strong modulation pattern that is associated with the high- and low-speed motions is visible at $x/D=0.7$ (figure 13a–d). The high-speed motions (solid outlines) produce an amplification of $\langle u'^2 \rangle$ near the wall and a suppression away from the wall. The opposite modulation pattern is visible for the low-speed motions (dashed outlines), which suppress $\langle u'^2 \rangle$ near the wall and produce amplification away from the wall. These amplitude modulation patterns appear similar to those that are imparted on the small-scale turbulence by the VLSMs (Mathis et al. Reference Mathis, Hutchins and Marusic2009; Ganapathisubramani et al. Reference Ganapathisubramani, Hutchins, Monty, Chung and Marusic2012). For $St=0.05$, the modulated regions are roughly centred with respect to the high- and low-speed motions, and are relatively flat. As $St$ is increased, the modulated regions that are farthest from the wall become more inclined and shift upstream with respect to the associated coherent motions. Similar behaviour is visible at $x/D=1.4$ (figure 13e–h), but the regions of modulation are weaker, more diffuse and more inclined. This is likely because the associated high- and low-speed motions are also weaker, more diffuse and more inclined at $x/D=1.4$ (figure 5).
The modulation of the streamwise Reynolds stress visible in figure 13 is quite strong. It also does not change much as a function of  $St$. The following values are therefore reported as averages over the four $St$ considered. The region of amplification associated with the high-speed motions at $x/D=0.7$ produces $\langle u'^2 \rangle _\phi$ values that are up to 11 % larger than the local $\langle u'^2 \rangle$. Similarly, the region of suppression associated with the high-speed motions produces values that are up to 14 % smaller than the local $\langle u'^2 \rangle$. The amplification caused by the low-speed motions is even stronger, producing values that are up to 22 % larger than the local $\langle u'^2 \rangle$. The suppression caused by the low-speed motions is similar to that produced by the high-speed motions, resulting in values that are up to 15 % smaller than the local $\langle u'^2 \rangle$. These extrema are 2 to 3 times weaker and are located farther from the wall at $x/D=1.4$.
The wall-normal component  $\Delta \langle v'^2 \rangle _\phi$ is shown in figure 14. A strong modulation pattern associated with the high- and low-speed motions at $x/D=0.7$ (figure 14a–d) is again visible. The high-speed motions (solid outlines) produce a suppression of $\langle v'^2 \rangle$ across the entire length of the coherent motion and a weaker amplification above the motion ( $y/\lambda \gtrsim 120$). This weaker region of modulation shifts upstream with respect to the associated coherent motion as $St$ is increased. A similar but opposite pattern is visible for the low-speed motions (dashed outlines), which amplify $\langle v'^2 \rangle$ within the coherent motion and cause a weaker suppression above it. Both the high- and low-speed motions appear to produce some weaker modulation very close to the wall opposite in sign to that of the region above for $St=0.20$; this is not visible for $St=0.05$ to 0.15, again showing that the motions produced at the frequencies of the LSMs are a bit different than those produced at the frequencies of the VLSMs. The same patterns are visible at $x/D=1.4$ (figure 14e–h), but are again weaker and more diffuse in comparison to those at $x/D=0.7$.
The percent modulation of the wall-normal Reynolds stress at  $x/D=0.7$ is even stronger than what was observed for the streamwise component. The region of suppression associated with the high-speed motions produces $\langle v'^2 \rangle _\phi$ values that are up to 25 % smaller than the local $\langle v'^2 \rangle$, while the region of amplification associated with the low-speed motions produces values that are up to 39 % larger than the local $\langle v'^2 \rangle$. These values are again averages over all four $St$. At $x/D=1.4$, the amplification is roughly 5 times weaker with respect to what was observed at $x/D=0.7$. Similarly, the suppression is nearly 4 times weaker. The modulation of $\langle v'^2 \rangle$ therefore shows a sharper decay between $x/D=0.7$ and 1.4 when compared with the modulation of $\langle u'^2 \rangle$.
Finally, the shear component  $-\Delta \langle u'v' \rangle _\phi$ is shown in figure 15, where the negative sign has been added to have positive and negative values correspond to amplification and suppression of the Reynolds shear stress, respectively. This also allows for interpreting these results in terms of the phase-averaged turbulence production $-\langle u'v' \rangle _\phi \partial \langle U \rangle /\partial {y}$. Since $\langle U \rangle$ and $\langle u'v' \rangle$ are practically the same between the base and actuated flows (figure 12), the modulation captured by $-\Delta \langle u'v' \rangle _\phi$ can be thought of as the modulation of turbulence production with respect to that of the base flow.
The modulation pattern of  $-\Delta \langle u'v' \rangle _\phi$ at $x/D=0.7$ (figure 15a–d) looks similar to that of $\Delta \langle v'^2 \rangle _\phi$ at the same streamwise location. The whole area of each high-speed motion (solid outlines) experiences a suppression, resulting in $-\langle u'v' \rangle _\phi$ values that are up to 30 % smaller than the local $-\langle u'v' \rangle$. Similarly, the whole area of each low-speed motion (dashed outlines) experiences an amplification, resulting in values that are up to 43 % larger than the local $-\langle u'v' \rangle$. These extrema occur around $y/\lambda \approx 35$ to 60 for both suppression and amplification. At $x/D=1.4$ (figure 15e–h), the maximum amplification and suppression are 11 % and 9 % of the local $-\langle u'v' \rangle$, respectively, and occur around $y/\lambda \approx 150$ to 190. These modulations of $-\langle u'v' \rangle$ are quite strong, especially when we consider that the motions at $x/D=0.7$ and 1.4 have peak strengths of approximately 5 % and 1 % of $U_\infty$, respectively (figure 9a,b).
5. Further discussion
5.1. Potential for flow control
The primary objective of the present investigation was to determine whether active surface deformations are a feasible actuation strategy for targeting VLSMs. This targeting could potentially be implemented by producing motions with the same characteristics as the VLSMs with the goal of achieving a cancellation effect via a control scheme. Sections 3 and 4 revealed that the motions produced by the active surface do in fact have characteristics that align with those of the naturally occurring VLSMs within the present TBL.
First, the high- and low-speed motions produced by the active surface are truly high and low speed with respect to the base flow. That is, the active surface does not simply impose a velocity deficit and then produce oscillations between the deficit state and base state; this is clear when viewing the mean velocity profiles in figure 12(a,b). The ability to produce motions that are both high and low speed with respect to the base flow is due to the formation mechanism of these motions, which appears to be the movement of existing streamwise momentum, or lack thereof, in the wall-normal direction. Second, these motions can be produced within the frequency range of the present VLSMs, and with widths and lengths that match those of the VLSMs. However, the motions are concentrated within  $y/\delta \lesssim 0.1$, while the VLSMs can exist up to roughly $y/\delta =0.5$ (Dennis & Nickels Reference Dennis and Nickels2011). They are therefore similar in structure to flattened VLSMs. Finally, the modulation of the streamwise Reynolds stress produced by the high- and low-speed motions matches the amplitude modulation produced by VLSMs (Mathis et al. Reference Mathis, Hutchins and Marusic2009; Ganapathisubramani et al. Reference Ganapathisubramani, Hutchins, Monty, Chung and Marusic2012). More specifically, the high-speed motions produce a turbulence amplification effect near the wall and a suppression effect away from the wall. Similarly, the low-speed motions produce a suppression of turbulent fluctuations near the wall and an amplification away from it.
Considering the above, it is reasonable to use the terminology of Jacobi & McKeon (Reference Jacobi and McKeon2017) and label the longest motions produced by the active surface in the present TBL as synthetic VLSMs. However, unlike the synthetic VLSMs of Jacobi & McKeon (Reference Jacobi and McKeon2017), the present motions decay rapidly with downstream distance and are therefore more of a local actuation. This is clear in the visualizations of figures 10 and 11, which show that the strongest fluctuations produced by the active surface exist in the region immediately downstream from the device. It follows that it may be possible to target the VLSMs locally within the region immediately downstream from the active surface by employing the device in a feedforward control scheme. The effects of suppressing the VLSMs within this region, and whether these effects persist downstream, should be the topic of future work.
Alternatively, the active surface could potentially be used for flow control by leveraging the turbulence-modulating effects displayed in figures 13–15. The strong modulation of  $-\langle u'v' \rangle$ is particularly interesting due to its link to the turbulence production term. The present results show that the high-speed motions produced by downward deformations of the active surface suppress the turbulence production in the logarithmic layer by up to 30 % of the local value in the base flow. Moreover, the motion that causes this effect is roughly $0.05U_\infty$ in strength at the streamwise location where the effect was measured. This suggests that relatively weak motions produced by active surface deformations could be used to significantly manipulate the turbulence production in TBLs. However, the same high-speed motion was also found to amplify $\langle u'^2 \rangle$ in the near-wall region, and this may cause other unwanted effects such as extreme wall-shear events. Additionally, returning the surface to zero displacement after generating a high-speed motion could produce a low-speed motion, which would amplify turbulence production in the logarithmic layer. Reducing turbulence production would therefore rely on operating the active surface in such a way as to predominantly produce high-speed motions, which may be possible with asymmetric input signals. Regardless, more work should be done to explore the turbulence-modulating effects associated with active surface deformations and their potential for turbulence control.
5.2. Scaling between different boundary layers
The same active surface employed in the LBL of Gibeau & Ghaemi (Reference Gibeau and Ghaemi2022) has been used in the present TBL, allowing for comparing how active surface deformations affect two very different boundary layers ( $Re_\theta \approx 100$ versus $Re_\theta \approx 6000$). Both sets of results for $St\leq 0.2$ show that the active surface can produce high- and low-speed motions with similar widths and heights. However, the advection velocity, wavelength and strength of the motions produced are quite different between the LBL and TBL. More specifically, active surface deformations in the LBL produce motions that are shorter in the streamwise direction, advect slower and are stronger relative to $U_\infty$ when compared with the motions produced in the present TBL. This indicates that the boundary layer properties are important for determining the nature of the motions that can be produced using active surface deformations. It is therefore important to determine how the various characteristics of the actuated motions depend on the boundary layer properties so that active surfaces can be designed for a given flow control application.
In § 3, we explored normalizations for the advection velocity, wavelength and strength of the motions produced by the active surface. It was shown that the advection velocity in the LBL and TBL collapse along a power-law curve when the free stream velocity and shape factor are used in the normalization. The free stream velocity is the primary source of momentum, and the shape factor is inversely proportional to the amount of momentum near the wall. It therefore makes sense intuitively that these parameters would dictate the advection velocity of motions produced at the wall. By extension, the wavelengths measured in the LBL and TBL were also found to collapse on a single power-law curve when the shape factor was used in the normalization. Since the power-law curves are functions of  $St=f_{a}D/U_\infty$, we can see that the advection velocity and wavelength appear to depend on the boundary layer parameters $U_\infty$ and $H$, and the actuation parameters $f_{a}$ and $D$. Normalization with these parameters appears to work well when using the present data and that of Gibeau & Ghaemi (Reference Gibeau and Ghaemi2022). However, it is necessary to consider a wider variety of boundary layers and active surfaces to make a more concrete conclusion regarding how the advection velocity and wavelength of the motions produced by active surface deformations depend on the boundary layer and actuation parameters.
The use of the shape factor for normalization was extended to the strength of the motions produced by the active surface for  $St\leq 0.2$, resulting in the non-dimensional relationship
 \begin{equation} \frac{S_{max}U_{\infty}D}{Af_{a}H\nu} = c_1St^{{-}1.1}, \end{equation}
where  $c_1$ is the constant shown in figure 9(c); this constant is likely unique to the present active surface. If we divide (5.1) by $U_\infty$, employ the approximation $St^{-1.1}\approx {St}^{-1}$ and rearrange, we arrive at
 \begin{equation} \frac{S_{max}}{U_\infty} \approx \frac{c_1AH}{Re_DD}. \end{equation}
This simplified relationship indicates that the peak strength as a percentage of  $U_\infty$ and at actuation frequencies of $St\leq 0.2$ can be approximated as a function of the non-dimensional parameters $Re_D=U_\infty {D}/\nu$, $H=\delta ^*/\theta$ and $A/D$. Once again, this approximate relationship holds for the presently considered data, but should be verified in the future using a wider variety of boundary layers and active surfaces. Despite this caveat, (5.2) provides insight regarding the situations in which active surface deformations may have superior authority for flow control applications. First, $S_{max}/U_\infty$ is inversely proportional to $Re_D$. This is in direct conflict with the idea of using active surface deformations to target VLSMs, which are a high-Reynolds-number phenomenon, but supports the use of active surface deformation for flow control at lower Reynolds numbers. Second, $S_{max}/U_\infty$ is proportional to $H$. This is again in conflict with the idea of targeting VLSMs since $H$ reduces with Reynolds number. However, it suggests that stronger motions can be generated in situations with larger $H$, for example, a TBL approaching trailing-edge separation over an airfoil (Ma, Gibeau & Ghaemi Reference Ma, Gibeau and Ghaemi2020). Finally, $S_{max}/U_\infty$ is proportional to $A/D$. This particular observation clearly has limits because it implies that $A/D$ can be increased arbitrarily to obtain sufficient authority over the flow. In reality, increasing $A/D$ too much would result in cavity flows ( $h<0$) or blockages and flow separation ( $h>0$). In the present TBL, $A/D=0.027$ ( $\sim$3 % of $\delta$) has resulted in $S_{max}/U_\infty \approx 0.08$ at the $St$ necessary for targeting VLSMs. By linear extrapolation, it follows that active surface deformations at approximately 7 % of $\delta$ (or roughly 9 % of $\delta$ according to (5.2)) would produce high- and low-speed motions with $S_{max}/U_\infty \approx 0.2$ in the present TBL. This deformation amplitude is not so large as to be impractical and would likely provide sufficient authority over the flow for directly targeting the VLSMs.
6. Summary and conclusions
The present investigation considers the use of active wall-normal surface deformations for controlling a TBL at  $Re_\tau =2600$. We focus specifically on whether it is feasible to target the VLSMs locally with this actuation strategy. We employ the same ‘active surface’ from Gibeau & Ghaemi (Reference Gibeau and Ghaemi2022), which has a diameter $D$ roughly equal to the present boundary layer thickness $\delta$. We operate the device periodically at a constant amplitude of $0.03\delta$ and frequencies of $St=f_{a}D/U_\infty =0.05$ to 0.20; this range contains the frequencies associated with the naturally occurring VLSMs. The resulting motions were captured using high-speed PIV and evaluated using a triple decomposition.
Periodic operation of the active surface produces a series of high- and low-speed streamwise velocity fluctuations concentrated within  $y/\delta \lesssim 0.1$ and $-0.25\lesssim {z/\delta }\lesssim 0.25$. These motions are truly high and low speed with respect to the unactuated base flow since the mean velocity profile is essentially unchanged between the actuated and unactuated cases. The high- and low-speed motions form from downward and upward surface deformations, respectively, and so the formation mechanism appears to be the movement of streamwise momentum in the wall-normal direction. The extrema of these motions are concentrated along $z=0$, which indicates that the active surface is generating type-1 modes according to the definition introduced by Gibeau & Ghaemi (Reference Gibeau and Ghaemi2022).
The length of the motions produced by the active surface is a function of the actuation frequency. We found that  $St\lesssim 0.1$ produce motions with lengths comparable to the VLSMs in the present TBL ( $\geq 3\delta$). We also found that these motions modulate turbulence in a manner similar to that of the VLSMs. The high-speed motions were found to amplify the streamwise Reynolds stress near the wall and suppress it away from the wall, while the opposite pattern was observed for the low-speed motions. Additionally, the high-speed motions produced a suppression of the wall-normal Reynolds stress and turbulence production, while the low-speed motions amplified these quantities. Most notably, the high-speed motions with a strength of approximately $0.05U_\infty$ suppress the turbulence production in the logarithmic layer by up to 30 % of the local value in the base flow.
Considering the dimensions and turbulence-modulating behaviour of the motions produced by the active surface, it is reasonable to use the terminology of Jacobi & McKeon (Reference Jacobi and McKeon2017) and label these motions as synthetic VLSMs. However, unlike those of Jacobi & McKeon (Reference Jacobi and McKeon2017), the synthetic VLSMs generated here decay in strength rapidly with downstream distance and act like a local actuation as a result. Moreover, the strength of this local actuation is largely invariant over the frequency range of the VLSMs. These actuated motions therefore appear to be well suited for targeting the VLSMs locally via feedforward control to produce a cancellation (or suppression) of the naturally occurring VLSMs. Alternatively, a flow control strategy based around the turbulence-modulating characteristics of the synthetic VLSMs could also prove effective.
Finally, we compared our results with those obtained in the LBL of Gibeau & Ghaemi (Reference Gibeau and Ghaemi2022). We find that the motions produced by the active surface in the present TBL advect faster and are weaker when compared with the motions produced in the LBL at the same  $St$ if the advection velocity and strength are normalized by $U_\infty$. Our results indicate that the shape factor of the boundary layer may be part of what dictates the observed differences in advection velocity (and by extension the wavelength). Similarly, the shape factor and Reynolds number may be part of what dictate the observed differences in strength.
Funding
We acknowledge the support of the Natural Sciences and Engineering Research Council of Canada (NSERC) (Alexander Graham Bell Canada Graduate Scholarship – Doctoral; Discovery Grant RGPIN-2020-07231 Ghaemi, Smart skin for control of wall-bounded turbulent flows).
Declaration of interests
The authors report no conflict of interest.
Appendix. Estimation of uncertainty
Here we estimate the uncertainties associated with the mean values and Reynolds stresses (variances and covariances) used throughout the paper. We consider the combined uncertainty resulting from bias uncertainty, random error and convergence uncertainty. The former two quantities propagate through the statistical quantities of interest, while the latter is estimated here using the equations documented by Sciacchitano & Wieneke (Reference Sciacchitano and Wieneke2016). The methods employed by these authors account for the fact that samples collected at high speed are not independent by including an ‘effective number of independent samples’ in the computations. Note that the error associated with subtracting a mean to produce a fluctuating quantity (e.g.  $u$) is neglected to simplify the estimations.
The random error associated with the PIV measurements has been estimated as a displacement of 0.1 pixels. Although this value may be overly simplistic (Sciacchitano Reference Sciacchitano2019), it has been borne out in many analyses dedicated to evaluating PIV uncertainty (Raffel et al. Reference Raffel, Willert, Scarano, Kähler, Wereley and Kompenhans2018). When applied to the present PIV measurements, this yields random errors of 0.08, 0.08 and 0.12 m s $^{-1}$ for FOV1, FOV2 and FOV3, respectively. Note that we assume that the random errors between different velocity components are uncorrelated moving forward.
The bias uncertainty considered here has been restricted to the calibration uncertainty because the bias associated with the particle time response and laser pulse timing are negligible at the present flow speed. The bias uncertainty associated with planar calibration has been estimated as 1 pixel across the total calibration distance (roughly 1000 pixels). In contrast, the bias uncertainty associated with stereoscopic calibration is larger due to the complexity of the calibration process. The stereoscopic measurements of FOV3 capture a spanwise–wall-normal plane, and so the associated calibration uncertainty was estimated by evaluating the change in the mean velocity profile across the span in comparison to the more reliable planar PIV measurements. Consequently, the bias uncertainties were estimated to be 0.1 %, 0.1 % and 1.8 % for FOV1, FOV2 and FOV3, respectively.
The estimated total uncertainties associated with the mean velocity and Reynolds stresses of figures 3 and 12 are shown in tables 2 and 3, respectively, as a percentage of the statistical quantity in question. Since the convergence uncertainty depends on individual statistics, the estimated total uncertainties are a function of wall-normal distance. Therefore, to arrive at the values displayed in these tables, the total uncertainty values were averaged across a wall-normal range extending from  $y/\delta = 0.02$ to 0.5 (except for FOV3 which only extends to $y/\delta \approx 0.3$). The uncertainties associated with the phase averages cannot easily be given as a percentage because there are many places where the phase average is zero and therefore the percentage would be infinite. The total uncertainty of the phase averages is therefore most easily reported as a percentage (from the bias) plus the convergence uncertainty (averaged over the FOV). The total uncertainty of the phase averages in figure 5 is estimated as $0.001\langle u \rangle _\phi +0.02$ m s $^{-1}$ and the total uncertainty of the phase averages in figure 6 is estimated as $0.018\langle u \rangle _\phi +0.02$ m s $^{-1}$. Finally, the estimated total uncertainties of the phase-averaged Reynolds stresses are given in table 4; these values were averaged across $y/\delta = 0.02$ to 0.5 and all actuation frequencies.
Estimated total uncertainties associated with the mean velocity and Reynolds stresses shown in figure 3.

Estimated total uncertainties associated with the mean velocity and Reynolds stresses shown in figure 12. These values were averaged over the four actuation frequencies considered.

Estimated total uncertainties associated with the phase-averaged Reynolds stresses used to form figures 13–15.


 Open access